1Q10 Results Presentation
13
Presentation of Results 1st Quarter of 2010 May 5, 2010
-
Upload
tegmari -
Category
Investor Relations
-
view
284 -
download
0
Transcript of 1Q10 Results Presentation
Presentation of Results
1st Quarter of 2010
May 5, 2010
Presentation of Results
1st Quarter of 2010
2

Agenda
• Recent Events
• Financial Results
3
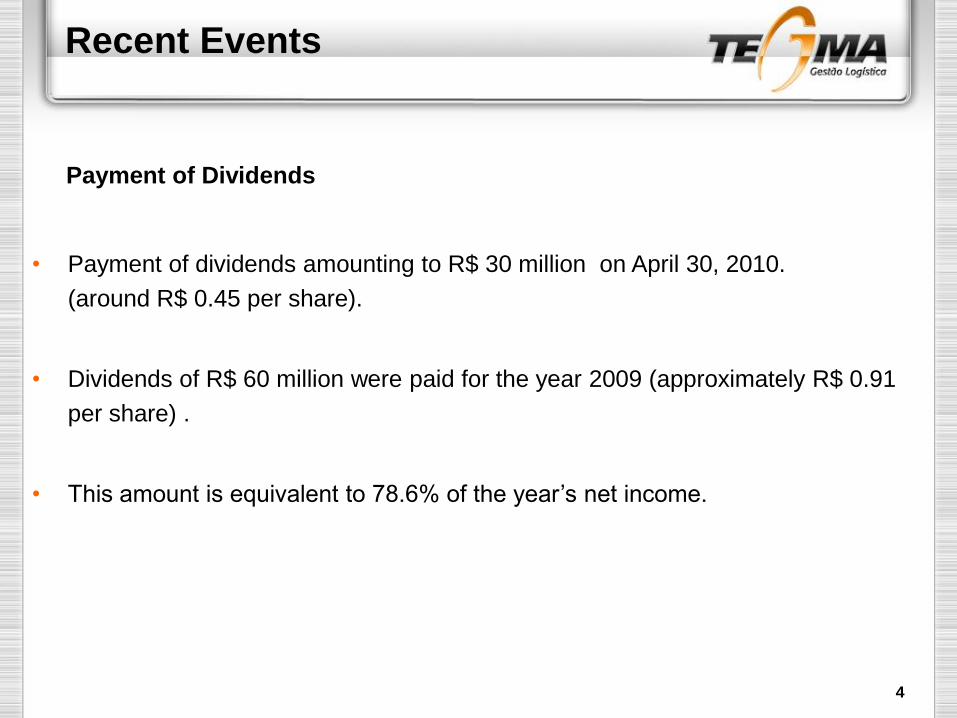
Recent Events
• Payment of dividends amounting to R$ 30 million on April 30, 2010.
(around R$ 0.45 per share).
• Dividends of R$ 60 million were paid for the year 2009 (approximately R$ 0.91
per share) .
• This amount is equivalent to 78.6% of the year’s net income.
Payment of Dividends
4

Financial Results
1. Financial statements presented according to the International
Financial Reporting Standards (IFRS);
2. Reclassification of credit from Income and Social Contribution
taxes.
Changes in accounting practices
5
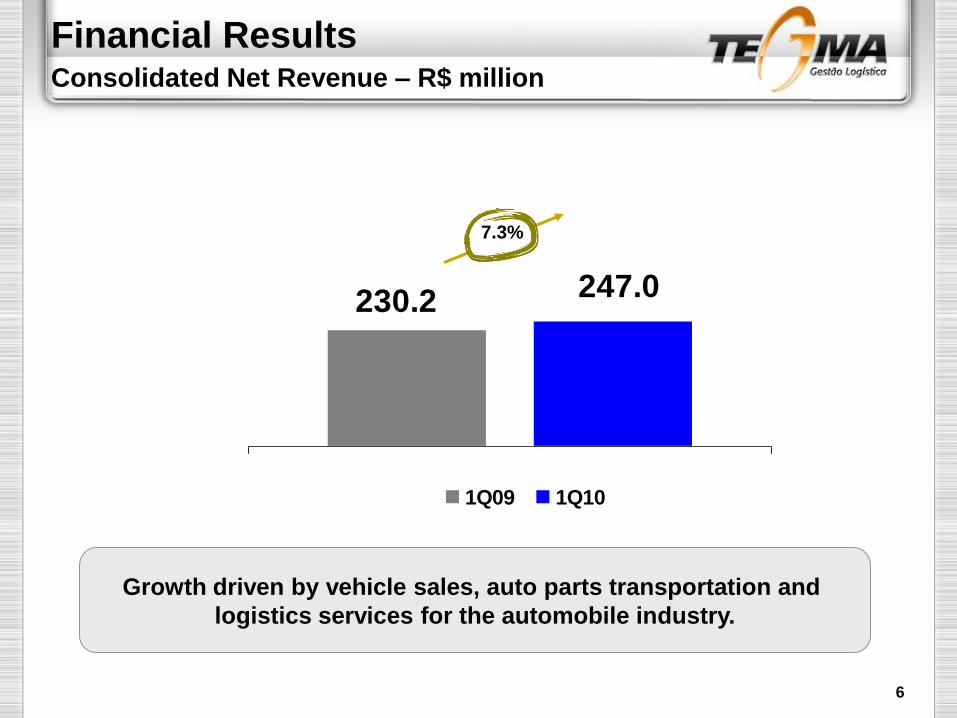
Financial ResultsConsolidated Net Revenue – R$ million
230.2 247.0
1Q09 1Q10
7.3%
Growth driven by vehicle sales, auto parts transportation and
logistics services for the automobile industry.
6
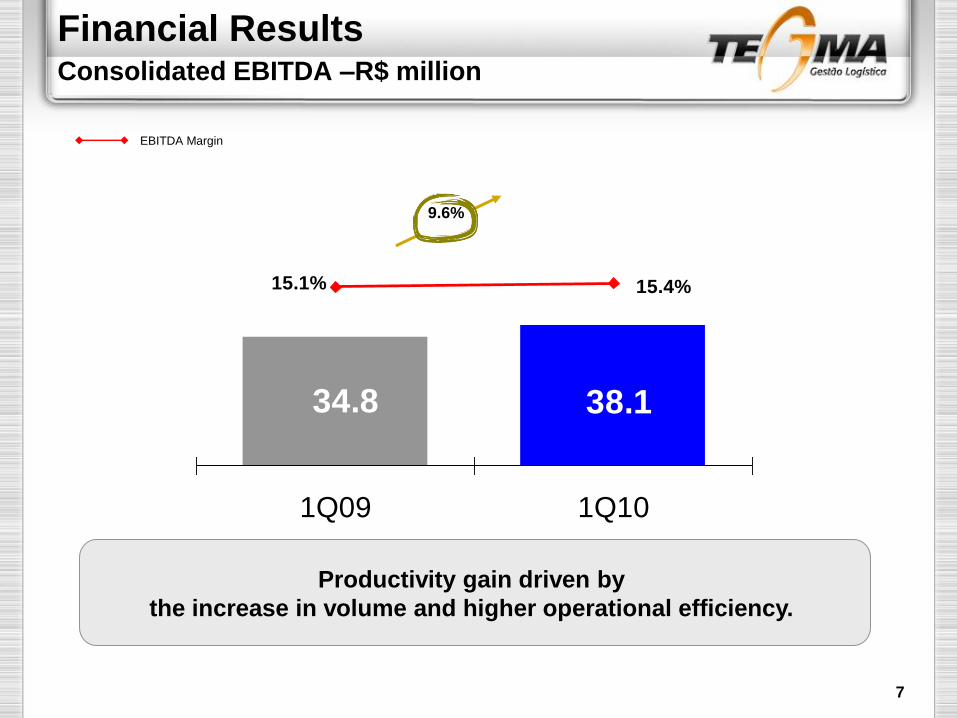
Financial ResultsConsolidated EBITDA –R$ million
EBITDA Margin
Productivity gain driven by
the increase in volume and higher operational efficiency.
9.6%
7
34.8 38.1
15.1% 15.4%
1Q09 1Q10
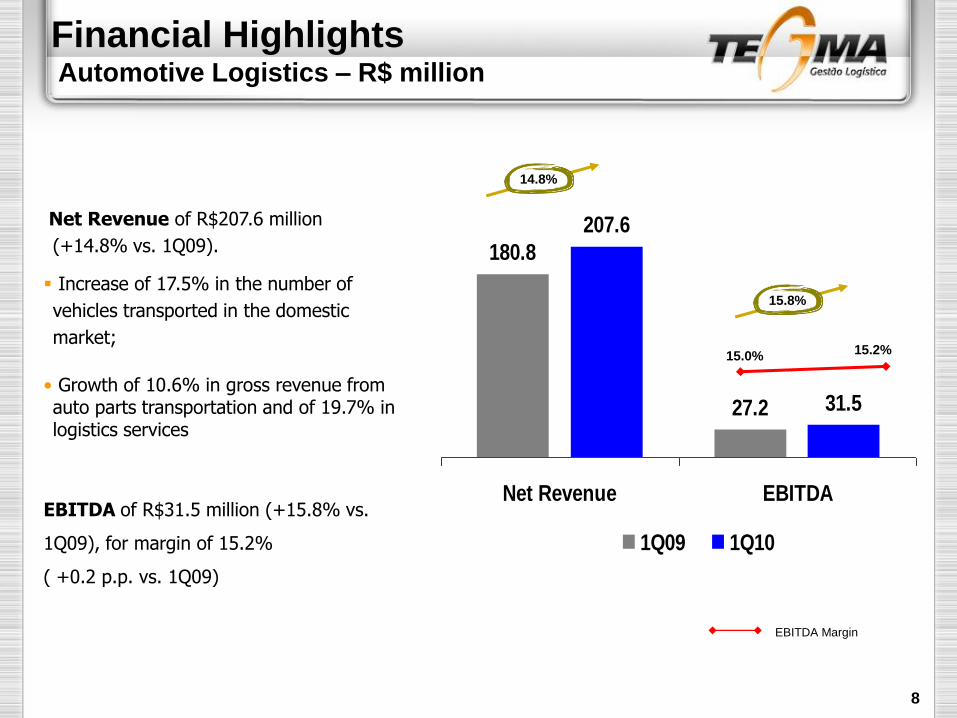
Financial Highlights Automotive Logistics – R$ million
27.2
180.8
31.5
207.6
Net Revenue EBITDA
1Q09 1Q10
Net Revenue of R$207.6 million
(+14.8% vs. 1Q09).
Increase of 17.5% in the number of
vehicles transported in the domestic
market;
• Growth of 10.6% in gross revenue from auto parts transportation and of 19.7% in logistics services
EBITDA of R$31.5 million (+15.8% vs.
1Q09), for margin of 15.2%
( +0.2 p.p. vs. 1Q09)
15.8%
8
14.8%
15.0% 15.2%
EBITDA Margin
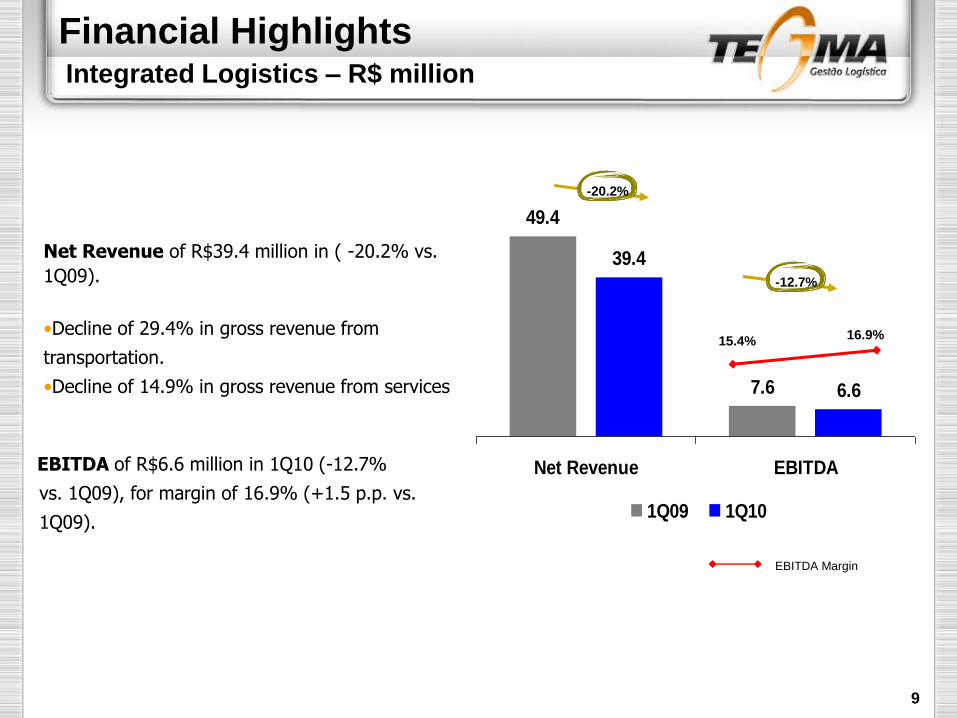
Financial HighlightsIntegrated Logistics – R$ million
Net Revenue of R$39.4 million in ( -20.2% vs.
1Q09).
•Decline of 29.4% in gross revenue from
transportation.
•Decline of 14.9% in gross revenue from services 7.6
49.4
6.6
39.4
Net Revenue EBITDA
1Q09 1Q10
-12.7%
EBITDA of R$6.6 million in 1Q10 (-12.7%
vs. 1Q09), for margin of 16.9% (+1.5 p.p. vs.
1Q09).
9
-20.2%
15.4% 16.9%
EBITDA Margin
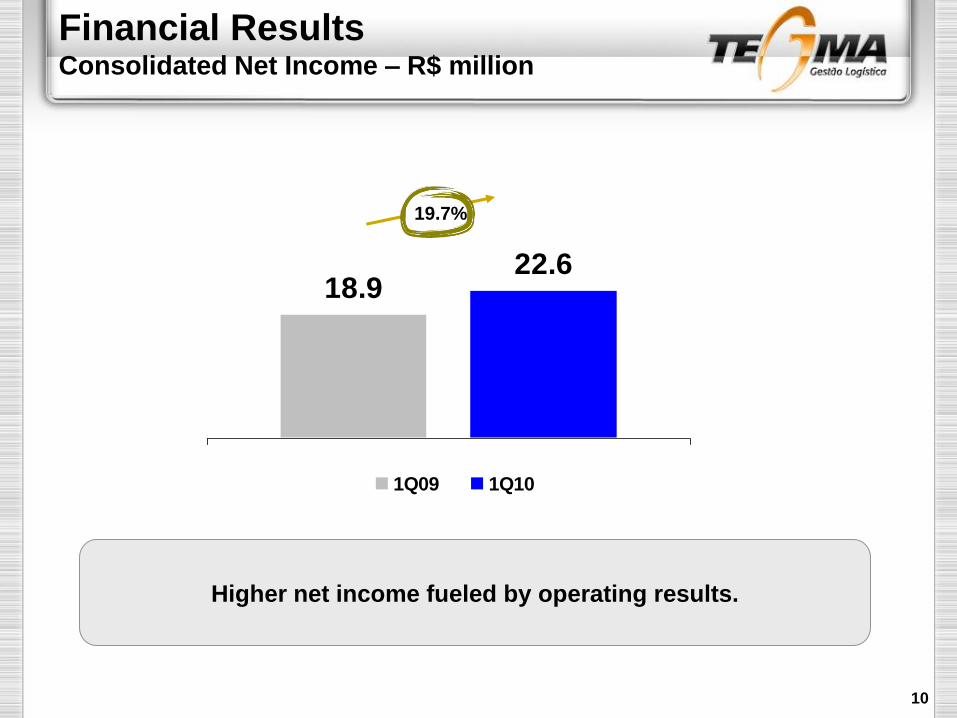
Financial ResultsConsolidated Net Income – R$ million
18.922.6
1Q09 1Q10
Higher net income fueled by operating results.
10
19.7%
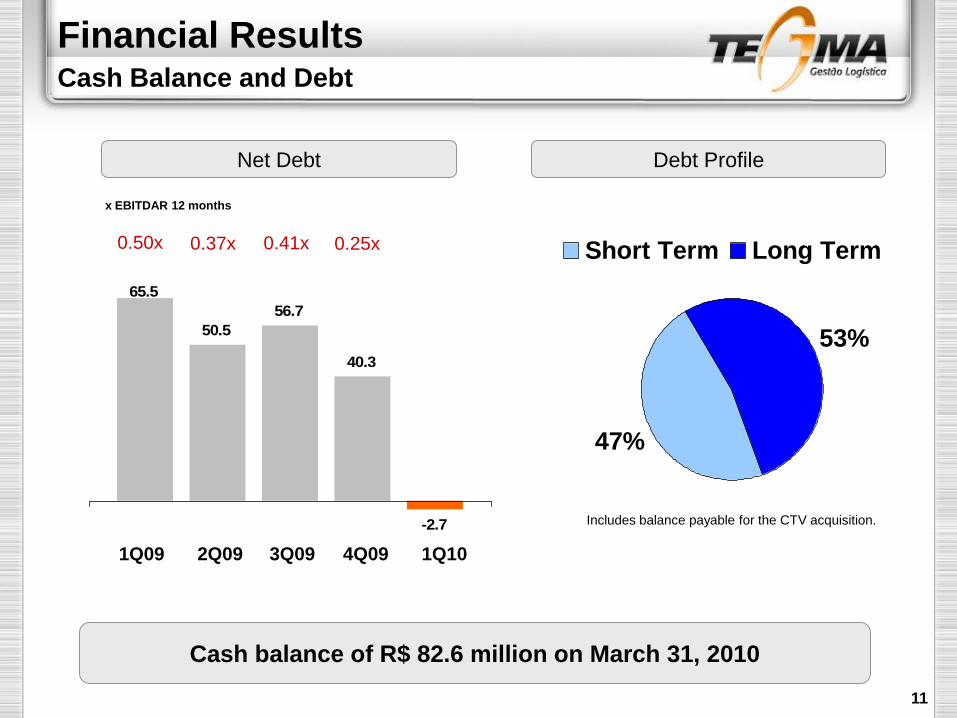
Financial ResultsCash Balance and Debt
Net Debt Debt Profile
47%
53%
Short Term Long Term
Includes balance payable for the CTV acquisition.
Cash balance of R$ 82.6 million on March 31, 2010
11
65.5
50.5
56.7
40.3
-2.7
2Q091Q09 3Q09 4Q09 1Q10
0.50x 0.37x 0.41x 0.25x
x EBITDAR 12 months
IR Contact
Alexandre Brandão
+55 (11) 4346-2532
Hugo Zierth
+55 (11) 4346-2532
12
The forward-looking statements contained in this presentation are subject to risks anduncertainties. These are based on beliefs and assumptions of our Management and informationcurrently available to the Company. Such statements include information about our currentintentions, beliefs or expectations, as well as those of our Board of Directors and Board ofExecutive Officers.
The reservations concerning forward-looking statements also apply to information aboutpossible or presumed operating results, as well as declarations preceded by, including orfollowed by such words as "believe", "may", "will", "continue", "expect", "foresee", "intend","plan", "estimate“ and other similar expressions.
Forward-looking statements do not constitute a guarantee of performance. Since they refer tothe future, they depend on circumstances that may or may not occur and are therefore subjectto risks, uncertainties and assumptions. Future results and creation of shareholder value maydiffer substantially from those expressed or suggested by the forward-looking statements. Manyfactors that may influence these results are beyond TEGMA’s control or expectations.