3D magnetic induction maps of nanoscale materials revealed ...
10
3D magnetic induction maps of nanoscale materials revealed by electron holographic tomography Daniel Wolf † , Luis A. Rodriguez ‡,§,║ , Armand Béché ⊥ , Elsa Javon⊥, Luis Serrano ‡,§,║ , Cesar Ma- gen ‡,§ , Christophe Gatel § , ║ , Axel Lubk † , Hannes Lichte † , Sara Bals ⊥ , Gustaaf Van Tendeloo ⊥ , Amalio Fernández-Pacheco ∇ , José M. De Teresa ‡,§, O , Etienne Snoeck §,║ † Triebenberg Laboratory, Institute of Structural Physics, Technische Universität Dresden, 01062 Dresden (Germa- ny) ‡ Laboratorio de Microscopías Avanzadas (LMA), Instituto de Nanociencia de Aragón (INA), Universidad de Zara- goza, 50018 Zaragoza, Spain § Transpyrenean Associated Laboratory for Electron Microscopy (TALEM), CEMES INA, CNRS-Universidad de Za- ragoza, Toulouse, France. ⊥ EMAT, University of Antwerp, Groenenborgerlaan 171, 2020 Antwerp, Belgium ║ CEMES-CNRS 29, rue Jeanne Marvig, B.P. 94347 F-31055, Toulouse Cedex, France. ∇ Thin Film Magnetism Group, Cavendish Laboratory, University of Cambridge, JJ Thomson Avenue, CB3 0HE, Cambridge UK O Instituto de Ciencia de Materiales de Aragón (ICMA), Departamento de Física de la Materia Condensada, Univer- sidad de Zaragoza-CSIC, Pedro Cerbuna 12, 50009 Zaragoza, Spain ABSTRACT: The investigation of three-dimensional (3D) ferromagnetic nanoscale materials constitutes one of the key research areas of the current magnetism roadmap, and carries great potential to impact areas such as data storage, sens- ing and biomagnetism. The properties of such nanostructures are closely connected with their 3D magnetic nanostruc- ture, making their determination highly valuable. Up to now, quantitative 3D maps providing both the internal magnetic and electric configuration of the same specimen with high spatial resolution are missing. Here, we demonstrate the quan- titative 3D reconstruction of the dominant axial component of the magnetic induction and electrostatic potential within a cobalt nanowire (NW) of 100 nm in diameter with spatial resolution below 10 nanometers by applying electron holograph- ic tomography. The tomogram was obtained using a dedicated TEM sample holder for acquisition, in combination with advanced alignment and tomographic reconstruction routines. The powerful approach presented here is widely applicable to a broad range of 3D magnetic nanostructures and may trigger the progress of novel spintronic non-planar nanodevices. INTRODUCTION: A thorough understanding of the connection between the structure and the magnetic prop- erties of nanostructures requires characterization tech- niques that permit direct measurements of magnetic ordering at the submicron scale. Therefore, together with the high control achieved for the growth of thin films during the last decades, there has been an increasing development of magnetic imaging techniques for two- dimensional ferromagnetic nanostructures. Along with the decrease of the computation time of micromagnetic simulations, these techniques have significantly contrib- uted to deeper insights into nanoscale magnetic phenom- ena, thereby boosting the development of novel techno- logical applications in the field of Nanomagnetism and Spintronics 1-5 . Recently, a new possible route has been proposed in this area, based on the use of 3D magnetic nanostructures for their exploitation in data storage and logic 1,2,5 . Moving towards spintronic architectures which go beyond a planar configuration not only requires non- standard lithography techniques, but also demands ad- vanced imaging techniques that can resolve the mag- netism of nanostructures in 3D. Among various magnetic imaging techniques, such as Kerr microscopy, spin-polarized low-energy electron microscopy (SPLEEM), X-Ray magnetic circular dichro- ism photoelectron emission microscopy (XMCD-PEEM), magnetic force microscopy (MFM) and spin-polarized scanning tunneling microscopy (SP-STM), off-axis elec- tron holography (EH) is one of the most powerful meth- ods to obtain quantitative measurements of local magnet- ization inside and around magnetic nanomaterials with nanometric resolution 6,7 . EH is a transmission electron microscopy (TEM) tech- nique that utilizes the interference of a split electron wave to measure the phase shift of one of the partial waves when interacting with an electrostatic and/or a magnetic
Transcript of 3D magnetic induction maps of nanoscale materials revealed ...
3D magnetic induction maps of nanoscale materials revealed by electron holographic tomography DanielWolf†,LuisA.Rodriguez‡,§,║,ArmandBéché⊥,ElsaJavon⊥,LuisSerrano‡,§,║,CesarMa-gen‡,§,ChristopheGatel§,║,AxelLubk†,HannesLichte†,SaraBals⊥,GustaafVanTendeloo⊥,AmalioFernández-Pacheco∇,JoséM.DeTeresa‡,§, O,EtienneSnoeck§,║
† TriebenbergLaboratory,InstituteofStructuralPhysics,TechnischeUniversitätDresden,01062Dresden(Germa-ny) ‡LaboratoriodeMicroscopíasAvanzadas(LMA),InstitutodeNanocienciadeAragón(INA),UniversidaddeZara-goza,50018Zaragoza,Spain§TranspyreneanAssociatedLaboratoryforElectronMicroscopy(TALEM),CEMESINA,CNRS-UniversidaddeZa-ragoza,Toulouse,France.⊥EMAT,UniversityofAntwerp,Groenenborgerlaan171,2020Antwerp,Belgium ║CEMES-CNRS29,rueJeanneMarvig,B.P.94347F-31055,ToulouseCedex,France. ∇ThinFilmMagnetismGroup,CavendishLaboratory,UniversityofCambridge,JJThomsonAvenue,CB30HE,CambridgeUKOInstitutodeCienciadeMaterialesdeAragón(ICMA),DepartamentodeFísicadelaMateriaCondensada,Univer-sidaddeZaragoza-CSIC,PedroCerbuna12,50009Zaragoza,Spain ABSTRACT:The investigationof three-dimensional (3D) ferromagneticnanoscalematerials constitutesoneof thekeyresearchareasofthecurrentmagnetismroadmap,andcarriesgreatpotentialtoimpactareassuchasdatastorage,sens-ingandbiomagnetism.Thepropertiesofsuchnanostructuresarecloselyconnectedwiththeir3Dmagneticnanostruc-ture,makingtheirdeterminationhighlyvaluable.Uptonow,quantitative3Dmapsprovidingboththeinternalmagneticandelectricconfigurationofthesamespecimenwithhighspatialresolutionaremissing.Here,wedemonstratethequan-titative3Dreconstructionofthedominantaxialcomponentofthemagneticinductionandelectrostaticpotentialwithinacobaltnanowire(NW)of100nmindiameterwithspatialresolutionbelow10nanometersbyapplyingelectronholograph-ictomography.ThetomogramwasobtainedusingadedicatedTEMsampleholderforacquisition,incombinationwithadvancedalignmentandtomographicreconstructionroutines.Thepowerfulapproachpresentedhereiswidelyapplicabletoabroadrangeof3Dmagneticnanostructuresandmaytriggertheprogressofnovelspintronicnon-planarnanodevices.
INTRODUCTION: A thorough understanding of theconnectionbetweenthestructureandthemagneticprop-erties of nanostructures requires characterization tech-niques that permit direct measurements of magneticorderingatthesubmicronscale.Therefore,togetherwiththe high control achieved for the growth of thin filmsduring the last decades, there has been an increasingdevelopment of magnetic imaging techniques for two-dimensional ferromagnetic nanostructures. Along withthe decrease of the computation time ofmicromagneticsimulations, these techniques have significantly contrib-utedtodeeperinsightsintonanoscalemagneticphenom-ena, thereby boosting the development of novel techno-logical applications in the field of Nanomagnetism andSpintronics1-5. Recently, a new possible route has beenproposed in this area, based on the use of 3Dmagneticnanostructures for their exploitation indata storage andlogic1,2,5. Moving towards spintronic architectures which
gobeyondaplanarconfigurationnotonly requiresnon-standard lithography techniques, but also demands ad-vanced imaging techniques that can resolve the mag-netismofnanostructuresin3D.
Among variousmagnetic imaging techniques, such asKerr microscopy, spin-polarized low-energy electronmicroscopy (SPLEEM), X-Ray magnetic circular dichro-ism photoelectron emission microscopy (XMCD-PEEM),magnetic force microscopy (MFM) and spin-polarizedscanning tunneling microscopy (SP-STM), off-axis elec-tronholography(EH) isoneof themostpowerfulmeth-odstoobtainquantitativemeasurementsoflocalmagnet-ization inside and around magnetic nanomaterials withnanometricresolution6,7.
EH is a transmissionelectronmicroscopy (TEM) tech-niquethatutilizestheinterferenceofasplitelectronwaveto measure the phase shift of one of the partial waveswheninteractingwithanelectrostaticand/oramagnetic
field. Aharonov and Bohm8 have demonstrated that thisphase shift between objectwave and unperturbed refer-encewavecanbeexpressedbythephasegratingapprox-imation(PGA),i.e.,
𝜑 𝑥, 𝑦 = 𝐶! 𝑉 𝑥, 𝑦, 𝑧 − !ℏ𝐴! 𝑥, 𝑦, 𝑧 d𝑧!!
!! (1)
where𝐶! is an interaction constant depending on theelectron beam energy, 𝑉 𝑥, 𝑦, 𝑧 the three-dimensionalelectrostatic object potential, 𝑒 the elementary charge,ℏthe reduced Planck constant, and𝐴! 𝑥, 𝑦, 𝑧 the com-ponent of the magnetic vector potential parallel to theelectronbeamdirection𝑧.Accordingly,thefirsttermcanbe considered as electric phase shift𝜑!" and the secondone as magnetic phase shift 𝜑!"#. Consequently, theprojections of the lateral components of the magneticinduction𝑩 = 𝐵! ,𝐵!,𝐵!
!maybeobtainedbydifferenti-
ating𝜑!"#accordingto!!!"# !,!
!"= !
ℏ𝐵! 𝑥, 𝑦, 𝑧 d𝑧
!!!! (2)
and!!!"# !,!
!"= − !
ℏ𝐵! 𝑥, 𝑦, 𝑧 d𝑧
!!!! . (3)
Owing to these relationsEH candirectly visualize theprojected magnetic induction Bx,y in and aroundnanostructures9,10, which was successfully exploited toinvestigate magnetic configurations in magnetotacticbacteria11,Fenanocubes12,Ninanowires13,andothertypesofcomplexnanostructuressuchasmagnetictunneljunc-tions14. However, a single EH experiment only permitsrecovering the magnetic field components integratedalong the beam path through the sample15. In order toobtaininformationaboutthe3Dmagneticstructurefromsuch a 2Dprojection, additional input, e.g., frommicro-magneticsimulations,isrequired.Combining EH with electron tomography to electron
holographic tomography (EHT) canovercome thisprob-lem. EHT starts with acquiring a tilt series of electronhologramsfromthesamenanostructure,whichissubse-quently reconstructed holographically to obtain a tiltseriesofphaseimages,that is,projectedelectricormag-neticpotentials.Followingupalignment,i.e.correctionofimagedisplacementswith respect toa common tilt axis,thisseriesofprojectedpotentialscanbeusedasinputforatomographicreconstruction.EHThasbeensuccessfullyapplied for the 3D mapping of electrostatic potentialswithin nanostructures16-18. Similar approaches on the 3Dreconstruction of magnetic fields outlined and demon-strated its foundations forbothoff-axisholography19andin-line holography20,21. Recently, electro-magnetic strayfields aroundCo2FeGaHeuslerNWs have been revealedsuccessfuly22.Veryrecently,a3Dobservationofmagneticvortex cores in stacked ferromagnetic discs using EHTwasreported23.Theworkdescribes inacondensedman-ner how existing programs such as the IMODpackage24areused to reconstruct the 3Dmagnetic inductionmap.However, the 3Dreconstruction of the correspondingelectricpotentialmandatorytoclearlycorrelatethemate-
rialcompositionof thestackedsamplewith itsmagneticconfigurationisnotpresented.
Indeed,EHTisaverychallengingtechnique:TherearestringentrequirementsfortheTEMspecimen;theobjectof interest should be completely visible in every projec-tionwithoutbeingshadowedbytheholderduringthetiltseries. Moreover, the sample should not provide toostrong diffraction contrast violating the projection law,Eq. (1). Furthermore, the experiment requires a stableenvironmentthroughouttheacquisitionofthetiltseries,whichmay lastseveralhours.Finally,extensiveandcau-tiousdatapost-processingisrequiredasexplainedbelow.
The 3D reconstruction of magnetic vector fields addsanother layerofcomplexity incomparisontothecaseofelectricscalarpotentials18.TheholographicacquisitionintheTEMmustbeperformedunder field freeconditions,i.e. zero externalmagnetic fields,which canbe achievedbyswitchingoff theobjective lensorplacing thesampleabove the objective lens. A pair of phase images, onlydiffering in a reversion of themagnetic induction direc-tion, is needed for each tilt angle in order to separateelectric andmagnetic phase shifts in Eq. (1), by compu-ting half of their sum and difference, respectively25. Inaddition, one tilt series only allows for reconstructing asingle-axiscomponentof𝐵accordingtoEqs.(2,3).There-fore,atleastfourtiltseries(aroundtwomutuallyinclinedaxes)arerequiredtoobtainthecomponentsofthemag-netic induction along two orthogonal axes. The thirdcomponentmaybeobtainedbyexploitingthatthemag-neticinductionisdivergencefree.Furthermore,magneticphase shifts are typically small, which, in combinationwith the high-frequency noise amplification introducedby the numeric derivative in Eqs. (2,3) and the tomo-graphic reconstruction, lead to reduced signal-to-noiseratiosoftheresultingtomograms.
RESULTS AND DISCUSSION: In the following, wedemonstrate how to retrieve quantitatively the 3Dmag-netic ordering within a ferromagnetic nanostructure bymeansofEHT.Ourtestcaseisa100nmthickandafewmicrons long cobalt nanowire (NW) grown by focusedelectron beam induced deposition (FEBID) in a focusedionbeam(FIB)/scanningelectronmicroscopy(SEM)dualbeam instrument on top of a copper tip of a dedicated360° tomography sample holder.Micromagnetic simula-tionsvalidateourresultsandprovidetheB-fieldcontain-ingallthreecomponents.
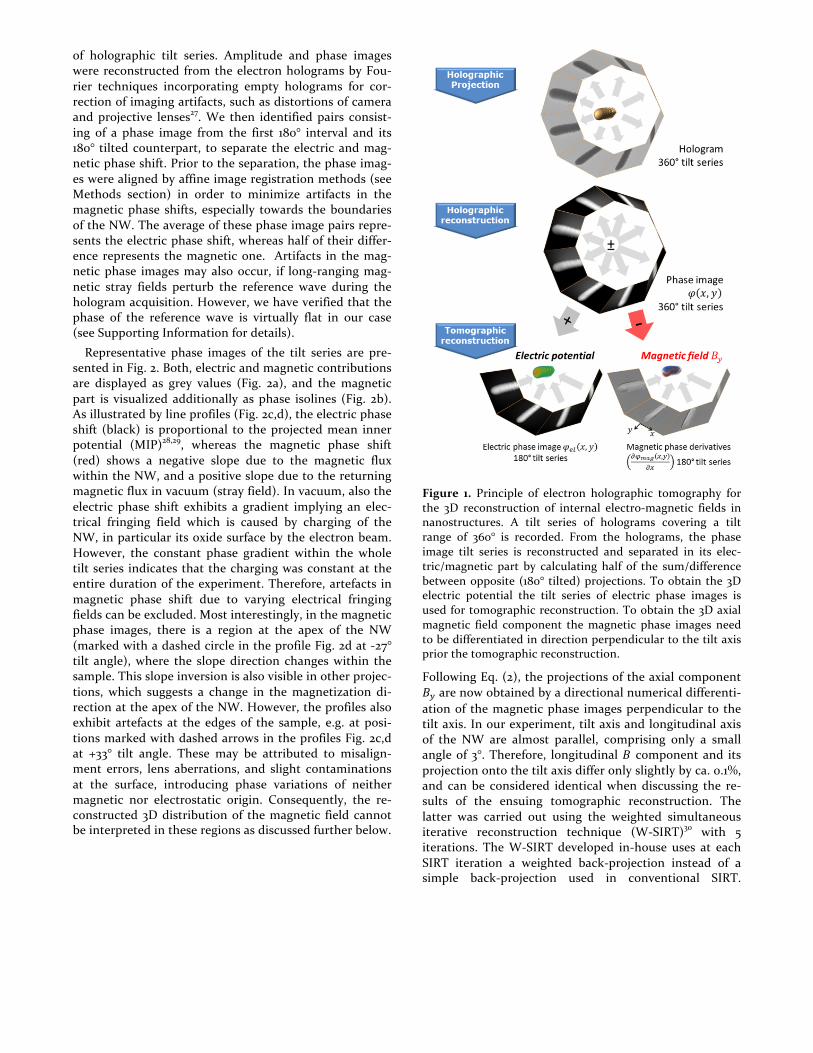
TheprincipleofEHT,illustratedinFig.1,comprisestheacquisition of a tilt series of electron holograms, the re-construction of phase images from each hologram, theseparationofelectricandmagneticphaseshifts,aswellasthe final tomographic 3D reconstruction of both electricpotential and magnetic field. In order to perform thecrucial separation of electric andmagnetic phase shifts,weacquireatiltseriesover360°(insteadof180°sufficientfor the electric potential) using a dedicated tomographyTEMsampleholder.Theacquisitionhasbeenperformedsemi-automatically with THOMAS26, an in-house devel-opedsoftwarepackagededicated forefficientacquisition
of holographic tilt series. Amplitude and phase imageswerereconstructed fromtheelectronhologramsbyFou-rier techniques incorporating empty holograms for cor-rectionofimagingartifacts,suchasdistortionsofcameraandprojective lenses27.We then identifiedpairs consist-ing of a phase image from the first 180° interval and its180° tiltedcounterpart, toseparate theelectricandmag-neticphaseshift.Priortotheseparation,thephaseimag-eswerealignedbyaffineimageregistrationmethods(seeMethods section) in order to minimize artifacts in themagneticphase shifts, especially towards theboundariesoftheNW.Theaverageofthesephaseimagepairsrepre-sentstheelectricphaseshift,whereashalfoftheirdiffer-ence represents themagneticone. Artifacts in themag-neticphase imagesmayalsooccur, if long-rangingmag-netic stray fields perturb the reference wave during thehologramacquisition.However,wehaveverifiedthatthephase of the reference wave is virtually flat in our case(seeSupportingInformationfordetails).
Representative phase images of the tilt series are pre-sentedinFig.2.Both,electricandmagneticcontributionsare displayed as grey values (Fig. 2a), and themagneticpart is visualized additionally asphase isolines (Fig. 2b).Asillustratedbylineprofiles(Fig.2c,d),theelectricphaseshift (black) isproportional to theprojectedmean innerpotential (MIP)28,29, whereas the magnetic phase shift(red) shows a negative slope due to the magnetic fluxwithintheNW,andapositiveslopeduetothereturningmagneticfluxinvacuum(strayfield).Invacuum,alsotheelectric phase shift exhibits a gradient implying an elec-trical fringing field which is caused by charging of theNW,inparticularitsoxidesurfacebytheelectronbeam.However, the constant phase gradient within the wholetiltseries indicatesthatthechargingwasconstantattheentiredurationoftheexperiment.Therefore,artefacts inmagnetic phase shift due to varying electrical fringingfieldscanbeexcluded.Mostinterestingly,inthemagneticphase images, there is a region at the apex of the NW(markedwithadashedcircleintheprofileFig.2dat-27°tilt angle),where the slopedirection changeswithin thesample.Thisslopeinversionisalsovisibleinotherprojec-tions, which suggests a change in themagnetization di-rectionattheapexoftheNW.However,theprofilesalsoexhibit artefacts at the edgesof the sample, e.g. at posi-tionsmarkedwithdashedarrowsintheprofilesFig.2c,dat +33° tilt angle. These may be attributed to misalign-ment errors, lens aberrations, and slight contaminationsat the surface, introducing phase variations of neithermagnetic nor electrostatic origin. Consequently, the re-constructed3Ddistributionof themagnetic fieldcannotbeinterpretedintheseregionsasdiscussedfurtherbelow.
Figure 1. Principle of electron holographic tomography forthe 3D reconstruction of internal electro-magnetic fields innanostructures. A tilt series of holograms covering a tiltrange of 360° is recorded. From the holograms, the phaseimage tilt series is reconstructed and separated in its elec-tric/magnetic part by calculatinghalf of the sum/differencebetweenopposite(180° tilted)projections.Toobtainthe3Delectric potential the tilt series of electric phase images isusedfortomographicreconstruction.Toobtainthe3Daxialmagnetic field component themagnetic phase imagesneedtobedifferentiatedindirectionperpendiculartothetiltaxispriorthetomographicreconstruction.
FollowingEq.(2),theprojectionsoftheaxialcomponent𝐵!arenowobtainedbyadirectionalnumericaldifferenti-ationof themagneticphase imagesperpendicular to thetiltaxis.Inourexperiment,tiltaxisandlongitudinalaxisof the NW are almost parallel, comprising only a smallangleof3°.Therefore, longitudinal𝐵 componentand itsprojectionontothetiltaxisdifferonlyslightlybyca.0.1%,and canbe considered identicalwhendiscussing the re-sults of the ensuing tomographic reconstruction. Thelatter was carried out using the weighted simultaneousiterative reconstruction technique (W-SIRT)30 with 5iterations. TheW-SIRT developed in-house uses at eachSIRT iteration a weighted back-projection instead of asimple back-projection used in conventional SIRT.

Figure2.a)/b)Electric/magneticphaseimagestakenat-87°,-27°,and+33°tiltangle.c)/d)Lineprofilesalongthearrowsmarkedin(a)and(b)representingtheelectric(black)andmagnetic(red)phaseshift.Thecirclein(d)at-27°indicatesthechangeofthephasegradientduetothechangeofmagnetizationdirectioninasmalldomainatthetip.Thearrowsin(c,d)at+33°indicateartefactsinthemagneticphaseshiftattheedgeofthesample.This leads to improved convergence properties of thetomographic reconstruction. Here, the number of itera-tions was determined by visually inspecting the spatialresolutionandnoiseofthereconstructionforanoptimalbalance.Thespatialresolutionofthe3Dreconstructionisbelow10nm,aswedemonstratebydeterminationofthewidth of the edge-spread function in six different direc-tionsonarepresentativecross-sectionoftheCoNW(seeSupporting Information). The 3D distributions of theelectricpotentialandtheaxialmagneticinductionoftheCoNWreconstructedbyEHTareshowninFig.3.Here,we analyze only theB-field inside the samplewhere thecorrespondingelectricpotential is𝑉 ≥ 16 𝑉,because theedgeregionsareaffectedbyartifactsasmentionedabove.A tomographic reconstruction of the stray field only isshownintheSupportingInformation.
Selected cross-sections (Fig. 3b) at positions indicatedbyorangeboxes in thevolumevisualization (Fig. 3a) re-veal that the intrinsic electric potential is virtually ho-mogenousalongtheaxialdirectionsuggestingahomoge-neous chemical composition. In contrast to that, themagnetic field exhibits a domain structure consisting ofonelargedomain(blue,𝐵! = −0.9 T),andasmalldomain(red, 𝐵! = 0.3 T) at the apex with the magnetizationpointinginoppositedirection.
These findings are supported by the histograms of 3Dvolumes and 1D line profiles (Fig. 3c) along the arrowsmarked in Fig. 3b. The most frequent electric potentialvalue in thehistogram is foundat21.5V,which is lowerthanthetheoreticalMIPvalueofpureCo(29.5V)31calcu-lated using neutral atom potentials of Rez et al.32.

Figure3.ElectricpotentialandaxialmagneticB-fieldcomponentofaConanowire.(a)Volumerendering,i.e.thecolorscorre-spondtothepotential/B-fieldvalues.(b)15nmthick2Dslicesthroughthe3Ddataasindicatedbytheorangeboxesin(a).(c)Histogramsof3Dvolumesand1Dlineprofilesalongthearrowsmarkedin(b).Thepeakinthehistogramoftheelectricpoten-tialat21.5Vcanbe interpretedas themean innerpotentialof thisCoNW.Themost frequentvalue in thehistogramof themagneticinductionisat-0.9Tesla.
The observed difference ismainly caused by both themassdensityandtheCopurityofthenanocrystallinewireproducedbyFEBIDarelowercomparedtobulkmaterial,hence reducing themean innerpotential. TheCopuritywas determined by STEM-EDX (see Supporting Infor-mationfordetails)andagrainsizeof3-6nmindiameterwasrevealedbyTEManalysis33.Furthermore,thetheoret-ical crystal potential may be overestimated when usingindependentneutralatompotentialswithout taking intoaccountchemicalbonding.
Similarly, the average magnetic induction along thewireaxisof0.9Tislowerthanthevalueexpectedforpurebulk cobalt (1.76 T )31. This reduction of magnetizationhasbeenobservedinelectronholographyexperimentsforsimilar Fe nanowires grown by FEBID33 and is mainlycausedbylowpurityofthematerial formingtheNW,aswell asdemagnetization fieldsassociatedwith the speci-men geometry reducing the magnetization inside thesample.Anotherpossiblesourceoferrormaybethefactthat we determine the averagemagnetic induction onlyfromtheaxialB-fieldcomponent instead fromthenormof theentirevector field |B|.However,as thesimulationresultsdiscussedbelowsuggest, thecontributionsof theothertwoB-fieldcomponentstothehistogramaresmall
(Fig.5e), i.e. thepeakpositionsof theByand-|B|histo-gramdifferonlyby 10mT.Furthermore, theelectricpo-tential decreases from the center (red) to the surface(green) in radial direction,whereas themagnetic induc-tion remains constant.The reducedpotential canbe ex-plained by oxidation of the surface as confirmed bySTEM-EDX (see Suppl. Information) and the reducedmassdensityasconfirmedbytomographicreconstructionofmassthickness(seeSuppl. Information).Accordingtothe line profile in Fig. 3c, there is a drop in the electricpotential at the position where the magnetic inductionchanges its direction.On the one hand, a lower electricpotentialmayindicateastructuralmodulationofmaterialresultinginalocalreductionofthemagnetizationatthatarea. This would favor the formation of the observedmagneticdomain.Ontheotherhand,alsoaninfluenceofthemagneticfieldontheelectricpotentialmightbepos-sible. However, a more detailed explanation of such anelectro-magnetic coupling is beyond the scope of thisarticle, andwe restrict ourselves to verify our results bymicromagneticsimulationsinthefollowing.
Given the reconstructed 3D distribution of the axialcomponentofthemagneticinductionwemaynoweluci-datethe3Ddistributionofallthreecomponentsandthe

origin of the inverse apex domain with the help of mi-cromagneticsimulations(methodssectionfordetails).InFig.4representativeslicesthroughtheCoNWandcorre-spondingsimulationaredisplayed.Mostof thespinsarealigned along the y-direction, forming a monodomainstate (blue region in Fig. 4) along the wire axis, as ob-served experimentally. Furthermore, a closure domain ispresentatthetipofthewirerepresentingaCstatewitha180°domainwallwhichisinexcellentagreementwiththeexperimentalresult.Thisremanentmagnetizationstateiscommon to soft magnetic nanostructures34, where thestrong demagnetizing field twists the magnetization attheirendtoavoid thegenerationofmagneticchargesatthesurface.Thesimulationsshownherewereperformedwith a saturation magnetization corresponding to theexperimentallyobtainedmagneticinduction.
Figure4.Comparisonbetweenexperimentallyreconstructed(a-f)andsimulated(g-l)B-fieldinaxial(y-)direction.Inthevol-umerenderingofexperimental(a)andsimulated(g)magneticinductionmaps,thez-positionsoftheslicesareindicatedas(b-f)and(h-l),respectively.
Forthisvalue,anexchangeconstantsmallerthantheonenormally used forCo bulkwas needed in order to get aclosure domain at remanence for the given dimensions,whereassimulationsusinghigherexchangevaluesresult-ed in singlemonodomain states (seemethods). The lowexchange value needed to reproduce the experimentalresultsmaybedue to the lowpurityof cobalt grownbyFEBID,but itcouldalsobecausedbyeffectsnotconsid-ered in the simulations, such as roughness, presence ofdefects, local change of composition along the wire orinfluenceof localmagnetocrystallineanisotropy35,36.The-
se can also explain small differences in the structure ofthe domain between simulation and experiments: Forexample, in the simulation the inversion domain isformedinthethickerregion,whereasintheexperimentitisformedinthethinnerregionofthe“egg-shaped”cross-section,andismoreextendedalongtheedge.(Fig.4d,eandj,k).Incylindricalnanowiresastheonestudiedhere,curlingofthemagnetizationalongthesurfaceisexpectedin order to minimize the dipolar energy37. This is con-firmed by themicromagnetic simulation, as observed inFig.5,wherethethreeB-fieldcomponentsareshown.In

particular,Fig.5adepictshowtheazimuthaldirectionoftheNWisinvertedtowardstheapexoftheNW.Howev-er, theseparatevisualizationof the threeB-fieldcompo-nents inFig.5b-d,andthehistogram(Fig.5e)showthatthe overall curling effect is small, with the componentalong the wire axis By mostly dominant compared withtheothertwo.
CONCLUSION: In summary, we have demonstratedthat electron holographic tomography can be used toquantitativelyreconstructthe3Dmagnetic fieldconfigu-rationwithin ferromagneticnanostructures.Asanexam-ple,we observed in the reconstructed axial B-field com-ponentofaCoNWasmallclosuredomainatthetipwitha spatial resolution below 10 nanometers and a signalresolutionof0.1T.InanextstepEHThastobeextendedtoreconstructallcomponentsofthemagneticfieldattheabovenoted figureofmerits.Weenvisagethetechniqueto open new pathways to the characterization of na-noscaleferromagneticelements,suchasspinvalves,read-write magnetic heads, magnetic sensors, and magneticlogicdevices.
Figure 5. Induction map B of the Co NW obtained frommicromagnetic simulation. (a) Iso-surfacewith longitudinalslice(1)representingByandcross-sections(2)and(3)visual-izedbyarrowplots.Inslice(1),theout-of-planecomponentsaredisplayedasvectors.Inthecross-sections(2)and(3),thetwist of magnetic induction is illustrated by the oppositeazimuthal direction of the vectors. (b-d) Volume renderingof the three B-field components with field lines in x-y theplane.(e)HistogramsofB-fieldcomponentsandnegativeofthevectornorm.
EXPERIMENTALSECTION:
GrowthofacobaltnanowirebyFEBID.Thegrowthwas performed in an FEI Helios 600 dual beam systemequippedwitha30kVFEGandaGa+liquidmetalsourceinthesamechamber.Inthiswork,thesubstratewasaCurodof 1mm indiameterending inanano-tip,onwhichthe cobalt pillar was grown. The end of the tip was cutand sharpened using focused ionmilling (Fig. S1) to as-surethatthepillarrestedonthesalientpointofthesub-strate.Theparametersusedduringthegrowthandmoreinformation on the growth process can be found in theSupportingInformationandinRefs.38,39.
Holographictiltseriesacquisition.TheCurodwiththe Co NW was transferred to a dedicated electron to-mography holder (model 2050, Fischione Instruments),andplasmacleanedtoremovecontaminationoftheNWsurface. A tilt series consisting of object and object-free(empty)hologramswasrecordedusingtheQu-Ant-EM,aFEITitan3TEMoperated at 300kV innonCs-correctedLorentzmode(objectivelensoff).AMöllenstedtbiprismoperating at 200 V was introduced in the SA apertureplane to create the holograms. In order to increase thewidthoftheinterferencearea,thediffractionlenscurrentwasincreasedtoitsmaximumstrength.Thetiltserieswasacquiredwithin the angular range from 0° to 360° in 3°steps. The electron holograms were acquired with aUS1000XP Gatan CCD camera (binning 1, 5 s exposuretime),atapixelsizeof0.37nmandafringespacingof2.2nm.
Holographic and tomographic reconstruction. Allimage processing steps were performed in Gatan Inc.’sDigital Micrograph. The resolution of the reconstructedobjectexitwaveis4.6nm,determinedbythesizeofthenumericalmask used in the Fourier reconstruction. Thetiltseriesofphaseimageswasdividedintotwoparts,onebelowandoneabove180°tiltangle.Then,bothtiltserieswerepre-alignedseparatelybycross-correlationtocorrectfor coarsedisplacementsbetween successiveprojections.Furthermore, the second tilt series was flipped perpen-dicular to the tilt axis to convert the 180° rotation be-tweencorrespondingphase images intoamirroringwithrespecttothe imageplane.Then,eachpairofphase im-ageswasalignedtoeachotherbyapplyingalinearaffinetransformation on the “flipped” phase images, whichconsidered displacements, rotation, and direction-dependentmagnification changes. To perform the exactfinealignment,i.e.,theaccuratedeterminationofthetiltaxis and correction for sub-pixel displacement, we haveused a self-implemented center-of-massmethod for cor-rectionofdisplacementsperpendicular to the tilt axis inthe sinograms, and the common line approach for thedisplacementcorrectionparalleltothetiltaxis.Themag-netic phase tilt series was aligned using parameters asdeterminedfromtheelectricphasetiltseries,whichhasahigher signal-to-noise ratio than the magnetic one andthereforeyieldsmoreaccurateparameters.Beforecompu-tationofthederivativesthemagneticphaseimagesweresmoothedslightlybyaMedianfilterwitha3×3Pixelker-nel.
Micromagnetic simulations. A staticmicromagneticsimulation of the remanent state of the Co FEBID NWwas performed by the GPMagnet software package40,which solves the Landau-Lifschitz-Gilbert equation. Thecomputation ran parallelized on an efficient graphicsprocessing unit (GPU). The 3D shape of the NW wasadaptedfromtheexperimentaltomogramandconstruct-ed with a maximum length of 1000 nm by assemblingcubic cells of 3.5×3.5×3.5 nm3. The “egg-shaped” cross-section of theNWmodelwas varied from 90 nm to 110nm,andthe tip is spherical.Themicromagneticcalcula-tionswereperformedfortheNWplacedinsideavolumeof 301.0×1200.5×220.5nm3. Thus, the aspect ratio(length/diameter≈1000/100=10)islargeenoughtoalignthemagnetization along the nanowire at remanence viashape anisotropy. The magnetic parameters for the CoNWhave been chosen from the experimental data: Thesaturationmagnetization(Ms)wassetto0.72×106A/m,asestimated from the measured value of the B-field; theexchange constant A was suitably tuned until a smallmagneticdomainwithasimilarsizeofthatexperimentalonewasformedatthetip.WeachievedsuchaconditionusingA≤0.4×10⁻¹¹J/m,smallerthanthevalueforpureCo(1-3×10-11J/m).IfweuseA≥0.4×10-11J/m,theclosuredo-mainisnotformedforthegivenMs.Themagnetocrystal-line anisotropywasneglecteddue to thenanocrystallinemorphology of the NW, composed by small grains ofabout5nmsizerandomlyoriented.Forthisstaticsimula-tion, an initial magnetization configuration was consid-ered, with all spins oriented along the y-direction. Thesimulation was iterated using a second order predictorcorrectoruntilminimizingthetotalenergyofthesystem.
ASSOCIATED CONTENT Supporting Information. Growth of cobalt nanowire byFEBID, STEM-EDX analysis, medium scale HAADF-STEMtomography, perturbation of reference wave during holo-graphic acquisition, stray field reconstruction of the nan-owire, comparison between 3D reconstructions of potentialandelasticattenuation.Moviesofphase tilt series, 3Delec-tricpotential,and3Dmagneticinductionmap.Thismaterialis available free of charge via the Internet athttp://pubs.acs.org.
AUTHOR INFORMATION Corresponding Author DanielWolf,[email protected]
Author Contributions D.W., A.B., E.J. and L.A.R performed the EHT experiment.D.W.aligned,reconstructedandevaluatedthe3Ddata.L.S.prepared the sample.A.F-P. and J.M.DT. contributed to thepreparationof the sample.L.A.R.performed themicromag-netic simulation. A.L. performed the magnetic stray fieldreconstruction.D.W.wrote themanuscript.A.F-P.A.B.E.S.A.L. L.A.R. L.S. S.B. contributed tomanuscriptwriting. E.S,S.B. and H.L. initiated the EHT study. All the authors dis-cussedtheresultsandcommentedonthemanuscript.Notes Theauthorsdeclarenocompetingfinancialinterest.
ACKNOWLEDGMENT Thisworkwassupportedby theEuropeanUnionunder theSeventh Framework Program under a contract for an Inte-grated Infrastructure Initiative Reference 312483-ESTEEM2.S.B.andA.B.gratefullyacknowledgefundingbyERCStartinggrantsnumber335078COLOURATOMSandnumber278510VORTEX.AF-PacknowledgesanEPSRCEarlyCareerfellow-shipandsupportfromtheWintonFoundation.E.S.,C.G.andL.A. R. acknowledge the French ANR program for supportthoughtheprojectEMMA.
REFERENCES (1) Parkin, S. S. P.,Hayashi,M., and Thomas, L.MagneticDo-main-WallRacetrackMemory.Science2008,320,190-194.
(2)Lavrijsen,R.,Lee,J-H.,Fernandez-Pacheco,A.,Petit,D.C.M.C.,Mansell,R.,andCowburn,R.P.Magnetic ratchet for three-dimensionalspintronicmemoryandlogic.Nature2013,493,647-650.
(3)Nasirpouri,F.andNogaret,A.NanomagnetismandSpintron-ics - Fabrication, Materials, Characterization and Applications.WorldScientific,2011.
(4)Shinjo,T.NanomagnetismandSpintronics.ElsevierScience,2013.
(5) Stamps, R. L, Breitkreutz, S., Akerman, J. et al. The 2014MagnetismRoadmap.J.Phys.D:Appl.Phys.2014,47,333001.
(6) Zhu, Y. Modern Techniques for Characterizing MagneticMaterials.Springer,2005.
(7) Hopster, H and Oepen, H. P. Magnetic Microscopy ofNanostructures.Springer,2006.
(8)Aharonov,Y. andBohm,D.SignificanceofElectromagneticPotentialsintheQuantumTheory.Phys.Rev.1959,115,485-491.
(9) Tonomura, A. Applications of electron holography. Rev.Mod.Phys.1987,59,639-669.
(10) Lichte, H. and Lehmann, M. Electron holography - basicsandapplications.Rep.Prog.Phys.2008,71,016102.
(11) Dunin-Borkowski, R. E., McCartney, M. R., Frankel, R. B.,Bazylinski,D.A.,Pósfai,M.,andBuseck,P.R.MagneticMicro-structure of Magnetotactic Bacteria by Electron Holography.Science1998,282,1868-1870.
(12)Snoeck,E.,Gatel,C.,Lacroix,L.M.etal.MagneticConfigu-rations of 30 nm Iron Nanocubes Studied by Electron Holog-raphy.NanoLett.2008,8,4293-4298.
(13) Biziere, N., Gatel, C., Lassalle-Balier, R., Clochard, M. C.,Wegrowe, J.E., andSnoeck,E. Imaging theFineStructureof aMagneticDomainWallinaNiNanocylinder.NanoLett.2013,13,2053-2057.
(14)Javon,E.,Gatel,C.,Masseboeuf,A.,andSnoeck,E.Electronholography study of the local magnetic switching process inmagnetictunneljunctions.J.Appl.Phys.2010,107,09D310.
(15) Beleggia,M., Kasama, T., andDunin-Borkowski, R. E. Thequantitative measurement of magnetic moments from phaseimages of nanoparticles and nanostructures--I. Fundamentals.Ultramicroscopy2010,110,425-432.
(16)Lai,G.,Hirayama,T.,Ishizuka,K.,andTonomura,A.Three-dimensional reconstruction of electric-potential distribution inelectron-holographic interferometry. Journal of Applied Optics1994,33,829-833.
(17)Midgley,P.A.andDunin-Borkowski,R.E.Electrontomog-raphyandholographyinmaterialsscience.Nat.Mater.2009,8,271-280.

(18)Wolf,D.,Lubk,A.,Röder,F.,andLichte,H.Electronholo-graphictomography.Curr.Opin.SolidStateMater.Sci.2013,17,126-134.
(19) Lai,G.,Hirayama, T., Fukuhara,A., Ishizuka,K., Tanji, T.,andTonomura,A.Three-dimensionalreconstructionofofmag-netic vector fields using electron-holographic interferometry. J.Appl.Phys.1994,75,4593-4598.
(20) Phatak, C., Petford-Long, A. K., and De Graef, M. Three-Dimensional Study of the Vector Potential of Magnetic Struc-tures.Phys.Rev.Lett.2010,104,253901.
(21)Phatak,C.,Beleggia,M.,andDeGraef,M.Vectorfieldelec-tron tomography of magnetic materials: Theoretical develop-ment.Ultramicroscopy2008,108,503-513.
(22) Lubk, A., Wolf, D., Simon, P., Wang, C., Sturm, S., andFelser,C.Nanoscalethree-dimensionalreconstructionofelectricand magnetic stray fields around nanowires. Appl. Phys. Lett.2014,105,173110.
(23)Tanigaki,T.,Takahashi,Y.,Shimakura,T.,Akashi,T.,Tsu-neta, R., Sugawara, A., and Shindo,D. Three-DimensionalOb-servation of Magnetic Vortex Cores in Stacked FerromagneticDiscs.NanoLett.2015,15,1309-1314.
(24) Kremer, J.R.,Mastronarde,D.N., andMcIntosh, J.R. Com-puter Visualization of Three-Dimensional Image Data UsingIMOD.J.Struct.Biol.1996,116,71-76.
(25)Tonomura,A.,Matsuda,T.,Endo, J.,Arii,T.,andMihama,K. Holographic interference electronmicroscopy for determin-ing specimen magnetic structure and thickness distribution.Phys.Rev.B1986,34,3397-3402.
(26)Wolf, D., Lubk, A., Lichte, H., and Friedrich, H. Towardsautomatedelectronholographictomographyfor3Dmappingofelectrostaticpotentials.Ultramicroscopy2010,110,390-399.
(27)Lehmann,M. andLichte,H.Tutorial onOff-AxisElectronHolography.Microsc.Microanal.2002,8,447-466.
(28)Bethe,H.Theoryonthediffractionofelectronsincrystals.Ann.Phys.1928,87,55-129.
(29)O'Keeffe,M.andSpence,J.C.H.OntheaverageCoulombpotential and constraints on the electron density in crystals.ActaCrystallogr.,Sect.A1994,50,33-45.
(30)Wolf,D., Lubk,A., andLichte,H.Weighted simultaneousiterative reconstruction technique for single-axis tomography.Ultramicroscopy2014,136,15-25.
(31)Dunin-Borkowski,R.E.,McCartney,M.R.,Smith,David J.,andParkin,S.S.P.Towardsquantitativeelectronholographyofmagnetic thin filmsusing in situmagnetization reversal.Ultra-microscopy1998,74,61-73.
(32)Rez,D.,Rez,P.,andGrant,I.Dirac-FockcalculationsofX-ray scattering factors and contributions to themean inner po-tentialforelectronscattering.ActaCrystallogr.,Sect.A1994,50,481-497.
(33) Takeguchi,M., Shimojo,M., and Furuya,K. Fabrication ofmagneticnanostructuresusingelectronbeaminducedchemicalvapourdeposition.Nanotechnology2005,16,1321-1325.
(34)Usov,N.A,Zhukov,A,andGonzalez,J.RemanentMagneti-zation States in Soft Magnetic Nanowires. IEEE Trans. Magn.2006,42,3063-3065.
(35)New,R.M.H.,Pease,R.F.W.,andWhite,R.L.Effectofmag-netocrystalline anisotropy in single-domain polycrystalline co-baltislands.IEEETrans.Magn.1995,31,3805-3807.
(36)Hausmanns,B.,Krome,T.P.,andDumpich,G.Magnetore-sistance and magnetization reversal process of Co nanowirescoveredwithPt.J.Appl.Phys.2003,93,8095-8097.
(37)Jamet,S.,Rougemaille,N.,Toussaint,J.-C.,andFruchart,O.Head-to-headdomainwalls inone-dimensionalnanostructures:an extended phase diagram ranging from strips to cylindricalwires.arXiv.org,e-PrintArch.,Condens.Matter1412.06792014.
(38)Fernandez-Pacheco,A., Serrano-Ramon,L.,Michalik, J.M.etal.Threedimensionalmagneticnanowiresgrownby focusedelectron-beaminduceddeposition.Sci.Rep.2013,3,1492.
(39) Serrano-Ramón, L., Córdoba, R., Rodrigues, L. A. et al.Ultrasmall Functional FerromagneticNanostructuresGrownbyFocused Electron-Beam-InducedDeposition. ACSNano 2011, 5,7781-7787.(40) Lopez-Diaz, L, Aurelio, D, Torres, L et al. Micromagnetic simu-lations using Graphics Processing Units. J. Phys. D: Appl. Phys. 2012, 45, 323001.

10