
ARS- Bruce Lee- Instituciones y Pacientes
8
Social Network Analysis of Patient Sharing Among Hospitals in Orange County, California Bruce Y. Lee, MD, MBA, Sarah M. McGlone, MPH, Yeohan Song, Taliser R. Avery, BS, Stephen Eubank, PhD, Chung-Chou Chang, PhD, Rachel R. Bailey, MPH, Diane K. Wagener, PhD, Donald S. Burke, MD, Richard Platt, MD, and Susan S. Huang, MD, MPH In many ways, hospitals in a county are analogo us to indivi dual people within a social network. Both people and hospitals have in- dividu al charact eristi cs (e.g., height , weight , age, and gender for people; bed capacity, facility type, and payer mix for hospitals). People exhibit behaviors; hospitals implement policies and interventions. Just as people are connected by social ties and interactio ns, hospitals are often connected to each other through sharing patients, because patients discharged from one hospit al may be admitted to other hospital s in the same reg ion. Simila r to soci al int era cti ons among people, patient sharing can have signif - icant implications for disease and patient- demographic epidemiology (e.g., hospital- acquir ed infections) and the impact of disease control measures, patient education and pre- ventio n programs, and fiscal policies. 1 –3 Social network constructs have been applied to individuals in populations to better under- stand the spread of behavi ors, ideas, 4–10 and diseases 4,11–13 and their control measures. 4,12,7 However, to our knowledge our study is the first to apply social network frameworks and mea- sures to hospitals to understand how hospitals withi n a county are interconnected by patien t sharing. We collected data from all acute care healt h facili ties in a large United States county and construct ed a social network model repre- senting their patient-sharing connections. We used social network analyses to deter mine and characterize: d The amount of patient sharing occurring and the heterogeneity of this sharing among different hospitals, d Whether certain hospitals had a greater in- fluence over the patien t-shar ing network and wha t cha ract eri sti cs may pre dict tha t influ ence , d How patient sharing correlated with geo- graphic distance (i.e., whether hospitals that were closer together were more likely to share patients), and d The proportion of patient sharing that oc- curred via direct pat ient trans fers, as opposed to patients being discharged and having an intervening stay in the community before being readmitted to another hospital. METHODS We used patient-level hospital discharge data from 2005 to 2006 for all 32 hospitals in Orange County, California, obtained from the California Office of Statewide Health Planning and Development. 14 These hospitals serve 3.1 milli on people residing in 1 48 zip codes. The United States Census Bureau’s 2006 American Community Survey provided additional descrip- tive data for Orange Coun ty. Of the 32 hospitals , 6 were long-term acute care facili ties serving patients with prolonged high-level medical needs (e.g., mechanical ventilation). We used UCINET for Windows version 6.0 (Analytic Technologies, Lexington, KY) to con- duct social networ k analys es. Our analyse s considered 2 general patient-sharing networks, on the basis of wheth er patients discharged from a hospital in 2005 were admitted to any other Oran ge County hospita l within 365 days: d Uninterr upted patient-s haring (UPS) network: This network counted patients transferred directly from one hospital to another in the same calendar day without an intervening stay in a nonacute care setting or the community at large. Two hospitals had an uninterrupted tie if one transferred patients directly to the other. d Total patient-sharing (TPS) network: This network included both direct patient trans- fers (UPS) and patient sharing occurring after an intervening stay in the community or a nonhospital setting. Two hospitals had a tie if the y shared a pat ient wit hin 1 year of each other. The UPS network is a subset of the TPS networ k. We also calculated how much patient shar- ing was occurrin g with hospitals outside Or- ange County. Objectives. We applied social network analyses to determine how hospitals within Orange County, California, are interconnected by patient sharing, a system which may have numerous public health implications. Methods. Our analyses considered 2 general patient-sharing networks: un- inte rrupt ed patie nt shar ing (UPS; i.e., direc t interhos pital transfers) and tota l pati ent shar ing (TPS; i.e., all inter hosp ital pati ent shar ing, inclu ding patie nts with intervening nonhospital stays). We considered these networks at 3 thresholds of patient sharing: at least 1, at least 10, and at least 100 patients shared. Results. Geographically proximate hospitals were somewhat more likely to share patie nts, but many hospitals shar ed patients with distant hosp itals . Number of patient admissions and percentage of cancer patients were associ- ated with greater conn ectiv ity across the syst em. The TPS network reve aled numerous connec tio ns not seen in the UPS net wor k, meani ng tha t dir ect transfers only accounted for a fraction of total patient sharing. Conclusions. Our analysis demonstrated that Orange County’s 32 hospitals were highly and heterogeneous ly interconnected by patient sharing. Different hospital populations had different levels of influence over the patient-sharing network. (Am J Public Health. 2011;101:707–713. doi:10.2105/AJPH.2010. 202754) RESEARCH AND PRACTICE Apr il 2011, Vol 101, No. 4 | American Journal of Public Health Lee et al. | Peer Reviewed | Research and Practi ce | 707
-
Upload
mariela-munoz -
Category
Documents
-
view
220 -
download
0
Transcript of ARS- Bruce Lee- Instituciones y Pacientes
8/3/2019 ARS- Bruce Lee- Instituciones y Pacientes
http://slidepdf.com/reader/full/ars-bruce-lee-instituciones-y-pacientes 1/8
Social Network Analysis of Patient Sharing Among Hospitals in Orange County, California
Bruce Y. Lee, MD, MBA, Sarah M. McGlone, MPH, Yeohan Song, Taliser R. Avery, BS, Stephen Eubank, PhD, Chung-Chou Chang, PhD, Rachel R. Bailey,MPH, Diane K. Wagener, PhD, Donald S. Burke, MD, Richard Platt, MD, and Susan S. Huang, MD, MPH
In many ways, hospitals in a county are
analogous to individual people within a social
network. Both people and hospitals have in-
dividual characteristics (e.g., height, weight, age,
and gender for people; bed capacity, facility
type, and payer mix for hospitals). People
exhibit behaviors; hospitals implement policies
and interventions. Just as people are connected
by social ties and interactions, hospitals are
often connected to each other through sharing
patients, because patients discharged from one
hospital may be admitted to other hospitals
in the same region. Similar to social interactions
among people, patient sharing can have signif-
icant implications for disease and patient-
demographic epidemiology (e.g., hospital-
acquired infections) and the impact of disease
control measures, patient education and pre-
vention programs, and fiscal policies.1–3
Social network constructs have been applied
to individuals in populations to better under-stand the spread of behaviors, ideas,4–10 and
diseases4,11–13 and their control measures.4,12,7
However, to our knowledge our study is the first
to apply social network frameworks and mea-
sures to hospitals to understand how hospitals
within a county are interconnected by patient
sharing. We collected data from all acute care
health facilities in a large United States county
and constructed a social network model repre-
senting their patient-sharing connections. We
used social network analyses to determine and
characterize:
d The amount of patient sharing occurring and
the heterogeneity of this sharing among
different hospitals,d Whether certain hospitals had a greater in-
fluence over the patient-sharing network and
what characteristics may predict that influence,d How patient sharing correlated with geo-
graphic distance (i.e., whether hospitals that
were closer together were more likely to
share patients), and
d
The proportion of patient sharing that oc-curred via direct patient transfers, as opposed
to patients being discharged and having an
intervening stay in the community before
being readmitted to another hospital.
METHODS
We used patient-level hospital discharge
data from 2005 to 2006 for all 32 hospitals in
Orange County, California, obtained from the
California Office of Statewide Health Planning
and Development.14 These hospitals serve 3.1
million people residing in 148 zip codes. The
United States Census Bureau’s 2006 American
Community Survey provided additional descrip-
tive data for Orange County. Of the 32 hospitals,
6 were long-term acute care facilities serving
patients with prolonged high-level medical needs
(e.g., mechanical ventilation).
We used UCINET for Windows version 6.0
(Analytic Technologies, Lexington, KY) to con-
duct social network analyses. Our analyses
considered 2 general patient-sharing networks,on the basis of whether patients discharged
from a hospital in 2005 were admitted to any
other Orange County hospital within 365 days
d Uninterrupted patient-sharing (UPS) network:
This network counted patients transferred
directly from one hospital to another in the
same calendar day without an intervening stay
in a nonacute care setting or the community at
large. Two hospitals had an uninterrupted tie
if one transferred patients directly to the other.d Total patient-sharing (TPS) network: This
network included both direct patient trans-
fers (UPS) and patient sharing occurring after
an intervening stay in the community or
a nonhospital setting. Two hospitals had a
tie if they shared a patient within 1 year of
each other. The UPS network is a subset of
the TPS network.
We also calculated how much patient shar-
ing was occurring with hospitals outside Or-
ange County.
Objectives. We applied social network analyses to determine how hospitals
within Orange County, California, are interconnected by patient sharing, a system
which may have numerous public health implications.
Methods. Our analyses considered 2 general patient-sharing networks: un-
interrupted patient sharing (UPS; i.e., direct interhospital transfers) and total
patient sharing (TPS; i.e., all interhospital patient sharing, including patients with
intervening nonhospital stays). We considered these networks at 3 thresholds of
patient sharing: at least 1, at least 10, and at least 100 patients shared.
Results. Geographically proximate hospitals were somewhat more likely toshare patients, but many hospitals shared patients with distant hospitals.
Number of patient admissions and percentage of cancer patients were associ-
ated with greater connectivity across the system. The TPS network revealed
numerous connections not seen in the UPS network, meaning that direct
transfers only accounted for a fraction of total patient sharing.
Conclusions. Our analysis demonstrated that Orange County’s 32 hospitals
were highly and heterogeneously interconnected by patient sharing. Different
hospital populations had different levels of influence over the patient-sharing
network. (Am J Public Health. 2011;101:707–713. doi:10.2105/AJPH.2010.
202754)
RESEARCH AND PRACTICE
April 2011, Vol 101, No. 4 | American Journal of Public Health Lee et al. | Peer Reviewed | Research and Practice | 707
8/3/2019 ARS- Bruce Lee- Instituciones y Pacientes
http://slidepdf.com/reader/full/ars-bruce-lee-instituciones-y-pacientes 2/8
We created social network diagrams (socio-
grams) in which each node represented a hos-
pital and each edge (connection between 2
nodes) represented patient sharing. Node size
was proportional to the hospital’s bed capacity.Nodes were arranged in a circular pattern
clockwise in order of decreasing bed capacity
(largest hospital positioned at 6 o’clock), with
the long-term acute care facilities ordered in-
dependently after the other hospitals. Edges
were directional (i.e., if Hospital A sent patients
to Hospital B but did not receive patients from
Hospital B, then Hospital B was connected to
Hospital A but not vice-versa; patient sharing
is directed from A to B). Arrows indicated
patient-sharing direction; a double-arrowed
line implied a symmetric connection. Socio-
grams were binary with an edge present if
patient-sharing volume (N) between 2 hospitals
exceeded a threshold number (N‡1, N‡10,
or N‡100).
Social Network Measures
Our analysis calculated the following general
network measures, which describe the degree
of connectivity for the entire Orange County
hospital network15:
d Geodesic distance: smallest number of inter-
hospital ties (edges) that connect one hospitalto another.
d Diameter: largest geodesic distance in the
network, that is, the greatest distance be-
tween any pair of hospitals (greater diame-
ter=network less tightly connected).d Density: number of actual existing ties di-
vided by the total number of possible ties in
a network (lower density=greater heteroge-
neity).
For each hospital we calculated the following
centrality measures:
d Degree: a hospital’s total number of connec-
tions.d In-degree: total number of different hospitals
that send patients to the given hospital (high
in-degree=a hospital highly influenced by
others=high prominence).d Out-degree: total number of different hospi-
tals that receive patients from a given hospital
(high out-degree=a hospital that highly in-
fluences others=high influence).
d Betweenness: number of times a given hos-
pital is part of the shortest path between 2
others (i.e., serves as a necessary intermedi-
ary).
Centrality measures indicate the degree of
connectedness between a given member and
all other network members. Highly connected
hospitals may affect or be affected by more
hospitals, whereas relatively isolated hospitals
may have little impact. To identify hospitals
with which each hospital most closely inter-
acted, we identified each hospital’s 1-step ego
network, consisting of the hospital (ego) and
all hospitals connected to it by an edge.
Hospital Characteristics Associated
With Social Network Measures
We used Stata version 10 (StataCorp, Col-
lege Station, TX) to evaluate the associations
between centrality measures and various hos-
pital characteristics, including annual admis-
sions, mean length of stay, and proportion of
patients meeting the following criteria: younger
than 18 years, White race, Hispanic ethnicity,
using Medicare, using Medicaid, diagnosis of
certain ICD-9 coded diseases (e.g., diabetes,
liver disease, renal disease, cancer, methicillin-
resistant Staphylococcus aureus , and Clostridium
difficile ), and recent surgery. Univariable testing determined which characteristics (continuous
variables) were associated with each centrality
measure (each dichotomized by its median
value). We entered variables associated at a
less than or equal to 0.15 (on the basis of
univariable testing) into a forward stepwise
multivariable model, retaining variables at a
less than 0.20. The small sample size motivated
us to enter and retain probabilities that were
greater than the typical values (0.10 and 0.15)
to avoid nonsignificant association because of
insufficient power.
We used a rank-based method to assess the
correlation between geodesic and geographic
distances by calculating the Spearman correla-
tion coefficients ( q ) between hospitals’ dis-
tances in the network (excluding hospitals
without ties). We conducted additional analy-
ses using a 30-day time horizon instead of 1
year (i.e., we determined the TPS on the basis
of whether patients discharged from one hos-
pital were admitted to any other Orange
County hospital within 30 days).
RESULTS
The number of admissions over the 2005
calendar year ranged from 47 to 29741
(median =8532; mean= 9999; SD = 7893).The mean length of stay ranged from 4 days to
44 days (median= 5; mean= 9; SD =10). For
the hospital patient populations, the percentage
of White patients ranged from 15% to 93%
(median=77%; mean=72%; SD=21%), the
percentage of pediatric patients ranged from
0% to 99% (median=17%; mean=23%;
SD=27%), the percentage of Medicare pa-
tients ranged from 0% to 92% (median= 32%;
mean= 35%; SD= 21%), and the percentage of
Medi-Cal (California Medicaid) patients ranged
from 2% to 66% (median=15%; mean = 21%;
SD=21%).
A vast majority of all patient sharing
(86.6%) occurred between Orange County
hospitals. Of direct transfers for patients ad-
mitted to Orange County hospitals, 23.5%
(SD=18.4%) were to a hospital in a neighbor-
ing county, and 74.5% (SD=20.3%) were
within Orange County. Among total patient
transfers (discharge from an Orange County
hospital and readmission to another hospital),
86.6% were to another hospital within Orange
County, and 22.7% (SD=29.3%) were to
a hospital outside Orange County.
Total Patient Sharing
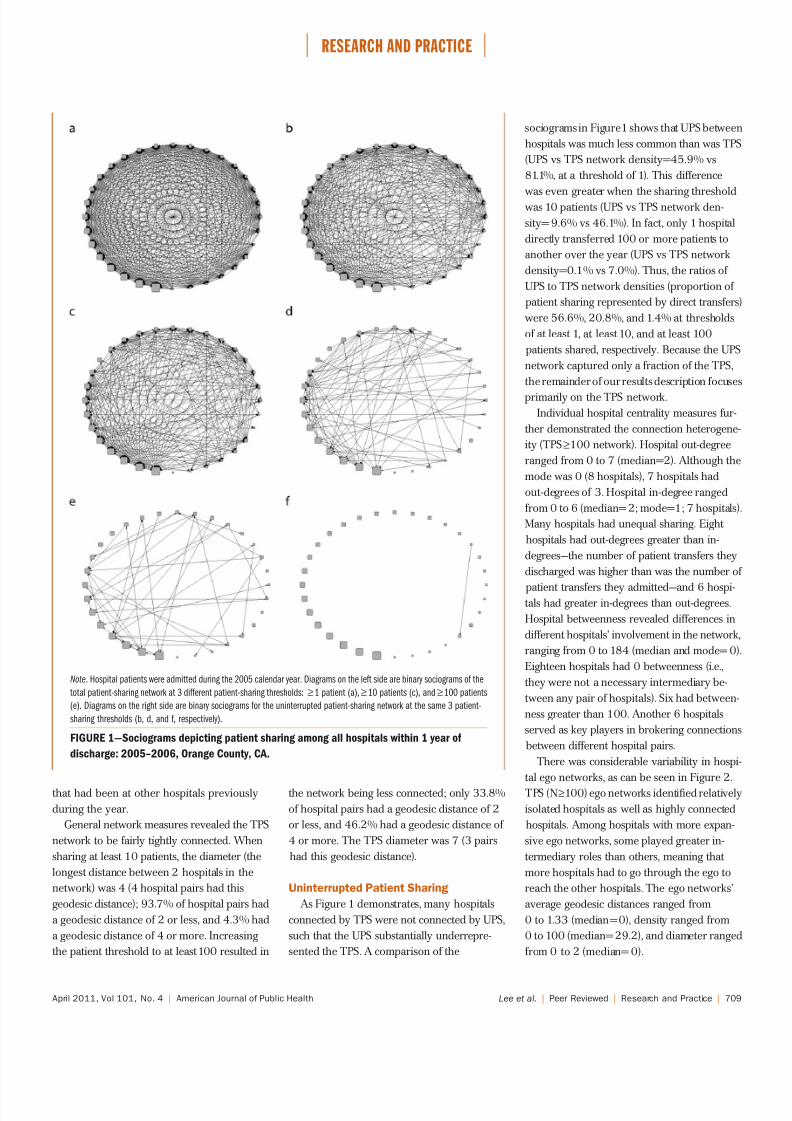
Figure 1 shows TPS network sociograms for
3 patient-sharing thresholds. All hospital pairs
shared at least 1 patient over the year (network
density =81.1%). Most (88.3%) connections
were reciprocal. Increasing the sharing thresh-
old to at least 10 patients over the year still left
a highly interconnected network (network
density=46.1%) with mostly reciprocated
connections (82.1%). Only the smallest hos-
pital by bed size (a long-term acute care
facility) had no connections at this threshold.
The threshold of at least 100 patients yielded
much greater heterogeneity (network den-
sity= 7.0%). Six hospitals at this threshold
had no connections, and fewer (68.3%) had
reciprocal connections than were seen at
lower thresholds. Eight hospitals (including
4 long-term acute care facilities) did not
send at least 100 patients to other hospitals,
and 7 (including 2 long-term acute care
facilities) did not receive at least 100 patients
RESEARCH AND PRACTICE
708 | Research and Practice | Peer Reviewed | Lee et al. American Journal of Public Health | April 2011, Vol 101, No. 4
8/3/2019 ARS- Bruce Lee- Instituciones y Pacientes
http://slidepdf.com/reader/full/ars-bruce-lee-instituciones-y-pacientes 3/8
that had been at other hospitals previously
during the year.
General network measures revealed the TPS
network to be fairly tightly connected. When
sharing at least 10 patients, the diameter (the
longest distance between 2 hospitals in the
network) was 4 (4 hospital pairs had this
geodesic distance); 93.7% of hospital pairs had
a geodesic distance of 2 or less, and 4.3% had
a geodesic distance of 4 or more. Increasing
the patient threshold to at least 100 resulted in
the network being less connected; only 33.8%
of hospital pairs had a geodesic distance of 2
or less, and 46.2% had a geodesic distance of
4 or more. The TPS diameter was 7 (3 pairs
had this geodesic distance).
Uninterrupted Patient Sharing
As Figure 1 demonstrates, many hospitals
connected by TPS were not connected by UPS,
such that the UPS substantially underrepre-
sented the TPS. A comparison of the
sociograms in Figure1 shows that UPS between
hospitals was much less common than was TPS
(UPS vs TPS network density=45.9% vs
81.1%, at a threshold of 1). This difference
was even greater when the sharing thresholdwas 10 patients (UPS vs TPS network den-
sity= 9.6% vs 46.1%). In fact, only 1 hospital
directly transferred 100 or more patients to
another over the year (UPS vs TPS network
density=0.1% vs 7.0%). Thus, the ratios of
UPS to TPS network densities (proportion of
patient sharing represented by direct transfers)
were 56.6%, 20.8%, and 1.4% at thresholds
of at least 1, at least 10, and at least 100
patients shared, respectively. Because the UPS
network captured only a fraction of the TPS,
the remainder of our results description focuses
primarily on the TPS network.
Individual hospital centrality measures fur-
ther demonstrated the connection heterogene-
ity (TPS‡100 network). Hospital out-degree
ranged from 0 to 7 (median=2). Although the
mode was 0 (8 hospitals), 7 hospitals had
out-degrees of 3. Hospital in-degree ranged
from 0 to 6 (median= 2; mode=1; 7 hospitals)
Many hospitals had unequal sharing. Eight
hospitals had out-degrees greater than in-
degrees—the number of patient transfers they
discharged was higher than was the number of
patient transfers they admitted—and 6 hospi-tals had greater in-degrees than out-degrees.
Hospital betweenness revealed differences in
different hospitals’ involvement in the network,
ranging from 0 to 184 (median and mode= 0).
Eighteen hospitals had 0 betweenness (i.e.,
they were not a necessary intermediary be-
tween any pair of hospitals). Six had between-
ness greater than 100. Another 6 hospitals
served as key players in brokering connections
between different hospital pairs.
There was considerable variability in hospi-
tal ego networks, as can be seen in Figure 2.
TPS (N‡100) ego networks identified relatively
isolated hospitals as well as highly connected
hospitals. Among hospitals with more expan-
sive ego networks, some played greater in-
termediary roles than others, meaning that
more hospitals had to go through the ego to
reach the other hospitals. The ego networks’
average geodesic distances ranged from
0 to 1.33 (median = 0), density ranged from
0 to 100 (median= 29.2), and diameter ranged
from 0 to 2 (median= 0).
Note. Hospital patients were admitted during the 2005 calendar year. Diagrams on the left side are binary sociograms of the
total patient-sharing network at 3 different patient-sharing thresholds: ‡1 patient (a),‡10 patients (c), and‡100 patients
(e). Diagrams on the right side are binary sociograms for the uninterrupted patient-sharing network at the same 3 patient-
sharing thresholds (b, d, and f, respectively).
FIGURE 1—Sociograms depicting patient sharing among all hospitals within 1 year of
discharge: 2005–2006, Orange County, CA.
RESEARCH AND PRACTICE
April 2011, Vol 101, No. 4 | American Journal of Public Health Lee et al. | Peer Reviewed | Research and Practice | 709

8/3/2019 ARS- Bruce Lee- Instituciones y Pacientes
http://slidepdf.com/reader/full/ars-bruce-lee-instituciones-y-pacientes 4/8
Hospital Characteristics Associated With
Measures of High Social Networking
An evaluation of whether hospital charac-
teristics (e.g., volume, percentage Medicare
patients, or other facility-level patient descrip-tors) were associated with social network
measures revealed that only annual volume
and percentage of patients with cancer diag-
noses were associated with increased network
connections in multivariable testing (Table 1).
Univariate analysis showed number of 2005
admissions, percentage of cancer patients, and
percentage with recent surgery to be associated
with in-degree, out-degree, and betweenness.
Percentage of patients with diabetes was asso-
ciated with in-degree; percentage of White
patients was associated with out-degree. Multi-
ple regression models (Table 1) indicated that
annual admissions was significantly associated
with high network connectivity using all 3
centrality measures; hospitals with higher ad-
missions volume tended to be connected to
more hospitals. Nevertheless, the strength of
association between annual volume and net-
work connectivity was modest. The only other
variable associated with high connectivity was
percentage of cancer patients; hospitals with
higher percentages of cancer patients were
more likely to receive patients that had been
at other hospitals and to serve as the central
point of mixing, connecting hospital pairs that
otherwise would not have been connected.
Although some correlation existed between
geographic and geodesic distances, this corre-
lation was well below 100%. Hospitals in close
geographic proximity were somewhat more
likely to share patients, but much patient
sharing occurred between distant hospitals. For
the TPS network (N ‡10), correlations were
only modest (sending patients: q=0.42; re-
ceiving patients: q=0.44), meaning that geo-
graphic proximity accounted for less than half
of the patient-sharing likelihood. This likeli-
hood increased somewhat for higher thresh-
olds (for ‡100 patients, sending: q=0.57; re-
ceiving: q= 0.61).
Reducing the time horizon had some effects,
demonstrating that significant proportions of
patient sharing occurred in time frames that
were longer than 30 days. The 30-day TPS
network was less dense (had fewer connec-
tions) than was the year-long TPS network
Note. Results shown are for the total patient-sharing network at the‡100 patients threshold. The star represents the ego
hospital.
FIGURE 2—Ego networks depicting 1-step connections of a relatively isolated hospital (a),
moderately connected hospital (b), and expansively connected hospital (c): 2005–2006,
Orange County, CA.
RESEARCH AND PRACTICE
710 | Research and Practice | Peer Reviewed | Lee et al. American Journal of Public Health | April 2011, Vol 101, No. 4

8/3/2019 ARS- Bruce Lee- Instituciones y Pacientes
http://slidepdf.com/reader/full/ars-bruce-lee-instituciones-y-pacientes 5/8
(74.1% vs 81.1% at patient threshold‡1). The
30-day to 1-year network density ratios were
91.4%, 70.9%, and 21.4% at patient thresholds
of at least1, at least10, and at least100 patients,respectively. The diameter for the threshold of
10 or more patients (4) was the same for the
30-day TPS network and for the 1-year TPS
network. However, increasing the threshold
to at least 100 showed considerable difference
in diameter (2 compared with 7). Centrality
measures also varied. Hospital out-degree
ranged from 0 to 2 (mode=0), in-degree
ranged from 0 to 4 (mode=0), and between-
ness ranged from 0 to 1 (mode =0). Despite
these significant differences, the same number
of hospitals had greater out-degrees than in-degrees (8) and in-degrees than out-degrees (6)
as in the year-long network. The ego networks
of the 30-day TPS were also smaller at the
patient threshold of 100 or more. The largest
ego network had only 4 connections (com-
pared with 8 in the1-year network); its network
density ranged from 0 to 50 (median=0),
compared with the 0 to 100 seen in the year-
long network.
DISCUSSION
Researchers have used social network anal-
ysis to characterize the transmission of infec-
tious diseases, information (e.g., gossip), social
preferences (e.g., clothing styles), and habits (e.g.,
alcoholic beverage consumption) across popu-
lations of people.7 Social network analysis can
identify which players within a network may be
more influential and how changing players may
affect others.4,12,7 Analysis and understanding
of a social network can facilitate predictions of
the ramifications of different policies and
interventions.12,7,16 Social network analysis can
also help identify closely associated groups,
helping researchers and policymakers tailor pol-
icies and interventions.12
For readers unfamiliar with the US health
care system, it is important to realize that US
hospital patient sharing may be driven by
either the patient or the health care provider.
Many patients can choose which hospital they
use; some may select services and providers at
different locations.17,18 A patient’s health insur-
ance policy may be purchased individually,
purchased through or provided by employers, or
purchased through or provided by the state or
federal government (for low-income people or
those aged 65 years or older). The patient’s
insurance coverage determines the patient’s op-
tions for hospital admission, with some policies
being more restrictive.17,18 Each hospital accepts
reimbursement from a certain range of insurance
policies; changes in a patient’s policy may cause
changes in the hospitals available to that patient.
Uninsured patients have no such restrictions,
as long as they can pay their own expenses.
Alternatively, one hospital’s health care pro-
viders may refer or transfer patients to another
hospital. Hospitals that only provide basic ser-
vices may send patients with more complicated
medical problems to another hospital that offers
more comprehensive specialty care.19,20 A hos-
pital (or providers in that hospital) may arrange
to send patients to or receive patients from
specific hospitals or providers.18,21
Our analysis demonstrated that Orange
County hospitals are, like people, highly and
heterogeneously interconnected. Different
hospitals may influence the network in differ-
ent ways. In particular:
d Many hospital pairs shared more than 100
patients throughout the year (high network
density), and very few went ‘‘untouched’’ by
patients from other hospitals (low network
diameter).d Patient sharing was often unequal: hospitals
sometimes received patients from many
other hospitals (high in-degree) but sent
patients to few hospitals (low out-degree).d Some hospitals were heavily involved (high
betweenness) in patient sharing.d Some shared patients with many hospitals
(extensive ego network), and others shared
patients with few hospitals (limited ego network)
These findings have numerous implica-
tions. First, a hospital is not an island when
making plans that could affect its patient
population, such as disease control measures,
patient education and prevention programs,
and fiscal policies. A hospital’s decisions may
affect other connected hospitals and vice
versa.7,20 Second, such an analysis could help
public health officials forecast disease epidemi-
ology, as in the spread of hospital-acquired
infection,7,12,22 or patient demographics, such as
predicting whether an increase in intravenous
drug use or chronic disease prevalence will
eventually be seen in other hospitals. For exam-
ple, changes in a hospital’s patient population
may immediately affect hospitals with which it
has close ties.23,24
Third, when regional public health policies
such as patient education or disease control
measures are implemented in a situation dur-
ing which scarce resources preclude blanket
policy changes, highly interconnected hospitals
(e.g., high betweenness) may be initial targets.25
Fourth, such an analysis may enable better un-
derstanding of legal and fiscal policy change
ramifications.26,27 For example, closing a highly
interconnected hospital or reducing its servicescould affect the region more than doing the same
for a relatively isolated hospital.26,28–30 Finally,
focusing only on direct transfers overlooks
a large proportion of total patient sharing. A
hospital administrator may know where a hospi-
tal directly transfers patients to or receives them
from but may lack records of where a hospital’s
patients have been if they had intervening stays at
home. In this way, hospitals may be unknowingly
linked to each other.
TABLE 1—Multivariate Associations Between Social Network Measures and
Hospital Characteristics: Orange County, CA, 2005–2006
Social Network
Measure Covariate
Coefficient
(SD; 95% CI) P (P > t )
Spearman Correlation
Coefficient
I n-deg ree 2005 admiss ions 0.000096 (0. 000034; 0.000027, 0.00017) .008 0.56
In-degree % cancer 21.98 (9.55; 2.44, 41.51) .029 0.61
Out -deg ree 2005 admiss ions 0.00014 (0. 000029; 0.000085, 0.00020) .001 0.72
Betweenness 2005 admissions 0.0033 ( 0.0019; –0.00059, 0.0073) .093 0.61
Betweenness % cancer 1061.03 (607.72; –181.91, 2303.96) .091 0.53
Note. CI = confidence interval. Results shown are for the total patient-sharing network at the‡100 patients threshold.
RESEARCH AND PRACTICE
April 2011, Vol 101, No. 4 | American Journal of Public Health Lee et al. | Peer Reviewed | Research and Practice | 711

8/3/2019 ARS- Bruce Lee- Instituciones y Pacientes
http://slidepdf.com/reader/full/ars-bruce-lee-instituciones-y-pacientes 6/8
Additionally, our study identified hospital
characteristics that may predict interconnec-
tivity and, in turn, potential public health in-
tervention targets. High patient sharing was not
limited to the only major academic center inOrange County. As our study shows, hospital
patient volume was a predictor of intercon-
nectivity, but not a powerful one; having more
patients did not necessarily mean connections
to more hospitals. Not surprisingly, hospitals
with high percentages of cancer patients also
tended to receive patients from many other
hospitals, although this too was not limited to
the academic center. This finding likely reflects
2 facts: cancer treatment facilities are tertiary
care hospitals that receive many referrals, and
a wide range of private-sector hospitals are
increasingly delivering specialty care.
These findings suggest that patient volume
and cancer referrals are part (but not all) of the
patient-sharing picture. Future studies can ex-
plore other potential predictors of high patient
sharing, such as hospital financial relationships.
Nevertheless, without identifying hospital-
based characteristics that strongly and consis-
tently predict patient sharing, regional data
sources that evince actual patient sharing
among hospitals may provide invaluable in-
formation about how patient sharing affects
transmission of pathogens, behaviors, and(mis)conceptions.
Although studies have evaluated posttransfer
patient outcomes, few have identified factors
leading to patient transfer and sharing. Some
have shown that hospitals transfer patients when
they lack the necessary medical expertise, ser-
vices, or equipment, or when patients lack
adequate insurance.31–36 Others have shown
that a dearth of intensive care unit beds, renal
support services, or other resources (e.g., limited
staffing and expertise, equipment, supplies, and
technological capabilities) drives interhospital
transfers.32,37 Hospitals that tended to send pa-
tients instead of receiving them were more likely
to be smaller and less likely to have a medical
school affiliation or advanced surgical capacity.19
In addition to annual volume and cancer
patient proportion, we found that geographic
proximity was somewhat correlated with 2
hospitals being closely connected, but many
hospitals shared patients with more distant
hospitals (correlation between geodesic and
geographic <100%). Several factors could be
contributing to this state of affairs, such as
referral patterns or fiscal relationships between
hospitals, insurance coverage, and patients
traveling substantial distances to procure dif-
ferent health care services (i.e., hospital shop).
Limitations
Our study has several limitations. First, data
were from a limited time period; it is unclear
how patient sharing may change over longer
periods of time. Second, the population was
limited to patients with a unique identifier that
enabled tracking across hospitals, but 25%
of patients (half of whom were newborns)
lacked this identifier, potentially leading to
underestimations of patient sharing. Third, this
study only assessed a limited number of hos-
pital characteristics. Data on other characteris-
tics and factors that may affect patient sharing
(e.g., financial and legal data; greater details
on health care services offered, such as types
of cancer treatments; and size and composition
of hospital staff) were unavailable. Further
work may examine how well these and other
characteristics can predict patient sharing and
serve as surrogates for more complicated social
networking measures. Finally, the generaliz-
ability of our findings to other counties is
unclear, although a large diversity of hospital
types and sizes were represented.
Conclusions
Hospitals in Orange County, California, were
highly and heterogeneously interconnected
with each other, such that different hospitals
influenced the network in different ways. Ap-
plying social network principles and constructs
to a region’s hospitals may assist public health
officials, policymakers, hospital administrators,
and researchers in designing interventions to
monitor and control diseases. j
About the AuthorsBruce Y. Lee, Sarah M. McGlone, Yeohan Song, and Rachel R. Bailey are with the Public Health Computational and Operations Research Group, Department of Epidemiology,University of Pittsburgh Graduate School of Public Health,Pittsburgh, PA; and the Departments of Medicine and Biomedical Informatics, University of Pittsburgh School of Medicine, Pittsburgh. Taliser R. Avery and Richard Platt are with the Department of Population Medicine, Harvard Medical School, Boston, MA, and Harvard Pilgrim Health Care Institute, Boston. Stephen Eubank is with the Virginia Bioinformatics Institute, Virginia Tech University, Blacksburg.
Chung-Chou Chang is with the Department of Medicine,University of Pittsburgh School of Medicine, Pittsburgh, PADiane K. Wagener is with RTI International, Research
Triangle Park, NC. Donald S. Burke is with the Departmentof Epidemiology, University of Pittsburgh Graduate School ofPublic Health, Pittsburgh. Susan S. Huang is with the Division
of Infectious Diseases and Health Policy Research Institute,University of California, Irvine.
Correspondence should be sent to Bruce Y. Lee, Public Health Computational and Operations Research, Universityof Pittsburgh, 200 Meyran Ave, Suite 200, Pittsburgh,PA 15213 (e-mail: [email protected]). Reprints can be ordered at http://www.ajph.org by clicking the ‘‘Reprints/ Eprints’’ button.
This article was accepted July 3, 2010.
ContributorsB.Y. Lee, S.M. McGlone, and Y. Song conceptualized,designed, and conducted the study, experiments, and
analyses; interpreted the data and results; and draftedthe article. T. R. Avery contributed to the collection,organization, and interpretation of the data and the
design of the experiments. S. Eubank and D.K. Wagenercontributed to the design of the experiments and in-terpretation of the data. C.-C. Chang performed statisticalanalyses. R. R. Bailey contributed to analysis and in-terpretation of results. D. S. Burke and R. Platt contrib-uted to data collection and the design and execution of the study experiments. S. S. Huang contributed to thedesign of the study and experiments and to the in-terpretation of the data and results. All authors partici-
pated in revising and editing the article.
AcknowledgmentsThis study was supported by grants from the NationalInstitute General Medical Sciences Models of Infectious
Disease Agent Study (1U54GM088491-0109 and1U01 GM076672) and the National Institutes of Health(K23AI64161).
The funders had no role in the design and conduct ofthe study; collection, management, analysis, and inter-
pretation of the data; and preparation, review, or ap- proval of the article.
Human Participant ProtectionNo protocol approval was required because the studyused publicly available secondary data.
References1. Haley RW, Hightower AW, Kabbaz RG, et al. Theemergence of methicillin-resistant Staphyoloccus aureus infections in United States hospitals. Ann Intern Med .1982;97(3):297–308.
2. Pittet D. Infection control and quality health carein the new millenium. Am J Infect Control . 2005;33(5):258–267.
3. Page D. Patient care: spread of infectious diseasesmay run high with patient sharing. Hosp Health Netw .2009;83(9):12.
4. Drewe JA. Who infects whom? Social networks andtuberculosis transmission in wild meerkats. Proc Biol Sci 2009;277(1681):633–642.
5. Dube C, Ribble C, Kelton D, McNab B. A review ofnetwork analysis terminology and its application to foot-and-mouth disease modelling and policy development.Transbound Emerg Dis . 2009;56(3):73–85.
RESEARCH AND PRACTICE
712 | Research and Practice | Peer Reviewed | Lee et al. American Journal of Public Health | April 2011, Vol 101, No. 4

8/3/2019 ARS- Bruce Lee- Instituciones y Pacientes
http://slidepdf.com/reader/full/ars-bruce-lee-instituciones-y-pacientes 7/8
6. Martınez-Lo pez B, Perez AM, Sa ´nchez-Vizcaıno JM.Social network analysis: review of general concepts anduse in preventiveveterinary medicine. Transbound Emerg
Dis . 2009;56(4):109–120.
7. Luke DA, Harris JK. Network analysis in public
health: history, methods, and applications. Annu Rev
Public Health . 2007;28:69–93.
8. Mercken L, Snijders TA, Steglich C, de Vries H.Dynamics of adolescent friendship networks and smok-ing behavior: social network analyses in six Europeancountries. Soc Sci Med . 2009;69(10):1506–1514.
9. Vaananen A, Kouvonen A, Kivimaki M, Pentti J,Vahtera J. Social support, network heterogeneity, andsmoking behavior in women: the 10-town study. Am J
Health Promot . 2008;22(4):246–255.
10. Lurie SJ, Fogg TT, Dozier AM. Social networkanalysis as a method of assessing institutional culture:three case studies. Acad Med . 2009;84(8):1029–1035.
11. Boots M, Childs D, Reuman DC, Mealor M. Localinteractions lead to pathogen-driven change to host
population dynamics. Curr Biol . 2009;19(19):1660–
1664.
12. Koopman JS. Infection transmission science andmodels. Jpn J Infect Dis . 2005;58(6):S3–S8.
13. Smieszek T. A mechanistic model of infection: whyduration and intensity of contacts should be included inmodels of disease spread. Theor Biol Med Model . 2009;6:25.
14. Office of Statewide Health Planning and Develop-ment. MIRCal - Inpatient Data Reporting Manual, 7thEdition (11/10). Available at: http://www.oshpd.ca.gov/HID/MIRCal/IPManual.html. Accessed December 14,
2010.
15. Hanneman RA, Riddle M. Introduction to Social
Network Methods . Riverside, CA: University of California,Riverside; 2005.
16. Koopman J. Modeling infection transmission. Annu
Rev Public Health . 2004;25:303–326.
17. Chernew M, Scanlon D, Hayward R. Insurance typeand choice of hospital by coronary artery bypass graft surgery. Health Serv Res . 1998;33(3):447–466.
18. Forrest CB. Primary care gatekeeping and referrals:effective filter or failed experiment? BMJ . 2003;326(7391):692–695.
19. Iwashyna TJ, Christie JD, Moody J, Kahn JM, AschDA. The structure of critical care transfer networks. Med
Care . 2009;47(7):787–793.
20. Bolland JM, Wilson JV. Three faces of integrativecoordination: a model of interorganizational relations incommunity-based health and human services. Health Serv
Res . 1994;29(3):341–366.21. Shea D, Stuart B, Vasey J, Nag S. Medicare physicanreferral patterns. Health Serv Res . 1999;34(1):331–348.
22. Cooper BS, Medley GF, Stone SP, et al. Methicillin-resistant Staphylococcus aureus in hopsitals and the
community: stealth dynamics and control catastrophes.Proc Natl Acad Sci USA . 2004;101(27):10223–10228.
23. Donker T, Wallinga J, Grundmann H. Patient referral patterns and the spread of hospital-aquiredinfections through national health care networks. PLOS
Comput Biol . 2010;6(3):e1000715.
24. Smith DL, Levin SA, Laxminarayan R. Strategic interactions in multi-dimensional epidemics of antibiotic
resistance. Proc Natl Acad Sci USA. 2005;102(8):3153–3158.
25. Gibbons DE. Interorganizational network structuresand diffusion of information through a health system. Am
J Public Health . 2007;97(9):1684–1692.
26. Luke RD. Spatial competition and cooperation inlocal hospital markets. Med Care Res Rev . 1991;48(2):207–237.
27. Hsiao WC, Heller PS. What Macroeconomists Should
Know About Health Care Policy . Washington, DC: In-ternational Monetary Fund; 2007.
28. Iwashyna TJ, Christie JD, Kahn JM, Asch DA. Uncharted paths: hospital networks in critical care. Chest .2009;135(3):827–833.
29. Ho V, Hamilton BH. Hospital mergers and aquisi-tions: does market consolidation harm patients? J Health
Econ . 2000;19(5):767–791.
30. White C, Seagrave S. What happens when hospital- based skilled nursing facilities close? A propensity scoreanalysis. Health Serv Res . 2005;40(6, pt 1):1883–1897.
31. Himmelstein DU, Woolhandler S, Harnly M, et al.Patient transfers: medical practice as social triage. Am J
Public Health . 1984;74(5):494–497.
32. Mackenzie PA, Smith EA, Wallace PGM. Transfer of adults between intensive care units in the United King-dom: postal survey. BMJ . 1997;314(7092):1455–1456.
33. Avitzour M, Abaronson-Daniel L, Peleg K. Second-ary transfer of trauma patients: rationale and character-istics. Isr Med Assoc J . 2006;8(8):539–542.
34. Bertazzoni G, Cristogani M, Ponzanetti A, et al. Scant justification for interhospital transfers: a cause of reducedefficiency in the emergency department. Emerg Med J .2008;25(9):558–561.
35. Durairaj L, Will JG, Torner JC, Doebbeling BN.Prognostic factors for mortality following interhospital
transfers to the medical intensive care unit of a tertiaryreferral center. Crit Care Med . 2003;31(7):1981–1986.
36. TeresiJA, HolmesD, Bloom HG,Monaco C, RosenS.Factors differentiating hospital transfers from long-termcare facilities with high and low transfer rates. Gerontol-
ogist . 1991;31(6):795–806.
37. Wakefield DS,WardM, MillerT, et al.Intensive careunit utilization and interhospital transfers as potentialindicators of rural hospital quality. J Rural Health .2004;20(4):394–400.
RESEARCH AND PRACTICE
April 2011, Vol 101, No. 4 | American Journal of Public Health Lee et al. | Peer Reviewed | Research and Practice | 713

8/3/2019 ARS- Bruce Lee- Instituciones y Pacientes
http://slidepdf.com/reader/full/ars-bruce-lee-instituciones-y-pacientes 8/8
Copyright of American Journal of Public Health is the property of American Public Health Association and its
content may not be copied or emailed to multiple sites or posted to a listserv without the copyright holder's
express written permission. However, users may print, download, or email articles for individual use.

![Lee, bruce & uyehara, m. el método de combate de bruce lee. entrenamiento básico[1]](https://static.fdocumento.com/doc/165x107/5588dbabd8b42a0b6e8b4679/lee-bruce-uyehara-m-el-metodo-de-combate-de-bruce-lee-entrenamiento-basico1.jpg)