Artículo Input
22
The Varieties of Speech to Young Children Janellen Huttenlocher University of Chicago Marina Vasilye va Boston College Heidi R. Waterfall Unive rsity of Chica go and Corne ll Unive rsity Jack L. Vevea University of California, Santa Cruz Larry V. Hedges University of Chicago This article examines caregiver speech to young children. The authors obtained several measures of the speech used to children during early language development (14–30 months). For all measures, they found substantial variation across individuals and subgroups. Speech patterns vary with caregiver education, and the differences are maintained over time. While there are distinct levels of complexity for different caregivers, there is a common pattern of increase across age within the range that characterizes each educational group. Thus, caregiver speech exhibits both long-standing patterns of linguistic behavior and adjustment for the interlocutor. This information about the variability of speech by individual caregivers provides a framework for systematic study of the role of input in language acquisition. Keywords: caregiver speech, caregiver education, speech to children. Supplemental materials: http://dx.doi.org/1 0.1037/0012 -1649.43.5.1062 .supp This article presents a longitudinal study of caregiver speech to young children from 14 to 30 months of age. During this period, children progre ss from single-wo rd uttera nces to utter ances in which words are combined to form sentenc es. Clearly, to acqui re a language, children must be exposed to that language, both the words and the ways they can be combined. To determine what role input plays in acquisition, it is necessary to empirically examine caregiver speech and its relation to the development of language in the child. Yet claims about the role of language input have been based more on theoretical assumptions than on systematic obser- vation. It has been assumed that the role of input is a limited one—that there is little variation in the speech of different care- givers or in the syntactic development of different children. Ac- quisition has been seen as emerging from innate and universally ava ila ble me cha nis ms (Ba ker , 2001; Chomsk y, 1986; Lidz & Gleitman, 2004). As Chomsky (1986) argued, “It is plausible to suppos e that apart from patholo gy . . . such variat ion as there may be is marginal and can be safely ignored across a broad range of linguistic investigation” (p. 18). Further, caregiver speech has been said to involve errors, false starts, and so forth and may not be sufficient for inducing grammatical rules (e.g., Lidz, Gleitman, & Gleitman, 2003; Lidz, Waxman, & Freedman, 2003; Newmeyer, 2003). Some recent investigators have adopted a different theoretical per spe ctive, one in whi ch input is seen as the source of chi ld langua ge (e.g. , Goldbe rg, 1995; Jackendof f, 2002; Toma sello, 2003). For example, Tomasello (2003) has argued that language input, when coupled with domain-general learning skills, is suffi- cie nt to der ive a ful l adult grammar. There is emp iri ca l work indicating that there are substantial variations in language input and that these are related to diffe rence s in children’s language development. While such findings are correlational, some of the studies strongly suggest that, at least in part, observed relations refle ct a causal role of the input in ac qui sition (e.g. , Hoff- Ginsberg, 1998; Huttenlocher, Vasilyeva, Cymerman, & Levine, 2002 ). Als o, rec ent finding s have rev ealed powerf ul lea rni ng mech anisms that allow infants to extra ct stati stica l regula ritie s from language input (e.g., Saffran, 2001). Together these findings suggest that caregiver speech may be a driving force in syntactic devel opmen t (e.g., Ander sen, 1973; Bybee , 1998; Elman, 1993). The long-term goal of our program of research is to establish the role of input in children’s language development. However, the investigation of caregiver speech itself involves a major research effort, and it is the focus of the present article. We propose to Janel len Hutte nloch er, Depar tment of Psych olog y, Unive rsity of Chi- cago; Marina Vasilyeva , Lynch School of Educa tion , Bost on Coll ege; Heidi R. Waterfall, Department of Psychology, University of Chicago, and Department of Psychology, Cornell University; Jack L. Vevea, Department of Psychology, University of California, Santa Cruz; Larry V. Hedges, Department of Sociology, University of Chicago. Larry V. Hedges is now at the Department of Statistics and the Depart- ment of Education & Social Policy, Northwestern University. This research presented was supported by National Institutes of Health Gra nt PO1 HD4 060 5. We tha nk Sus ann e Gah l, Sus an Lev ine , Ste lla Lourenco, Nora Newcombe, and Mary C. Potter for their helpful comments on the manuscript. Correspondence concerning this article should be addressed to Janellen Hutte nloch er, Depar tment of Psych olog y, Unive rsity of Chic ago, 5848 South University Avenue, Chicago, IL 60637. E-mail: [email protected] Developmental Psychology Copyright 2007 by the American Psychological Association 2007, Vol. 43, No. 5, 1062–1083 0012-1649/07/$12.00 DOI: 10.1037/0012-1649.43.5.1062 1062
-
Upload
silviavscremer -
Category
Documents
-
view
220 -
download
0
Transcript of Artículo Input

8/8/2019 Artículo Input
http://slidepdf.com/reader/full/articulo-input 1/22
The Varieties of Speech to Young Children
Janellen HuttenlocherUniversity of Chicago
Marina VasilyevaBoston College
Heidi R. WaterfallUniversity of Chicago and Cornell University
Jack L. VeveaUniversity of California, Santa Cruz
Larry V. HedgesUniversity of Chicago
This article examines caregiver speech to young children. The authors obtained several measures of the
speech used to children during early language development (14–30 months). For all measures, they found
substantial variation across individuals and subgroups. Speech patterns vary with caregiver education,
and the differences are maintained over time. While there are distinct levels of complexity for different
caregivers, there is a common pattern of increase across age within the range that characterizes each
educational group. Thus, caregiver speech exhibits both long-standing patterns of linguistic behavior andadjustment for the interlocutor. This information about the variability of speech by individual caregivers
provides a framework for systematic study of the role of input in language acquisition.
Keywords: caregiver speech, caregiver education, speech to children.
Supplemental materials: http://dx.doi.org/10.1037/0012-1649.43.5.1062.supp
This article presents a longitudinal study of caregiver speech to
young children from 14 to 30 months of age. During this period,
children progress from single-word utterances to utterances in
which words are combined to form sentences. Clearly, to acquire
a language, children must be exposed to that language, both the
words and the ways they can be combined. To determine what role
input plays in acquisition, it is necessary to empirically examine
caregiver speech and its relation to the development of language in
the child. Yet claims about the role of language input have been
based more on theoretical assumptions than on systematic obser-
vation. It has been assumed that the role of input is a limited
one—that there is little variation in the speech of different care-
givers or in the syntactic development of different children. Ac-
quisition has been seen as emerging from innate and universally
available mechanisms (Baker, 2001; Chomsky, 1986; Lidz &
Gleitman, 2004). As Chomsky (1986) argued, “It is plausible to
suppose that apart from pathology . . . such variation as there may
be is marginal and can be safely ignored across a broad range of
linguistic investigation” (p. 18). Further, caregiver speech has been
said to involve errors, false starts, and so forth and may not be
sufficient for inducing grammatical rules (e.g., Lidz, Gleitman, &
Gleitman, 2003; Lidz, Waxman, & Freedman, 2003; Newmeyer,
2003).
Some recent investigators have adopted a different theoretical
perspective, one in which input is seen as the source of child
language (e.g., Goldberg, 1995; Jackendoff, 2002; Tomasello,
2003). For example, Tomasello (2003) has argued that language
input, when coupled with domain-general learning skills, is suffi-
cient to derive a full adult grammar. There is empirical work
indicating that there are substantial variations in language input
and that these are related to differences in children’s language
development. While such findings are correlational, some of the
studies strongly suggest that, at least in part, observed relationsreflect a causal role of the input in acquisition (e.g., Hoff-
Ginsberg, 1998; Huttenlocher, Vasilyeva, Cymerman, & Levine,
2002). Also, recent findings have revealed powerful learning
mechanisms that allow infants to extract statistical regularities
from language input (e.g., Saffran, 2001). Together these findings
suggest that caregiver speech may be a driving force in syntactic
development (e.g., Andersen, 1973; Bybee, 1998; Elman, 1993).
The long-term goal of our program of research is to establish the
role of input in children’s language development. However, the
investigation of caregiver speech itself involves a major research
effort, and it is the focus of the present article. We propose to
Janellen Huttenlocher, Department of Psychology, University of Chi-
cago; Marina Vasilyeva, Lynch School of Education, Boston College;
Heidi R. Waterfall, Department of Psychology, University of Chicago, and
Department of Psychology, Cornell University; Jack L. Vevea, Department
of Psychology, University of California, Santa Cruz; Larry V. Hedges,
Department of Sociology, University of Chicago.
Larry V. Hedges is now at the Department of Statistics and the Depart-
ment of Education & Social Policy, Northwestern University.
This research presented was supported by National Institutes of Health
Grant PO1 HD40605. We thank Susanne Gahl, Susan Levine, Stella
Lourenco, Nora Newcombe, and Mary C. Potter for their helpful comments
on the manuscript.
Correspondence concerning this article should be addressed to Janellen
Huttenlocher, Department of Psychology, University of Chicago, 5848
South University Avenue, Chicago, IL 60637. E-mail: [email protected]
Developmental Psychology Copyright 2007 by the American Psychological Association2007, Vol. 43, No. 5, 1062–1083 0012-1649/07/$12.00 DOI: 10.1037/0012-1649.43.5.1062
1062
8/8/2019 Artículo Input
http://slidepdf.com/reader/full/articulo-input 2/22
determine whether caregiver speech changes systematically as the
child develops and if there are substantial variations in speech
among caregivers that persist over time. Such findings would
indicate that it is important to examine the relation of input to
language development. Before presenting our study, we briefly
review findings from prior research on differences in caregiver
speech over time and individual differences across speakers.
Does Caregiver Speech Change Over Time?
It has been claimed that caregiver speech becomes more com-
plex as children develop (e.g., Snow, 1972). If it does, that would
suggest that parents are adjusting their speech to changing char-
acteristics of the child. General questions concerning the adjust-
ment of caregiver speech to children’s language can be examined
by investigating just the speech of caregivers, either in cross-
sectional or in longitudinal studies. This type of investigation can
provide information as to what aspects of caregiver speech do or
do not change systematically with child age. However, questions
as to whether caregivers fine tune their speech to the child’s
language level will require examination of parent– child interaction(e.g., Berko-Gleason, 1977; Snow, Perlmann, & Nathan, 1987).
Findings from cross-sectional studies suggest that caregiver
speech varies as a function of child age. For example, Snow (1972)
compared speech to 2-year-olds and 10-year-olds. She found that
parental speech to the younger group involved more redundancy as
well as fewer clauses per utterance. Other studies have examined
caregiver speech over a narrower range of child age than that
studied by Snow (1972). Phillips (1973) found differences in
maternal mean length of utterance in speech addressed to 18-
month-olds versus 28-month-olds. Rondal (1980) examined input
to children at 18 months and 36 months of age and found differ-
ences in “lexical diversity” (as measured by the type/token ratio),
syntactic complexity, as well as utterance length. Further, de-creases were found in imperatives, repetitions, and expansions.
However, it should be noted that the samples in these studies were
small, which is problematic for cross-sectional comparisons of
speech to children of different ages since child age may be con-
founded with other characteristics.
Although it has been claimed that speech to very young children
involves simplified syntax (e.g., Snow, 1972), the evidence from
longitudinal studies is mixed as to whether complexity of caregiv-
ers’ speech actually increases as children become older. Kaye
(1980) found that speech to young infants (less than 26 weeks)
included shorter utterances and was more repetitive than speech to
2-year-olds. However, Snow (1977) found no difference in utter-
ance length for mothers when speaking to 3-month-olds versus
18-month-olds. Also, Kavanaugh and Jirkovsky (1982) found nodifferences in utterance length in parents’ speech when children
were 9 months, 12 months, and 15 months, although exact repe-
titions decreased.
Furrow, Nelson, and Benedict (1979) examined the speech of
mothers over a slightly older age range—at 18 months and 27
months old—and found no significant differences in syntactic
characteristics of speech such as number of clauses per utterance
or use of different types of questions, auxiliaries, and so forth.
However, exact repetitions decreased with age. Gleitman, New-
port, and Gleitman (1984) examined speech to children from 18 to
21 months and again from 24 to 27 months. While the complexity
of mother speech (number of clauses per utterances and mean
length of utterance) increased slightly and repetitions decreased,
the authors concluded that “the mothers’ usage does not change
dramatically during the child’s learning period from one to three
years” (p. 65). Rowland, Pine, Lieven, and Theakston (2003)
found no change in maternal use of wh questions over a 1-year
period from 2 to 3 years of age, although Theakston, Lieven, Pine,and Rowland (2005) found fewer questions as children approached
3 years than at 2 years.
In summary, existing longitudinal studies of caregiver speech do
not provide a clear picture of change over time. The findings of
different studies do not always agree, as might be expected given
the small samples used. The largest samples included 12 partici-
pants at each age (i.e., Gleitman et al., 1984; Snow, 1972). Furrow
et al. (1979) examined only seven families, and Kavanaugh and
Jirkovsky (1982) included only four. Only the earliest stages of
syntactic development have been examined, and, further, studies
have used different measures. Clearly, existing studies do not
permit assessment of the relation of caregiver language to child
age. In the present study, we systematically examine caregiver
speech using a broad range of measures over an extended period in
a diverse and sizeable group of families.
Are There Individual Differences in Caregiver Speech?
There is suggestive evidence that there are individual differ-
ences in the speech of caregivers related to demographic factors
(e.g., socioeconomic status [SES]) and that these are related to the
speech of their children (e.g., Elardo, Bradley, & Caldwell, 1977;
Hart & Risley, 1992; Price & Hatano, 1991). Lower SES mothers
talk less and spend less time in mutual activities with their children
than do middle-SES mothers, and their speech is less contingent on
the child’s speech (e.g., Bee, Van Egeren, Streissguth, Nyman, &
Leckie, 1969; Farian & Haskins, 1980; Heath, 1982; Hess &
Shipman, 1965). Further, middle-SES mothers include more
language-teaching speech during play with children than do lower
SES mothers (Hammer & Weiss, 1999). Hoff (2003a, 2003b)
found that several measures of mother speech (utterance length,
number of word types, and number of word tokens) were corre-
lated with SES and also were predictive of child vocabulary.
Similarly, Pan, Rowe, Spier, and Tamis-Lemonda (2004) found
that maternal educational level was associated with children’s
vocabularies (as measured by the Peabody Picture Vocabulary
Test, 3rd ed.; Dunn & Dunn, 1997).
Caregiver speech is not generally examined longitudinally in
these studies. Hence, direct evidence is lacking with respect to
whether observed individual differences are long standing. How-ever, there is suggestive evidence that SES differences may indeed
be relatively permanent since speech to other adults, like that to
young children, varies with SES. Two studies have found differ-
ences in adult-to-adult speech in different SES groups. Hoff
(2003b) found differences among mothers from different SES
groups when talking both to adults and to children. Van den
Broeck (1977) found that syntactic complexity was related to
educational level for specific contexts in adult-to-adult discourse.
Although these studies are suggestive, systematic research on the
nature of the syntax of caregiver speech in different SES groups
remains to be carried out.
1063SPEECH TO YOUNG CHILDREN
8/8/2019 Artículo Input
http://slidepdf.com/reader/full/articulo-input 3/22
Studies that have examined particular aspects of syntax show
substantial individual differences in caregiver speech. These stud-
ies have shown an association with corresponding aspects of
children’s language. For example the proportion of auxiliary-
fronted questions varies across parents and is associated with more
rapid growth of auxiliaries in children (e.g., Furrow et al., 1979;
Newport, Gleitman, & Gleitman, 1977). Naigles and Hoff-Ginsberg (1998) found that the relative verb frequency and the
diversity of syntactic environments in child-directed speech were
strong indicators of early verb use. Hoff-Ginsberg (1986) found
that the average number of noun phrases per utterance in mothers’
speech was a positive predictor of the same measure in children’s
speech. Lastly, the proportion of multiclause sentences by care-
givers is related to children’s comprehension and production of
multiclause sentences (Huttenlocher et al., 2002). Again, the data
from caregivers have not been longitudinal so that direct evidence
is lacking as to whether observed differences are long lasting.
There is evidence of situationally based variations in caregiver
speech. For example, mothers vary speech to a target child de-
pending on who else is present. Snow (1982) found that toddlers
received fewer than half as many utterances from caregivers whenan older sibling was present. Jones and Adamson (1987) also
found that quantity of speech (number of utterances) was affected
by the presence of an older sibling. Only measures of quantity
were affected (number of tokens and number of utterances); mea-
sures such as mean length of utterance were not (Oshima-Takane
& Robbins, 2003). Further, there is evidence that mothers speak
differently when addressing their firstborn versus their later-born
children. They use longer utterances and address more metalin-
guistic utterances to their children than do mothers of later borns
(Hoff-Ginsberg, 1998; Jones & Adamson, 1987).
In summary, fundamental questions about whether there are
long-lasting individual differences in the speech of different care-
givers have not been answered by research on caregiver speech todate. Given the sparsity of longitudinal studies of caregiver speech,
it is not yet clear to what extent there are substantial and long-term
differences among different caregivers. Further, existing studies
have not examined a wide range of characteristics of caregiver
speech.
The Present Study
The review of existing literature above indicates a need for
further longitudinal data on caregiver speech. Information on long-
standing characteristics of language to children is critical to deter-
mining how input may be related to development. The present
study explores the nature of caregiver speech during the period of
early syntactic growth. We intend to examine the nature of indi-vidual differences among caregivers in child-directed speech, de-
termine whether these are stable over time, and whether they are
systematically related to other variables such as child gender and
family income. We have developed a broad set of measures to
examine the characteristics of caregiver speech over time and to
explore variability across caregivers. We examine the factors that
may be associated with characteristics of their speech, including
both relatively stable family characteristics such as income and
education and contextual factors such as presence of older siblings.
The families in our study vary widely in socioeconomic back-
ground (education and income). Families were visited at five time
points, every 4 months during this period. The set of measures we
developed capture a variety of important characteristics of speech
to young children. Three kinds of measures were used: indicators
of the composition of speech (measures of clausal and constituent-
level complexity), indicators of the diversity of speech (number of
different words and the number of different kinds of sentences),
and indicators of quantity (numbers of words, utterances, andsentences). Using these measures of quantity, diversity, and com-
position, we examined the nature of individual differences in
caregiver speech and the pattern of change over time.
Participants
The present article includes data on 50 families from the greater
Chicago area who are a subset of 64 who are participating in a
larger longitudinal study. Recruitment for the larger study was
based on direct mailing to roughly 5,000 families living in targeted
zip codes and an advertisement in a free, monthly parent magazine.
Parents who responded to the mailing or advertisement were asked
to participate in a screening questionnaire over the phone. Infor-
mation gathered included child gender; parents’ income, educa-tion, and occupation; as well as race and ethnic identification. To
ensure a diverse sample, we chose families to match as closely as
possible the 2000 census data on family income and ethnicity for
the greater Chicago area.
The criteria for drawing the sample used in the present study
were the following. First, the study was limited to families in
which the primary language was English. Second, the sample was
limited to families where one parent was the primary caregiver
over the entire period being studied. Third, we included only
families that participated in at least four out of the five observation
sessions. The resulting sample consisted of 48 mothers plus 2
fathers (the children in these families included 26 boys and 24
girls). The families were subdivided into four educational levelsand six income levels. The numbers of families in different edu-
cational, income, and racial groups are shown in Table 1. The
numbers of families in which the target child was the firstborn,
second born, or had more than one older sibling also is shown in
Table 1.
Method
Families were visited once every 4 months at home. Included
here are data from caregivers during five visits at child age of 14,
18, 22, 26, and 30 months. During each visit, the caregiver and
child were videotaped for a 90-min period during which they
engaged in their ordinary daily activities. After the session was
completed, the tapes were transcribed at our lab. Transcriptioninvolved breaking the stream of speech into distinct utterances.
These utterances were then analyzed grammatically according to
the coding system presented below to characterize the composition
of the utterances. We did not use the formats for the CHILDES or
SALT databases because they were not well-suited to answering
our research questions.
The analysis of caregiver language is based on speech to target
children. One reason for restricting our study to child-directed
speech is that this speech sample can be reliably determined.
Although, in principle, children can learn from other-directed
speech, it is often unclear whether children are attending to speech
1064 HUTTENLOCHER ET AL.
8/8/2019 Artículo Input
http://slidepdf.com/reader/full/articulo-input 4/22
that is not directed to them. Further, children’s attention to other-
directed speech may vary with their language levels. Indeed, very
young children seem to require special prosodic features (mother-
ese) to attend to speech. Finally, findings showing substantial
relations to growth of syntactic skills have been based on speech
directed to target children (e.g., Barnes, Gutfreund, Satterly, &
Wells, 1983).
Reliability of transcription was established by having a second
individual independently transcribe 20% of the videotapes. The
reliability criterion was set at 95%: That is, the two transcribershad to be in agreement on 95% of the utterances. In rare cases
where the reliability coder disagreed with the transcriber for more
than 5% of utterances, disagreements were resolved with a third
judge. If the reliability coder and the transcriber agreed on at least
95% of utterances, the original transcriber’s data were used. Once
reliability was established, each transcript was subjected to lin-
guistic analysis, as described below. Reliability was also investi-
gated on 50% of the syntax-coded transcripts, and reliability be-
tween the syntax reliability coder and the primary syntax coder
was again set at 95%. The same procedure was used as above.
Treatment of Caregiver Speech
Our measures were designed to capture major characteristics of caregiver speech, spanning diversity as well as quantity of speech.
The measures address both the lexicon and syntax. Diversity
measures capture the different kinds of words and the different
kinds of syntactic structures caregivers produced. At least at the
extremes, diversity depends on quantity; the number of different
words (types) cannot exceed the total number of words (tokens),
and the number of different kinds of sentences cannot exceed the
total number of sentences. The compositional measures capture the
syntactic complexity of caregiver speech (e.g., the proportion of
complex sentences a caregiver produces). Composition is distinct
from quantity of speech.
Quantity Measures
We used three measures to assess the quantity of caregiver
speech. The first measure was the total number of words (i.e.,
tokens) produced by the caregiver. The remaining two were the
total number of utterances and the total number of sentences.
Tokens. To calculate the number of tokens, we counted thenumber of instances of words in the entire 90-min transcript. For
example, if a given mother said the word shoe 50 times in a
transcript but said nothing else, she would have 50 tokens; like-
wise, a mother who said 50 different words also would have 50
tokens. We excluded specific classes of words from our token
analysis, and by extension, the same classes were excluded from
all other measures as well. These classes were animal noises (e.g.,
baaa, bow wow, etc.), letters of the alphabet (except a and i), as
well as interjections such as ooooh, ouch, and uh-oh. Lastly,
parental imitations of infant babbling were also exempted (e.g.,
ka ka ka zero tokens). Utterances that contained only one of
the above forms were deleted before analysis began on the
transcript.
Utterances. For each participant, we calculated the total num-ber of utterances in the entire transcript. To arrive at this measure,
we divided the flow of speech into utterances based on intonation
and pauses, as well as conversational turn taking. An utterance
consisted of a single intonational contour within a conversational
turn. Intonational contour frequently includes falling or rising pitch
(as in declaratives and questions, respectively), and often there is
a pause preceding and following it. An utterance may include a
single word (e.g., Stop!), an isolated phrase (e.g., big boy), or a
single or multiclause sentence. Two independent clauses not con-
nected either by intonation or lexical items (e.g., and , because)
were considered two utterances, even if they occurred within the
same conversational turn. A sentence that contained short word-
searching pauses was considered a single utterance (e.g., Bring methat [pause] shoe).
Sentences. To calculate the number of sentences, we first
characterized utterances as to whether they contained zero, one, or
more than one clause. Zero-clause utterances were those that did
not contain a verb; these utterances were not counted as sentences.
Typically zero-clause utterances contained just a noun (bear ), a
noun phrase or proper noun ( your bear , Jenny), a prepositional
phrase (in your room), a preposition (up), or an interjection ( yeah,
no, alright , thank you, etc.). An utterance was coded as having one
clause if it contained a single verb phrase. In cases where the
copula be was omitted, the utterance was also coded as having one
clause (e.g., You tired? You big boy now!). We refer to one-clause
utterances as simple sentences.
Diversity Measures
We used two different measures of linguistic diversity: word
types, which captures the number of different lexical items used by
a caregiver, and sentence types, which indicates the number of
different types of complex sentences that a given caregiver used.
The number of word and sentence types is neither a straight
compositional nor a straight quantity measure. At least for the
extremes of frequency, the number of different types will depend
on quantity of speech.
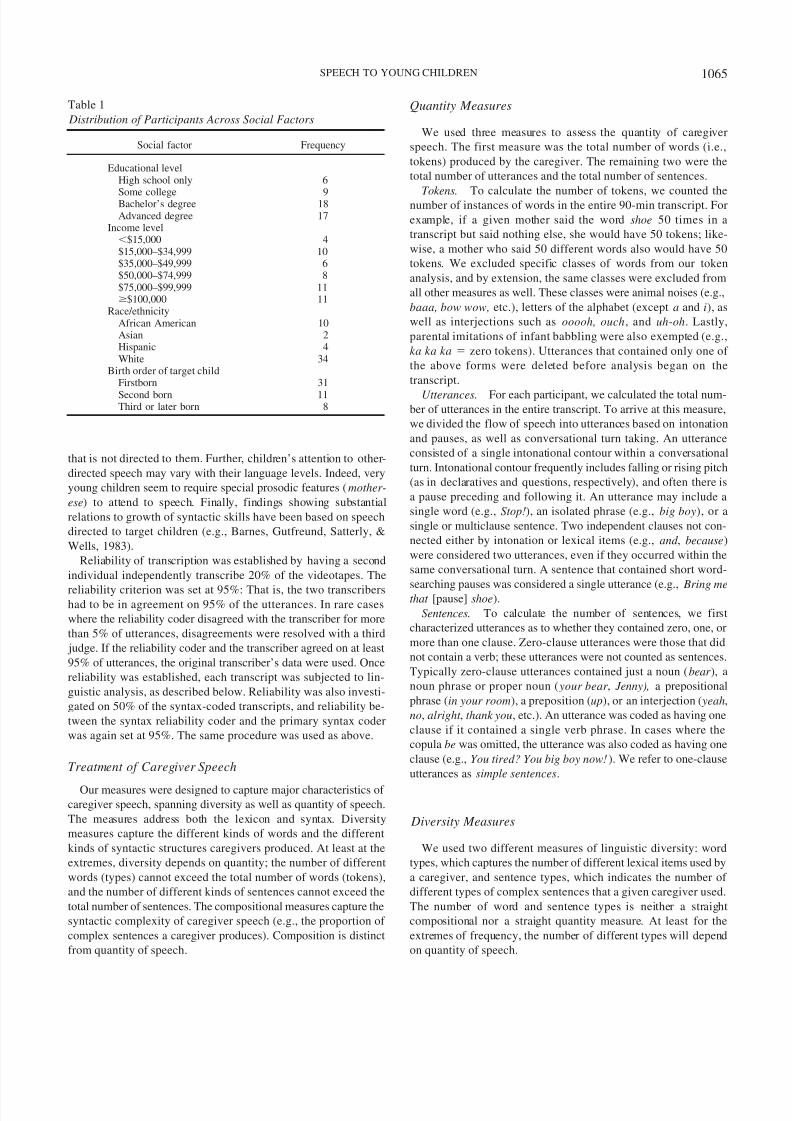
Table 1
Distribution of Participants Across Social Factors
Social factor Frequency
Educational levelHigh school only 6
Some college 9Bachelor’s degree 18Advanced degree 17
Income level$15,000 4$15,000–$34,999 10$35,000–$49,999 6$50,000–$74,999 8$75,000–$99,999 11$100,000 11
Race/ethnicityAfrican American 10Asian 2Hispanic 4White 34
Birth order of target childFirstborn 31
Second born 11Third or later born 8
1065SPEECH TO YOUNG CHILDREN
8/8/2019 Artículo Input
http://slidepdf.com/reader/full/articulo-input 5/22
Word types. Word types were calculated by counting the num-
ber of unique words in the transcript. A single type includes all of
the inflectional variations of a given word (e.g., jump, jumps,
jumping, jumped one type). Words with irregular inflectional
morphology were considered to constitute one type (e.g., goose/
geese, run/ran). Derivationally related words, however, were
treated as distinct words (slowly, slow two types). A propername and its nickname were also treated as one type ( Jenny,
Jennifer one type). Likewise, proper names, song titles, and
book titles that contained more than one word were also treated as
a single type (e.g., Sponge Bob Square Pants one type, The
Pokey Little Puppy one type). Commonly occurring “baby” or
motherese words were standardized and treated as examples of the
same type. For example, nummy, yummy, and yummers were all
treated as examples of yummy.
Sentence types. Structural coding of complex sentences
yielded seven types of two-clause sentences, as indicated below.
We determined, for a particular caregiver, whether all or just a
subset of the types were used. It also was possible to characterize
caregiver speech further in terms of the number and kinds of
three-, four- and five-clause sentences that they used. Our diversityof syntax measure involved the number of distinct kinds of com-
plex sentences that a given caregiver used in a particular session.
For all multiclause sentences, we categorized each sentence
based on the structural–syntactic relations between the clauses. We
did not consider serial verb constructions (e.g., go get it ), modals
(e.g., going to do it ), or tags (e.g., isn’t it?) as sufficient to
constitute a multiclause utterance. Because subordinate clauses can
vary morphologically (e.g., bearing infinitive or gerundive mark-
ing), we categorized two-clause sentences according to their struc-
tural relations. These included the following: coordination, adjunc-
tion (preceding the main clause), adjunction (following the main
clause), subordinate clauses with object as complement, sentences
with subordinate clauses as subjects, object-relative clauses, andsubject-relative clauses.
The first relation is coordination, where the two clauses are
conjoined by and or or (e.g., Jimmy went to the store and bought
milk ). We also coded for two types of adjunct clauses: one where
the adjunct precedes the main clause (e.g., Before you go outside,
put on your coat ) and one where the adjunct clause follows the
main clause (e.g., Put on your coat before you go outside). Next,
we coded for subordinate clauses fulfilling the role of object for
the main clause (i.e., the main verb subcategorizes for a clausal
complement; e.g., I thought that you were tired ) and for subordi-
nate clauses fulfilling the role of subject of the main clause (e.g.,
What you need is a nap). Next, we divided the relative clauses into
those that modify the main clause subject (e.g., The doll that
Grandma gave you is all dirty; The boy that likes ice cream is
here) and those that modify the main clause object (e.g., Hand me
the piece that goes over here; I know the one you want ). In order
to keep this measure parallel to the other types of subordinate
clauses discussed above and to avoid proliferation of subordinate
clause types, we did not further subdivide relative clauses based on
the role of the head noun phrase within the relative clause. Sen-
tences that contained more than two clauses were then coded for
each relation holding among the clauses. In other words, each of
the seven basic types could be combined with any other, thus
forming a new type of complex sentence. For example, I know that
you want the one that Grandma gave you contains both a clausal
complement serving as object of the main clause and an object-
relative clause in the subordinate clause.
Compositional Measures
The measures of syntactic composition are of central impor-
tance. They include the proportion of multiclause sentences andtwo measures that are distinct from clausal structure: the average
number of noun phrases per sentence and the average number of
words per sentence. These two measures capture constituent-level
complexity.
Multiclause sentences. To calculate the proportion of multi-
clause sentences, we divided the total number of multiclause
sentences by the total number of sentences. We described how
we determined whether a sentence contained multiple clauses
above.
Noun phrases per sentence. We coded the number of noun
phrases (noun, pronoun or proper noun, with optional adjectives
and articles) that either filled an argument position in the syntax
(e.g., I want the ball) or were used in adjuncts (e.g., Mommy needsto lay down on the couch). Tags, however, were excluded (e.g.,
aren’t you?). Use of the number of noun phrases addresses a level
of syntactic complexity that is not captured by the number of
clauses. This measure of noun phrases per sentence provides an
index of constituent-level complexity; it includes prepositional
phrases, locative expressions, and so forth. The more constituents
that are present in a sentence, the more complex the overall
structure is. Noun phrases include those that are obligatory in the
syntax (e.g., subjects and direct objects) as well as those that are
optional (e.g., the “by-phrase” in the passive and the prepositional
phrases). A sentence that includes optional noun phrases can be
considered more complex than one that does not. Note also that
imperatives (e.g., Come here!) would be considered less complex
according to this metric. However, since we were measuring the
number of noun phrases, this seems correct.
It should be noted that locative expressions like here and there
were coded as noun phrases only when they served as objects of
prepositional phrases (e.g., in here). Likewise, this, that , and what
were counted as noun phrases only when they replaced the subject,
the object, or the object of a preposition. Who was counted as a
noun phrase, except when it served as a complementizer in a
relative clause (e.g., the girl who lives next door ). Lastly, posses-
sive noun phrases (e.g., Mommy’s shoes, the little girl’s toys) were
coded as two separate noun phrases because the leftmost noun
phrase ( Mommy, the little girl) has the internal structure of an
independent noun phrase (cf. Anderson, 1992).
Words per sentence. We also calculated the average number of words per sentence, including both complex and simple sentences.
By calculating number of words rather than morphemes, we found
that our results would be more comparable cross-linguistically for
languages in which many words in a sentence are inflected (cf.
Nelli, 1998; Slobin & Bever, 1982). Like number of noun phrases,
number of words addresses a level of syntactic complexity that is
not captured by the number of clauses. Because tags were excluded
from this measure, the words that are counted are structurally part
of a sentence, including modifications of nouns and verbs through
the use of adjectives, adverbs, and so forth. Thus, this measure,
like number of noun phrases, provides an index of constituent-
1066 HUTTENLOCHER ET AL.
8/8/2019 Artículo Input
http://slidepdf.com/reader/full/articulo-input 6/22
level complexity, indicating the number of lexical items in the
syntactic tree.
Group-Level Predictors of Variation in Caregiver Speech
We examined four group-level variables associated with char-
acteristics of parent speech. Three of these are constant over time.Two are measures of SES, namely family income and education
(of the primary caregiver). The family income measure divided
participants into six groups; the frequencies are listed in Table 1.
We preserved the level of detail reported in the table despite some
sparse frequencies to capture the pronounced differences between
income groups. The education measure divided participants into
four groups, as reported in Table 1. Again, we preserved the level
of reported education despite sparse frequencies to capture differ-
ences between individuals with a high school education and those
with some college. The third variable is child gender. It is known
that girls tend to have higher language levels in the early stages of
development; hence, it is of interest to determine whether there are
associated properties of caregivers’ speech. The fourth variable,
the presence of older siblings during a visit, is not constant overtime. As we have noted, it has been found that quantity of care-
giver speech to a target child varies with older sibling presence,
whereas the composition of their speech does not. We examined
whether this pattern was found in our data, and, if so, determined
whether the presence of older siblings affected diversity measures,
which are sensitive to both quantity and variety of speech.
Results
The treatment of results is concerned with four fundamental
questions. To answer these questions, we consider patterns of
speech for each caregiver across time in the form of trajectories of
change (which can include no change as a special case). Thesetrajectories or change curves can be characterized by an intercept
that describes parent speech at the initial observation point and one
or more other parameters that describe the nature of change over
time. We use two additional growth parameters: one describes the
rate of linear growth over time and the other describes quadratic
change over time, that is, acceleration (or deceleration) of growth
over time. We employ hierarchical linear modeling (HLM) proce-
dures (Raudenbush, Bryk, Cheong, & Congdon, 2000) to carry out
the statistical analyses. We present summary information about the
HLM analyses here; for more complete information about coding,
model selection, and parameter estimates, see the Appendix.
One of our fundamental questions is whether caregiver speech
changes over time. To address this question, we used HLM to
examine whether the mean trajectory of caregiver speech across allcaregivers on each measure changes over time. The second ques-
tion is whether there are individual differences among caregivers.
To address this question, we used HLM to examine whether there
is variation in individual caregivers’ growth parameters. Thus, in
addition to tracking the overall characteristics of caregivers over
time, the model allows us to examine the nature of individual
differences in the pattern of language use. If there are substantial
individual differences, a third question arises concerning the char-
acteristics of caregivers that may account for those differences
(e.g., level of education). Here, too, we used HLM to model the
association between explanatory variables and individual differ-
ences in growth parameters. A fourth question is whether the
differences in caregivers remain stable, that is, whether individuals
tend to retain the same rank ordering relative to one another over
time. The stability of rank ordering of caregivers’ speech is as-
sessed using Kendall’s coefficient of concordance.
Change Over Time: Overall Trends
Consider first how caregivers as a group change over time with
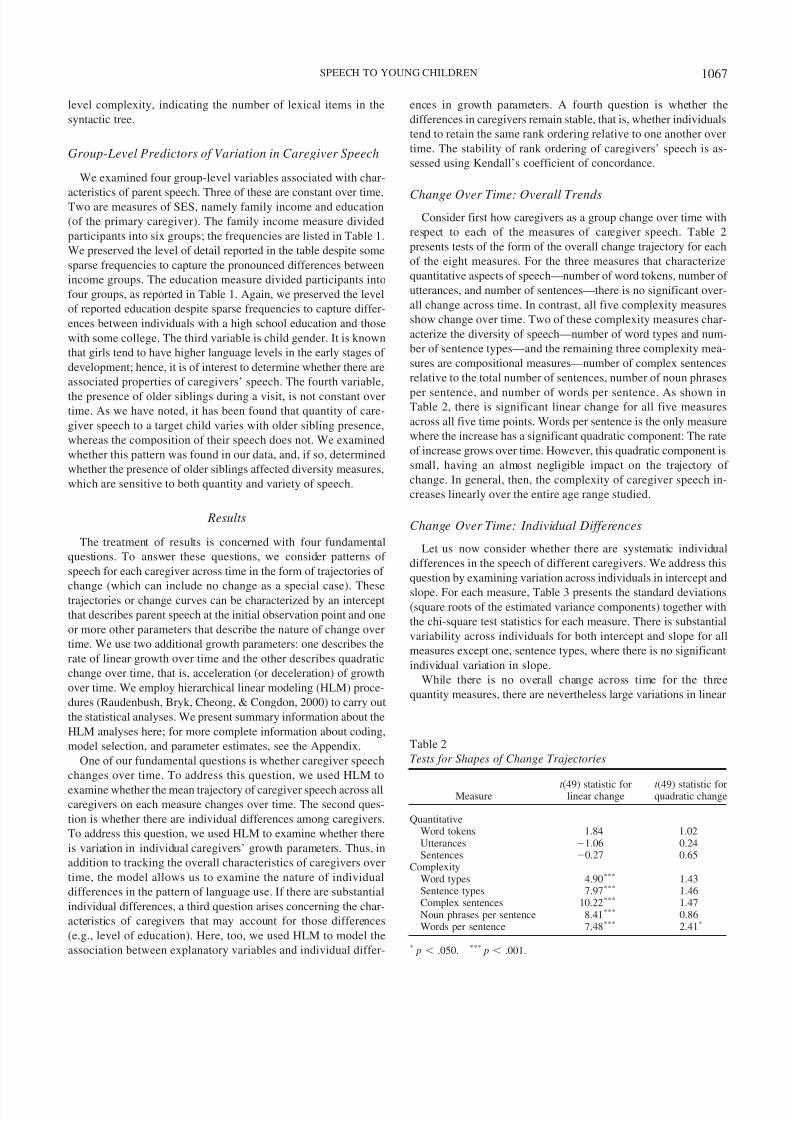
respect to each of the measures of caregiver speech. Table 2
presents tests of the form of the overall change trajectory for each
of the eight measures. For the three measures that characterize
quantitative aspects of speech—number of word tokens, number of
utterances, and number of sentences—there is no significant over-
all change across time. In contrast, all five complexity measures
show change over time. Two of these complexity measures char-
acterize the diversity of speech—number of word types and num-
ber of sentence types—and the remaining three complexity mea-
sures are compositional measures—number of complex sentences
relative to the total number of sentences, number of noun phrases
per sentence, and number of words per sentence. As shown inTable 2, there is significant linear change for all five measures
across all five time points. Words per sentence is the only measure
where the increase has a significant quadratic component: The rate
of increase grows over time. However, this quadratic component is
small, having an almost negligible impact on the trajectory of
change. In general, then, the complexity of caregiver speech in-
creases linearly over the entire age range studied.
Change Over Time: Individual Differences
Let us now consider whether there are systematic individual
differences in the speech of different caregivers. We address this
question by examining variation across individuals in intercept and
slope. For each measure, Table 3 presents the standard deviations(square roots of the estimated variance components) together with
the chi-square test statistics for each measure. There is substantial
variability across individuals for both intercept and slope for all
measures except one, sentence types, where there is no significant
individual variation in slope.
While there is no overall change across time for the three
quantity measures, there are nevertheless large variations in linear
Table 2
Tests for Shapes of Change Trajectories
Measuret (49) statistic for
linear changet (49) statistic forquadratic change
QuantitativeWord tokens 1.84 1.02Utterances 1.06 0.24Sentences 0.27 0.65
ComplexityWord types 4.90*** 1.43Sentence types 7.97*** 1.46Complex sentences 10.22*** 1.47Noun phrases per sentence 8.41*** 0.86Words per sentence 7.48*** 2.41*
* p .050. *** p .001.
1067SPEECH TO YOUNG CHILDREN

8/8/2019 Artículo Input
http://slidepdf.com/reader/full/articulo-input 7/22
slopes, as shown in Table 3. That is, although the overall (average)
slopes are negligible, the standard deviations reflecting individualdifferences are highly significant; the average slope is a mixture of
individual caregiver slopes that are positive, flat, and negative. For
all complexity measures, there are large variations among individ-
uals for the intercepts as shown in Table 3. For all complexity
measures except sentence types, there are also large variations
among individuals for the linear slopes.
Change Over Time: Subgroup Differences
Now let us consider whether some of the individual differences
that characterize change over time are associated with caregiver
education, family income, gender of child, or the presence of older
siblings at a session. Given the large individual variation, it is
reasonable to ask whether this variation is associated with explan-atory variables.
In general, caregiver education is associated with individual
differences in intercepts but not slopes for all but one of our
measures (see Table 4). The only exception to this pattern is
proportion of complex sentences, where education predicts the
slope rather than the intercept, 2(3) 9.97, p .05. In contrast,
analyses not reported in detail here show that family income is not
a significant predictor of any characteristic of growth for any of themeasures when caregiver education is controlled. It should be
noted that educational level does not account for all of the indi-
vidual differences in intercept; that is, a significant variance com-
ponent remains even after education is accounted for.
For a subset of measures, we initially found that child gender
was a significant predictor of the intercept. However, gender
effects vanished when presence of older siblings at the particular
data collection session was controlled. Table 5 shows that older
siblings were more frequently present for girls than for boys in our
visits to children. Table 6 presents results showing the effect of
older siblings being present. The presence of older siblings is
strongly predictive of differences in the three measures of speech
quantity (tokens, utterances, and sentences), as well as the two
measures of diversity. However, for compositional measures, no
such association with presence of older siblings was found.
Both education and presence of siblings significantly predict
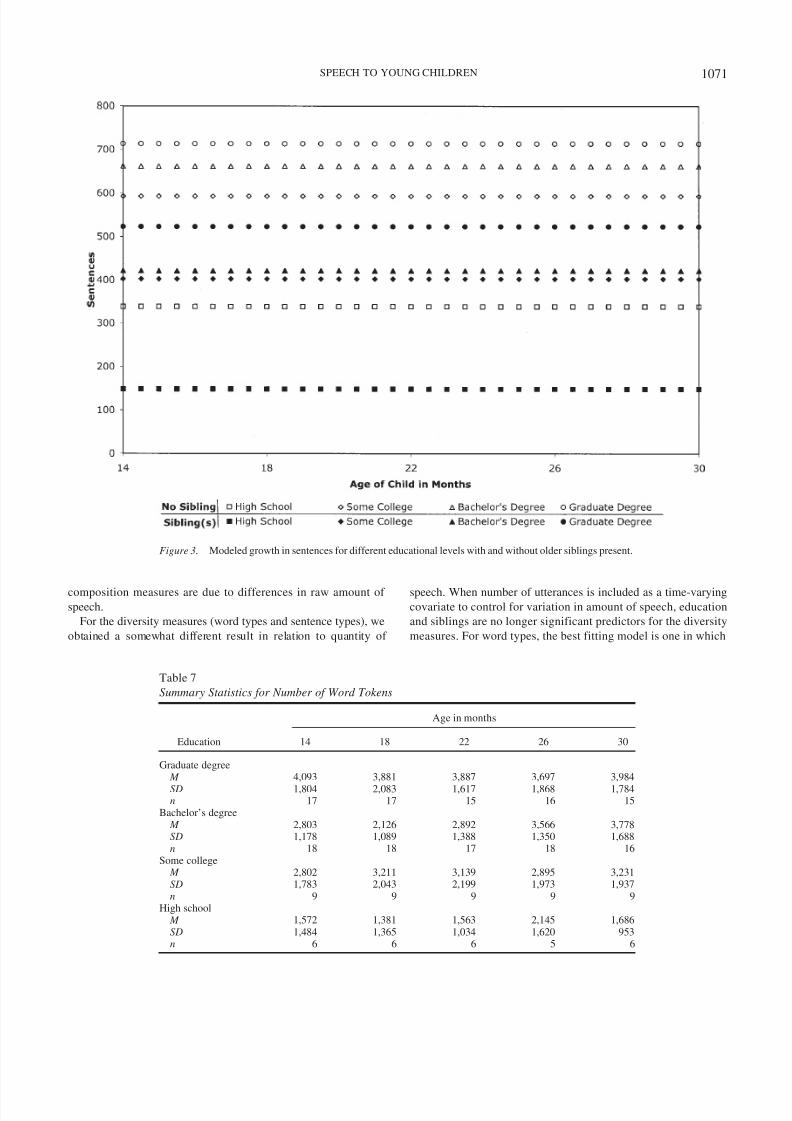
characteristics of change for several measures. The figures show
the modeled growth curves based on the statistically significant
growth parameters for each measure separately. Figures 1, 2, and
3 show curves for each level of education and sibling condition on
the quantity measures. Tables 7, 8, and 9 show means, standard
deviations, and sample sizes for these quantity measures, by time
and education level. The modeled curves depicted in the figures
indicate the structure of change in the means over time. For
example, the mean number of tokens at every age is higher for
parents with graduate degrees than for any other group; this is
reflected in the fact that the model intercept is highest for thatgroup and consequently the growth curve for that group (see
Table 5
Total Number of Older Siblings Present at Each Visit
Gender
Visit number
1 2 3 4 5
Girls (n 23) 7 4 10 14 10Boys (n 27) 2 4 5 2 5
Table 3
Root Variance Components (VC) for Growth Components
Measure
Intercept Linear slope
VC 2(49) VC 2(49)
QuantitativeWord tokensa 1,638.43 965.34*** 224.19 75.44**
Utterancesa 355.70 767.88*** 49.36 72.08*
Sentencesa 248.22 788.86*** 39.88 74.70***
ComplexityWord types 106.52 430.58*** 15.75 97.54***
Sentence typesa 2.29 161.32*** 0.48 58.53Complex sentencesb 0.31 1,147.17*** 0.10 276.72***
Noun phrases per sentence 0.18 265.42*** 0.04 98.17***
Words per sentence 0.52 290.84*** 0.24 82.61**
a Inference reported in square-root metric. b Inference and estimate reported in logit metric.* p .050. ** p .010. *** p .001.
Table 4
Tests for Differences in Intercept by Educational Level
Measure2(3) statistic for
intercept differences
QuantitativeWord tokensa 16.94*
Utterancesa 19.47***
Sentencesa 15.45*
ComplexityWord types 12.50**
Sentence typesa 9.47*
Complex sentencesb 4.22Noun phrases per sentence 13.11**
Words per sentence 9.51*
a Inference reported in square-root metric. b Inference and estimate re-ported in logit metric.* p .050. ** p .010. *** p .001.
1068 HUTTENLOCHER ET AL.
8/8/2019 Artículo Input
http://slidepdf.com/reader/full/articulo-input 8/22
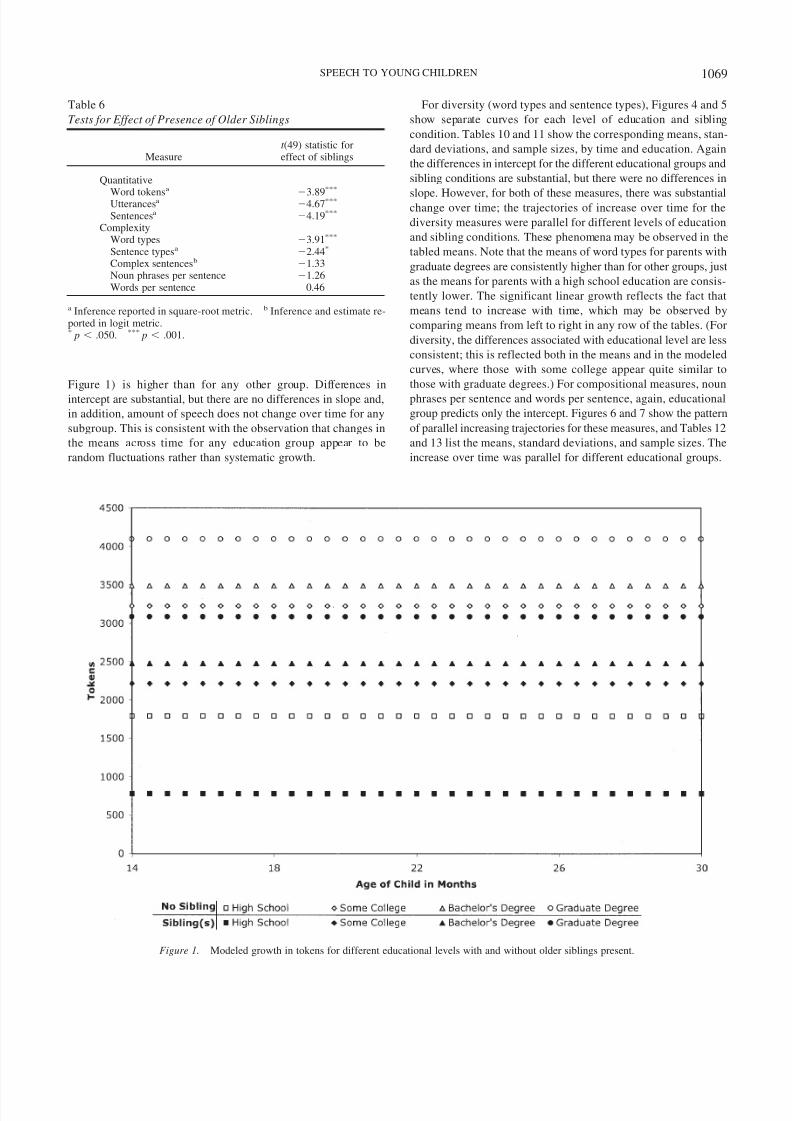
Figure 1) is higher than for any other group. Differences in
intercept are substantial, but there are no differences in slope and,
in addition, amount of speech does not change over time for any
subgroup. This is consistent with the observation that changes in
the means across time for any education group appear to be
random fluctuations rather than systematic growth.
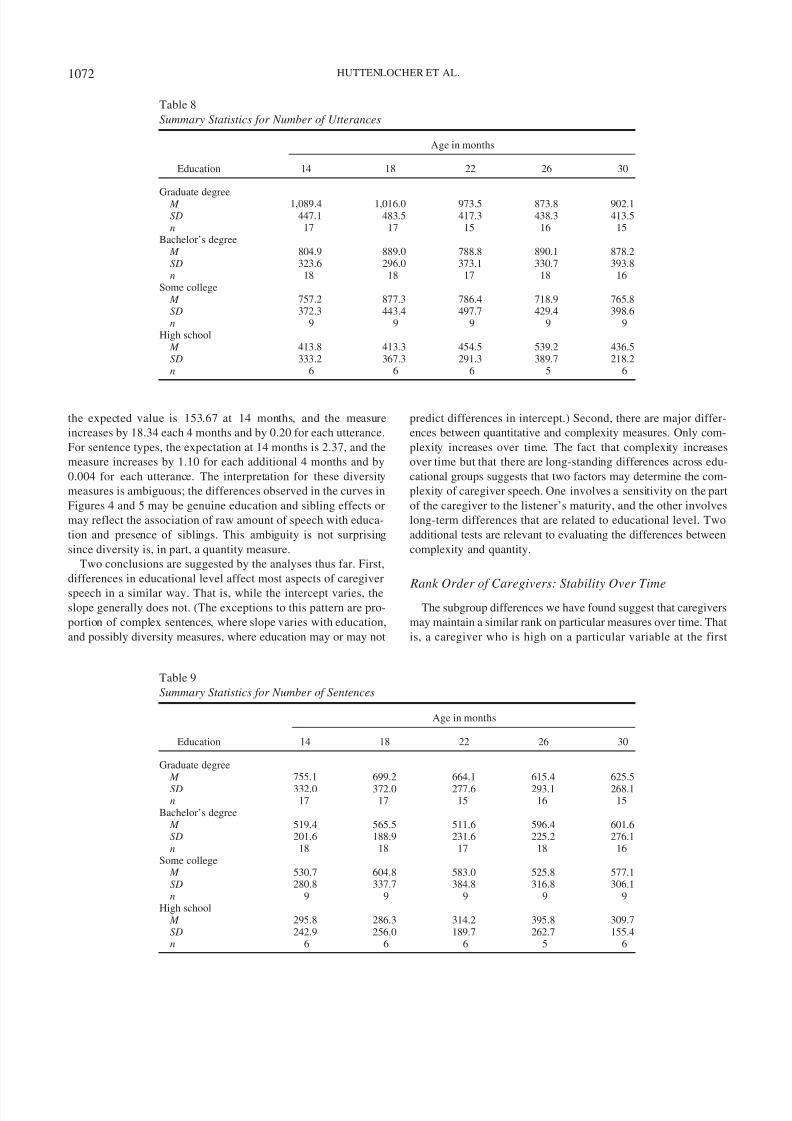
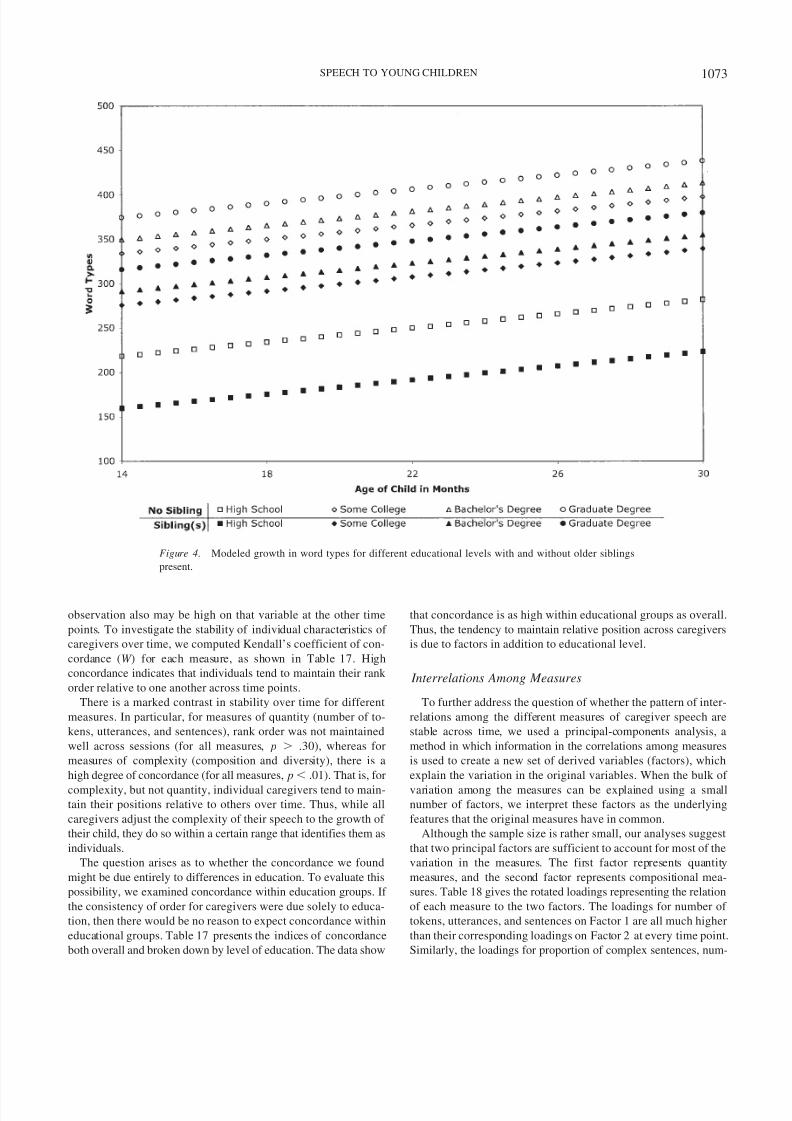
For diversity (word types and sentence types), Figures 4 and 5
show separate curves for each level of education and sibling
condition. Tables 10 and 11 show the corresponding means, stan-
dard deviations, and sample sizes, by time and education. Again
the differences in intercept for the different educational groups and
sibling conditions are substantial, but there were no differences in
slope. However, for both of these measures, there was substantialchange over time; the trajectories of increase over time for the
diversity measures were parallel for different levels of education
and sibling conditions. These phenomena may be observed in the
tabled means. Note that the means of word types for parents with
graduate degrees are consistently higher than for other groups, just
as the means for parents with a high school education are consis-
tently lower. The significant linear growth reflects the fact that
means tend to increase with time, which may be observed by
comparing means from left to right in any row of the tables. (For
diversity, the differences associated with educational level are less
consistent; this is reflected both in the means and in the modeled
curves, where those with some college appear quite similar to
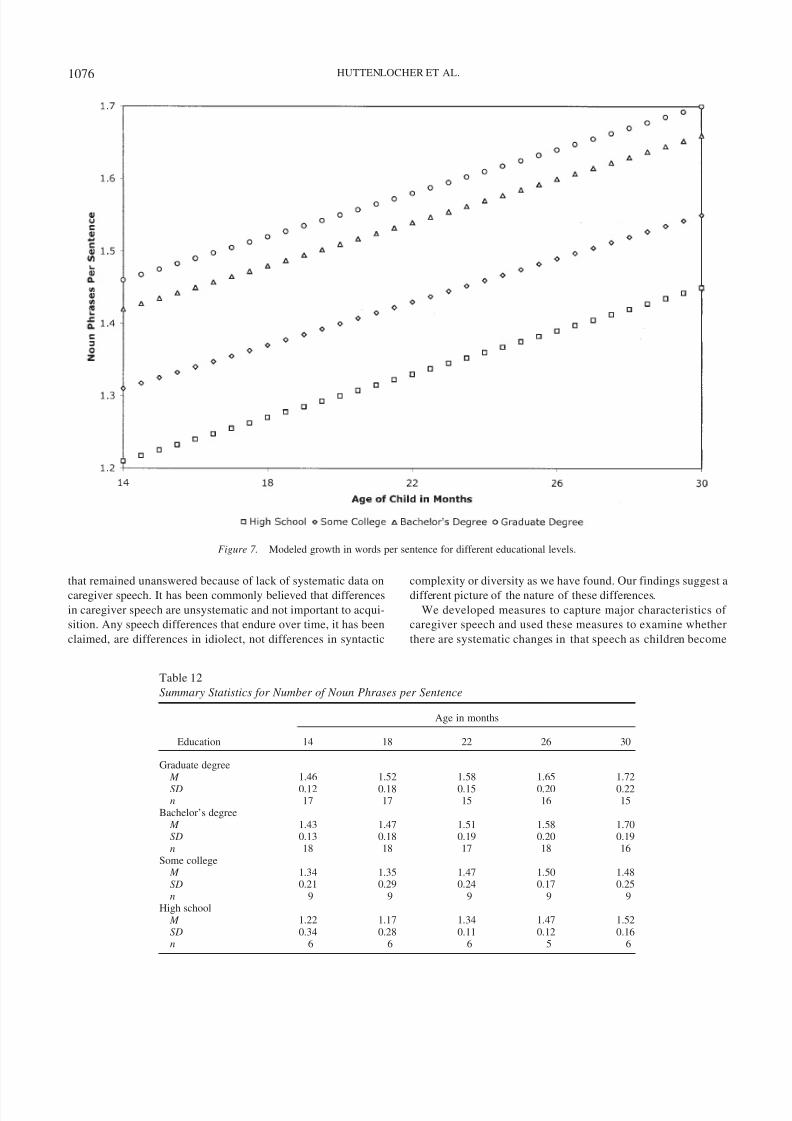
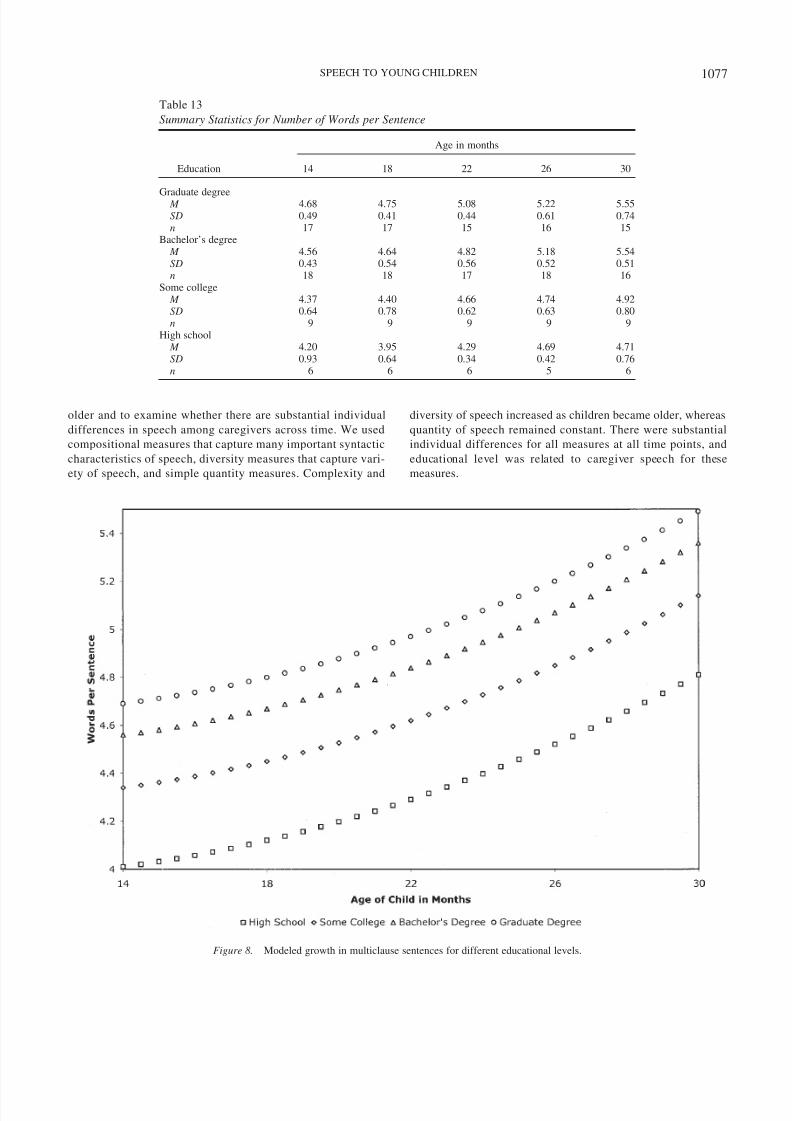
those with graduate degrees.) For compositional measures, noun
phrases per sentence and words per sentence, again, educational
group predicts only the intercept. Figures 6 and 7 show the pattern
of parallel increasing trajectories for these measures, and Tables 12
and 13 list the means, standard deviations, and sample sizes. The
increase over time was parallel for different educational groups.
Table 6
Tests for Effect of Presence of Older Siblings
Measuret (49) statistic foreffect of siblings
Quantitative
Word tokens
a
3.89
***
Utterancesa 4.67***
Sentencesa 4.19***
ComplexityWord types 3.91***
Sentence typesa 2.44*
Complex sentencesb 1.33Noun phrases per sentence 1.26Words per sentence 0.46
a Inference reported in square-root metric. b Inference and estimate re-ported in logit metric.* p .050. *** p .001.
Figure 1. Modeled growth in tokens for different educational levels with and without older siblings present.
1069SPEECH TO YOUNG CHILDREN

8/8/2019 Artículo Input
http://slidepdf.com/reader/full/articulo-input 9/22
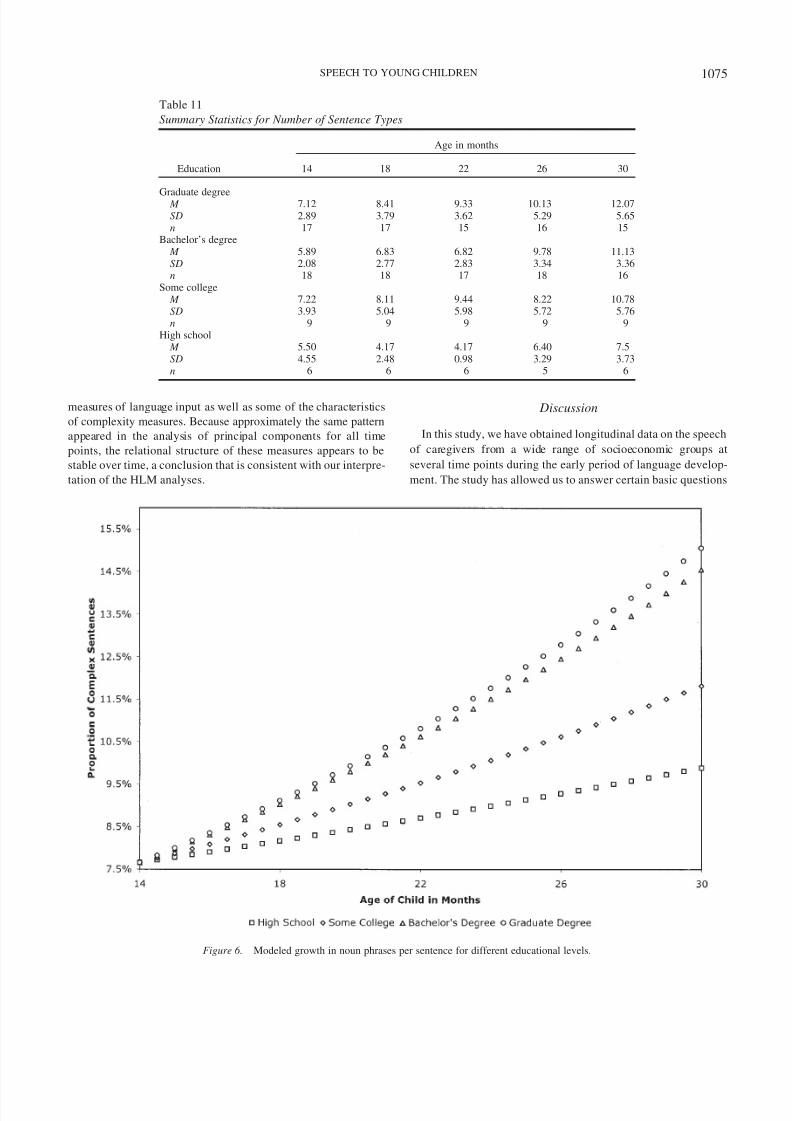
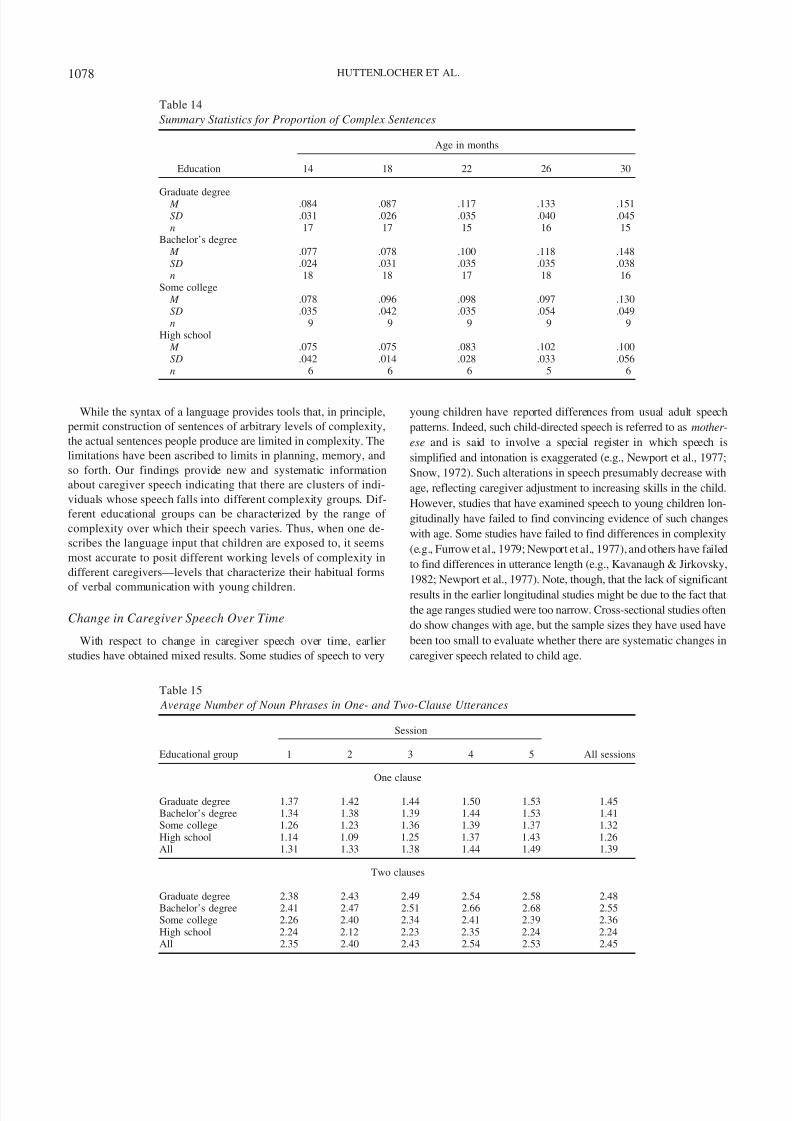
The proportion of complex sentences is the one measure wherecaregiver education is associated with differences in slopes rather
than intercepts. The change curves for the four education levels
given in Figure 8 show that the proportion of complex sentences is
similar for all levels of education at 14 months. However, the rate
of increase is greater for more educated caregivers. Table 14 lists
the relevant means, standard deviations, and sample sizes. Most
complex sentences were two-clause sentences with subordinate
clauses that fulfill the role of object for the main clause. The main
clause involves verbs of cognition or motivation (e.g., think , want ).
A possible reason why this measure shows a steeper slope for more
educated groups is that, while educated caregivers generally tend
to use more multiclause sentences, they do not do so with children
too young to interpret them.
As the complexity of speech was greater for more educatedgroups both at clausal and constituent levels, the question arises as
to whether differences at a constituent level may be due entirely to
differences at a clausal level. While measures of constituent struc-
ture surely increase with the number of clauses, they also can
increase when the number of clauses is held constant, for example,
by adding prepositional phrases or adjectival modification. Tables
15 and 16 show that values on constituent-level measures are not
based solely on the number of clauses in caregiver speech. Table
15 shows the number of noun phrases separately for one-clause
and two-clause sentences for the four educational groups. While
the average number of noun phrases is, of course, greater in
two-clause utterances, there is significant variation within theone-clause group and within the two-clause group depending on
educational level. Table 16 reports the same breakdown for num-
ber of words in one- and two-clause sentences. Supplementary
analyses show that caregiver education is still a significant predic-
tor of the intercept when number of words and number of noun
phrases are analyzed separately for one- and two-clause sentences.
That is, caregivers who provide a child with sentences of differing
levels of complexity at one syntactic level also do so at another.
Another issue concerns the potential for confounding the raw
amount of speech and complexity of speech. Even though our
composition measures are relative to total numbers of sentences,
some of the forms are relatively rare. Therefore, the more speech
is sampled, the greater the likelihood of finding such forms. Thus,differences in the quantity of speech may explain some variations
associated with education. For that reason, we have conducted
additional analyses with our composition measures. For composi-
tion measures, if we control for the amount of raw speech by
including number of utterances as a covariate, the results of tests
for the effect of education do not change. Education remains a
significant predictor of the slope for proportion of complex sen-
tences and of the intercept for noun phrases per sentence and
words per sentence. The growth curves are qualitatively similar to
the patterns observed when number of utterances is not controlled.
Thus, it is not possible to argue that educational differences in the
Figure 2. Modeled growth in utterances for different educational levels with and without older siblings present.
1070 HUTTENLOCHER ET AL.
8/8/2019 Artículo Input
http://slidepdf.com/reader/full/articulo-input 10/22
composition measures are due to differences in raw amount of speech.
For the diversity measures (word types and sentence types), we
obtained a somewhat different result in relation to quantity of
speech. When number of utterances is included as a time-varyingcovariate to control for variation in amount of speech, education
and siblings are no longer significant predictors for the diversity
measures. For word types, the best fitting model is one in which
Figure 3. Modeled growth in sentences for different educational levels with and without older siblings present.
Table 7
Summary Statistics for Number of Word Tokens
Education
Age in months
14 18 22 26 30
Graduate degree M 4,093 3,881 3,887 3,697 3,984
SD 1,804 2,083 1,617 1,868 1,784n 17 17 15 16 15
Bachelor’s degree M 2,803 2,126 2,892 3,566 3,778SD 1,178 1,089 1,388 1,350 1,688n 18 18 17 18 16
Some college M 2,802 3,211 3,139 2,895 3,231SD 1,783 2,043 2,199 1,973 1,937n 9 9 9 9 9
High school M 1,572 1,381 1,563 2,145 1,686SD 1,484 1,365 1,034 1,620 953n 6 6 6 5 6
1071SPEECH TO YOUNG CHILDREN
8/8/2019 Artículo Input
http://slidepdf.com/reader/full/articulo-input 11/22
the expected value is 153.67 at 14 months, and the measure
increases by 18.34 each 4 months and by 0.20 for each utterance.
For sentence types, the expectation at 14 months is 2.37, and the
measure increases by 1.10 for each additional 4 months and by
0.004 for each utterance. The interpretation for these diversity
measures is ambiguous; the differences observed in the curves in
Figures 4 and 5 may be genuine education and sibling effects or
may reflect the association of raw amount of speech with educa-
tion and presence of siblings. This ambiguity is not surprising
since diversity is, in part, a quantity measure.
Two conclusions are suggested by the analyses thus far. First,
differences in educational level affect most aspects of caregiver
speech in a similar way. That is, while the intercept varies, theslope generally does not. (The exceptions to this pattern are pro-
portion of complex sentences, where slope varies with education,
and possibly diversity measures, where education may or may not
predict differences in intercept.) Second, there are major differ-
ences between quantitative and complexity measures. Only com-
plexity increases over time. The fact that complexity increases
over time but that there are long-standing differences across edu-
cational groups suggests that two factors may determine the com-
plexity of caregiver speech. One involves a sensitivity on the part
of the caregiver to the listener’s maturity, and the other involves
long-term differences that are related to educational level. Two
additional tests are relevant to evaluating the differences between
complexity and quantity.
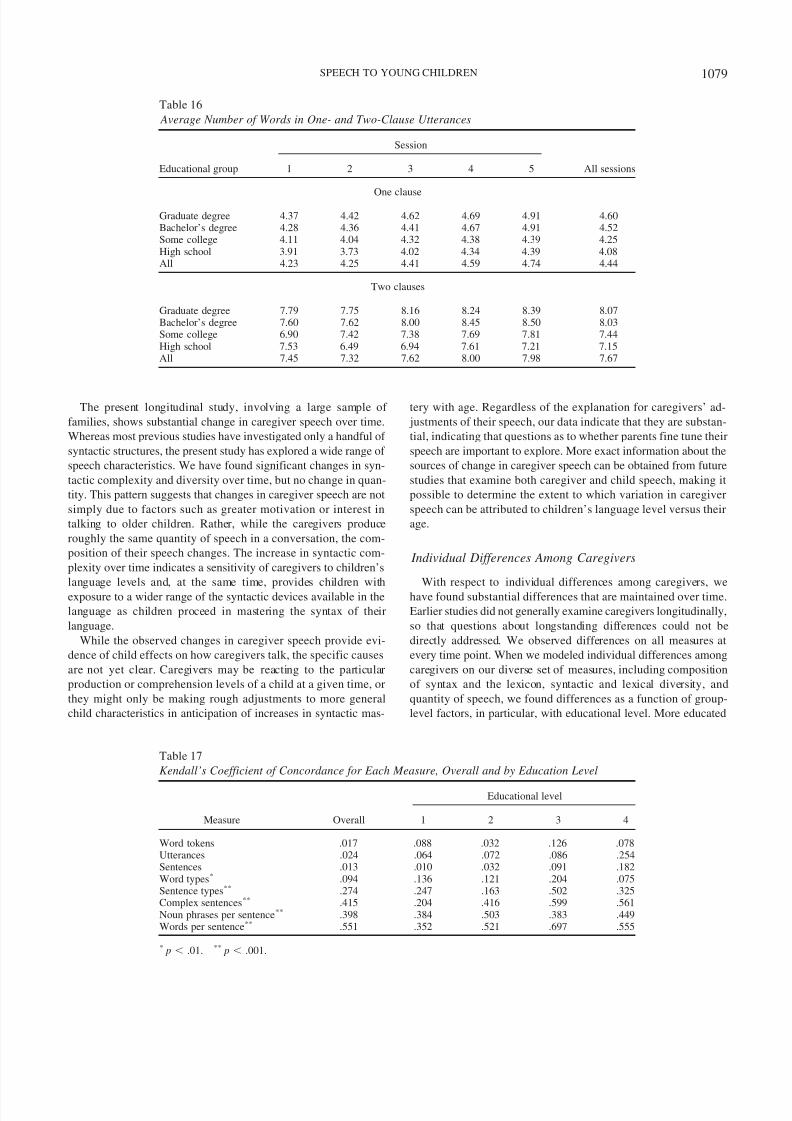
Rank Order of Caregivers: Stability Over TimeThe subgroup differences we have found suggest that caregivers
may maintain a similar rank on particular measures over time. That
is, a caregiver who is high on a particular variable at the first
Table 8
Summary Statistics for Number of Utterances
Education
Age in months
14 18 22 26 30
Graduate degree M 1,089.4 1,016.0 973.5 873.8 902.1SD 447.1 483.5 417.3 438.3 413.5n 17 17 15 16 15
Bachelor’s degree M 804.9 889.0 788.8 890.1 878.2SD 323.6 296.0 373.1 330.7 393.8n 18 18 17 18 16
Some college M 757.2 877.3 786.4 718.9 765.8SD 372.3 443.4 497.7 429.4 398.6n 9 9 9 9 9
High school M 413.8 413.3 454.5 539.2 436.5SD 333.2 367.3 291.3 389.7 218.2n 6 6 6 5 6
Table 9
Summary Statistics for Number of Sentences
Education
Age in months
14 18 22 26 30
Graduate degree M 755.1 699.2 664.1 615.4 625.5
SD 332.0 372.0 277.6 293.1 268.1n 17 17 15 16 15
Bachelor’s degree M 519.4 565.5 511.6 596.4 601.6SD 201.6 188.9 231.6 225.2 276.1n 18 18 17 18 16
Some college M 530.7 604.8 583.0 525.8 577.1SD 280.8 337.7 384.8 316.8 306.1n 9 9 9 9 9
High school M 295.8 286.3 314.2 395.8 309.7SD 242.9 256.0 189.7 262.7 155.4n 6 6 6 5 6
1072 HUTTENLOCHER ET AL.
8/8/2019 Artículo Input
http://slidepdf.com/reader/full/articulo-input 12/22
observation also may be high on that variable at the other time
points. To investigate the stability of individual characteristics of
caregivers over time, we computed Kendall’s coefficient of con-
cordance (W ) for each measure, as shown in Table 17. High
concordance indicates that individuals tend to maintain their rank
order relative to one another across time points.
There is a marked contrast in stability over time for different
measures. In particular, for measures of quantity (number of to-
kens, utterances, and sentences), rank order was not maintained
well across sessions (for all measures, p .30), whereas for
measures of complexity (composition and diversity), there is a
high degree of concordance (for all measures, p .01). That is, for
complexity, but not quantity, individual caregivers tend to main-tain their positions relative to others over time. Thus, while all
caregivers adjust the complexity of their speech to the growth of
their child, they do so within a certain range that identifies them as
individuals.
The question arises as to whether the concordance we found
might be due entirely to differences in education. To evaluate this
possibility, we examined concordance within education groups. If
the consistency of order for caregivers were due solely to educa-
tion, then there would be no reason to expect concordance within
educational groups. Table 17 presents the indices of concordance
both overall and broken down by level of education. The data show
that concordance is as high within educational groups as overall.
Thus, the tendency to maintain relative position across caregivers
is due to factors in addition to educational level.
Interrelations Among Measures
To further address the question of whether the pattern of inter-
relations among the different measures of caregiver speech are
stable across time, we used a principal-components analysis, a
method in which information in the correlations among measures
is used to create a new set of derived variables (factors), which
explain the variation in the original variables. When the bulk of
variation among the measures can be explained using a smallnumber of factors, we interpret these factors as the underlying
features that the original measures have in common.
Although the sample size is rather small, our analyses suggest
that two principal factors are sufficient to account for most of the
variation in the measures. The first factor represents quantity
measures, and the second factor represents compositional mea-
sures. Table 18 gives the rotated loadings representing the relation
of each measure to the two factors. The loadings for number of
tokens, utterances, and sentences on Factor 1 are all much higher
than their corresponding loadings on Factor 2 at every time point.
Similarly, the loadings for proportion of complex sentences, num-
Figure 4. Modeled growth in word types for different educational levels with and without older siblings
present.
1073SPEECH TO YOUNG CHILDREN
8/8/2019 Artículo Input
http://slidepdf.com/reader/full/articulo-input 13/22
ber of noun phrases, and words per sentence on Factor 2 are always
much larger than their corresponding loadings on Factor 1.
The pattern of loadings for the diversity measures, word types
and sentence types, are intermediate between the other two pat-
terns. Word types, while having larger loadings on Factor 1 at all
time points, also have nonnegligible loadings on Factor 2. Sen-
tence types also have relatively large loadings on both factors.
Thus, these measures have some characteristics of the quantitative
Figure 5. Modeled growth in sentence types for different educational levels with and without older siblings
present.
Table 10
Summary Statistics for Word Types
Education
Age in months
14 18 22 26 30
Graduate degree M 385.6 371.5 397.7 397.1 425.5
SD 97.5 99.9 99.0 120.3 102.9n 17 17 15 16 15
Bachelor’s degree M 321.3 346.2 340.2 393.2 430.3SD 99.2 86.5 103.7 107.5 104.5n 18 18 17 18 16
Some college M 321.4 357.7 363.4 351.0 389.3SD 132.5 134.4 148.7 133.7 118.9n 9 9 9 9 9
High school M 232.5 211.2 242.8 289.0 265.5SD 136.3 102.3 89.1 131.4 86.9n 6 6 6 5 6
1074 HUTTENLOCHER ET AL.
8/8/2019 Artículo Input
http://slidepdf.com/reader/full/articulo-input 14/22
measures of language input as well as some of the characteristics
of complexity measures. Because approximately the same pattern
appeared in the analysis of principal components for all time
points, the relational structure of these measures appears to be
stable over time, a conclusion that is consistent with our interpre-
tation of the HLM analyses.
Discussion
In this study, we have obtained longitudinal data on the speech
of caregivers from a wide range of socioeconomic groups at
several time points during the early period of language develop-
ment. The study has allowed us to answer certain basic questions
Figure 6. Modeled growth in noun phrases per sentence for different educational levels.
Table 11
Summary Statistics for Number of Sentence Types
Education
Age in months
14 18 22 26 30
Graduate degree M 7.12 8.41 9.33 10.13 12.07SD 2.89 3.79 3.62 5.29 5.65n 17 17 15 16 15
Bachelor’s degree M 5.89 6.83 6.82 9.78 11.13SD 2.08 2.77 2.83 3.34 3.36n 18 18 17 18 16
Some college M 7.22 8.11 9.44 8.22 10.78SD 3.93 5.04 5.98 5.72 5.76n 9 9 9 9 9
High school M 5.50 4.17 4.17 6.40 7.5SD 4.55 2.48 0.98 3.29 3.73n 6 6 6 5 6
1075SPEECH TO YOUNG CHILDREN
8/8/2019 Artículo Input
http://slidepdf.com/reader/full/articulo-input 15/22
that remained unanswered because of lack of systematic data on
caregiver speech. It has been commonly believed that differences
in caregiver speech are unsystematic and not important to acqui-
sition. Any speech differences that endure over time, it has been
claimed, are differences in idiolect, not differences in syntactic
complexity or diversity as we have found. Our findings suggest a
different picture of the nature of these differences.
We developed measures to capture major characteristics of
caregiver speech and used these measures to examine whether
there are systematic changes in that speech as children become
Figure 7. Modeled growth in words per sentence for different educational levels.
Table 12
Summary Statistics for Number of Noun Phrases per Sentence
Education
Age in months
14 18 22 26 30
Graduate degree M 1.46 1.52 1.58 1.65 1.72
SD 0.12 0.18 0.15 0.20 0.22n 17 17 15 16 15
Bachelor’s degree M 1.43 1.47 1.51 1.58 1.70SD 0.13 0.18 0.19 0.20 0.19n 18 18 17 18 16
Some college M 1.34 1.35 1.47 1.50 1.48SD 0.21 0.29 0.24 0.17 0.25n 9 9 9 9 9
High school M 1.22 1.17 1.34 1.47 1.52SD 0.34 0.28 0.11 0.12 0.16n 6 6 6 5 6
1076 HUTTENLOCHER ET AL.
8/8/2019 Artículo Input
http://slidepdf.com/reader/full/articulo-input 16/22
older and to examine whether there are substantial individual
differences in speech among caregivers across time. We used
compositional measures that capture many important syntactic
characteristics of speech, diversity measures that capture vari-
ety of speech, and simple quantity measures. Complexity and
diversity of speech increased as children became older, whereas
quantity of speech remained constant. There were substantial
individual differences for all measures at all time points, and
educational level was related to caregiver speech for these
measures.
Table 13
Summary Statistics for Number of Words per Sentence
Education
Age in months
14 18 22 26 30
Graduate degree M 4.68 4.75 5.08 5.22 5.55SD 0.49 0.41 0.44 0.61 0.74n 17 17 15 16 15
Bachelor’s degree M 4.56 4.64 4.82 5.18 5.54SD 0.43 0.54 0.56 0.52 0.51n 18 18 17 18 16
Some college M 4.37 4.40 4.66 4.74 4.92SD 0.64 0.78 0.62 0.63 0.80n 9 9 9 9 9
High school M 4.20 3.95 4.29 4.69 4.71SD 0.93 0.64 0.34 0.42 0.76n 6 6 6 5 6
Figure 8. Modeled growth in multiclause sentences for different educational levels.
1077SPEECH TO YOUNG CHILDREN
8/8/2019 Artículo Input
http://slidepdf.com/reader/full/articulo-input 17/22
While the syntax of a language provides tools that, in principle,
permit construction of sentences of arbitrary levels of complexity,
the actual sentences people produce are limited in complexity. The
limitations have been ascribed to limits in planning, memory, and
so forth. Our findings provide new and systematic information
about caregiver speech indicating that there are clusters of indi-
viduals whose speech falls into different complexity groups. Dif-
ferent educational groups can be characterized by the range of
complexity over which their speech varies. Thus, when one de-
scribes the language input that children are exposed to, it seems
most accurate to posit different working levels of complexity in
different caregivers—levels that characterize their habitual forms
of verbal communication with young children.
Change in Caregiver Speech Over Time
With respect to change in caregiver speech over time, earlier
studies have obtained mixed results. Some studies of speech to very
young children have reported differences from usual adult speech
patterns. Indeed, such child-directed speech is referred to as mother-
ese and is said to involve a special register in which speech is
simplified and intonation is exaggerated (e.g., Newport et al., 1977;
Snow, 1972). Such alterations in speech presumably decrease with
age, reflecting caregiver adjustment to increasing skills in the child.
However, studies that have examined speech to young children lon-
gitudinally have failed to find convincing evidence of such changes
with age. Some studies have failed to find differences in complexity
(e.g., Furrow et al., 1979; Newport et al., 1977), and others have failed
to find differences in utterance length (e.g., Kavanaugh & Jirkovsky,
1982; Newport et al., 1977). Note, though, that the lack of significant
results in the earlier longitudinal studies might be due to the fact that
the age ranges studied were too narrow. Cross-sectional studies often
do show changes with age, but the sample sizes they have used have
been too small to evaluate whether there are systematic changes in
caregiver speech related to child age.
Table 14
Summary Statistics for Proportion of Complex Sentences
Education
Age in months
14 18 22 26 30
Graduate degree M .084 .087 .117 .133 .151SD .031 .026 .035 .040 .045n 17 17 15 16 15
Bachelor’s degree M .077 .078 .100 .118 .148SD .024 .031 .035 .035 .038n 18 18 17 18 16
Some college M .078 .096 .098 .097 .130SD .035 .042 .035 .054 .049n 9 9 9 9 9
High school M .075 .075 .083 .102 .100SD .042 .014 .028 .033 .056n 6 6 6 5 6
Table 15
Average Number of Noun Phrases in One- and Two-Clause Utterances
Educational group
Session
All sessions1 2 3 4 5
One clause
Graduate degree 1.37 1.42 1.44 1.50 1.53 1.45Bachelor’s degree 1.34 1.38 1.39 1.44 1.53 1.41Some college 1.26 1.23 1.36 1.39 1.37 1.32High school 1.14 1.09 1.25 1.37 1.43 1.26All 1.31 1.33 1.38 1.44 1.49 1.39
Two clauses
Graduate degree 2.38 2.43 2.49 2.54 2.58 2.48Bachelor’s degree 2.41 2.47 2.51 2.66 2.68 2.55Some college 2.26 2.40 2.34 2.41 2.39 2.36High school 2.24 2.12 2.23 2.35 2.24 2.24All 2.35 2.40 2.43 2.54 2.53 2.45
1078 HUTTENLOCHER ET AL.
8/8/2019 Artículo Input
http://slidepdf.com/reader/full/articulo-input 18/22
The present longitudinal study, involving a large sample of
families, shows substantial change in caregiver speech over time.
Whereas most previous studies have investigated only a handful of
syntactic structures, the present study has explored a wide range of
speech characteristics. We have found significant changes in syn-
tactic complexity and diversity over time, but no change in quan-
tity. This pattern suggests that changes in caregiver speech are not
simply due to factors such as greater motivation or interest in
talking to older children. Rather, while the caregivers produce
roughly the same quantity of speech in a conversation, the com-
position of their speech changes. The increase in syntactic com-
plexity over time indicates a sensitivity of caregivers to children’s
language levels and, at the same time, provides children with
exposure to a wider range of the syntactic devices available in the
language as children proceed in mastering the syntax of their
language.
While the observed changes in caregiver speech provide evi-
dence of child effects on how caregivers talk, the specific causes
are not yet clear. Caregivers may be reacting to the particular
production or comprehension levels of a child at a given time, or
they might only be making rough adjustments to more general
child characteristics in anticipation of increases in syntactic mas-
tery with age. Regardless of the explanation for caregivers’ ad-
justments of their speech, our data indicate that they are substan-
tial, indicating that questions as to whether parents fine tune their
speech are important to explore. More exact information about the
sources of change in caregiver speech can be obtained from future
studies that examine both caregiver and child speech, making it
possible to determine the extent to which variation in caregiver
speech can be attributed to children’s language level versus their
age.
Individual Differences Among Caregivers
With respect to individual differences among caregivers, we
have found substantial differences that are maintained over time.
Earlier studies did not generally examine caregivers longitudinally,
so that questions about longstanding differences could not be
directly addressed. We observed differences on all measures at
every time point. When we modeled individual differences among
caregivers on our diverse set of measures, including composition
of syntax and the lexicon, syntactic and lexical diversity, and
quantity of speech, we found differences as a function of group-
level factors, in particular, with educational level. More educated
Table 17
Kendall’s Coefficient of Concordance for Each Measure, Overall and by Education Level
Measure Overall
Educational level
1 2 3 4
Word tokens .017 .088 .032 .126 .078Utterances .024 .064 .072 .086 .254Sentences .013 .010 .032 .091 .182Word types* .094 .136 .121 .204 .075Sentence types** .274 .247 .163 .502 .325Complex sentences** .415 .204 .416 .599 .561Noun phrases per sentence** .398 .384 .503 .383 .449Words per sentence** .551 .352 .521 .697 .555
* p .01. ** p .001.
Table 16
Average Number of Words in One- and Two-Clause Utterances
Educational group
Session
All sessions1 2 3 4 5
One clause
Graduate degree 4.37 4.42 4.62 4.69 4.91 4.60Bachelor’s degree 4.28 4.36 4.41 4.67 4.91 4.52Some college 4.11 4.04 4.32 4.38 4.39 4.25High school 3.91 3.73 4.02 4.34 4.39 4.08All 4.23 4.25 4.41 4.59 4.74 4.44
Two clauses
Graduate degree 7.79 7.75 8.16 8.24 8.39 8.07Bachelor’s degree 7.60 7.62 8.00 8.45 8.50 8.03Some college 6.90 7.42 7.38 7.69 7.81 7.44High school 7.53 6.49 6.94 7.61 7.21 7.15All 7.45 7.32 7.62 8.00 7.98 7.67
1079SPEECH TO YOUNG CHILDREN
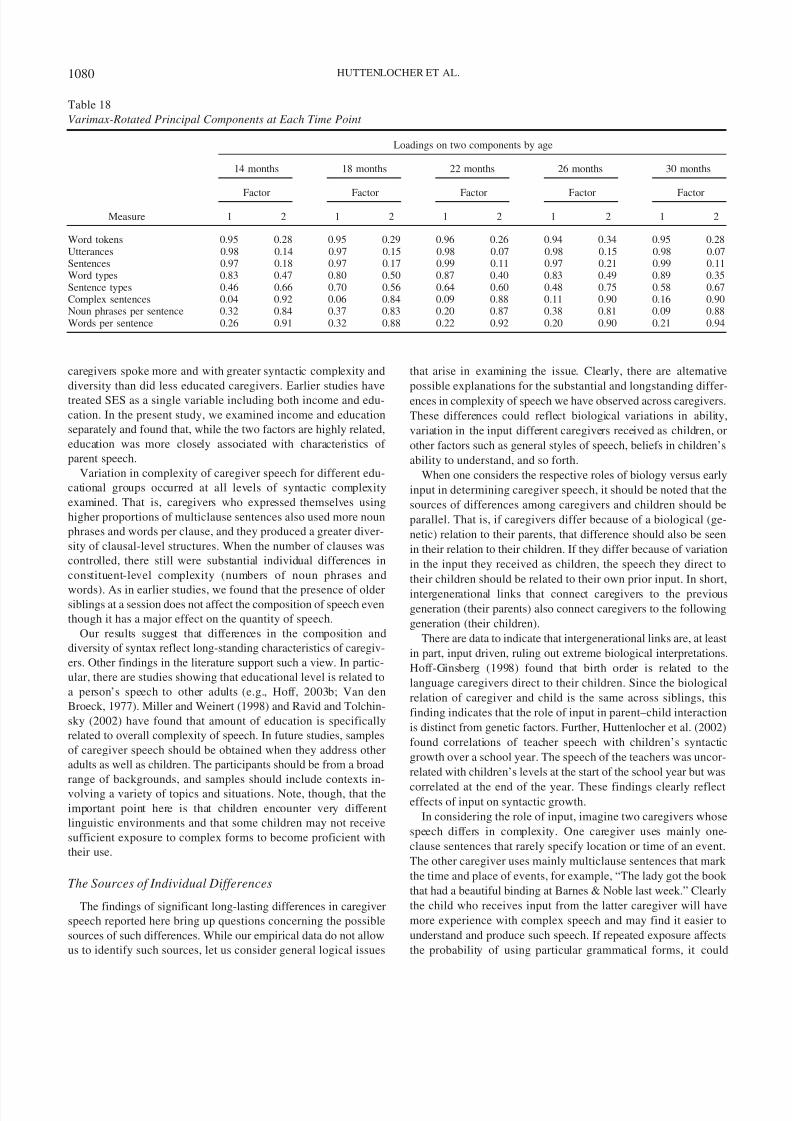
8/8/2019 Artículo Input
http://slidepdf.com/reader/full/articulo-input 19/22
caregivers spoke more and with greater syntactic complexity and
diversity than did less educated caregivers. Earlier studies have
treated SES as a single variable including both income and edu-
cation. In the present study, we examined income and education
separately and found that, while the two factors are highly related,
education was more closely associated with characteristics of
parent speech.
Variation in complexity of caregiver speech for different edu-
cational groups occurred at all levels of syntactic complexity
examined. That is, caregivers who expressed themselves using
higher proportions of multiclause sentences also used more noun
phrases and words per clause, and they produced a greater diver-
sity of clausal-level structures. When the number of clauses was
controlled, there still were substantial individual differences in
constituent-level complexity (numbers of noun phrases and
words). As in earlier studies, we found that the presence of oldersiblings at a session does not affect the composition of speech even
though it has a major effect on the quantity of speech.
Our results suggest that differences in the composition and
diversity of syntax reflect long-standing characteristics of caregiv-
ers. Other findings in the literature support such a view. In partic-
ular, there are studies showing that educational level is related to
a person’s speech to other adults (e.g., Hoff, 2003b; Van den
Broeck, 1977). Miller and Weinert (1998) and Ravid and Tolchin-
sky (2002) have found that amount of education is specifically
related to overall complexity of speech. In future studies, samples
of caregiver speech should be obtained when they address other
adults as well as children. The participants should be from a broad
range of backgrounds, and samples should include contexts in-
volving a variety of topics and situations. Note, though, that the
important point here is that children encounter very different
linguistic environments and that some children may not receive
sufficient exposure to complex forms to become proficient with
their use.
The Sources of Individual Differences
The findings of significant long-lasting differences in caregiver
speech reported here bring up questions concerning the possible
sources of such differences. While our empirical data do not allow
us to identify such sources, let us consider general logical issues
that arise in examining the issue. Clearly, there are alternative
possible explanations for the substantial and longstanding differ-
ences in complexity of speech we have observed across caregivers.
These differences could reflect biological variations in ability,
variation in the input different caregivers received as children, or
other factors such as general styles of speech, beliefs in children’s
ability to understand, and so forth.
When one considers the respective roles of biology versus early
input in determining caregiver speech, it should be noted that the
sources of differences among caregivers and children should be
parallel. That is, if caregivers differ because of a biological (ge-
netic) relation to their parents, that difference should also be seen
in their relation to their children. If they differ because of variation
in the input they received as children, the speech they direct to
their children should be related to their own prior input. In short,
intergenerational links that connect caregivers to the previous
generation (their parents) also connect caregivers to the following
generation (their children).
There are data to indicate that intergenerational links are, at least
in part, input driven, ruling out extreme biological interpretations.
Hoff-Ginsberg (1998) found that birth order is related to the
language caregivers direct to their children. Since the biological
relation of caregiver and child is the same across siblings, this
finding indicates that the role of input in parent–child interaction
is distinct from genetic factors. Further, Huttenlocher et al. (2002)
found correlations of teacher speech with children’s syntactic
growth over a school year. The speech of the teachers was uncor-
related with children’s levels at the start of the school year but was
correlated at the end of the year. These findings clearly reflecteffects of input on syntactic growth.
In considering the role of input, imagine two caregivers whose
speech differs in complexity. One caregiver uses mainly one-
clause sentences that rarely specify location or time of an event.
The other caregiver uses mainly multiclause sentences that mark
the time and place of events, for example, “The lady got the book
that had a beautiful binding at Barnes & Noble last week.” Clearly
the child who receives input from the latter caregiver will have
more experience with complex speech and may find it easier to
understand and produce such speech. If repeated exposure affects
the probability of using particular grammatical forms, it could
Table 18
Varimax-Rotated Principal Components at Each Time Point
Measure
Loadings on two components by age
14 months 18 months 22 months 26 months 30 months
Factor Factor Factor Factor Factor
1 2 1 2 1 2 1 2 1 2
Word tokens 0.95 0.28 0.95 0.29 0.96 0.26 0.94 0.34 0.95 0.28Utterances 0.98 0.14 0.97 0.15 0.98 0.07 0.98 0.15 0.98 0.07Sentences 0.97 0.18 0.97 0.17 0.99 0.11 0.97 0.21 0.99 0.11Word types 0.83 0.47 0.80 0.50 0.87 0.40 0.83 0.49 0.89 0.35Sentence types 0.46 0.66 0.70 0.56 0.64 0.60 0.48 0.75 0.58 0.67Complex sentences 0.04 0.92 0.06 0.84 0.09 0.88 0.11 0.90 0.16 0.90Noun phrases per sentence 0.32 0.84 0.37 0.83 0.20 0.87 0.38 0.81 0.09 0.88Words per sentence 0.26 0.91 0.32 0.88 0.22 0.92 0.20 0.90 0.21 0.94
1080 HUTTENLOCHER ET AL.
8/8/2019 Artículo Input
http://slidepdf.com/reader/full/articulo-input 20/22
explain the relation we have observed between input and acquisi-
tion. To be fluent with complex syntax, an individual may require
frequent embellishment of simple sentences into sentences that
combine clauses, use prepositional and adverbial phrases, and so
forth.
While existing research shows the importance of exposure,
biological factors also may be important. Differences in caregiverspeech may reflect biological differences in the ease with which
different people acquire language from input. Our data are consis-
tent with this possibility. That is, the caregivers we observed in the
present longitudinal study differed at the start (intercept differ-
ences), and these differences remained parallel as children became
older (common slope). The observed differences in start levels and
the parallel increases over time could reflect both the genetic
differences among parents and the genetic similarities of parents
and children.
A model that allows differences in input to affect acquisition can
also accommodate biological factors without major revision. For
example, some individuals may benefit more from exposure than
others; for these individuals, exposure effects might be longer
lasting and contribute more to likelihood of using complex formsand so forth. In short, the mechanisms involved in acquisition may
be similar across children but vary in the relative weights of
biological versus input factors. In any case, our findings indicate
long-lasting individual differences in the complexity of caregiver
speech. Thus, the relation of individual differences in the speech of
caregivers to child acquisition should be examined systematically.
Conclusions
The present study provides important information on caregiver
speech to very young children. Our behavioral data have estab-
lished two different sources of variability in speech to young
children. First, caregivers modify their speech depending on thecharacteristics of the children they are addressing. Second, there
are substantial and long-lasting differences in the speech of dif-
ferent caregivers. The long-lasting individual differences involve
variations in syntactic complexity that are tied to the caregivers’
educational level. While caregivers make adjustments in their
speech depending on the child, they nevertheless retain their indi-
vidual speech patterns over time. The findings of the present study
provide a framework for systematic naturalistic study of
caregiver–child relations to further evaluate the role of input in
language acquisition.
References
Andersen, H. (1973). Abductive and deductive change. Language, 49,
765–793.
Anderson, S. R. (1992). A-morphous morphology. New York: Cambridge
University Press.
Baker, M. (2001). The atoms of language. New York: Basic Books.
Barnes, S., Gutfreund, M., Satterly, D., & Wells, G. (1983). Characteristics
of adult speech which predict children’s language development. Journal
of Child Language, 10, 65–84.
Bee, H. L., Van Egeren, L. F., Streissguth, A. P., Nyman, B. A., & Leckie,
M. A. (1969). Social class differences in maternal teaching strategies and
speech patterns. Developmental Psychology, 1, 726–734.
Berko-Gleason, J. (1977). Talking to children: Some notes on feedback. In
C. E. Snow & C. A. Ferguson (Eds.), Talking to children: Language
input and acquisition (pp. 199–205). Cambridge, England: Cambridge
University Press.
Bybee, J. (1998). A functionalist approach to grammar and its evolution.
Evolution of Communication, 2, 249–278.
Chomsky, N. (1986). Knowledge of language: Its nature, origin, and use.
New York: Praeger.
Dunn, L. M., & Dunn, L. M. (1997). Peabody Picture Vocabulary Test (3rd
ed.). Circle Pines, MN: American Guidance Service.Elardo, R., Bradley, R., & Caldwell, B. (1977). A longitudinal study of the
relation of infants’ home environments to language development at age
three. Child Development, 4, 595–603.
Elman, J. L. (1993). Learning and development in neural networks: The
importance of starting small. Cognition, 48, 71–99.
Farian, D. C., & Haskins, R. (1980). Reciprocal influence in the social
interaction of mothers and three-year-old children from different socio-
economic backgrounds. Child Development, 51, 780–791.
Furrow, D., Nelson, K., & Benedict, H. (1979). Mothers’ speech to
children and syntactic development: Some simple relationships. Journal
of Child Language, 6, 423–442.
Gleitman, L., Newport, E., & Gleitman, H. (1984). The current status of the
motherese hypothesis. Journal of Child Language, 11, 43–79.
Goldberg, A. (1995). Constructions: A construction grammar approach to
argument structure. Chicago: University of Chicago Press.
Hammer, C., & Weiss, A. (1999). Guiding language development: How
African-American mothers and their infants structure play interactions.
Journal of Speech, Language, and Hearing Research, 42, 1219–1233.
Hart, B., & Risley, T. R. (1992). American parenting of language-learning
children: Persisting differences in family–child interactions observed in
natural home environments. Developmental Psychology, 28, 1096–
1105.
Heath, S. B. (1982). What no bedtime story means: Narrative skills at home
and school. Language in Society, 11, 49–76.
Hess, R. D., & Shipman, V. C. (1965). Early experience and the social-
ization of cognitive modes in children. Child Development, 36, 859–
886.
Hoff, E. (2003a). Causes and consequences of SES-related differences in
parent-to-child speech. In M. H. Bornstein & R. H. Bradley (Eds.),Socioeconomic status, parenting, and child development (pp. 147–160).
Mahwah, NJ: Erlbaum.
Hoff, E. (2003b). The specificity of environmental influence: Socioeco-
nomic status affects early vocabulary development via maternal speech.
Child Development, 74, 1368–1378.
Hoff-Ginsberg, E. (1986). Function and structure in maternal speech: Their
relation to the child’s development of syntax. Developmental Psychol-
ogy, 22, 155–163.
Hoff-Ginsberg, E. (1998). The relation of birth order and socioeconomic
status to children’s language experience and language development.
Applied Psycholinguistics, 19, 603–629.
Huttenlocher, J., Vasilyeva, M., Cymerman, E., & Levine, S. (2002).
Language input and child syntax. Cognitive Psychology, 45, 337–374.
Jackendoff, R. (2002). Foundations of language: Brain, meaning, gram-
mar, evolution. Oxford, England: Oxford University Press.
Jones, C., & Adamson, L. B. (1987). Language use in mother–child and
other child–sibling interactions. Child Development, 58, 356–366.
Kavanaugh, R., & Jirkovsky, A. (1982). Parental speech to young children:
A longitudinal analysis. Merrill-Palmer Quarterly, 28, 297–311.
Kaye, K. (1980). Why we don’t talk “baby talk” to babies. Journal of Child
Language, 7, 498–507.
Lidz, J., Gleitman, H., & Gleitman, L. (2003). Understanding how input
matters: Verb learning and the footprint of universal grammar. Cogni-
tion, 87, 151–178.
Lidz, J., & Gleitman, L. (2004). Yes, we still need universal grammar:
Reply. Cognition, 94, 85–93.
Lidz, J., Waxman, S., & Freedman, J. (2003). What infants know about
1081SPEECH TO YOUNG CHILDREN

8/8/2019 Artículo Input
http://slidepdf.com/reader/full/articulo-input 21/22
syntax but couldn’t have learned: Experimental evidence for syntactic
structure at 18 months. Cognition, 89, B65–B73.
Miller, J., & Weinert, R. (1998). Spontaneous spoken language: Syntax
and discourse. Oxford, England: Clarendon.
Naigles, L., & Hoff-Ginsberg, E. (1998). Why are some verbs learned
before other verbs? Effects of input frequency and structure on chil-
dren’s early verb use. Journal of Child Language, 25, 95–120.
Nelli, C. (1998). L’acquisizione della morfologia libera italiana: Fasi di unpercorso evolutivo [The acquisition of free Italian morphology: Devel-
opmental phases]. Studi di Grammatica Italiana, 17, 329–362.
Newmeyer, F. (2003). Grammar is grammar and usage is usage. Language,
79, 682–707.
Newport, E. L., Gleitman, H., & Gleitman, L. (1977). Mother, I’d rather do
it myself: Some effects and noneffects of maternal speech style. In C. E.
Snow & C. A. Ferguson (Eds.), Talking to children: Language input and
acquisition (pp. 109–150). Cambridge, England: Cambridge University
Press.
Oshima-Takane, Y., & Robbins, M. (2003). Linguistic environment of
secondborn children. First Language, 23(67, Pt. 1), 21–40.
Pan, B. A., Rowe, M., Spier, E., & Tamis-Lemonda, C. (2004). Measuring
productive vocabulary of toddlers in low-income families: Concurrent
and predictive. Journal of Child Language, 31, 587–608.
Phillips, J. R. (1973). Syntax and vocabulary of mothers’ speech to youngchildren: Age and sex comparisons. Child Development, 44, 182–185.
Price, G., & Hatano, G. (1991). Toward a taxonomy of the roles home
environments play in the formation of educationally significant individ-
ual differences. In S. Silvern (Ed.), Advances in reading/language re-
search: Vol. 5. Literacy through family, community and school interac-
tion (pp. 37–62). Greenwich, CT: JAI Press.
Raudenbush, S., Bryk, A., Cheong, Y. F., & Congdon, R. (2000). HLM 5:
Hierarchical linear and nonlinear modeling [Computer software and
manual]. Lincolnwood, IL: Scientific Software International.
Ravid, D., & Tolchinsky, L. (2002). Developing linguistic literacy: A
comprehensive model. Journal of Child Language, 29, 417–447.
Rondal, J. (1980). Fathers’ and mothers’ speech in early language devel-
opment. Journal of Child Language, 7, 353–369.
Rowland, C., Pine, J., Lieven, E., & Theakston, A. (2003). Determinants of
acquisition order in wh-questions: Re-evaluating the role of caregiver
speech. Journal of Child Language, 30, 609–635.
Saffran, J. (2001). The use of predictive dependencies in language learning.
Journal of Memory and Language, 44, 493–515.
Slobin, D. I., & Bever, T. G. (1982). Children use canonical sentence
schemas: A crosslinguistic study of word order and inflections. Cogni-
tion, 12, 229–265.
Snow, C. E. (1972). Mothers’ speech to children learning language. Child
Development, 43, 549–565.
Snow, C. E. (1977). The development of conversation between mothers
and babies. Journal of Child Language, 4, 1–22.
Snow, C. E. (1982). Are parents language teachers? In K. Borman (Ed.),
Social life of children in a changing society (pp. 81–95). Hillsdale, NJ:
Erlbaum.
Snow, C. E., Perlmann, R., & Nathan, D. (1987). Why routines are
different: Toward a multiple-factors model of the relation between input
and language acquisition. In K. Nelson & A. van Kleeck (Eds.), Chil-
dren’s language (Vol. 6, pp. 65–97). Hillsdale, NJ: Erlbaum.
Theakston, A. L., Lieven, E. V. M., Pine, J. M., & Rowland, C. F. (2005).
The acquisition of auxiliary syntax: Be and have. Cognitive Linguistics,
16, 247–277.
Tomasello, M. (2003). Constructing a language: A usage-based theory of
language acquisition. Cambridge, MA: Harvard University Press.
Van den Broeck, J. (1977). Class differences in syntactic complexity in the
Flemish town of Maaseik. Language in Society, 6, 149–181.
Appendix
Details of the HLM Models
In the body of the article, we have focused on general results and
have relied on the figures to present detail about the forms of the
change trajectories. Here, we present information about the parame-
ters that describe the curves, as well as the variance components that
describe individual variation. Each HLM model estimates the change
trajectory for some measure of caregiver speech using a regression
equation that predicts the measure with an intercept and a slope that
reflects change over time. We code time so that its value is zero at the
first observation, one at the second, and so on, ending at four for the
fifth observation. In this system, the intercept is the expected value for
the speech measure at the time of the first observation (14 months),and the slope represents the expected change between adjacent time
points. For the one variable (words per sentence) that exhibited a
slight curve in the change trajectory, a more complex model was used
in which a second slope reflected quadratic change over time. In
addition to the model for time, we consider one time-varying covari-
ate: the presence or absence of older siblings during the visit. The
HLM analyses are roughly equivalent to estimating regression equa-
tions separately for each caregiver and summarizing the values of
growth parameters across people.
Next, we consider how those linear or quadratic models vary
across individuals. We employ a dummy coding system for edu-
cation, which permits each educational group to have a different
mean growth trajectory. In this system, we estimate the intercept
for one group (the group with the highest level of education) and
express the intercepts of other groups as changes or differences
from that reference group. In addition, we consider models in
which education predicts the slope (and, in the case of words per
sentence, the quadratic slope). We investigate these explanatory
models for any growth parameter that exhibits significant vari-
ation across individual participants, regardless of whether the
average value of the parameter is significantly different from
zero. This allows us to investigate the possibility that differenteducation groups exhibit different growth rates as well as
different starting points and guards against the possibility that
the flat growth trajectories for some outcomes result from a
situation in which differential growth for different groups av-
erages to zero.
Although education explains some of the variations in the pa-
rameters (in most cases the intercept, but for proportion of multi-
clause sentences, the slope), there are generally still unexplained
individual differences. The amount of the unexplained variation is
quantified by variance component estimates, which are the esti-
mated variances of the individual differences (in intercept or slope)
1082 HUTTENLOCHER ET AL.
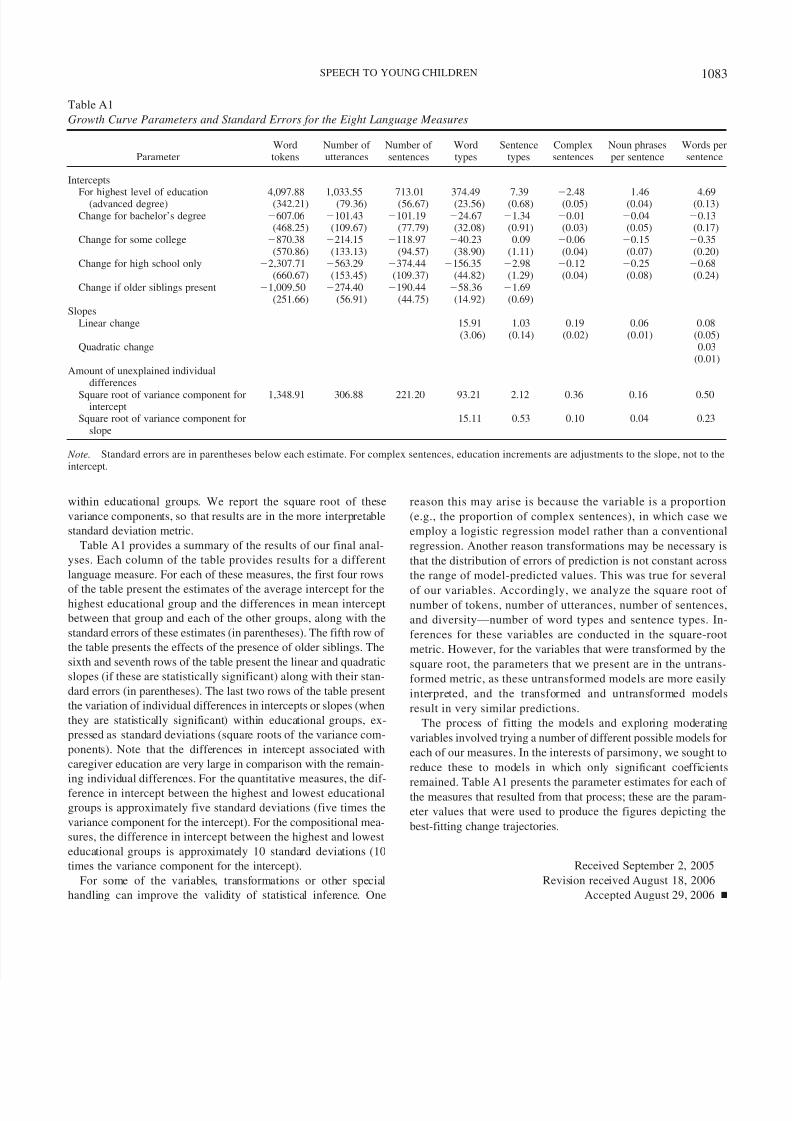
8/8/2019 Artículo Input
http://slidepdf.com/reader/full/articulo-input 22/22
within educational groups. We report the square root of these
variance components, so that results are in the more interpretable
standard deviation metric.
Table A1 provides a summary of the results of our final anal-
yses. Each column of the table provides results for a different
language measure. For each of these measures, the first four rows
of the table present the estimates of the average intercept for thehighest educational group and the differences in mean intercept
between that group and each of the other groups, along with the
standard errors of these estimates (in parentheses). The fifth row of
the table presents the effects of the presence of older siblings. The
sixth and seventh rows of the table present the linear and quadratic
slopes (if these are statistically significant) along with their stan-
dard errors (in parentheses). The last two rows of the table present
the variation of individual differences in intercepts or slopes (when
they are statistically significant) within educational groups, ex-
pressed as standard deviations (square roots of the variance com-
ponents). Note that the differences in intercept associated with
caregiver education are very large in comparison with the remain-
ing individual differences. For the quantitative measures, the dif-
ference in intercept between the highest and lowest educational
groups is approximately five standard deviations (five times the
variance component for the intercept). For the compositional mea-
sures, the difference in intercept between the highest and lowest
educational groups is approximately 10 standard deviations (10
times the variance component for the intercept).
For some of the variables, transformations or other special
handling can improve the validity of statistical inference. One
reason this may arise is because the variable is a proportion
(e.g., the proportion of complex sentences), in which case we
employ a logistic regression model rather than a conventional
regression. Another reason transformations may be necessary is
that the distribution of errors of prediction is not constant across
the range of model-predicted values. This was true for several
of our variables. Accordingly, we analyze the square root of number of tokens, number of utterances, number of sentences,
and diversity—number of word types and sentence types. In-
ferences for these variables are conducted in the square-root
metric. However, for the variables that were transformed by the
square root, the parameters that we present are in the untrans-
formed metric, as these untransformed models are more easily
interpreted, and the transformed and untransformed models
result in very similar predictions.
The process of fitting the models and exploring moderating
variables involved trying a number of different possible models for
each of our measures. In the interests of parsimony, we sought to
reduce these to models in which only significant coefficients
remained. Table A1 presents the parameter estimates for each of the measures that resulted from that process; these are the param-
eter values that were used to produce the figures depicting the
best-fitting change trajectories.
Received September 2, 2005
Revision received August 18, 2006
Accepted August 29, 2006
Table A1
Growth Curve Parameters and Standard Errors for the Eight Language Measures
ParameterWordtokens
Number of utterances
Number of sentences
Wordtypes
Sentencetypes
Complexsentences
Noun phrasesper sentence
Words persentence
Intercepts
For highest level of education 4,097.88 1,033.55 713.01 374.49 7.39 2.48 1.46 4.69(advanced degree) (342.21) (79.36) (56.67) (23.56) (0.68) (0.05) (0.04) (0.13)Change for bachelor’s degree 607.06 101.43 101.19 24.67 1.34 0.01 0.04 0.13
(468.25) (109.67) (77.79) (32.08) (0.91) (0.03) (0.05) (0.17)Change for some college 870.38 214.15 118.97 40.23 0.09 0.06 0.15 0.35
(570.86) (133.13) (94.57) (38.90) (1.11) (0.04) (0.07) (0.20)Change for high school only 2,307.71 563.29 374.44 156.35 2.98 0.12 0.25 0.68
(660.67) (153.45) (109.37) (44.82) (1.29) (0.04) (0.08) (0.24)Change if older siblings present 1,009.50 274.40 190.44 58.36 1.69
(251.66) (56.91) (44.75) (14.92) (0.69)Slopes
Linear change 15.91 1.03 0.19 0.06 0.08(3.06) (0.14) (0.02) (0.01) (0.05)
Quadratic change 0.03(0.01)
Amount of unexplained individualdifferences
Square root of variance component forintercept
1,348.91 306.88 221.20 93.21 2.12 0.36 0.16 0.50
Square root of variance component forslope
15.11 0.53 0.10 0.04 0.23
Note. Standard errors are in parentheses below each estimate. For complex sentences, education increments are adjustments to the slope, not to theintercept.
1083SPEECH TO YOUNG CHILDREN