Burl investor presentation 09 06-16-8pm
17
Agenda Page [CLIENT NAME] Presentation3 Investor Presentation September 8, 2016
-
Upload
investorsburlington -
Category
Investor Relations
-
view
1.847 -
download
3
Transcript of Burl investor presentation 09 06-16-8pm

Agenda
Page
[ C L I E N T N A M E ]
Presentation3
Investor Presentation September 8, 2016
1
Forward Looking Statements
This presentation contains forward-looking statements that are based on current expectations, estimates, forecasts and projections about Burlington Stores, Inc.,
together with its consolidated subsidiaries including, without limitation, Burlington Coat Factory Warehouse Corporation and its operating subsidiaries
(“Burlington” or the “Company”), the industry in which we operate and other matters, as well as Burlington management’s beliefs and assumptions and other
statements regarding matters that are not historical facts. For example, when Burlington uses words such as “aim,” “project,” “projection,” “expect,” “forecast,”
“outlook,” “anticipate,” “intend,” “plan,” “believe,” “seek,” “estimate,” “should,” “would,” “could,” “will,” “can,” “can have,” “likely,” “opportunity,” “potential” or “may,”
and the negatives thereof and variations of such words or other words that convey uncertainty of future events or outcomes, Burlington is making forward-looking
statements within the meaning of Section 27A of the Securities Act of 1933 and Section 21E of the Securities Exchange Act of 1934. Burlington’s forward-looking
statements are subject to risks and uncertainties. Such statements may include, but are not limited to, proposed store openings and closings, proposed capital
expenditures, projected financing requirements, proposed developmental projects, projected sales, earnings, revenues, costs, expenditures, cash flows, growth
rates and financial results, our plans and objectives for future operations, growth or initiatives, our strategies, Burlington’s ability to maintain or grow selling
margins, and the effect of the adoption of any new accounting pronouncements on our consolidated financial position, results of operations and cash flows, and
the expected outcome or impact of pending or threatened litigation. Actual events or results may differ materially from the results anticipated in these forward-
looking statements as a result of a variety of factors. While it is impossible to identify all such factors, factors that could cause actual results to differ materially
from those estimated by Burlington include: competition in the retail industry, competitive factors such as pricing and promotional activities of major competitors,
seasonality of Burlington’s business, adverse weather conditions, changes in consumer preferences and consumer spending patterns, import risks, inflation,
general economic conditions, unforeseen computer related problems, cyber security risks, unforeseen material loss or casualty, regulatory changes, our
relationship with our employees, the impact of current and future law, terroristic attacks, natural and man-made disasters, Burlington’s ability to implement its
strategy, its substantial level of indebtedness and related debt-service obligations, restrictions imposed by covenants in its debt agreements, availability of
adequate financing, its dependence on vendors for its merchandise, events affecting the delivery of merchandise to its stores, existence of adverse litigation,
availability of desirable locations on suitable terms, and other risks discussed from time to time in the filings of Burlington and Burlington Coat Factory
Investments Holdings, Inc. with the Securities and Exchange Commission.
Many of these factors are beyond Burlington’s ability to predict or control. In addition, as a result of these and other factors, Burlington’s past financial
performance should not be relied on as an indication of future performance. The cautionary statements referred to in this section also should be considered in
connection with any subsequent written or oral forward-looking statements that may be issued by Burlington or persons acting on its behalf. Burlington
undertakes no obligation to update or revise any forward-looking statements, whether as a result of new information, future events or otherwise, except as
required by law. In light of these risks and uncertainties, the forward-looking events and circumstances discussed in this presentation might not occur.
Furthermore, Burlington cannot guarantee future results, events, levels of activity, performance or achievements.

2
Investment Highlights
Leading destination for on-trend, branded merchandise at a great value
Proven track record of performance with strong current business trends
Flexible off-price sourcing and merchandising model
Attractive store economics and white space allowing for continued growth
Proven management and merchant team with extensive retail experience
3
Company Overview
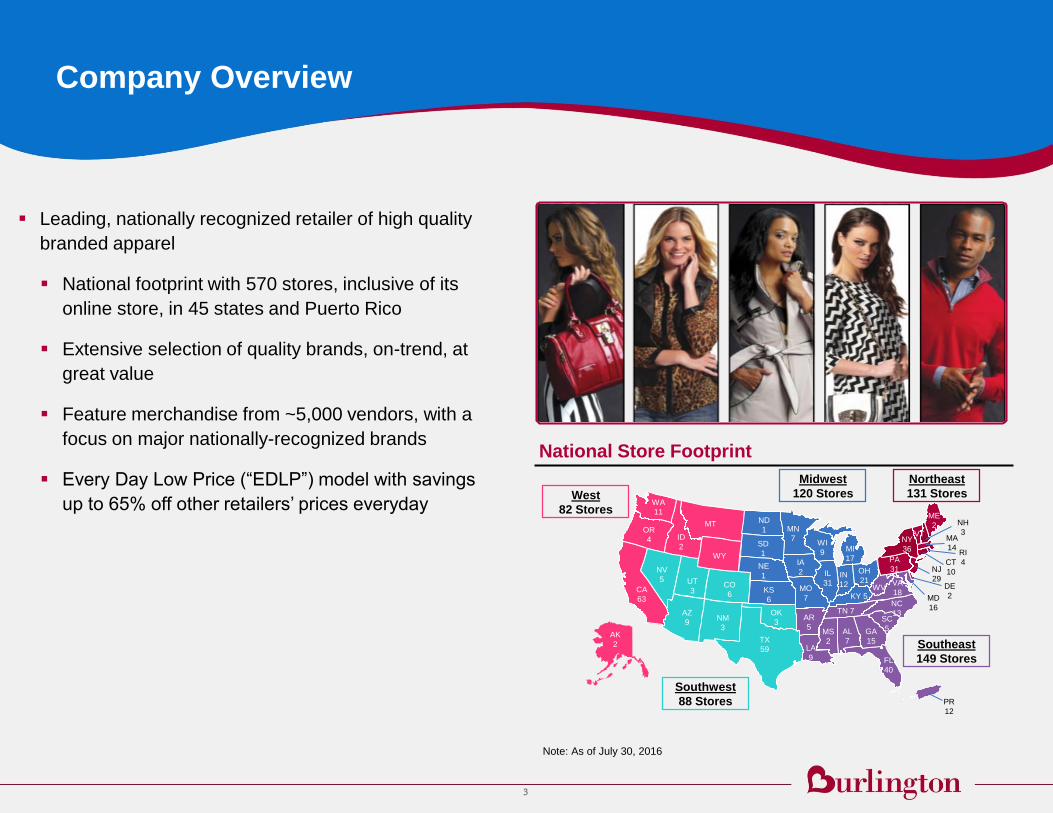
Leading, nationally recognized retailer of high quality
branded apparel
National footprint with 570 stores, inclusive of its
online store, in 45 states and Puerto Rico
Extensive selection of quality brands, on-trend, at
great value
Feature merchandise from ~5,000 vendors, with a
focus on major nationally-recognized brands
Every Day Low Price (“EDLP”) model with savings
up to 65% off other retailers’ prices everyday
National Store Footprint
WA
11
OR
4
CA
63
NV
5
ID
2
MT
WY
UT
3
AZ
9NM
3
TX
59
OK
3
CO
6KS
6
NE
1
SD
1
ND
1 MN
7
IA
2
MO
7
WI
9
IL
31IN
12
MI
17
OH
21
AR
5
LA
9
MS
2
AL
7
TN 7
FL
40
GA
15
SC
5
NC
13
VA
18WV
KY 5
PA
31
NY
36
VT
ME
2 NH
3MA
14RI
4CT
10NJ
29DE
2MD
16
West
82 Stores
Midwest
120 Stores
Northeast
131 Stores
Southeast
149 Stores
Southwest
88 Stores PR
12
AK
2
Note: As of July 30, 2016

4
Company Overview (cont.)
FY14 Net Sales by Category ($4.8 billion)
Women’s Ready-to-Wear
Apparel24%
Accessories and Footwear
22%
Menswear20%
Youth Apparel/ Baby18%
Home9%
Coats7%
FY15 Net Sales by Category ($5.1 billion)
Women’s Ready-to-Wear
Apparel24%
Accessories and Footwear
22%
Menswear21%
Youth Apparel/ Baby16%
Home11%
Coats6%
5
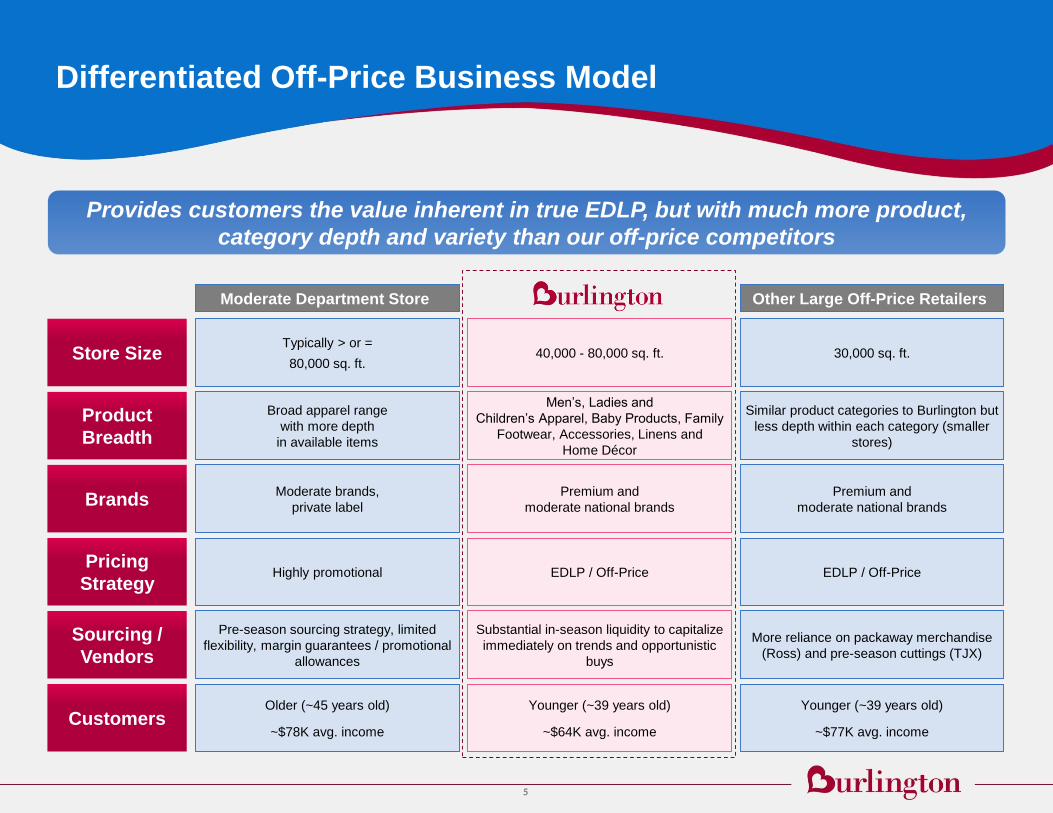
Provides customers the value inherent in true EDLP, but with much more product,
category depth and variety than our off-price competitors
Differentiated Off-Price Business Model
Moderate Department Store
40,000 - 80,000 sq. ft.
Men’s, Ladies and
Children’s Apparel, Baby Products, Family
Footwear, Accessories, Linens and
Home Décor
Premium and
moderate national brands
EDLP / Off-Price
Substantial in-season liquidity to capitalize
immediately on trends and opportunistic
buys
Younger (~39 years old)
~$64K avg. income
Store Size
Product
Breadth
Brands
Pricing
Strategy
Sourcing /
Vendors
Customers
Broad apparel range
with more depth
in available items
Moderate brands,
private label
Highly promotional
Pre-season sourcing strategy, limited
flexibility, margin guarantees / promotional
allowances
Older (~45 years old)
~$78K avg. income
Typically > or =
80,000 sq. ft.30,000 sq. ft.
Similar product categories to Burlington but
less depth within each category (smaller
stores)
Premium and
moderate national brands
EDLP / Off-Price
More reliance on packaway merchandise
(Ross) and pre-season cuttings (TJX)
Younger (~39 years old)
~$77K avg. income
Other Large Off-Price Retailers
6
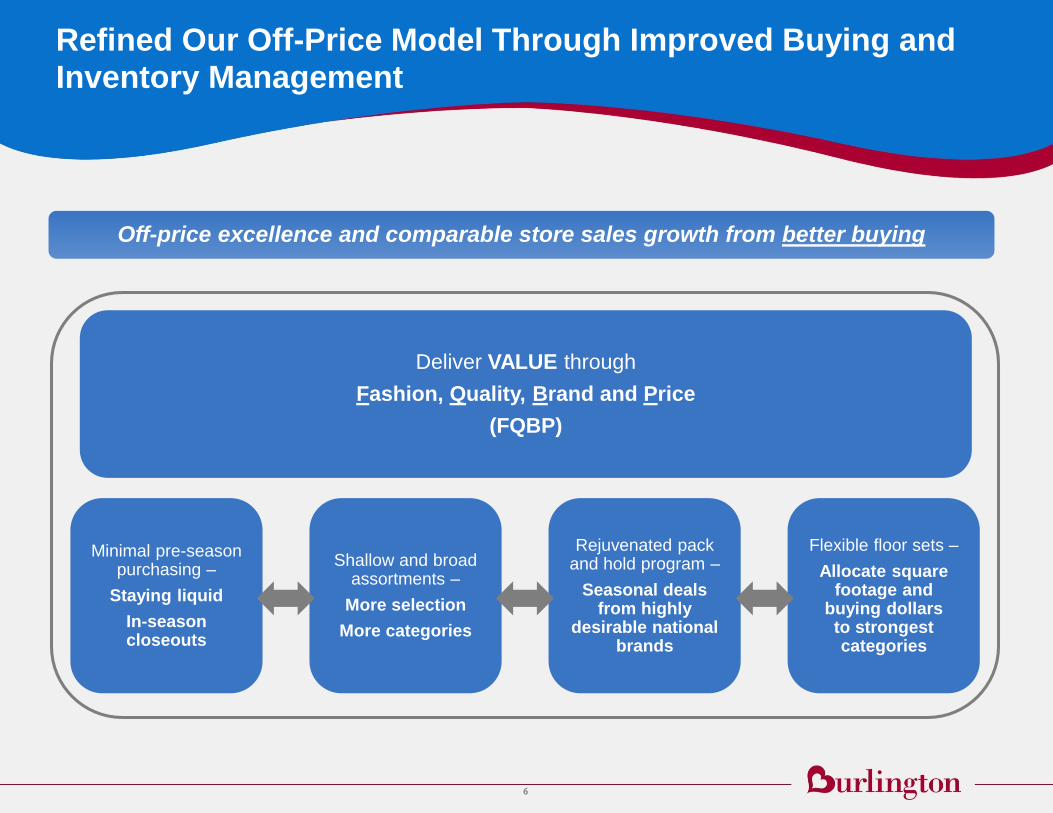
Refined Our Off-Price Model Through Improved Buying and Inventory Management
Deliver VALUE through
Fashion, Quality, Brand and Price
(FQBP)
Minimal pre-season purchasing –
Staying liquid
In-season closeouts
Flexible floor sets –
Allocate square footage and
buying dollars to strongest categories
Rejuvenated pack and hold program –
Seasonal deals from highly
desirable national brands
Shallow and broad assortments –
More selection
More categories
Off-price excellence and comparable store sales growth from better buying

7
Refined Our Off-Price Model Through Improved Buying and Inventory Management (cont.)
Improved Comparable Store Inventory Turnover
2.35x
3.97x
4.86x 5.32x
FY 2008 FY 2013 FY 2014 FY 2015
Key Inventory Metrics
Comparable Store Inventory Turnover: +10% in 1H’16 vs 1H’15
Comparable Store Inventory: -6% in 1H’16 vs 1H’15
$551 (397 stores)
$258 (521 stores)
$138 (542 stores)
$120 (567 stores)
FY 2008 FY 2013 FY 2014 FY 2015
Reduced Inventory Aged 91 Days and Older ($mm)
8
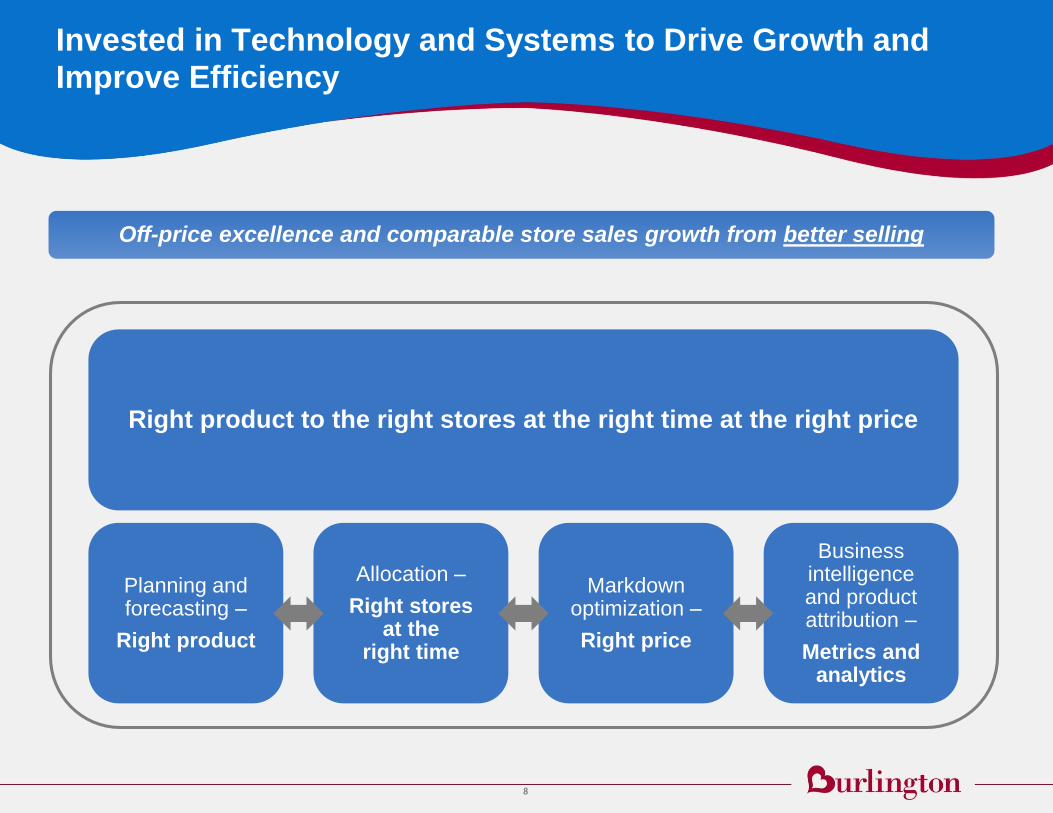
Invested in Technology and Systems to Drive Growth and Improve Efficiency
Right product to the right stores at the right time at the right price
Markdown optimization –
Right price
Planning and forecasting –
Right product
Business intelligence and product attribution –
Metrics and analytics
Allocation –
Right stores at the
right time
Off-price excellence and comparable store sales growth from better selling
9
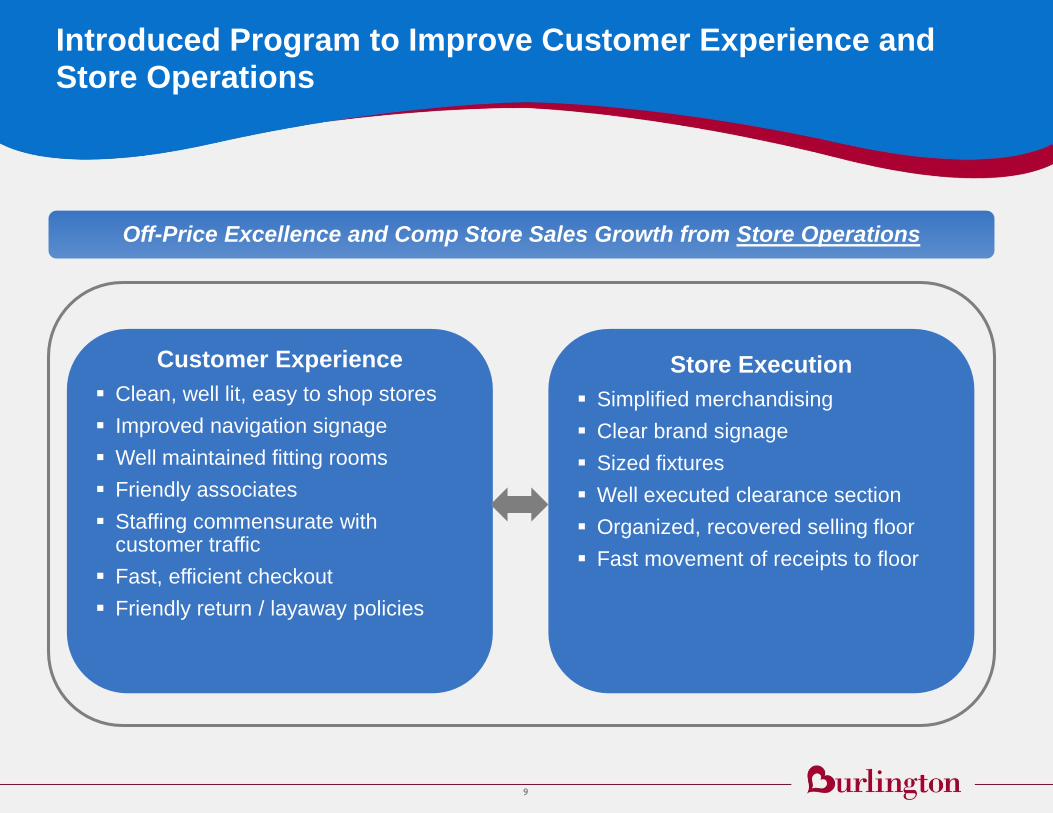
Introduced Program to Improve Customer Experience and Store Operations
Customer Experience
Clean, well lit, easy to shop stores
Improved navigation signage
Well maintained fitting rooms
Friendly associates
Staffing commensurate with customer traffic
Fast, efficient checkout
Friendly return / layaway policies
Store Execution
Simplified merchandising
Clear brand signage
Sized fixtures
Well executed clearance section
Organized, recovered selling floor
Fast movement of receipts to floor
Off-Price Excellence and Comp Store Sales Growth from Store Operations
10
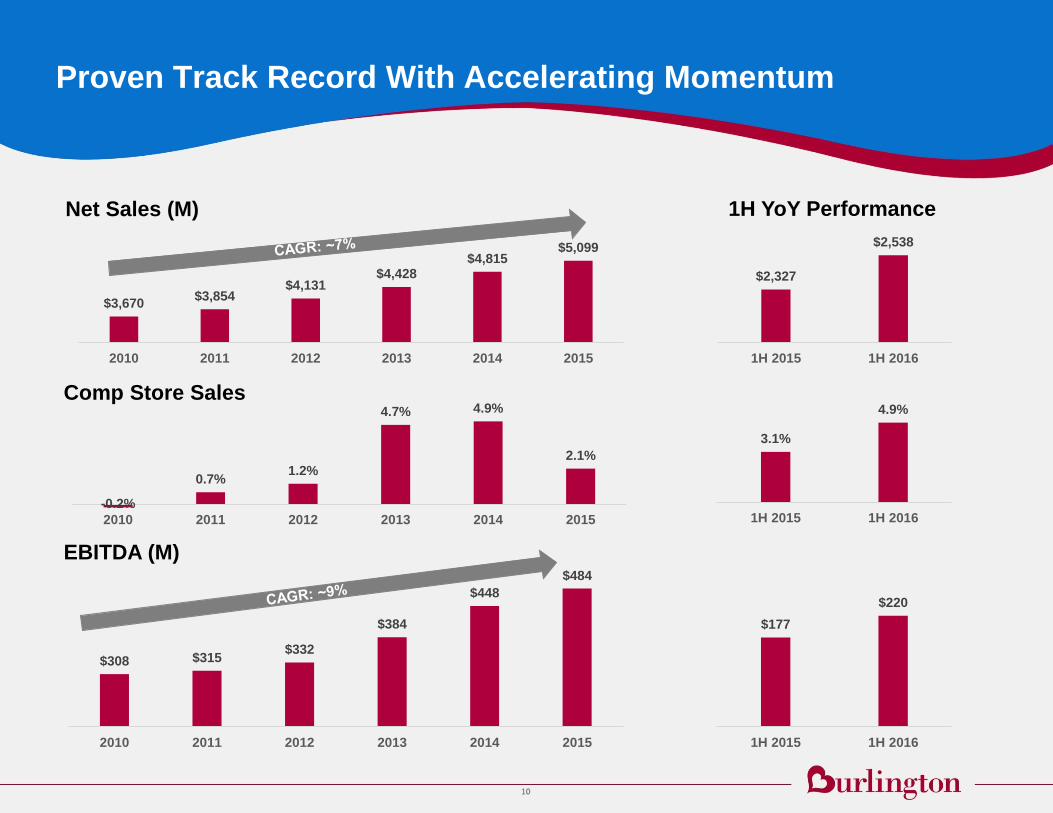
-0.2%
0.7%1.2%
4.7% 4.9%
2.1%
2010 2011 2012 2013 2014 2015
$308 $315$332
$384
$448
$484
2010 2011 2012 2013 2014 2015
Proven Track Record With Accelerating Momentum
Net Sales (M)
Comp Store Sales
EBITDA (M)
$2,327
$2,538
1H 2015 1H 2016
3.1%
4.9%
1H 2015 1H 2016
$177
$220
1H 2015 1H 2016
$3,670$3,854
$4,131$4,428
$4,815$5,099
2010 2011 2012 2013 2014 2015
1H YoY Performance

11
Significant Opportunities for Continued Growth
Drive Comparable Store Sales
Growth
Increase sales in underpenetrated areas including Home, Beauty and Ladies
Apparel
Utilize web-based survey to continue to improve overall customer satisfaction
scores
Maintain focus on improving merchandise localization
Continue to drive traffic with the marketing testimonial campaign
Expand Our Retail Store Base
Expand Operating Margins
Drive Earnings per Share
Opportunistic Share Repurchase
Continue to improve inventory turnover
Increase purchasing power
Leverage expense base
Execute share repurchase program opportunistically
New stores have an average payback period of less than three years
The vast majority of stores are profitable on a store-level cash flow basis
Successful across geographic regions, population densities, store footprints
and real estate settings
Significant white space for growth with potential for approximately 1,000
stores, expanding in both existing and new markets

12
Appendix
13
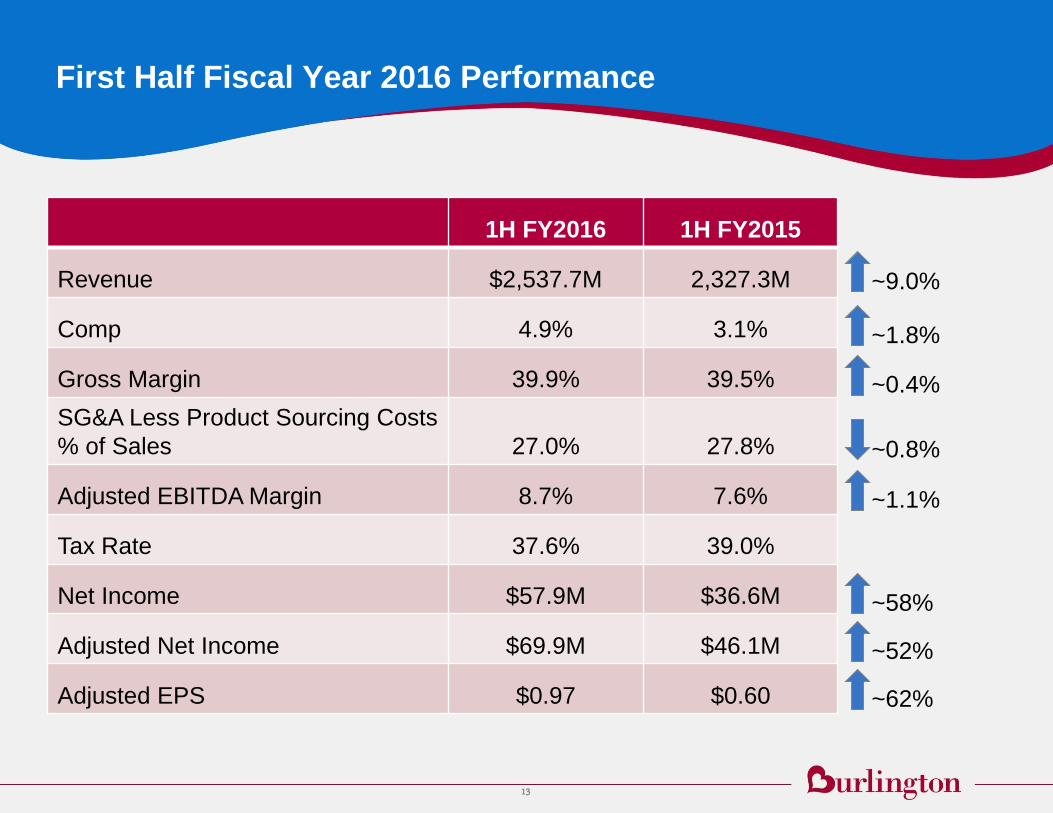
First Half Fiscal Year 2016 Performance
1H FY2016 1H FY2015
Revenue $2,537.7M 2,327.3M
Comp 4.9% 3.1%
Gross Margin 39.9% 39.5%
SG&A Less Product Sourcing Costs
% of Sales 27.0% 27.8%
Adjusted EBITDA Margin 8.7% 7.6%
Tax Rate 37.6% 39.0%
Net Income $57.9M $36.6M
Adjusted Net Income $69.9M $46.1M
Adjusted EPS $0.97 $0.60
~9.0%
~52%
~62%
~58%
~1.1%
~0.4%
~0.8%
~1.8%
14
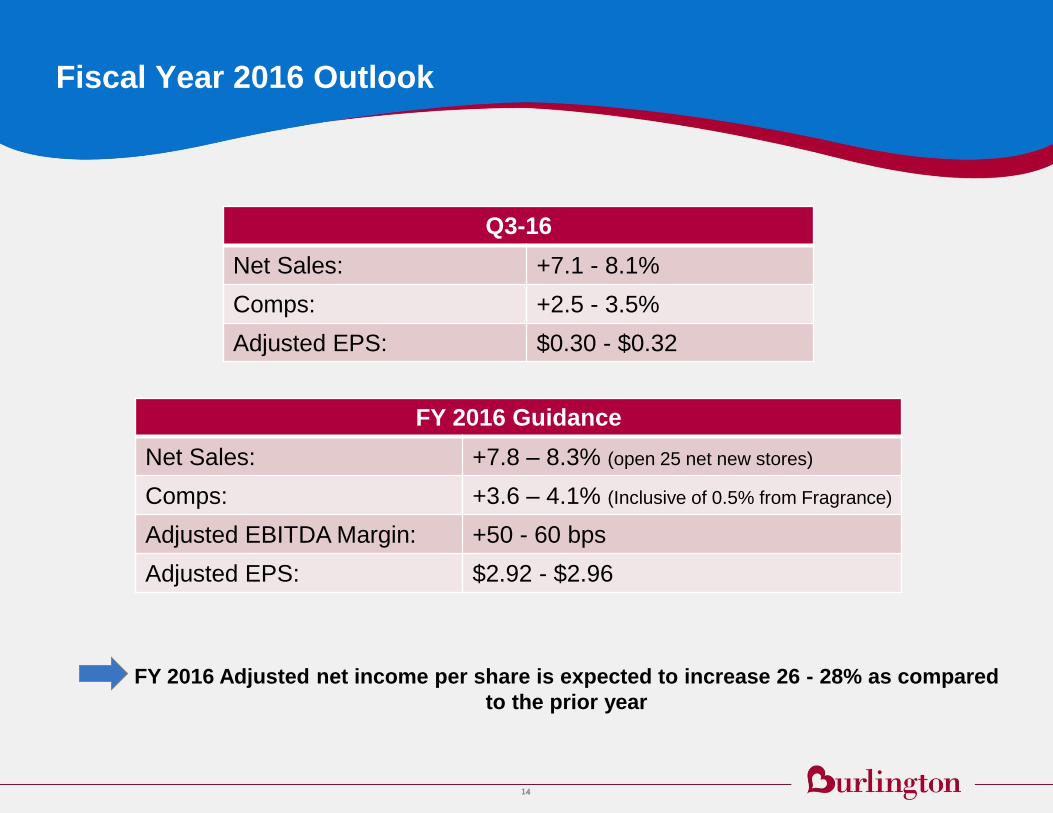
Fiscal Year 2016 Outlook
FY 2016 Adjusted net income per share is expected to increase 26 - 28% as compared
to the prior year
Q3-16
Net Sales: +7.1 - 8.1%
Comps: +2.5 - 3.5%
Adjusted EPS: $0.30 - $0.32
FY 2016 Guidance
Net Sales: +7.8 – 8.3% (open 25 net new stores)
Comps: +3.6 – 4.1% (Inclusive of 0.5% from Fragrance)
Adjusted EBITDA Margin: +50 - 60 bps
Adjusted EPS: $2.92 - $2.96

15
Debt Profile
Debt Profile
($ in millions) Before IPO (1-Oct-13) 30-Jan-16 xLTM EBITDA 1
ABL $64 $167
Term Loan 862 1,113
Cap Leases 23 25
Total Senior Secured Debt $949 1,305$ 2.70x
Senior Unsecured Notes 450 -
Senior Unsecured HoldCo Notes 344 -
Total Debt $1,743 1,305$ 2.70x
1 TTM Adjusted EBITDA of $484.0mm

16
Adjusted Net Income and Adjusted EBITDA Reconciliation
Historical Adjusted Net Income Reconciliation
Historical Adjusted EBITDA Reconciliation
1 53 weeks
($ in millions) FY 121
FY 13 FY 14 FY 15 1H FY 16
Net Income $25.3 $16.2 $66.0 $150.5 $57.9
Net Favorable Lease Amortization 31.3 29.3 26.0 24.1 12.1
Costs Related to Debt Amendments & Offering 4.2 23.0 2.4 0.2 1.4
Loss on Extinguishment of Debt 2.2 16.1 74.3 0.7 3.8
Impairment Charges 11.5 3.2 2.6 6.1 0.1
Advisory Fees 4.3 2.9 0.2 0.1 -
Stock Option Modification Expense - 10.4 2.9 1.4 0.4
Litigation Accural - - 9.3 5.6 1.4
Tax Effect (19.2) (30.9) (45.1) (14.1) (7.2)
Adjusted Net Income $59.6 $70.2 $138.6 $174.6 $69.9
($ in millions) FY 121
FY 13 FY 14 FY 15 1H FY 16
Net Income $25.3 $16.2 $66.0 $150.5 $57.9
Interest Expense, Net 113.8 127.5 83.7 58.9 30.0
Loss on Extinguishment of Debt 2.2 16.1 74.3 0.7 3.8
Income Tax Expense 3.9 16.2 39.1 88.4 34.9
Depreciation and Amortization 166.8 168.2 167.6 172.1 90.2
Impairment Charges 11.5 3.2 2.6 6.1 0.1
Advisory Fees 4.3 2.9 0.2 0.1 -
Stock Option Modification Expense - 10.4 2.9 1.4 0.4
Litigation Accural - - 9.3 5.6 1.4
Costs Related to Debt Amendments & Offering 4.2 23.0 2.4 0.2 1.4
Adjusted EBITDA $332.0 $383.7 $448.1 $484.0 $220.1