Cxense ASA-Q1-2015-presentation - Jørgen Loeng
28
Cxense ASA Q1 2015 presentation 13 May 2015
-
Upload
cxense -
Category
Investor Relations
-
view
168 -
download
4
Transcript of Cxense ASA-Q1-2015-presentation - Jørgen Loeng

Cxense ASA Q1 2015 presentation 13 May 2015

2
THIS PRESENTATION AND ITS ENCLOSURES AND APPENDICES (HEREINAFTER JOINTLY REFERRED TO AS THE “PRESENTATION”) HAVE BEEN PREPARED BY CXENSE ASA (THE”COMPANY”) EXCLUSIVELY FOR INFORMATION PURPOSES. THIS PRESENTATION HAS NOT BEEN REVIEWED OR REGISTERED WITH ANY PUBLIC AUTHORITY OR STOCK EXCHANGE. RECIPIENTS OF THIS PRESENTATION MAY NOT REPRODUCE, REDISTRIBUTE OR PASS ON, IN WHOLE OR IN PART, THE PRESENTATION TO ANY OTHER PERSON. THE CONTENTS OF THIS PRESENTATION ARE NOT TO BE CONSTRUED AS LEGAL, BUSINESS, INVESTMENT OR TAX ADVICE. EACH RECIPIENT SHOULD CONSULT WITH ITS OWN LEGAL, BUSINESS, INVESTMENT AND TAX ADVISER AS TO LEGAL, BUSINESS, INVESTMENT AND TAX ADVICE. THERE MAY HAVE BEEN CHANGES IN MATTERS, WHICH AFFECT THE COMPANY SUBSEQUENT TO THE DATE OF THIS PRESENTATION. NEITHER THE ISSUE NOR DELIVERY OF THIS PRESENTATION SHALL UNDER ANY CIRCUMSTANCE CREATE ANY IMPLICATION THAT THE INFORMATION CONTAINED HEREIN IS CORRECT AS OF ANY TIME SUBSEQUENT TO THE DATE HEREOF OR THAT THE AFFAIRS OF THE COMPANY HAVE NOT SINCE CHANGED, AND THE COMPANY DOES NOT INTEND, AND DOES NOT ASSUME ANY OBLIGATION, TO UPDATE OR CORRECT ANY INFORMATION INCLUDED IN THIS PRESENTATION. THIS PRESENTATION INCLUDES AND IS BASED ON, AMONG OTHER THINGS, FORWARD-LOOKING INFORMATION AND STATEMENTS. SUCH FORWARD-LOOKING INFORMATION AND STATEMENTS ARE BASED ON THE CURRENT EXPECTATIONS, ESTIMATES AND PROJECTIONS OF THE COMPANY OR ASSUMPTIONS BASED ON INFORMATION AVAILABLE TO THE COMPANY. SUCH FORWARD-LOOKING INFORMATION AND STATEMENTS REFLECT CURRENT VIEWS WITH RESPECT TO FUTURE EVENTS AND ARE SUBJECT TO RISKS, UNCERTAINTIES AND ASSUMPTIONS. THE COMPANY CANNOT GIVE ANY ASSURANCE AS TO THE CORRECTNESS OF SUCH INFORMATION AND STATEMENTS. AN INVESTMENT IN THE COMPANY INVOLVES RISK, AND SEVERAL FACTORS COULD CAUSE THE ACTUAL RESULTS, PERFORMANCE OR ACHIEVEMENTS OF THE COMPANY TO BE MATERIALLY DIFFERENT FROM ANY FUTURE RESULTS, PERFORMANCE OR ACHIEVEMENTS THAT MAY BE EXPRESSED OR IMPLIED BY STATEMENTS AND INFORMATION IN THIS PRESENTATION, INCLUDING, AMONG OTHERS, RISKS OR UNCERTAINTIES ASSOCIATED WITH THE COMPANY’S BUSINESS, SEGMENTS, DEVELOPMENT, GROWTH MANAGEMENT, FINANCING, MARKET ACCEPTANCE AND RELATIONS WITH CUSTOMERS, AND, MORE GENERALLY, GENERAL ECONOMIC AND BUSINESS CONDITIONS, CHANGES IN DOMESTIC AND FOREIGN LAWS AND REGULATIONS, TAXES, CHANGES IN COMPETITION AND PRICING ENVIRONMENTS, FLUCTUATIONS IN CURRENCY EXCHANGE RATES AND INTEREST RATES AND OTHER FACTORS. SHOULD ONE OR MORE OF THESE RISKS OR UNCERTAINTIES MATERIALISE, OR SHOULD UNDERLYING ASSUMPTIONS PROVE INCORRECT, ACTUAL RESULTS MAY VARY MATERIALLY FROM THOSE DESCRIBED IN THIS DOCUMENT. THE COMPANY DOES NOT INTEND, AND DOES NOT ASSUME ANY OBLIGATION, TO UPDATE OR CORRECT THE INFORMATION INCLUDED IN THIS PRESENTATION. THIS PRESENTATION IS SUBJECT TO NORWEGIAN LAW, AND ANY DISPUTE ARISING IN RESPECT OF THIS PRESENTATION IS SUBJECT TO THE EXCLUSIVE JURISDICTION OF NORWEGIAN COURTS
Important notice

3
We enable businesses to understand, engage and monetize their audience
• Real-time user tracking and profile building regardless of whether the users access the sites via mobile, tablet or desktop
• Individually tailored web content and advertisements create unique user experiences
• Proprietary «big data» management software
Attractive outlook and leading position
• Increasing focus on user-targeted marketing
• Still in early stages of adoption
Long-term client relationships
• Attractive business model
Adopted by global media leaders Adopted by global media leaders
Cxense at a glance
SaaS revenues and gross margin
SaaS revenues and gross margin
50%
60%
70%
80%
90%
0
1 000
2 000
3 000
4 000
4Q12 1Q13 2Q13 3Q13 4Q13* 1Q14 2Q14 3Q14 4Q14 1Q15
USD
1 0
00
Revenues Gross margin
* Emediate included in revenues from 4Q13

4
Predictable high-growth revenue stream
The “SaaS” (software as-a-service) revenue model provides revenue visibility
12-24 month contract durations and auto renewal
Unique technology with infinite scalability and real-time accessibility
The Cxense data engine is a core part of our clients’ internet offering
More than half a billion user profiles maintained across more than 5 000 internet sites
Robust growth in several geographical markets and verticals
Powering premium publishers and E-commerce companies
The enterprise market has untapped potential
Market penetration accelerated with recent strengthening of sales team
Estimated annualized revenue from SaaS backlog at qtr. end
Estimated annualized revenue from SaaS backlog at qtr. end
SaaS is the business model for the future
Number of new contracts signed
Number of new contracts signed
10
11
12
13
14
15
16
17
18
19
2Q14 3Q14 4Q14 1Q15
US
Dm
0
5
10
15
20
25
30
35
40
1Q13 2Q13 3Q13 4Q13 1Q14 2Q14 3Q14 4Q14 1Q15

5
Agenda
Highlights
Operational review
Financial review
Technology update
6
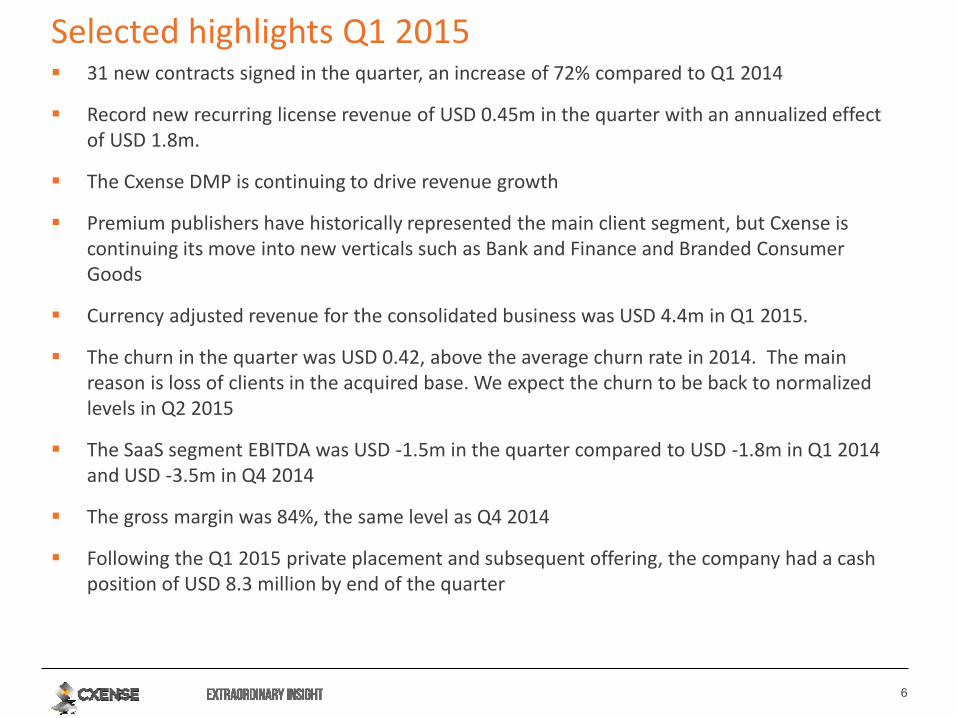
Selected highlights Q1 2015 31 new contracts signed in the quarter, an increase of 72% compared to Q1 2014
Record new recurring license revenue of USD 0.45m in the quarter with an annualized effect of USD 1.8m.
The Cxense DMP is continuing to drive revenue growth
Premium publishers have historically represented the main client segment, but Cxense is continuing its move into new verticals such as Bank and Finance and Branded Consumer Goods
Currency adjusted revenue for the consolidated business was USD 4.4m in Q1 2015.
The churn in the quarter was USD 0.42, above the average churn rate in 2014. The main reason is loss of clients in the acquired base. We expect the churn to be back to normalized levels in Q2 2015
The SaaS segment EBITDA was USD -1.5m in the quarter compared to USD -1.8m in Q1 2014 and USD -3.5m in Q4 2014
The gross margin was 84%, the same level as Q4 2014
Following the Q1 2015 private placement and subsequent offering, the company had a cash position of USD 8.3 million by end of the quarter
7
Agenda
Highlights
Operational review
Financial review
Technology update

8
EMEA Swedish Publisher
EMEA Spanish Publisher
Japan Japanese Publisher
North America Reseller/Partner
Latin America Broadcaster in South America
Selected contracts in Q1 2015
9
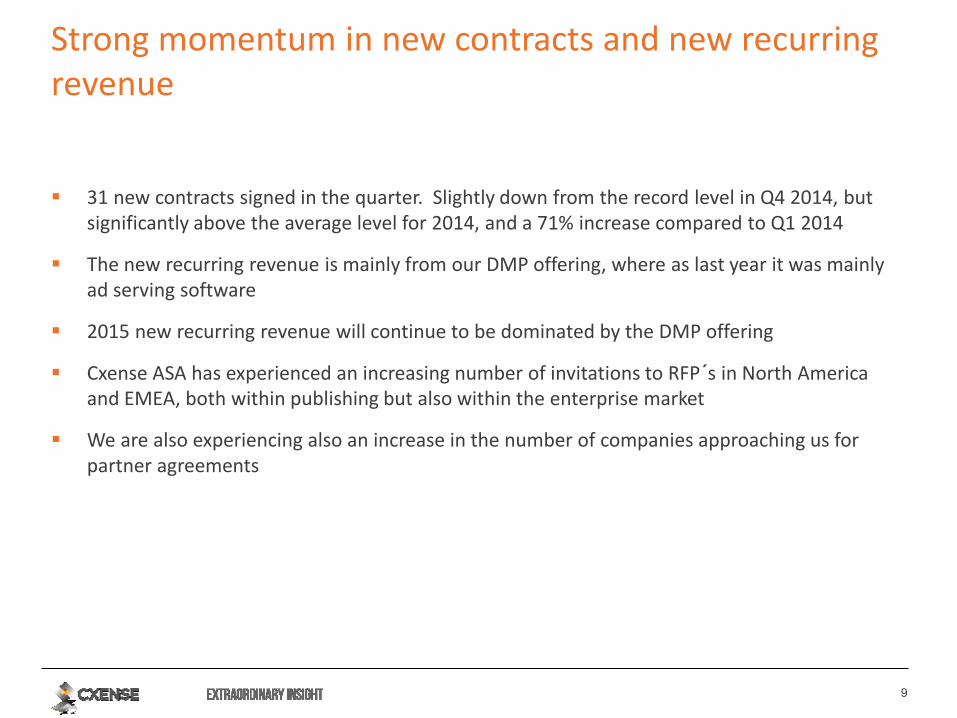
Strong momentum in new contracts and new recurring revenue
31 new contracts signed in the quarter. Slightly down from the record level in Q4 2014, but significantly above the average level for 2014, and a 71% increase compared to Q1 2014
The new recurring revenue is mainly from our DMP offering, where as last year it was mainly ad serving software
2015 new recurring revenue will continue to be dominated by the DMP offering
Cxense ASA has experienced an increasing number of invitations to RFP´s in North America and EMEA, both within publishing but also within the enterprise market
We are also experiencing also an increase in the number of companies approaching us for partner agreements

10
Business as usual for portfolio
We experienced higher churn in Q1 2015 – one lost contract represent a large part of total churn in Q1
The churn is from our acquired customer base (Q4 2013)
We expect the churn, in percentage of client base, to be the same for 2015 as for 2014
Quarterly churn in USD
11
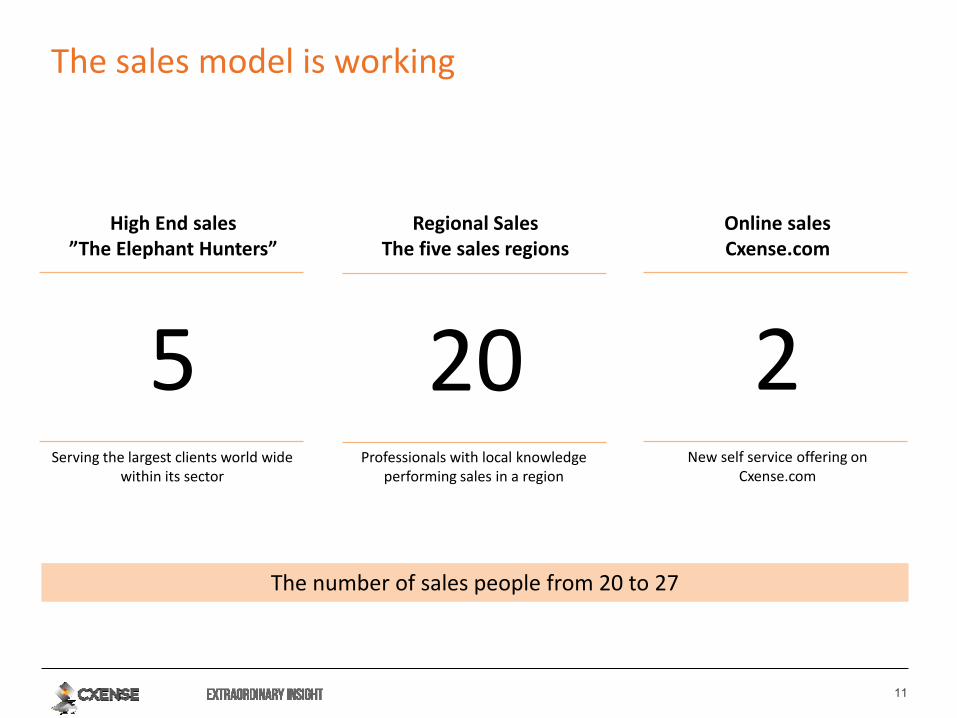
2 20 5
The sales model is working
High End sales ”The Elephant Hunters”
Regional Sales The five sales regions
Online sales Cxense.com
Serving the largest clients world wide within its sector
Professionals with local knowledge performing sales in a region
New self service offering on Cxense.com
The number of sales people from 20 to 27

12
Agenda
Highlights
Operational review
Financial review
Technology update

13
USD appreciation masks growing underlying SaaS sales
1.0
0.5
0.0
4.0
3.5
3.0
2.5
2.0
1.5
-8%
Q1 ’15
3.30
Q4 ’14
3.59
Q3 ’14
3.53
Q2 ’14
3.44
Q1 ’14
3.57
Reported SaaS segment revenues – USD million
0
4
8
12
16
20
24
2825.3
Q3 ’14
22.3
Q2 ’14
21.1
Q1 ’14
21.8
+19%
Q4 ’14 Q1 ’15
25.9
SaaS segment revenues – NOK million*
*Calculated from reported revenues using average quarterly FX rates
14
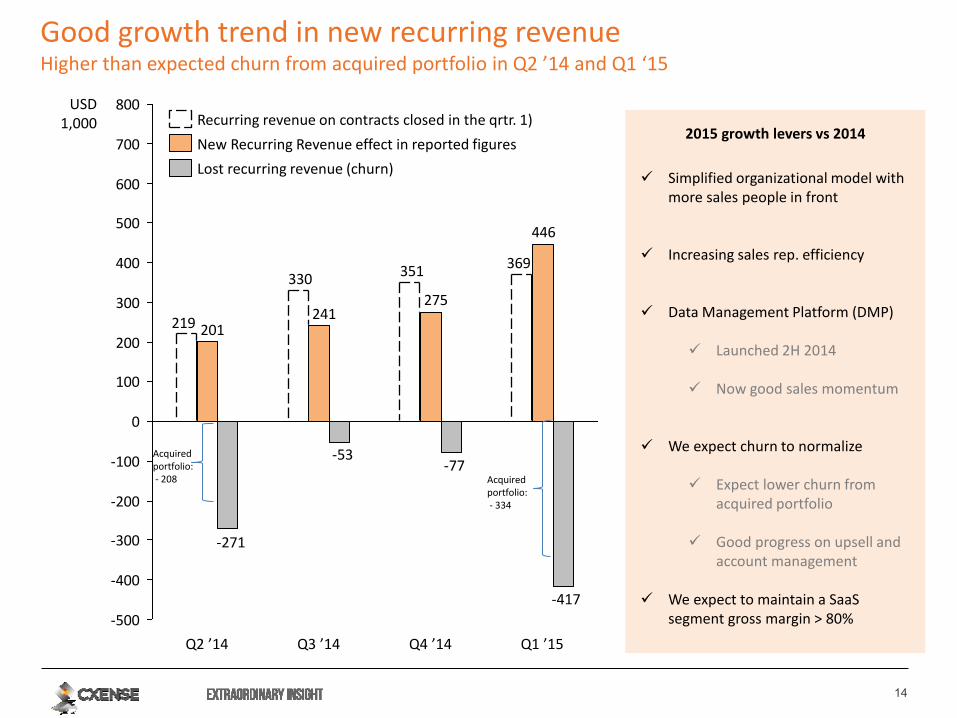
Good growth trend in new recurring revenue Higher than expected churn from acquired portfolio in Q2 ’14 and Q1 ‘15
369351330
219
446
275241
201
-417
-77-53
-271
-500
-400
-300
-200
-100
0
100
200
300
400
500
600
700
800
Q3 ’14 Q2 ’14
USD 1,000
Q4 ’14 Q1 ’15
Recurring revenue on contracts closed in the qrtr. 1)
Lost recurring revenue (churn)
New Recurring Revenue effect in reported figures
Acquired portfolio: - 334
Acquired portfolio: - 208
2015 growth levers vs 2014
Simplified organizational model with more sales people in front
Increasing sales rep. efficiency
Data Management Platform (DMP)
Launched 2H 2014
Now good sales momentum
We expect churn to normalize
Expect lower churn from acquired portfolio
Good progress on upsell and account management
We expect to maintain a SaaS segment gross margin > 80%
15
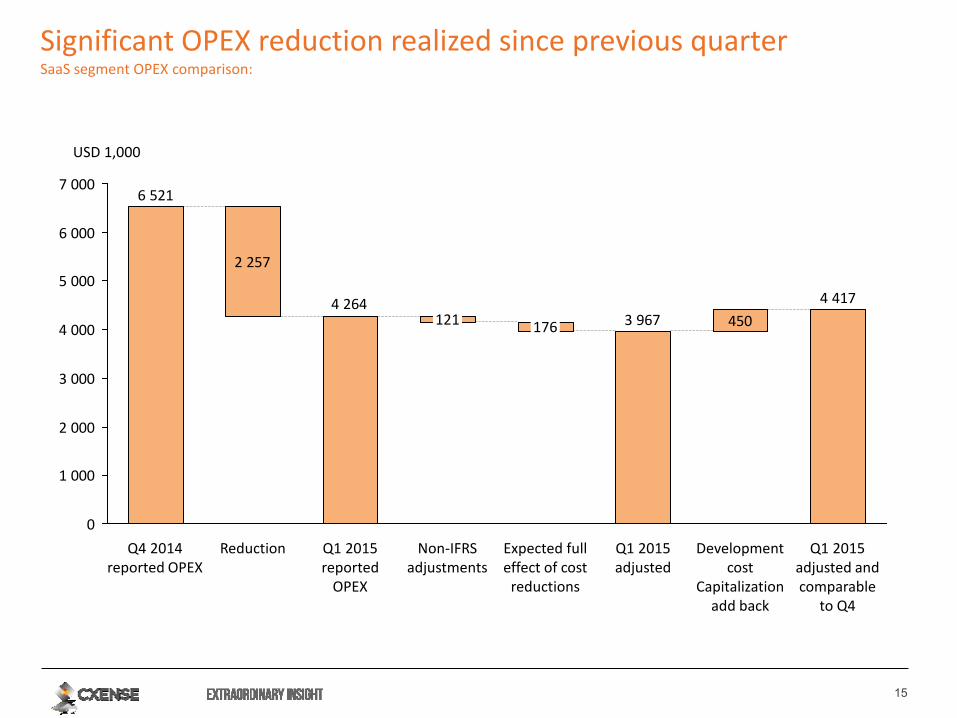
Significant OPEX reduction realized since previous quarter SaaS segment OPEX comparison:
2 257
4 417
4504 264
6 521
3 967
0
1 000
2 000
3 000
4 000
5 000
6 000
7 000
Q1 2015 reported
OPEX
Reduction Q4 2014 reported OPEX
176
Expected full effect of cost
reductions
Q1 2015 adjusted
121
Non-IFRS adjustments
Q1 2015 adjusted and comparable
to Q4
Development cost
Capitalization add back
USD 1,000
16
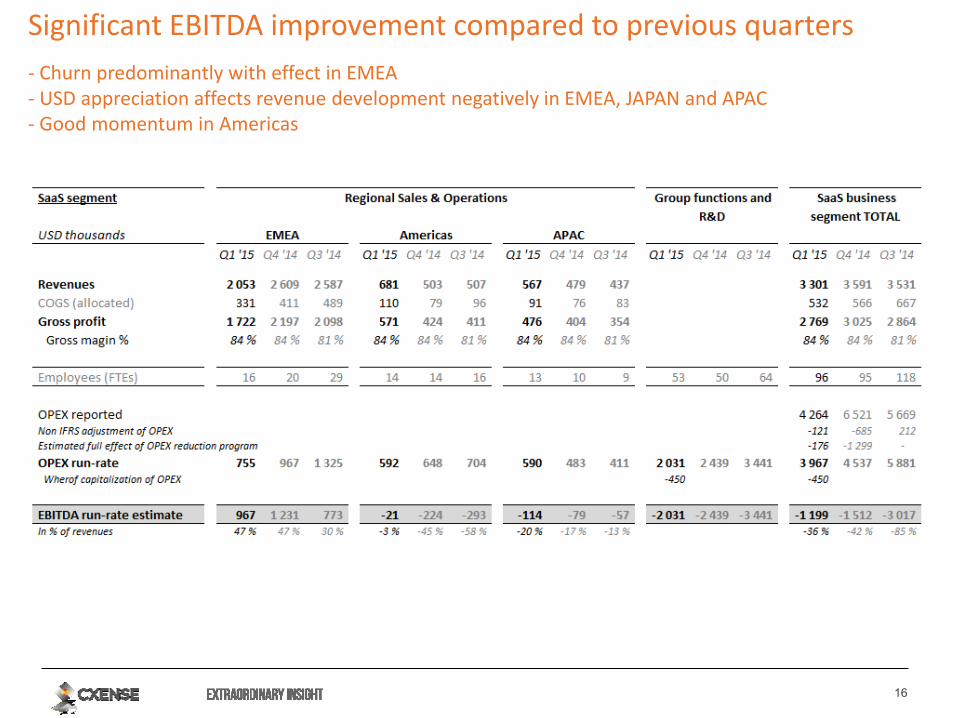
Significant EBITDA improvement compared to previous quarters x
- Churn predominantly with effect in EMEA - USD appreciation affects revenue development negatively in EMEA, JAPAN and APAC - Good momentum in Americas
17
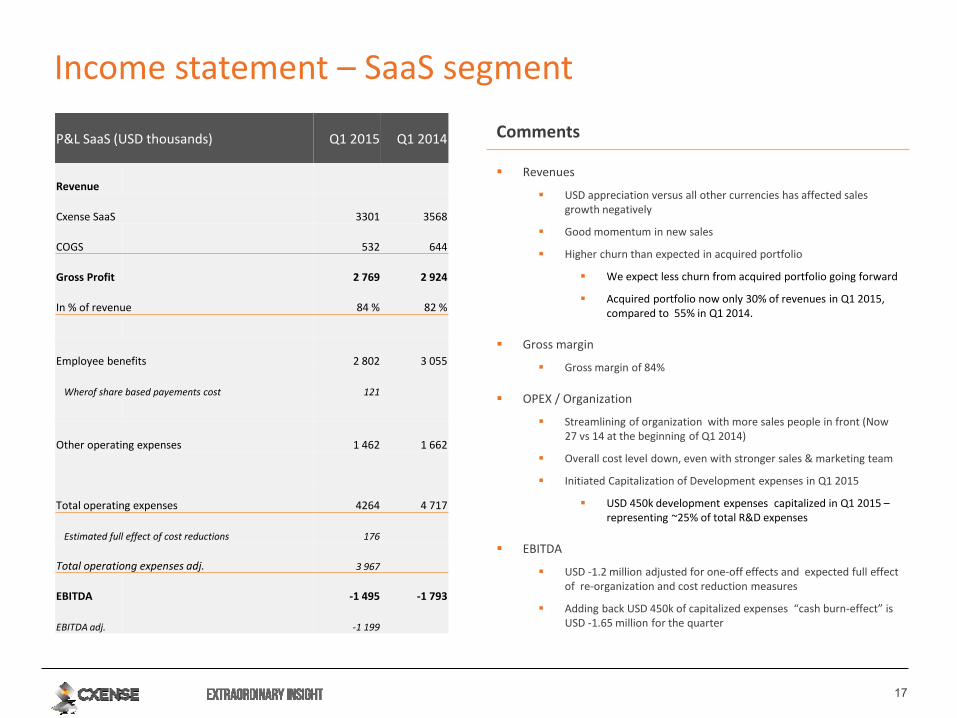
Revenues
USD appreciation versus all other currencies has affected sales growth negatively
Good momentum in new sales
Higher churn than expected in acquired portfolio
We expect less churn from acquired portfolio going forward
Acquired portfolio now only 30% of revenues in Q1 2015, compared to 55% in Q1 2014.
Gross margin
Gross margin of 84%
OPEX / Organization
Streamlining of organization with more sales people in front (Now 27 vs 14 at the beginning of Q1 2014)
Overall cost level down, even with stronger sales & marketing team
Initiated Capitalization of Development expenses in Q1 2015
USD 450k development expenses capitalized in Q1 2015 – representing ~25% of total R&D expenses
EBITDA
USD -1.2 million adjusted for one-off effects and expected full effect of re-organization and cost reduction measures
Adding back USD 450k of capitalized expenses “cash burn-effect” is USD -1.65 million for the quarter
Income statement – SaaS segment
Comments P&L SaaS (USD thousands) Q1 2015 Q1 2014
Revenue
Cxense SaaS 3301 3568
COGS 532 644
Gross Profit 2 769 2 924
In % of revenue 84 % 82 %
Employee benefits 2 802 3 055
Wherof share based payements cost 121
Other operating expenses 1 462 1 662
Total operating expenses 4264 4 717
Estimated full effect of cost reductions 176
Total operationg expenses adj. 3 967
EBITDA -1 495 -1 793
EBITDA adj. -1 199

18
Consolidated Statement of Financial Position
Comments
Total assets of USD 20.9 million
Largest components:
Cash
Goodwill and intangible non-current assets related to the acquisition of Emediate and capitalized development costs.
Very limited fixed assets except for USD 400 thousand invested in hosting equipment under Office machinery, equipment etc.
Q4 2014 Trade receivables of USD 2.12 million (49 days) compared to USD 2.9 million (59 days) in Q4 2013.
Cash and cash equivalents of USD 8.3 million
Other short term assets of USD 1.6 million [including escrow account related to Emediate acquisition of ~USD 1 million]
Current liabilities of USD 4.8 million [including escrow account related to Emediate acquisition of ~USD 1 million]
Total equity of USD 15.6 million
USD thousands As of 31
Mar 2015 As of 31
Mar 2014
Non-current assets
Goodwill 3 807 3 807
Deferred tax assets 34 49
Intangible assets 4 434 5 337
Office machinery, equipment, etc. 400 279
Other financial assets 173 48
Total non-current assets 8 847 9 519
Current assets
Trade receivables 2 120 2 931
Other short-term assets 1 641 2 332
Cash and cash equivalents 8 291 5 936
Total current assets 12 051 11 199
Assets classified as "held for sale" 0 0
Total Assets 20 898 20 718
Total Equity 15 616 15 135
Non-current liabilities
Deferred tax liabilities 507 633
Total non-current liabilities 507 633
Non-current liabilities
Trade payables 1 100 1 112
Current taxes 77 58
Other short-term liabilities 3 597 3 780
Total current liabilities 4 775 4 950
Liabilities related to assets "held for sale" 0 0
Total equity and liabilities 20 898 20 718

19
Cash flow statement
Comments
• Net cash flow used in operating activities was USD 2.76 million in Q1 2015, compared to USD 2.86 million in Q1 2015 and USD 2.26 in Q4 2014.
• In Q1 2015 cash flow used in operating activities was significantly higher than the Q1 2015 EBITDA. This is explained by: – Significant accrued costs and trade payables at the end of
Q4 2014 that were paid during Q1 2015.
• The accrued costs in Q4 2014 relate mostly to the organizational streamlining done in Q4 2014 were provisions were made for costs with later payments following lay-offs.
– Currency translation effects also affected the Q1 2015 cash flow from operations negatively.
• In Q4 2014 we saw the opposite effect where cash flow from operations was significantly better than reported EBITDA.
• Investments in intangible assets in Q1 2015 relates to the cash effect of capitalized development expenses
*After the share issue there were 3 681 717 shares outstanding. There were also 718 634 warrants and 173 380 share options outstanding
Cash flow statement Q1 2015 Q1 2014
Cash flow from operating activities
P/(L) before income tax (inc. disposal group) -1 890 -2 147
Adjustments:
Income tax payable 29 -
Share- based payments 121 74
Result from investment in associates - -
Depreciation and amortization 358 313
Currency translation effects -624 117
Change in trade receivables 30 69
Change in trade payables -354 -821
Change in other accrual and non-current items -431 -465
Net cash flow from / (used in) op. activities -2 761 -2 860
Cash flow from investing activities
Investment in fixed assets 6 -16
Investment in intangible assets -406 -
Investment in associated companies - -31
Investment in subsidiary (1) - -
Sale of subsidiary (1) - -
Net cash flow from / (used in) investing activities -400 -47
Cash flow from financing activities
Net proceeds from share issues 8 624 -
Proceeds from minority interest - -
Net cash flow from / (used in) finaning activities 8 624 0
Net inc / (dec) in cash and cash equivalents 5 462 -2 907
(1) Cash effects are net of cash received on sale of subsidiary,
and cash held by the subsidiary.
20
Agenda
Highlights
Operational review
Financial review
Technology update
21
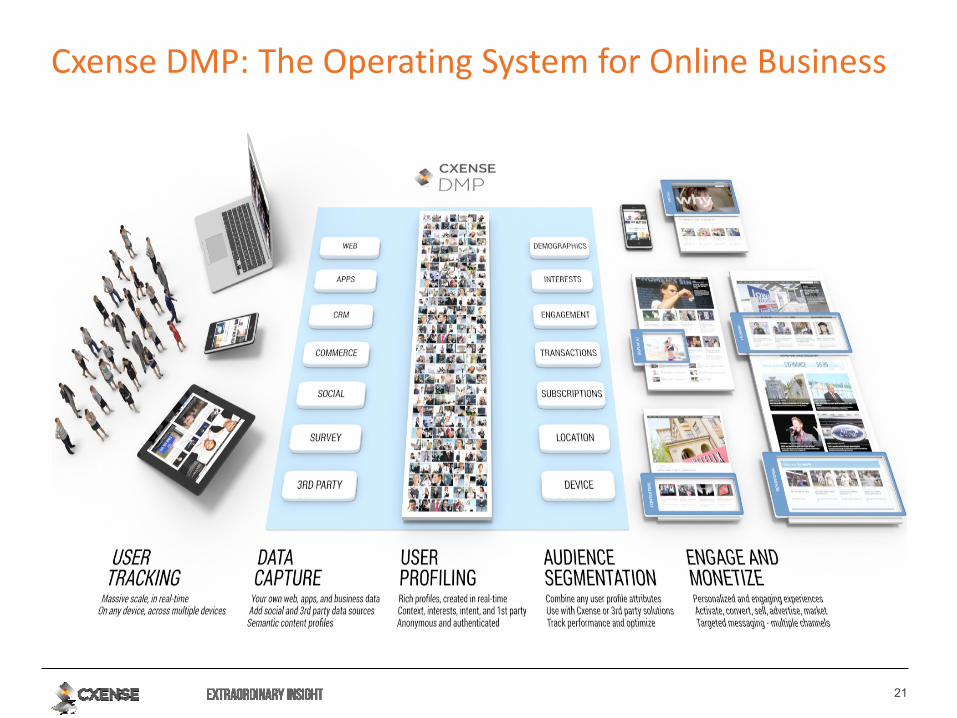
Cxense DMP: The Operating System for Online Business
22
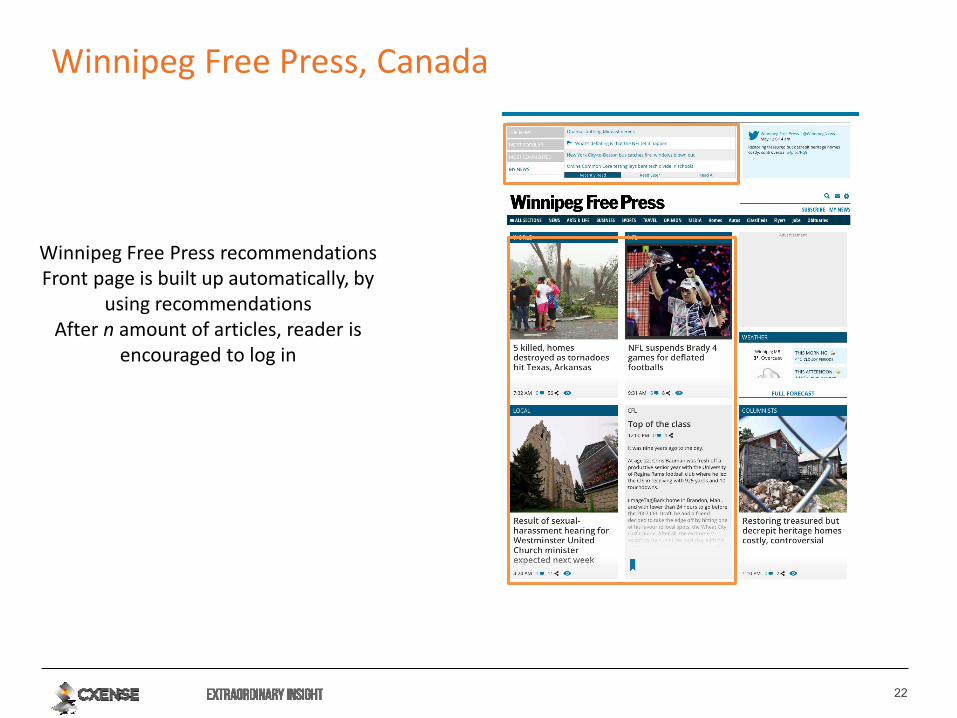
Winnipeg Free Press, Canada
Winnipeg Free Press recommendations Front page is built up automatically, by
using recommendations After n amount of articles, reader is
encouraged to log in

23
Excelsior, Mexico
Excelsior.com.mx,
topic pages and front-page Content
recommendation widgets automatically building topic pages
24
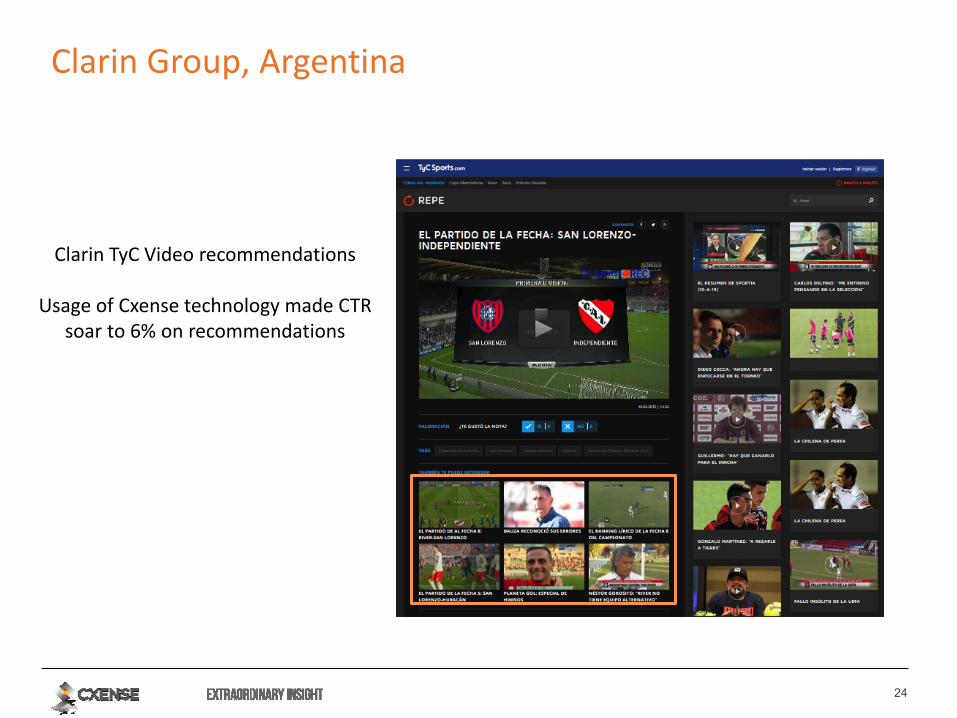
Clarin Group, Argentina
Clarin TyC Video recommendations
Usage of Cxense technology made CTR soar to 6% on recommendations
25
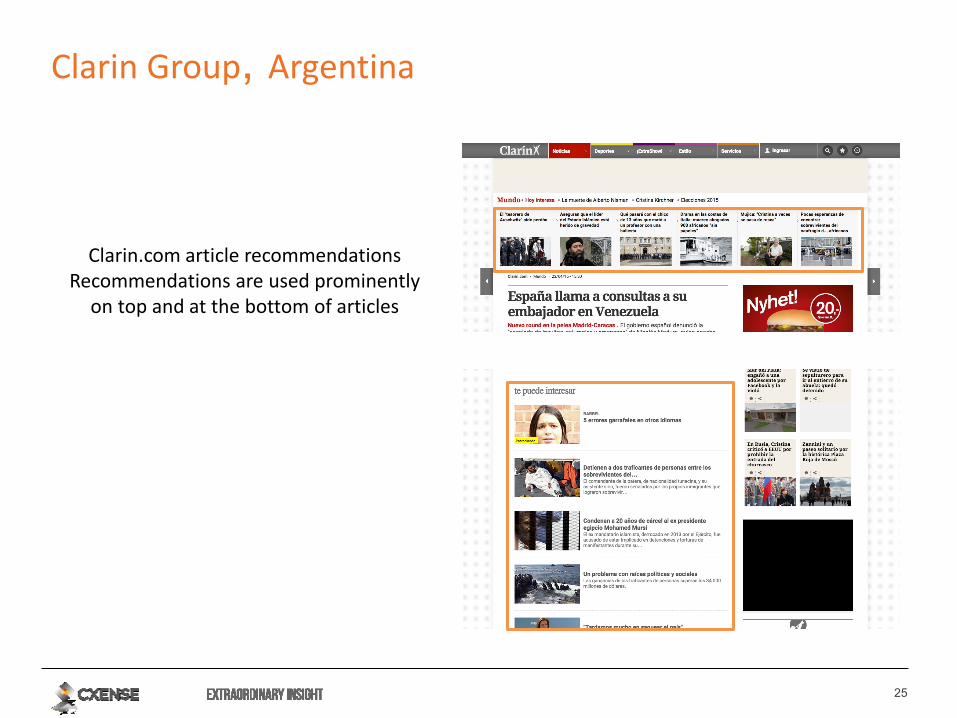
Clarin Group, Argentina
Clarin.com article recommendations Recommendations are used prominently
on top and at the bottom of articles

26
Summary Q1 2015
31 new contracts signed in the quarter
Record new recurring revenue
Cxense DMP is continuing to drive revenue growth
Higher churn from the acquired base, but expected to be back to normalized level in Q2 2015
Cost control and significant reduction in operating cost
Gross margin of 84%
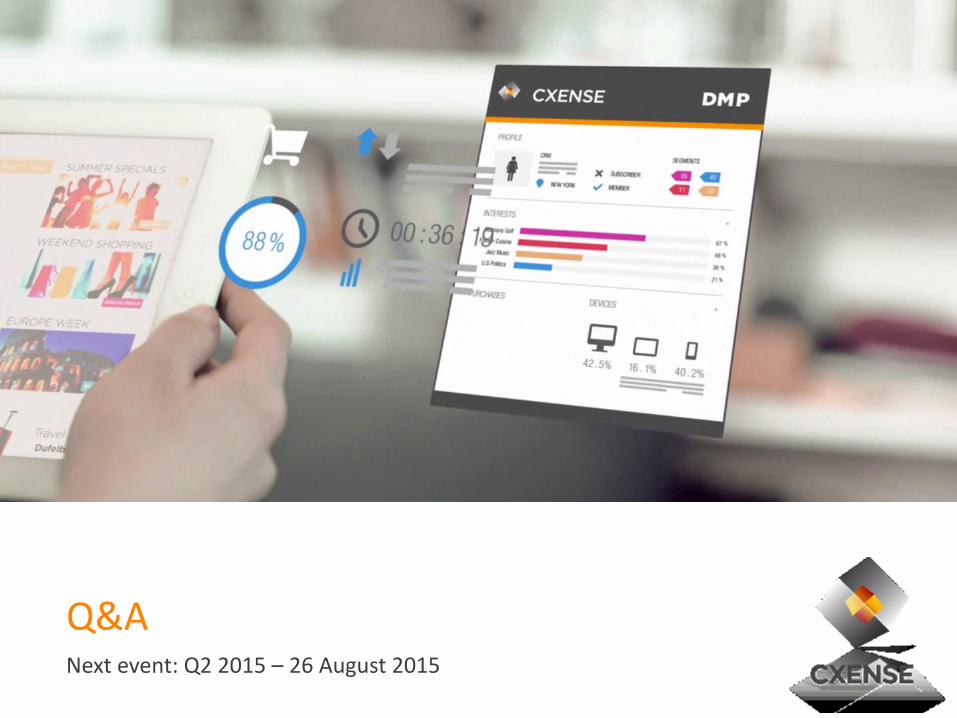
Q&A Next event: Q2 2015 – 26 August 2015

28 12.05.2015
Customer case studies from around the globe – demos & workshops using Cxense tech Register today to attend: Cxense.com/CXXP
John Paton CEO
Digital First Media
Elsie Cheung COO
South China Morning Post
Achillefs Manolopoulos Head of Digital UX
Commercial Bank of Dubai