Di Girolamo, C; Walters, S; Gildea, C; Benitez Majano, S ... we assess Cancer... · Benitez-Majano...
22
Di Girolamo, C; Walters, S; Gildea, C; Benitez Majano, S; Rachet, B; Morris, M (2018) Can we assess Cancer Waiting Time targets with cancer survival? A population-based study of individually linked data from the National Cancer Waiting Times monitoring dataset in Eng- land, 2009-2013. PloS one, 13 (8). e0201288. ISSN 1932-6203 DOI: https://doi.org/10.1371/journal.pone.0201288 Downloaded from: http://researchonline.lshtm.ac.uk/4648991/ DOI: 10.1371/journal.pone.0201288 Usage Guidelines Please refer to usage guidelines at http://researchonline.lshtm.ac.uk/policies.html or alterna- tively contact [email protected]. Available under license: http://creativecommons.org/licenses/by/2.5/
Transcript of Di Girolamo, C; Walters, S; Gildea, C; Benitez Majano, S ... we assess Cancer... · Benitez-Majano...
Di Girolamo, C; Walters, S; Gildea, C; Benitez Majano, S; Rachet, B;Morris, M (2018) Can we assess Cancer Waiting Time targets withcancer survival? A population-based study of individually linked datafrom the National Cancer Waiting Times monitoring dataset in Eng-land, 2009-2013. PloS one, 13 (8). e0201288. ISSN 1932-6203 DOI:https://doi.org/10.1371/journal.pone.0201288
Downloaded from: http://researchonline.lshtm.ac.uk/4648991/
DOI: 10.1371/journal.pone.0201288
Usage Guidelines
Please refer to usage guidelines at http://researchonline.lshtm.ac.uk/policies.html or alterna-tively contact [email protected].
Available under license: http://creativecommons.org/licenses/by/2.5/
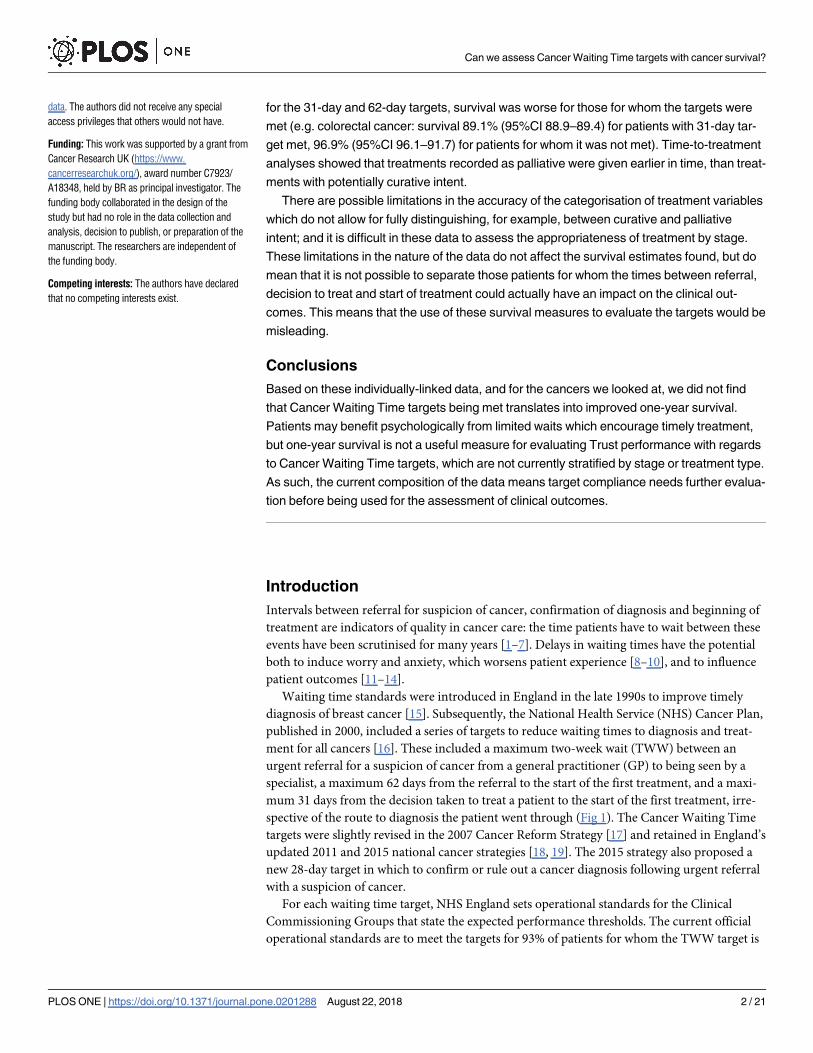
RESEARCH ARTICLE
Can we assess Cancer Waiting Time targets
with cancer survival? A population-based
study of individually linked data from the
National Cancer Waiting Times monitoring
dataset in England, 2009-2013
Chiara Di Girolamo1,2, Sarah Walters1, Carolynn Gildea3, Sara Benitez Majano1,
Bernard Rachet1, Melanie Morris1*
1 Cancer Survival Group, Faculty of Epidemiology and Population Health, Department of Non-Communicable
Disease Epidemiology, London School of Hygiene & Tropical Medicine, London, United Kingdom,
2 Department of Medical and Surgical Sciences, Alma Mater Studorium–University of Bologna, Bologna,
Italy, 3 National Cancer Registration and Analysis Service, Public Health England, Vulcan House Steel,
Sheffield, United Kingdom
Abstract
Background
Cancer Waiting Time targets have been integrated into successive cancer strategies as indi-
cators of cancer care quality in England. These targets are reported in national statistics for
all cancers combined, but there is mixed evidence of their benefits and it is unclear if meet-
ing Cancer Waiting Time targets, as currently defined and published, is associated with
improved survival for individual patients, and thus if survival is a good metric for judging the
utility of the targets.
Methods and findings
We used individually-linked data from the National Cancer Waiting Times Monitoring Data-
set (CWT), the cancer registry and other routinely collected datasets. The study population
consisted of all adult patients diagnosed in England (2009–2013) with colorectal (164,890),
lung (171,208) or ovarian (24,545) cancer, of whom 82%, 76%, and 77%, respectively, had
a CWT matching record.
The main outcome was one-year net survival for all matched patients by target attain-
ment (‘met/not met’). The time to each type of treatment for the 31-day and 62-day targets
was estimated using multivariable analyses, adjusting for age, sex, tumour stage and
deprivation.
The two-week wait (TWW) from GP referral to specialist consultation and 31-day target
from decision to treat to start of treatment were met for more than 95% of patients, but the
62-day target from GP referral to start of treatment was missed more often. There was little
evidence of an association between meeting the TWW target and one-year net survival, but
PLOS ONE | https://doi.org/10.1371/journal.pone.0201288 August 22, 2018 1 / 21
a1111111111
a1111111111
a1111111111
a1111111111
a1111111111
OPENACCESS
Citation: Di Girolamo C, Walters S, Gildea C,
Benitez Majano S, Rachet B, Morris M (2018) Can
we assess Cancer Waiting Time targets with cancer
survival? A population-based study of individually
linked data from the National Cancer Waiting Times
monitoring dataset in England, 2009-2013. PLoS
ONE 13(8): e0201288. https://doi.org/10.1371/
journal.pone.0201288
Editor: Masaru Katoh, National Cancer Center,
JAPAN
Received: February 6, 2018
Accepted: July 12, 2018
Published: August 22, 2018
Copyright: © 2018 Di Girolamo et al. This is an
open access article distributed under the terms of
the Creative Commons Attribution License, which
permits unrestricted use, distribution, and
reproduction in any medium, provided the original
author and source are credited.
Data Availability Statement: The data used in
these analyses do not belong to the authors. The
data were obtained from Public Health England.
They were used under ethical and statutory
approvals granted for the research. The data are
not publicly available but can be accessed under
strict conditions detailed in https://www.gov.uk/
government/publications/accessing-public-health-
england-data/about-the-phe-odr-and-accessing-
for the 31-day and 62-day targets, survival was worse for those for whom the targets were
met (e.g. colorectal cancer: survival 89.1% (95%CI 88.9–89.4) for patients with 31-day tar-
get met, 96.9% (95%CI 96.1–91.7) for patients for whom it was not met). Time-to-treatment
analyses showed that treatments recorded as palliative were given earlier in time, than treat-
ments with potentially curative intent.
There are possible limitations in the accuracy of the categorisation of treatment variables
which do not allow for fully distinguishing, for example, between curative and palliative
intent; and it is difficult in these data to assess the appropriateness of treatment by stage.
These limitations in the nature of the data do not affect the survival estimates found, but do
mean that it is not possible to separate those patients for whom the times between referral,
decision to treat and start of treatment could actually have an impact on the clinical out-
comes. This means that the use of these survival measures to evaluate the targets would be
misleading.
Conclusions
Based on these individually-linked data, and for the cancers we looked at, we did not find
that Cancer Waiting Time targets being met translates into improved one-year survival.
Patients may benefit psychologically from limited waits which encourage timely treatment,
but one-year survival is not a useful measure for evaluating Trust performance with regards
to Cancer Waiting Time targets, which are not currently stratified by stage or treatment type.
As such, the current composition of the data means target compliance needs further evalua-
tion before being used for the assessment of clinical outcomes.
Introduction
Intervals between referral for suspicion of cancer, confirmation of diagnosis and beginning of
treatment are indicators of quality in cancer care: the time patients have to wait between these
events have been scrutinised for many years [1–7]. Delays in waiting times have the potential
both to induce worry and anxiety, which worsens patient experience [8–10], and to influence
patient outcomes [11–14].
Waiting time standards were introduced in England in the late 1990s to improve timely
diagnosis of breast cancer [15]. Subsequently, the National Health Service (NHS) Cancer Plan,
published in 2000, included a series of targets to reduce waiting times to diagnosis and treat-
ment for all cancers [16]. These included a maximum two-week wait (TWW) between an
urgent referral for a suspicion of cancer from a general practitioner (GP) to being seen by a
specialist, a maximum 62 days from the referral to the start of the first treatment, and a maxi-
mum 31 days from the decision taken to treat a patient to the start of the first treatment, irre-
spective of the route to diagnosis the patient went through (Fig 1). The Cancer Waiting Time
targets were slightly revised in the 2007 Cancer Reform Strategy [17] and retained in England’s
updated 2011 and 2015 national cancer strategies [18, 19]. The 2015 strategy also proposed a
new 28-day target in which to confirm or rule out a cancer diagnosis following urgent referral
with a suspicion of cancer.
For each waiting time target, NHS England sets operational standards for the Clinical
Commissioning Groups that state the expected performance thresholds. The current official
operational standards are to meet the targets for 93% of patients for whom the TWW target is
Can we assess Cancer Waiting Time targets with cancer survival?
PLOS ONE | https://doi.org/10.1371/journal.pone.0201288 August 22, 2018 2 / 21
data. The authors did not receive any special
access privileges that others would not have.
Funding: This work was supported by a grant from
Cancer Research UK (https://www.
cancerresearchuk.org/), award number C7923/
A18348, held by BR as principal investigator. The
funding body collaborated in the design of the
study but had no role in the data collection and
analysis, decision to publish, or preparation of the
manuscript. The researchers are independent of
the funding body.
Competing interests: The authors have declared
that no competing interests exist.

applicable, 85% for the 62-day and 96% for the 31-day targets. Amendments to the official
time interval calculations are allowed if factors outside the hospital’s control were involved
[21]. National Cancer Waiting Time statistics, including the proportion of patients seen within
target times, have been published by NHS England as quarterly national statistics since 2013–
2014 [22] and previously by the Department of Health. Adherence to the 62-day target has
fallen below the operational standard every quarter since January-March 2014 [23–25] and has
generally decreased over this period too.
Research has evaluated the association of waiting time intervals with the outcomes of cancer
patients [4, 26–30]. So far, however, little is known about the association of patients’ survival
from cancer with meeting the official waiting time targets in England, while there is a general
temptation to use these published targets in association with cancer survival. In this study, we
use the National Cancer Waiting Times Monitoring Dataset (CWT), used for the official statis-
tics and for system performance assessment. We focus on three cancer sites, examining
whether these patients were seen or treated within the target time, and their time to treatment.
As cancer survival is often used as a metric to judge the performance of the healthcare system
and the quality of cancer care in particular, we assess whether there is an association between
meeting waiting time targets, as currently available to the policy-makers, and individual
patients’ cancer survival, and measure the time to different types of treatments in order to
understand the patterns found.
Methods
Ethics statement
This research does not use human participants, but routinely collected data. The Cancer Sur-
vival Group obtained ethical and statutory approvals to use these data from the National
Research Ethics Service Committee London–Camden & Islington on 28 May 2013 (Research
Ethics Committee reference 13/LO/0610, confirmed on 29 January 2015). All data are anon-
ymised and the researchers had no access to personally identifiable data.
Data sources and study population
All adults aged 15–99 years who were diagnosed in England between 2009 and 2013 with a pri-
mary, invasive and malignant colorectal (ICD10: C18-C20 and C21.8), non-small cell lung
(ICD10: C34, ICD-O-3: 8046/3), or ovarian cancer (ICD10: C56 to C57.7) were eligible for
inclusion in the analysis. Synchronous tumours and other primaries at the same site were
excluded during the cleaning process, described elsewhere [31]. Individual demographic and
clinical information on these patients was obtained by linking the cancer registration data
accessed through the Cancer Analysis System (CAS) at the National Cancer Registration and
Analysis Service (NCRAS) and data from the National Cancer Waiting Times Monitoring
Dataset (CWT) from NHS England. Additional information was available for colorectal and
Fig 1. Cancer waiting times pathways and targets (adapted from cancer waiting times: A guide, version 9.0 [20]).
https://doi.org/10.1371/journal.pone.0201288.g001
Can we assess Cancer Waiting Time targets with cancer survival?
PLOS ONE | https://doi.org/10.1371/journal.pone.0201288 August 22, 2018 3 / 21
lung cancers from the National Bowel Cancer Audit Project and the National Lung Cancer
Audit database, respectively.
The data include information on date of birth, sex, vital status, follow-up dates (available up
to 31 December 2014), and an ecological deprivation quintile (1 = least deprived, 5 = most
deprived) derived from the income domain of the Index of Multiple Deprivation for England
[32]. Age was treated as a categorical variable and split into groups (15–44, 45–54, 55–64, 65–
74, and 75+). Stage at diagnosis was obtained by drawing upon multiple sources of data (from
CAS, and audit data where available), and hierarchically combining individual information
[33] on tumour size (T), number of nodes involved (N), and presence of metastasis (M) to
assign a summary stage category [34].
CWT includes a range of information (e.g. relevant dates, details of the source of referral,
broad categories of treatment types) for cancer patients cared for in the NHS, including those
who refused treatment or who were deemed not to need any anti-cancer treatment at that
point but likely to need it in the future (active monitoring) [20]. CWT does not record infor-
mation on those patients who die before the treatment can commence or who are diagnosed
and/or treated in the private sector, including those who receive specialist palliative care in a
non-NHS setting. We summarised the treatment information available in CWT into six cate-
gories based on the nature of treatment: surgery, anti-cancer drug regimen, radiotherapy, palli-
ative treatment, active monitoring and treatment declined (S1 Table). ‘Other therapies’ (a
CWT category) were omitted when stratifying results by treatment as they make up less than
0.5% of treatments for each cancer site, and are a group of varied treatments.
When a single tumour had several CWT records corresponding to different treatments, we
gave priority to the record of the first treatment (as defined by a specific variable in CWT, and
in accordance with practice at Public Health England), and where there was more than one
record referring to the first treatment, we selected the record according to the proximity of the
dates of treatment and diagnosis. For all patients linked to CWT, we calculated whether the
31-day target from decision to treat (i.e. “the date that a patient agrees to a treatment plan”
[20]) to the start date of first treatment (‘31-day target’ hereafter) had been met. For the subset
of patients referred through the urgent GP referral route, we calculate the following: the time
between urgent GP referral for suspected cancer and the date the patient was first seen by a
specialist (two-week wait target, ‘TWW’ hereafter); and the time between urgent GP referral
for suspected cancer and the start date of first treatment (‘62-day target’ hereafter).
Statistical analysis
Descriptive and survival analyses were conducted for each target and cancer site. Patients were
classified according to whether the specified target was ‘not met’ or ‘met’. Analyses relating to
the 31-day target and the 62-day target were restricted to patients who survived at least 90 days
after cancer diagnosis to avoid the ‘time-guarantee’ bias caused by the time-dependent defini-
tion of the exposure [35]. Thus, patients who died before the target time was reached were
excluded from analyses. Further, our 90-day cut-off selected a group of patients for whom
timely treatment was more likely to make a real difference to their prognosis because it
excluded the sickest patients who might have died irrespective of the timeliness of receiving
treatment.
Net survival is the probability of patients surviving from cancer after adjusting for other
competing causes of death. Mortality hazard from these competing causes was obtained using
English population life tables stratified by age, sex, calendar year, deprivation and region [36].
We used the Pohar-Perme estimator [37] which is a non-parametric, consistent estimator of
Can we assess Cancer Waiting Time targets with cancer survival?
PLOS ONE | https://doi.org/10.1371/journal.pone.0201288 August 22, 2018 4 / 21
net survival, measured from the cancer registry date of diagnosis. One-year net survival, by tar-
get attainment, was estimated and stratified by age and tumour stage.
Additional survival analyses were also performed, by finer waiting time intervals from deci-
sion to treat to first treatment (�10 days, 11–31 days, 32–45 days and >45 days), and stratified
by stage. Preliminary analyses were also undertaken by certain types of treatments to investi-
gate if this would clarify the outcomes: results were however similar and therefore not
included. We also performed the survival analyses by target attainment, including all patients,
to demonstrate survival for the whole cohort including those who died within 90 days; these
results are presented in S1 Fig for reference.
A univariate Kaplan-Meier analysis and then a multivariable Cox proportional hazards
regression were used to analyse the time to the start of treatment. This time was measured
from referral for the 62-day target pathway and from the decision to treat date for the 31-day
target pathway. The Cox regression analyses included adjustment for age, sex, stage and depri-
vation, and were stratified by treatment type. The results of the time-to-treatment analyses are
presented as the proportion of patients who had received treatment by each point in time.
All analyses were performed using Stata 14.0.
Results
During 2009–2013, 164,890 colorectal cancer, 171,208 non-small cell lung cancer (lung cancer
hereafter), and 24,545 ovarian cancer patients were registered in England. The percentages of
these patients who had information in CWT on the first and/or subsequent treatments were
82%, 76%, and 77%, respectively. Patients without CWT information or who only had infor-
mation on subsequent treatments were excluded from the analyses, leaving 127,628 colorectal,
121,963 lung and 17,264 ovarian cancer patients (Fig 2).
Association of meeting waiting time targets with cancer survival
There was very little difference in one-year net survival by attainment of the TWW target for
any of the three cancer sites (Fig 3). Differences in net survival by 62-day target attainment
(conditional on surviving more than 90 days) were seen for lung cancer and, to a lesser extent,
for colorectal cancer patients, but not for ovarian cancer patients, with those having the target
met more likely to have poorer survival (as shown in Fig 3). The net survival analyses by attain-
ment of the 31-day target show that colorectal, lung and ovarian cancer patients who received
their first course of treatment later than 31 days tended to have higher one-year survival than
those who were treated shortly after diagnosis (Fig 3). The survival curves for one year, for the
three cancers and by the 31-day and 62-day targets, are reported for the whole cohort in S1
Fig. These show the same patterns, however survival is generally worse, as those who died
within 90 days are included.
Characteristics of patients by target attainment
The TWW and 31-day targets were met for most patients while the 62-day target was missed
for 26.2%, 25.2% and 14.5% of patients with colorectal, lung and ovarian cancer respectively.
The TWW was met for more than 95% of patients for all cancers and in all subgroups,
although the proportion of lung and ovarian cancer patients for whom the target was missed
tended to increase with age (Table 1). The 62-day target was met for between 60% and 92% of
those who survived more than 90 days, depending on the cancer site and subgroup. The pro-
portion of patients for whom the target was missed increased with age.
The 31-day target, for patients who survived more than 90 days after diagnosis, was more
likely to be missed among colorectal cancer patients than lung or ovarian cancer patients
Can we assess Cancer Waiting Time targets with cancer survival?
PLOS ONE | https://doi.org/10.1371/journal.pone.0201288 August 22, 2018 5 / 21

(Table 1). Among colorectal cancer patients, the target was more likely to be missed with
increasing age, contrasting with a reverse age pattern among those diagnosed with lung cancer.
Little difference by age was observed with ovarian cancer. The most deprived patients with a
colorectal cancer appeared slightly more likely to be treated within the target time. The propor-
tion of patients for whom the target was missed decreased as stage increased for all three can-
cer sites (S2–S4 Tables). Supplementary analyses showed that patients undergoing surgical
Fig 2. Numbers and percentages of cancer patients who were recorded in the cancer waiting times dataset and for
whom the waiting time targets can be calculated, England, 2009–2013 (percentages of patients remaining
calculated from the total number of the cell above).
https://doi.org/10.1371/journal.pone.0201288.g002
Can we assess Cancer Waiting Time targets with cancer survival?
PLOS ONE | https://doi.org/10.1371/journal.pone.0201288 August 22, 2018 6 / 21
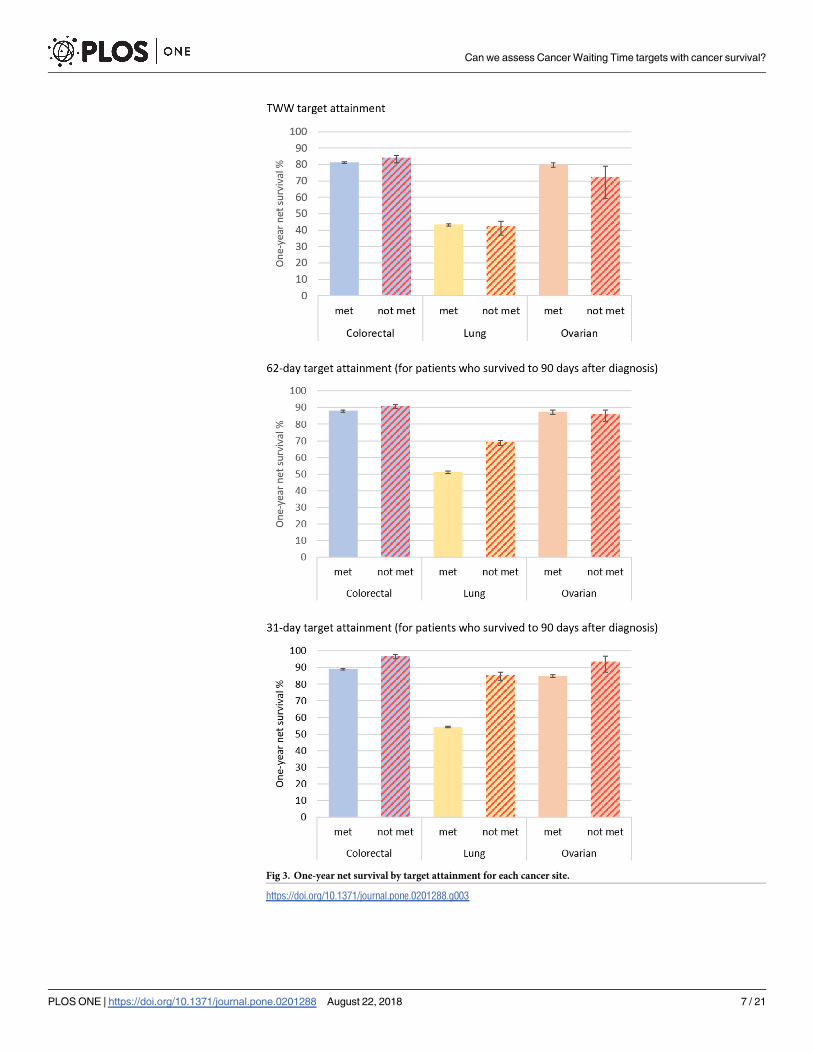
Fig 3. One-year net survival by target attainment for each cancer site.
https://doi.org/10.1371/journal.pone.0201288.g003
Can we assess Cancer Waiting Time targets with cancer survival?
PLOS ONE | https://doi.org/10.1371/journal.pone.0201288 August 22, 2018 7 / 21

Table 1. Target attainment by patient characteristics for each waiting time target and cancer site, England, 2009–2013.
Colorectal cancer Lung cancer Ovarian cancer
TWW pathway: all patients met, N (%) not met, N (%) met, N (%) not met, N (%) met, N (%) not met, N (%)
Total 48,441 (95.1) 2,514 (4.9) 49,780 (97.4) 1,337 (2.6) 8,306 (97.8) 185 (2.2)
Age groups 15–44 721 (94.7) 40 (5.3) 424 (98.6) 6 (1.4) 474 (98.5) 7 (1.5)
45–54 3,168 (94.5) 184 (5.5) 2,703 (97.3) 74 (2.7) 1,141 (98.2) 21 (1.8)
55–64 8,584 (94.9) 464 (5.1) 10,375 (97.8) 228 (2.2) 2,144 (98.3) 38 (1.7)
65–74 13,843 (95.1) 714 (4.9) 17,905 (97.6) 443 (2.4) 2,495 (97.6) 61 (2.4)
75+ 22,125 (95.2) 1,112 (4.8) 18,373 (96.9) 586 (3.1) 2,052 (97.3) 58 (2.7)
Stage at diagnosis I 5,078 (94.3) 305 (5.7) 5,983 (97.2) 175 (2.8) 1,697 (97.6) 41 (2.4)
II 9,744 (94.9) 529 (5.1) 4,344 (97.4) 116 (2.6) 502 (97.3) 14 (2.7)
III 10,423 (95.3) 509 (4.7) 14,050 (97.2) 403 (2.8) 2,472 (98.3) 44 (1.7)
IV 10,677 (95.6) 408 (4.6) 21,923 (97.6) 537 (2.4) 1,434 (97.8) 32 (2.2)
Missing 12,519 (94.9) 674 (5.1) 3,480 (97.0) 106 (3.0) 2,201 (97.6) 54 (2.4)
Deprivation quintile 1—least deprived 10,288 (95.4) 497 (4.6) 7,064 (98.0) 146 (2.0) 1,800 (97.7) 42 (2.3)
2 10,835 (95.2) 549 (4.8) 8,803 (97.6) 219 (2.4) 1,922 (97.8) 43 (2.2)
3 10,437 (95.1) 542 (4.9) 10,048 (97.4) 272 (2.6) 1,804 (97.9) 39 (2.1)
4 9,651 (95.2) 487 (4.8) 11,829 (97.2) 341 (2.8) 1,566 (97.3) 43 (2.7)
5—most deprived 7,230 (94.3) 439 (5.7) 12,036 (97.1) 359 (2.9) 1,214 (98.5) 18 (1.5)
Sex Female 20,742 (94.9) 1,106 (5.1) 22,297 (97.3) 613 (2.7) - -
Male 27,699 (95.2) 1,408 (4.8) 27,483 (97.4) 724 (2.6) - -
Tumour site Colon 27,038 (95.1) 1,392 (4.9) - - - -
Rectum 21,403 (95.0) 1,122 (5.0) - - - -
62-day target: patients who survived at least 90 days a
Total 34,154 (73.1) 12,548 (26.9) 29,796 (74.8) 10,034 (25.2) 6,646 (85.5) 1,126 (14.5)
Age groups 15–44 594 (80.2) 147 (19.8) 308 (80.4) 75 (19.6) 430 (92.1) 37 (7.9)
45–54 2,565 (79.1) 677 (20.9) 1,890 (79.3) 493 (20.7) 1,036 (90.5) 109 (9.5)
55–64 6,597 (76.7) 2,008 (23.3) 6,718 (76.3) 2,091 (23.7) 1,859 (88.5) 242 (11.5)
65–74 9,952 (73.5) 3,589 (26.5) 10,616 (72.6) 3,997 (27.4) 1,993 (84.0) 381 (16.0)
75+ 14,446 (70.2) 6,127 (29.8) 10,264 (75.2) 3,378 (24.8) 1,328 (78.8) 357 (21.2)
Stage at diagnosis I 3,749 (70.6) 1,560 (29.4) 3,591 (60.5) 2,341 (39.5) 1,527 (88.6) 196 (11.4)
II 7,301 (73.5) 2,633 (26.5) 2,573 (61.3) 1,627 (38.7) 433 (85.7) 72 (14.3)
III 7,678 (73.0) 2,844 (27.0) 9,322 (74.6) 3,173 (25.4) 2,005 (84.7) 363 (15.3)
IV 6,734 (75.4) 2,198 (24.6) 12,295 (83.8) 2,370 (16.2) 1,041 (83.5) 206 (16.5)
Missing 8,692 (72.4) 3,313 (27.6) 2,015 (79.4) 523 (20.6) 1,640 (85.0) 289 (15.0)
Colorectal cancer Lung cancer Ovarian cancer
62-day target: patients who survived at least 90days a
met, N (%) not met, N (%) met, N (%) not met, N (%) met, N (%) not met, N (%)
Deprivation quintile 1—least deprived 7,331 (73.4) 2,662 (26.6) 4,337 (76.2) 1,353 (23.8) 1,431 (84.2) 268 (15.8)
2 7,643 (73.0) 2,826 (27.0) 5,350 (75.4) 1,750 (24.6) 1,539 (85.9) 253 (14.1)
3 7,296 (72.6) 2,748 (27.4) 5,914 (74.4) 2,038 (25.6) 1,464 (86.5) 229 (13.5)
4 6,732 (73.1) 2,480 (26.9) 6,936 (73.9) 2,447 (26.1) 1,256 (85.9) 206 (14.1)
5—most deprived 5,152 (73.8) 1,832 (26.2) 7,259 (74.8) 2,446 (25.2) 956 (84.9) 170 (15.1)
Sex Female 14,574 (72.8) 5,441 (27.2) 13,728 (75.4) 4,473 (24.6) - -
Male 19,580 (73.4) 7,107 (26.6) 16,068 (74.3) 5,561 (25.7) - -
Tumour site Colon 19,009 (74.6) 6,488 (25.4) - - - -
Rectum 15,145 (71.4) 6,060 (28.6) - - - -
31-day target: patients who survived at least 90 days a
Total 112,301 (96.7) 3,816 (3.3) 84,270 (97.7) 1,978 (2.3) 15,224 (98.3) 271 (1.7)
(Continued)
Can we assess Cancer Waiting Time targets with cancer survival?
PLOS ONE | https://doi.org/10.1371/journal.pone.0201288 August 22, 2018 8 / 21

treatment were slightly more likely to have the target missed than those who were first treated
with any of the other options (data not shown).
Exploring the patterns of survival
There was no consistent pattern when survival analyses were stratified by age and stage at diag-
nosis (Table 2). For patients diagnosed at all stages except stage I, there was evidence that lung
cancer patients treated later than 62 days after referral had better survival overall than those
managed within the time target (Table 2). Among colorectal cancer patients, differences in
one-year survival by target attainment stratified by stage did not show a clear pattern, although
there was some evidence that survival was poorer for older patients and patients with late stage
for whom the target was met (Table 2).
Except for those patients with stage I colorectal cancer, colorectal and lung cancer patients
who received their first course of treatment later than 31 days tended to have higher one-year
survival than those who were treated shortly after diagnosis (Fig 3 and Table 2). There was an
indication of more favourable one-year survival for women with ovarian cancer for whom the
target was missed for all stages except stage IV tumours; however, differences were statistically
significant only among the group with missing information on stage.
Additional survival analysis by stage and finer waiting time intervals (�10 days, 11–31
days, 32–45 days, >45 days) revealed that colorectal and lung cancer patients who received
treatment within 10 days had lower one-year survival than those who were treated later for all
stages (Table 3). This was also true for the unstandardised net survival of ovarian cancer
patients, although not when stratified by stage.
Table 1. (Continued)
Age groups 15–44 3,485 (98.4) 57 (1.6) 1,101 (96.8) 36 (3.2) 1,251 (98.3) 21 (1.7)
45–54 8,131 (98.0) 169 (2.0) 5,206 (97.9) 113 (2.1) 2,302 (98.2) 42 (1.8)
55–64 22,503 (97.0) 693 (3.0) 17,884 (97.6) 437 (2.4) 3,858 (97.9) 81 (2.1)
65–74 35,444 (96.5) 1,283 (3.5) 29,759 (97.5) 756 (2.5) 4,528 (98.5) 70 (1.5)
75+ 42,738 (96.4) 1,614 (3.6) 30,320 (97.9) 636 (2.1) 3,285 (98.3) 57 (1.7)
Stage at diagnosis I 13,850 (95.8) 612 (4.2) 14,403 (93.8) 960 (6.2) 3,060 (96.7) 106 (3.3)
II 22,705 (96.4) 851 (3.6) 8,255 (95.8) 359 (4.2) 904 (97.1) 27 (2.9)
III 24,168 (96.6) 846 (3.4) 23,309 (98.5) 358 (1.5) 4,344 (98.7) 57 (1.3)
IV 19,926 (98.4) 322 (1.6) 31,271 (99.5) 171 (0.5) 2,583 (99.4) 16 (0.6)
Missing 31,652 (96.4) 1,185 (3.6) 7,032 (98.2) 130 (1.8) 4,333 (98.5) 65 (1.5)
Deprivation quintile 1—least deprived 23,967 (96.7) 812 (3.3) 11,702 (97.6) 290 (2.4) 3,227 (98.0) 65 (2.0)
2 24,786 (96.5) 905 (3.5) 14,613 (97.8) 324 (2.2) 3,384 (98.4) 54 (1.6)
3 23,860 (96.4) 883 (3.6) 16,657 (97.9) 355 (2.1) 3,227 (98.2) 60 (1.8)
4 22,186 (96.7) 752 (3.3) 19,741 (97.7) 472 (2.3) 3,012 (98.5) 45 (1.5)
5—most deprived 17,502 (97.4) 464 (2.6) 21,557 (97.6) 537 (2.4) 2,374 (98.1) 47 (1.9)
Sex Female 48,422 (96.8) 1,579 (3.2) 38,729 (97.6) 941 (2.4) - -
Male 63,879 (96.6) 2,237 (3.4) 45,541 (97.8) 1,037 (2.2) - -
Tumour site Colon 70,337 (96.8) 2,298 (3.2) - - - -
Rectum 41,964 (96.5) 1,518 (3.5) - - - -
a Those with any first course of treatment
https://doi.org/10.1371/journal.pone.0201288.t001
Can we assess Cancer Waiting Time targets with cancer survival?
PLOS ONE | https://doi.org/10.1371/journal.pone.0201288 August 22, 2018 9 / 21

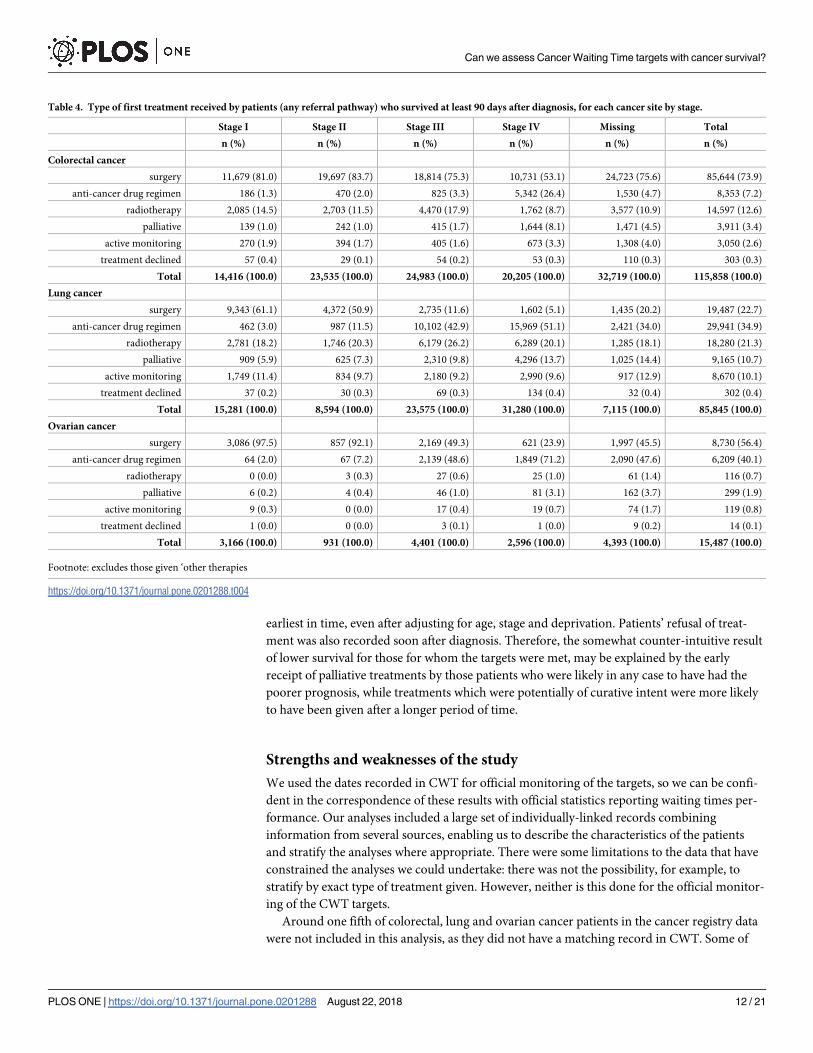
Time-to-treatment analyses
The number and proportion of patients receiving each type of treatment, for each target, is
shown in Table 4. The univariate analysis shows the pattern of unadjusted time to treatment
i.e. the days actually experienced by the patients. For patients diagnosed through urgent GP
referral and who survived more than 90 days after diagnosis, half of those with colorectal, non-
small cell lung or ovarian cancer had had their treatment by 55, 53 and 49 days after referral,
respectively. After the decision to treat was made, half of the patients were treated by 11, 7 and
10 days respectively (S2 Fig).
As expected, treatment was rarely given straight after referral (62-day target): the propor-
tion started to rise from around 10–15 days, once patients were first seen. There was a steep
Table 2. One-year net survival for each cancer site, by whether each waiting time target was met or not, England, 2009–13.
Colorectal cancer Lung cancer Ovarian cancer
Target attainment met, NS (CI) not met, NS (CI) met, NS (CI) not met, NS (CI) met, NS (CI) not met, NS (CI)
TWW pathway Age groups 15–44 88.9 (86.6–91.2) 90.1 (80.9–99.3) 52.4 (47.7–57.2) 50.1 (14.6–85.5) 92.7 (90.3–95.0) NA
45–54 89.0 (87.9–90.1) 89.4 (84.9–93.9) 51.1 (49.2–53.0) 40.7 (29.6–51.8) 91.5 (89.9–93.2) 85.8 (71.2–100.0)
55–64 86.0 (85.3–86.8) 88.5 (85.5–91.5) 49.0 (48.1–50.0) 53.1 (46.6–59.6) 86.8 (85.3–88.3) 82.0 (69.8–94.2)
65–74 83.1 (82.4–83.7) 86.5 (83.9–89.2) 46.5 (45.8–47.3) 43.5 (38.8–48.2) 81.6 (80.0–83.2) 79.8 (69.4–90.1)
75+ 76.9 (76.3–77.6) 79.7 (76.9–82.4) 36.2 (35.4–36.9) 37.7 (33.5–41.8) 62.2 (60.0–64.4) 50.2 (36.9–63.6)
Stage at diagnosis I 99.1 (98.5–99.6) 99.3 (97.1–100.0) 88.8 (87.9–89.7) 84.8 (78.7–91.0) 98.2 (97.3–99.0) 94.1 (86.1–100.0)
II 95.5 (95.0–96.1) 96.5 (94.1–98.8) 73.5 (72.1–74.9) 76.4 (68.0–84.7) 90.8 (88.1–93.5) 71.2 (58.4–100.0)
III 90.1 (89.4–90.8) 91.8 (88.9–94.6) 48.1 (47.3–49.0) 46.2 (41.2–51.3) 81.9 (80.3–83.4) 84.9 (74.1–95.6)
IV 51.7 (50.8–52.7) 54.8 (50.3–59.3) 23.3 (22.8–23.9) 19.5 (16.1–22.9) 65.8 (63.3–68.4) 63.2 (46.5–79.9)
Missing 80.8 (80.0–81.6) 83.3 (80.1–86.4) 36.7 (35.1–38.4) 37.3 (27.8–46.7) 71.2 (69.3–73.2) 49.3 (35.7–62.9)
Unstandardised 81.3 (80.9–81.7) 84.1 (82.5–85.7) 43.5 (43.1–44.0) 42.5 (39.7–45.2) 80.1 (79.3–81.0) 72.4 (65.8–79.1)
62-day target a Age groups 15–44 90.7 (88.3–93.0) 94.0 (90.1–97.9) 55.9 (50.4–61.5) 70.8 (60.5–81.0) 95.2 (93.2–97.2) NA
45–54 91.6 (90.5–92.7) 93.9 (92.1–95.8) 57.0 (54.8–59.3) 67.6 (63.4–71.7) 92.9 (91.3–94.5) 91.9 (86.8–97.1)
55–64 90.3 (89.6–91.1) 91.5 (90.2–92.8) 55.4 (54.2–56.6) 71.2 (69.2–73.2) 90.4 (89.0–91.8) 87.6 (83.4–91.9)
65–74 89.4 (88.8–90.1) 89.7 (88.7–90.8) 54.2 (53.2–55.1) 69.3 (67.9–70.8) 87.8 (86.3–89.3) 87.8 (84.4–91.3)
75+ 85.4 (84.7–86.1) 90.9 (89.9–91.8) 44.4 (43.4–45.4) 68.3 (66.6–70.1) 76.7 (74.2–79.2) 80.2 (75.6–84.8)
Stage at diagnosis I 100.0 (NA) 100.0 (NA) 91.2 (90.1–92.3) 93.4 (92.1–94.6) 98.9 (98.1–99.7) 99.3 (97.0–100.0)
II 98.8 (98.3–99.3) 74.9 (72.3–99.8) 76.4 (74.6–78.2) 81.0 (78.9–83.0) 92.4 (89.7–95.2) 92.4 (85.5–99.4)
III 93.7 (93.0–94.4) 93.7 (92.6–94.8) 52.4 (51.3–53.4) 65.2 (63.5–67.0) 87.7 (86.1–89.2) 83.6 (79.5–87.6)
IV 62.8 (61.6–64.0) 71.2 (69.2–73.2) 33.8 (33.0–34.7) 44.6 (42.6–46.7) 76.8 (74.1–79.4) 80.2 (74.4–85.9)
Missing 88.2 (87.4–89.0) 90.7 (89.5–91.9) 49.3 (47.0–51.6) 61.9 (57.6–66.2) 82.5 (80.6–84.5) 83.3 (78.6–87.9)
Unstandardised 88.1 (87.7–88.5) 90.9 (90.2–91.5) 51.3 (50.7–51.8) 69.3 (68.4–70.3) 87.6 (86.7–88.4) 86.2 (84.0–88.4)
31-day target a Age groups 15–44 89.8 (88.8–90.8) 94.8 (89.1–100.0) 60.3 (57.4–63.2) 86.2 (75.1–97.4) 93.4 (92.0–94.8) NA
45–54 89.0 (87.9–90.1) 91.0 (90.4–91.6) 57.0 (55.7–58.4) 81.7 (74.6–88.9) 91.8 (90.7–93.0) 93.1 (85.4–100.0)
55–64 86.0 (85.3–86.8) 91.9 (91.6–92.3) 56.6 (55.9–57.3) 85.6 (82.2–89.0) 88.9 (87.9–89.9) 93.1 (87.4–98.8)
65–74 83.1 (82.4–83.7) 91.0 (90.7–91.3) 56.7 (56.1–57.2) 86.2 (83.6–88.8) 84.7 (83.6–85.8) 91.1 (84.1–98.2)
75+ 76.9 (76.3–77.6) 85.7 (85.3–86.1) 50.3 (49.7–50.9) 85.2 (82.0–88.5) 73.4 (71.7–75.0) 95.8 (88.1–100.0)
Stage at diagnosis I 99.8 (99.5–100.0) 100.0 (NA) 89.3 (88.7–89.9) 95.6 (94.0–97.3) 98.5 (97.9–99.1) 98.7 (95.5–100.0)
II 98.4 (98.1–98.7) 100.0 (NA) 74.4 (73.4–75.4) 86.1 (82.1–90.0) 93.2 (91.4–95.0) 94.3 (84.3–100.0)
III 93.4 (93.0–93.8) 96.7 (95.0–98.4) 53.9 (53.3–54.6) 74.5 (69.7–79.2) 85.3 (84.2–86.4) 87.2 (78.1–96.2)
IV 65.2 (64.5–65.9) 81.3 (76.7–85.9) 33.8 (33.2–34.3) 52.6 (45.0–60.2) 74.9 (73.1–76.6) 70.1 (47.8–92.3)
Missing 89.6 (89.2–90.0) 96.9 (95.5–98.4) 53.0 (51.8–54.2) 83.5 (76.7–90.4) 79.8 (78.6–81.1) 96.5 (91.5–100.0)
Unstandardised 89.1 (88.9–89.4) 96.9 (96.1–97.7) 54.4 (54.1–54.8) 85.6 (83.9–87.2) 85.1 (84.5–85.7) 93.7 (90.5–96.9)
a Those with any first course of treatment and who survived at least 90 days after diagnosis
https://doi.org/10.1371/journal.pone.0201288.t002
Can we assess Cancer Waiting Time targets with cancer survival?
PLOS ONE | https://doi.org/10.1371/journal.pone.0201288 August 22, 2018 10 / 21

increase in the rate of treatment given as the 62-day target approached and a clear deceleration
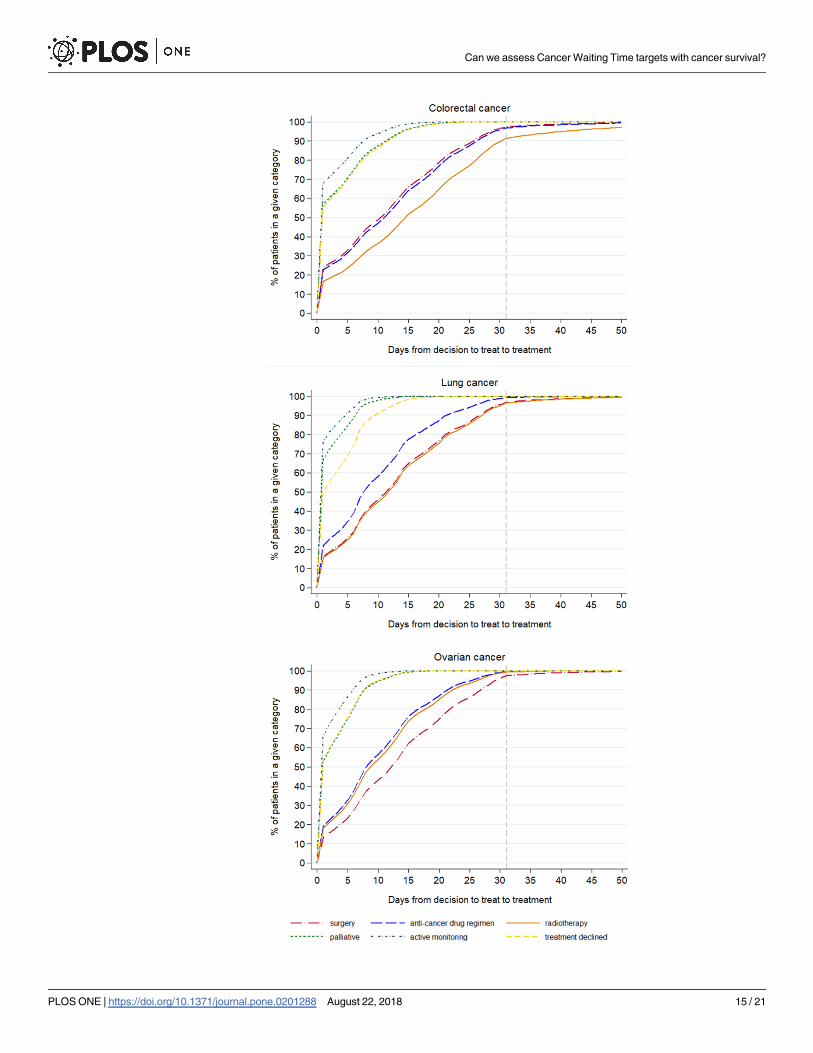
of treatments given after that ‘cut-off’. After the decision to treat was made, a proportion of
patients were given treatment very early in time for all these cancers (around 20–30% within
2–3 days), with a slow, steady increase in the proportion treated from 3 to 31 days and a dis-
tinct plateau at 31 days (S2 Fig).
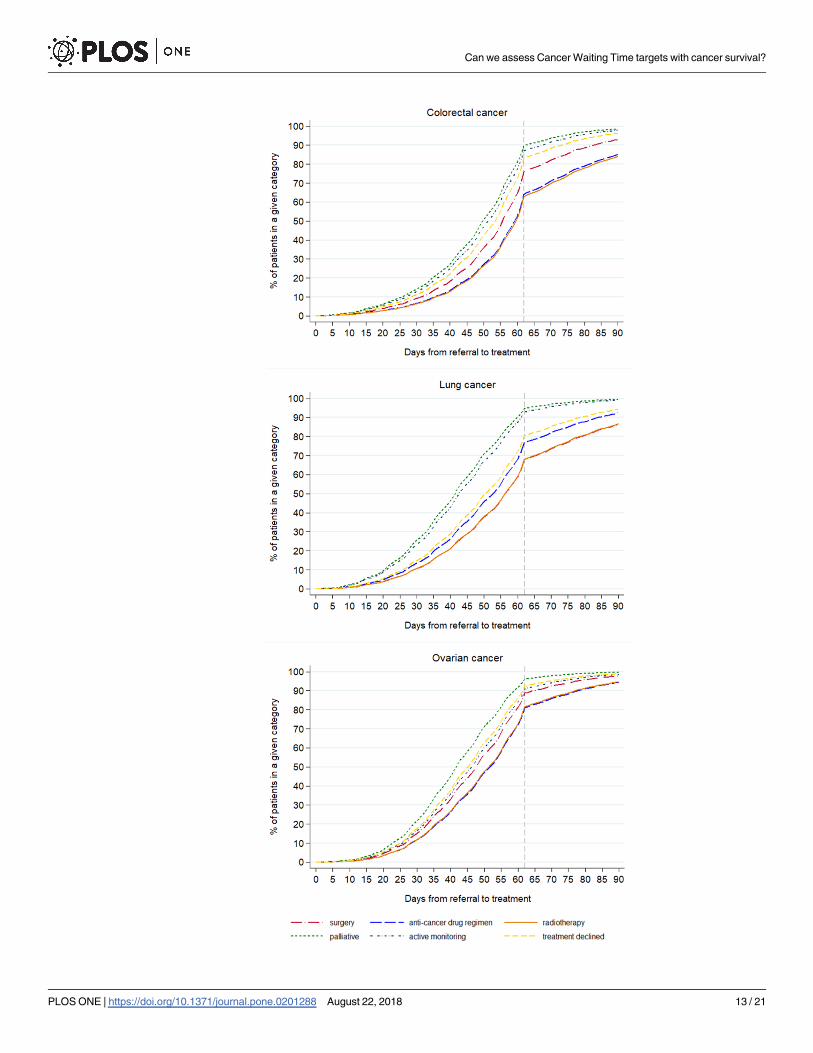
The pattern of the timing of the different treatments given, after adjusting for age, stage and
deprivation is shown in Figs 4 and 5. For all the cancers, the earliest treatments to be recorded,
counting from either referral or from decision to treatment, were palliative care, active moni-
toring and when treatment was declined. The treatments that started later were surgery, radio-
therapy and an anti-cancer drug regimen, the order changing depending on the cancer site
(Figs 4 and 5).
Discussion
Summary of main findings
The great majority of patients diagnosed with colorectal, lung and ovarian cancers had the
TWW and the 31-day targets met, but the 62-day target was met less often, especially with the
increasing age of the patients. One-year net survival was higher in patients for whom the 31-
and 62-day targets were not met than for those whom the target was met. Lower survival
among patients treated more quickly was mainly driven by the lower survival of those who
received a first course of treatment shortly after diagnosis (�10 days). The time-to-treatment
analyses showed that palliative care and active monitoring were consistently given to patients
Table 3. One-year net survival for all patients surviving more than 90 days by waiting time intervals, from decision to treat to first treatment, and by stage, England,
2009–13.
Days (decision to treat to first
treatment)
�10 days 11–31 days 32–45 days >45 days
NS% (95% CI) NS% (95% CI) NS% (95% CI) NS% (95% CI)
Colorectal cancer
Stage I 99.1 (98.6–99.6) 100.0 (NA) 100.0 (NA) 98.9 (96.2–100.0)
II 96.8 (96.2–97.3) 99.8 (99.5–100.0) 100.0 (NA) 98.7 (96.4–100.0)
III 90.2 (89.5–90.8) 96.0 (95.5–96.4) 97.0 (95.1–99.0) 96.1 (92.8–99.4)
IV 59.0 (58.1–59.9) 74.7 (73.7–75.7) 81.0 (75.7–86.2) 82.1 (72.7–91.6)
Missing 85.5 (84.9–86.1) 94.5 (94.0–95.0) 97.3 (95.6–99.1) 96.0 (93.3–98.7)
Unstandardised 84.2 (83.9–84.6) 94.1 (93.8–94.3) 97.0 (96.0–97.9) 96.7 (95.2–98.2)
Lung cancer
Stage I 84.8 (83.8–85.8) 93.0 (92.4–93.7) 94.3 (92.0–96.6) 98.0 (95.8–100.0)
II 68.8 (67.2–70.3) 79.7 (78.4–80.9) 84.8 (79.9–89.7) 88.8 (82.4–95.3)
III 49.2 (48.3–50.0) 60.1 (59.1–61.1) 73.1 (67.7–78.6) 79.2 (69.7–88.6)
IV 30.9 (30.3–31.6) 39.9 (38.9–40.9) 49.6 (41.2–57.9) 67.4 (50.0–84.7)
Missing 48.4 (46.9–49.8) 62.9 (60.8–64.9) 84.0 (76.0–92.0) 81.9 (69.0–94.8)
Unstandardised 47.5 (47.1–48.0) 64.5 (63.9–65.0) 83.1 (81.0–85.2) 91.4 (88.8–93.9)
Ovarian cancer
Stage I 97.9 (96.9–98.8) 99.0 (98.2–99.7) 99.0 (95.5–100.0) 97.7 (90.7–100.0)
II 92.3 (89.4–95.2) 93.9 (91.6–96.2) 90.6 (76.1–100.0) NA
III 83.7 (82.0–85.3) 87.0 (85.5–88.5) 83.9 (72.4–95.4) 94.6 (83.1–100.0)
IV 72.9 (70.5–75.3) 77.2 (74.7–79.6) 67.7 (42.1–93.3) 76.5 (38.7–100.0)
Missing 76.0 (74.3–77.8) 92.9 (89.0–96.8) 97.2 (91.7–100.0) 94.5 (83.0–100.0)
Unstandardised 82.3 (81.4–83.2) 88.0 (87.2–88.8) 92.9 (89.0–96.8) 95.9 (90.5–100.0)
https://doi.org/10.1371/journal.pone.0201288.t003
Can we assess Cancer Waiting Time targets with cancer survival?
PLOS ONE | https://doi.org/10.1371/journal.pone.0201288 August 22, 2018 11 / 21
earliest in time, even after adjusting for age, stage and deprivation. Patients’ refusal of treat-
ment was also recorded soon after diagnosis. Therefore, the somewhat counter-intuitive result
of lower survival for those for whom the targets were met, may be explained by the early
receipt of palliative treatments by those patients who were likely in any case to have had the
poorer prognosis, while treatments which were potentially of curative intent were more likely
to have been given after a longer period of time.
Strengths and weaknesses of the study
We used the dates recorded in CWT for official monitoring of the targets, so we can be confi-
dent in the correspondence of these results with official statistics reporting waiting times per-
formance. Our analyses included a large set of individually-linked records combining
information from several sources, enabling us to describe the characteristics of the patients
and stratify the analyses where appropriate. There were some limitations to the data that have
constrained the analyses we could undertake: there was not the possibility, for example, to
stratify by exact type of treatment given. However, neither is this done for the official monitor-
ing of the CWT targets.
Around one fifth of colorectal, lung and ovarian cancer patients in the cancer registry data
were not included in this analysis, as they did not have a matching record in CWT. Some of
Table 4. Type of first treatment received by patients (any referral pathway) who survived at least 90 days after diagnosis, for each cancer site by stage.
Stage I Stage II Stage III Stage IV Missing Total
n (%) n (%) n (%) n (%) n (%) n (%)
Colorectal cancer
surgery 11,679 (81.0) 19,697 (83.7) 18,814 (75.3) 10,731 (53.1) 24,723 (75.6) 85,644 (73.9)
anti-cancer drug regimen 186 (1.3) 470 (2.0) 825 (3.3) 5,342 (26.4) 1,530 (4.7) 8,353 (7.2)
radiotherapy 2,085 (14.5) 2,703 (11.5) 4,470 (17.9) 1,762 (8.7) 3,577 (10.9) 14,597 (12.6)
palliative 139 (1.0) 242 (1.0) 415 (1.7) 1,644 (8.1) 1,471 (4.5) 3,911 (3.4)
active monitoring 270 (1.9) 394 (1.7) 405 (1.6) 673 (3.3) 1,308 (4.0) 3,050 (2.6)
treatment declined 57 (0.4) 29 (0.1) 54 (0.2) 53 (0.3) 110 (0.3) 303 (0.3)
Total 14,416 (100.0) 23,535 (100.0) 24,983 (100.0) 20,205 (100.0) 32,719 (100.0) 115,858 (100.0)
Lung cancer
surgery 9,343 (61.1) 4,372 (50.9) 2,735 (11.6) 1,602 (5.1) 1,435 (20.2) 19,487 (22.7)
anti-cancer drug regimen 462 (3.0) 987 (11.5) 10,102 (42.9) 15,969 (51.1) 2,421 (34.0) 29,941 (34.9)
radiotherapy 2,781 (18.2) 1,746 (20.3) 6,179 (26.2) 6,289 (20.1) 1,285 (18.1) 18,280 (21.3)
palliative 909 (5.9) 625 (7.3) 2,310 (9.8) 4,296 (13.7) 1,025 (14.4) 9,165 (10.7)
active monitoring 1,749 (11.4) 834 (9.7) 2,180 (9.2) 2,990 (9.6) 917 (12.9) 8,670 (10.1)
treatment declined 37 (0.2) 30 (0.3) 69 (0.3) 134 (0.4) 32 (0.4) 302 (0.4)
Total 15,281 (100.0) 8,594 (100.0) 23,575 (100.0) 31,280 (100.0) 7,115 (100.0) 85,845 (100.0)
Ovarian cancer
surgery 3,086 (97.5) 857 (92.1) 2,169 (49.3) 621 (23.9) 1,997 (45.5) 8,730 (56.4)
anti-cancer drug regimen 64 (2.0) 67 (7.2) 2,139 (48.6) 1,849 (71.2) 2,090 (47.6) 6,209 (40.1)
radiotherapy 0 (0.0) 3 (0.3) 27 (0.6) 25 (1.0) 61 (1.4) 116 (0.7)
palliative 6 (0.2) 4 (0.4) 46 (1.0) 81 (3.1) 162 (3.7) 299 (1.9)
active monitoring 9 (0.3) 0 (0.0) 17 (0.4) 19 (0.7) 74 (1.7) 119 (0.8)
treatment declined 1 (0.0) 0 (0.0) 3 (0.1) 1 (0.0) 9 (0.2) 14 (0.1)
Total 3,166 (100.0) 931 (100.0) 4,401 (100.0) 2,596 (100.0) 4,393 (100.0) 15,487 (100.0)
Footnote: excludes those given ‘other therapies
https://doi.org/10.1371/journal.pone.0201288.t004
Can we assess Cancer Waiting Time targets with cancer survival?
PLOS ONE | https://doi.org/10.1371/journal.pone.0201288 August 22, 2018 12 / 21
Can we assess Cancer Waiting Time targets with cancer survival?
PLOS ONE | https://doi.org/10.1371/journal.pone.0201288 August 22, 2018 13 / 21

these patients did not appear in CWT because they received treatment in private settings (the
King’s Fund reports that about “11 per cent of the UK population has some form of private
medical insurance” (p3, [38]). Others will have died before treatment could commence: in our
data, of those without a CWT record, 22%, 44% and 31% of colorectal, lung and ovarian cancer
patients, respectively, died within 30 days of diagnosis. However, a significant proportion sur-
vived at least 30 days, which would have allowed time to plan and start treatment, especially
palliative care. There is a possibility, therefore, that the associations between waiting time and
survival are different for these ‘missing’ patients than the results of this study [39]. These
potential sources of bias add to the argument that caution should be used when interpreting
CWT data available to the policy-makers for the evaluation of cancer outcomes.
We have focused in this study on one-year net survival as we can use the most up-to-date
data available to us and that is often used for monitoring purposes. It also highlights a short-
term outcome for patients during a period in which the effect of treatment is most relevant. As
we are most interested in the time covered by the monitoring framework, and unless we have
specific hypotheses about certain treatments, looking at longer-term outcomes is unlikely to
give additional information about the utility of meeting targets. We know too, that there are
possible limitations in the accuracy of the categorisation of the treatment variables in CWT.
For example, the time-to-treatment graphs show the category of ‘active monitoring’ being
given anywhere up to 15–20 days after a decision to treat is recorded, whereas we would expect
active monitoring to start on the same day as the decision to treat. Variations in the interpreta-
tion of this category by clinical staff might explain why the time to this ‘treatment’ is not always
zero. Those recorded as receiving palliative treatments after being diagnosed at stage I or II
tend to be the oldest patients. However, there are cases of younger patients, some with no
comorbidities recorded, also having a record of palliative treatment at an early stage of disease,
which suggests some inaccurate categorisation or recording. Nonetheless, the stage-specific
time-to-treatment graphs (S3–S5 Figs) show that those with stage IV disease receive all types
of treatment earlier than those with stage I or II, which helps to explain the seemingly paradox-
ical finding of worse survival for those treated within targets. Similarly, the current categorisa-
tion of the CWT treatment variable does not allow for fully distinguishing within the “surgery”
category between curative and palliative intent, or for assessing the appropriateness of treat-
ment with regard to the disease stage. These limitations in the nature of the data do not affect
the survival estimates found, but they do mean that it is not possible to separate those patients
for whom the times between referral, decision to treat and start of treatment could actually
have an impact on the clinical outcomes.
This is the only study we are aware of that has used individually-linked population-based
sources of data to examine the association with survival of the official English National Cancer
Waiting Time targets. Other studies have examined waiting times from diagnosis to specific
treatments and outcomes from selected cancers, with mixed findings, some pointing to an
association between higher mortality and longer times to treatment [13, 14] or to a lack of
influence on long-term outcomes [26, 27, 30, 40]. Several have examined the impact of the
introduction of the TWW on outcomes for specific cancer sites, but, again, the evidence is
mixed with regards to the benefits [2, 4, 28, 41].
Several studies in other countries, and in some without relation to specific waiting time tar-
gets, have examined the relationship between the time patients wait between referral or diag-
nosis and treatment, and their outcomes. Some of these have highlighted the same “waiting
Fig 4. Time to first treatment (62-day target) by treatment category for cancer patients who survived 90 days after
diagnosis, England, 2009–2013.
https://doi.org/10.1371/journal.pone.0201288.g004
Can we assess Cancer Waiting Time targets with cancer survival?
PLOS ONE | https://doi.org/10.1371/journal.pone.0201288 August 22, 2018 14 / 21
Can we assess Cancer Waiting Time targets with cancer survival?
PLOS ONE | https://doi.org/10.1371/journal.pone.0201288 August 22, 2018 15 / 21

time paradox” [3] that we have found, in which people with worse symptoms are more likely
to be seen and treated more quickly, but have poorer outcomes as they are more likely to be
diagnosed at a later stage [3, 5, 42, 43]. We found this to be the case even though we had
excluded patients who died within 90 days. If we had included these patients, the effect of the
“waiting time paradox” would have been even more pronounced, as is seen in S1 Fig. This phe-
nomenon, also named confounding by indication, may result from the shortest delay being
experienced by patients with more advanced diseases or concurrent chronic conditions [42,
44, 45]. In this case, it is likely that the “sicker quicker” effect [44] plays a role and that the sick-
est patients (e.g. those presenting with a bowel occlusion in the case of a colorectal cancer)
gain access to palliative and symptom-relief treatments quickly, although these may not have
any positive impact on survival. In contrast, major surgery, chemotherapy or radiotherapy
regimes, which are more likely to be performed with curative intent and have a positive impact
on survival, may require more time in which to plan their implementation: for instance,
patients may first need to undergo further diagnostic investigations which lengthen the inter-
val between diagnosis and start of treatment. At the same time, they are more resource inten-
sive and therefore need to be scheduled in accordance with the available human and logistic
assets (e.g. number of anaesthetists and bed availability), which are likely to be constrained,
especially in a time of health care spending cuts [46]. These considerations mean that patients
who are more likely to benefit from the treatment are those who are more likely to receive it
somewhat later, as confirmed by our analyses. Where any delays result from limited resources
rather than clinical need, this could be a cause for concern as these delays may make the option
of curative treatment ultimately less likely.
The varied evidence for the association of waiting times with short- and longer-term out-
comes implies that the cut off times of these targets are somewhat arbitrary, with 31 and 62
days having little biological relevance: indeed, some studies point out the difficulty of showing
a difference in outcomes that depends on short time differences [26, 30]. However, there is
general agreement that intervals between referral, diagnosis and treatment should be mini-
mised, as every effort should be made to reduce the anxiety experienced by patients while wait-
ing, however long that is [8–10, 24, 29]. Murchie et al point out that the publicity surrounding
waiting times could itself engender anxiety when patients have to wait past the ‘cut-off’ [27],
and this anxiety can have wider impacts: a recent study reported the highest mortality rates
among the most distressed cancer patients [12].
Potential future research
This study demonstrated that it is not the times between referral, decision to treat and start of
treatment alone that matter for patients’ outcomes. Accounting for the type of treatment
would therefore be useful for assessing whether being treated within a certain time leads to bet-
ter outcomes. Having reliable information on treatment and on its intent (i.e. curative or palli-
ative) would help to better define meaningful groups of patients and understand more fully for
which group shorter times would make a difference in survival. However, this would mean to
access other relevant datasets and not relying solely on the official data in CWT. Furthermore,
the operational standards for these targets are assessed for national statistics with all cancers
combined. However, the results found by this study varied by cancer, an insight which was
possible thanks to the analysis of individual-level data. Further analysis that takes into account
Fig 5. Time to first treatment (31-day target) by treatment category for cancer patients who survived 90 days after
diagnosis, England, 2009–2013.
https://doi.org/10.1371/journal.pone.0201288.g005
Can we assess Cancer Waiting Time targets with cancer survival?
PLOS ONE | https://doi.org/10.1371/journal.pone.0201288 August 22, 2018 16 / 21
sub-types of cancer, where the data allow, would also be informative as these often call for very
different treatment regimens.
Equally important would be to establish whether longer intervals between diagnosis and the
start of treatment do decrease the probability of curative treatment being given; and to under-
stand whether longer delays before treatment of curative intent is provided, which may allow
for better planning and preparation, improves outcomes. These could add to our understand-
ing of the efficacy of these time targets, and lead to higher cancer survival.
The recently-proposed new target, to ensure that patients with a suspicion of cancer are
told within 28 days from GP referral whether they have a cancer or not, will need to be evalu-
ated. CWT is being updated to collect additional information which will enable this to be mon-
itored in future, including a date when the patient is informed of a diagnosis or the ruling out
of cancer. As important as this may be for patients’ experience, it is yet to be shown, however,
that there will be any difference in patients’ survival in relation to this new target. Continuing
focus should also be on whether being diagnosed through a certain pathway (e.g. TWW)
makes a difference compared to other pathways (e.g. non-urgent GP referral).
Implications
Cancer Waiting Time targets may still be important as indicators of overall performance of a
health service, and having these targets has set cancer apart from other diseases, enabling can-
cer patients to be treated more quickly. This is positive as extensive delays would undoubtedly
have clinical consequences on outcomes. Waiting time targets can also act as empowering
tools for both patients and health professionals who can use them to push for timely decisions
and efficient use of resources. As such, they encourage the system to be more equitable and
ensure that the majority of patients are treated within the set time frame, reducing stress and
anxiety. The targets have been updated since their first introduction to maintain this focus on
improving services. However, based on these individually-linked data, and for the cancers we
looked at, it is important for patients and policy-makers to appreciate that Cancer Waiting
Time targets being met does not necessarily translate into improved one-year survival, due the
clinical conditions of the patients at diagnosis and the fact that curative treatments may take
more time to plan and implement.
The CWT targets, reported for all cancers together despite a variety of different curative
treatments, are not necessarily informative, and do not inevitably lead to improved clinical
outcomes. The composition of the data, which currently makes no distinction between surgery
with curative and palliative intent, and therefore limited our ability to draw conclusions
beyond those presented here, also means that the targets are less informative with regards to
the assessment of outcomes. Therefore, survival cannot be used to judge the utility of these tar-
gets, nor can the waiting time target-meeting performance of Trusts indicate how good the
survival of their patients is likely to be. The other positive aspects of having reduced waiting
times for patients and improved overall efficiency of the system, should be seen as more rele-
vant than improved survival.
Supporting information
S1 Fig. Net survival curves for cancer patients, from diagnosis to one year, by target attain-
ment, England, 2009–13.
(DOCX)
Can we assess Cancer Waiting Time targets with cancer survival?
PLOS ONE | https://doi.org/10.1371/journal.pone.0201288 August 22, 2018 17 / 21

S2 Fig. Time to treatment (univariate analysis) for cancer patients who survived 90 days
after diagnosis, England, 2009–13.
(DOCX)
S3 Fig. Stage-specific time-to-treatment graphs for colorectal cancer patients (stage I/II
and stage IV for each target).
(DOCX)
S4 Fig. Stage-specific time-to-treatment graphs for lung cancer patients (stage I/II and
stage IV for each target).
(DOCX)
S5 Fig. Stage-specific time-to-treatment graphs for ovarian cancer patients (stage I/II and
stage IV for each target).
(DOCX)
S1 Table. Treatment categories in the analysis and list of treatments they cover, as defined
in the Cancer Waiting Time monitoring dataset.
(DOCX)
S2 Table. TWW target attainment by patient characteristics for each cancer site, by stage,
England, 2009–13.
(DOCX)
S3 Table. 62-day target attainment by patient characteristics for each cancer site, by stage,
England, 2009–13.
(DOCX)
S4 Table. 31-day target attainment by patient characteristics for each cancer site, by stage,
England, 2009–13.
(DOCX)
Acknowledgments
The Cancer Waiting Times monitoring dataset was provided by NHS England through Public
Health England. We are grateful to the members of the CRUK Scientific Advisory Group for
their advice when developing this project. We thank members of the Cancer Survival Group at
LSHTM for their advice and support.
Author Contributions
Conceptualization: Chiara Di Girolamo, Sarah Walters, Sara Benitez Majano, Bernard Rachet,
Melanie Morris.
Data curation: Chiara Di Girolamo, Carolynn Gildea, Sara Benitez Majano.
Formal analysis: Chiara Di Girolamo, Sara Benitez Majano.
Funding acquisition: Sarah Walters.
Investigation: Chiara Di Girolamo, Sarah Walters, Carolynn Gildea, Sara Benitez Majano,
Bernard Rachet, Melanie Morris.
Supervision: Sarah Walters, Bernard Rachet, Melanie Morris.
Writing – original draft: Chiara Di Girolamo, Melanie Morris.
Can we assess Cancer Waiting Time targets with cancer survival?
PLOS ONE | https://doi.org/10.1371/journal.pone.0201288 August 22, 2018 18 / 21
Writing – review & editing: Chiara Di Girolamo, Sarah Walters, Carolynn Gildea, Sara Beni-
tez Majano, Bernard Rachet, Melanie Morris.
References1. Spurgeon P, Barwell F, Kerr D. Waiting times for cancer patients in England after general practitioners’
referrals: retrospective national survey. BMJ. 2000; 320:838–9. PMID: 10731176
2. Thorne K, Hutchings HA, Elwyn G. The effects of the Two-Week Rule on NHS colorectal cancer diag-
nostic services: A systematic literature review. BMC Health Serv Res. 2006; 6:43. https://doi.org/10.
1186/1472-6963-6-43 PMID: 16584544
3. Crawford SC, Davis JA, Siddiqui NA, de Caestecker L, Gillis CR, Hole D, et al. The waiting time para-
dox: population based retrospective study of treatment delay and survival of women with endometrial
cancer in Scotland. BMJ. 2002; 325(7357):196. https://doi.org/10.1136/bmj.325.7357.196 PMID:
12142308
4. Møller H, Gildea C, Meechan D, Rubin G, Round T, Vedsted P. Use of the English urgent referral path-
way for suspected cancer and mortality in patients with cancer: cohort study. BMJ. 2015; 351:h5102.
https://doi.org/10.1136/bmj.h5102 PMID: 26462713
5. Myrdal G, Lambe M, Hillerdal G, Lamberg K, Agustsson T, Ståhle E. Effect of delays on prognosis in
patients with non-small cell lung cancer. Thorax. 2004; 59(1):45–9. PMID: 14694247
6. Potter S, Govindarajulu S, Shere M, Braddon F, Curran G, Greenwood R, et al. Referral patterns, can-
cer diagnoses, and waiting times after introduction of two week wait rule for breast cancer: prospective
cohort study. BMJ. 2007; 335(7614):288. https://doi.org/10.1136/bmj.39258.688553.55 PMID:
17631514
7. Tørring ML, Murchie P, Hamilton W, Vedsted P, Esteva M, Lautrup M, et al. Evidence of advanced
stage colorectal cancer with longer diagnostic intervals: a pooled analysis of seven primary care cohorts
comprising 11 720 patients in five countries. Br J Cancer. 2017; 117(6):888–97. Epub 2017/08/09.
https://doi.org/10.1038/bjc.2017.236 PMID: 28787432
8. Jones RV, Greenwood B. Breast cancer: causes of patients’ distress identified by qualitative analysis.
Br J Gen Pract. 1994; 44(385):370–1. PMID: 8068398
9. Gray RE, Fitch MI, Phillips C, Labrecque M, Klotz L. Presurgery experiences of prostate cancer patients
and their spouses. Cancer Pract. 1999; 7(3):130–5. PMID: 10352075
10. Seklehner S, Hladschik-Kermer B, Lusuardi L, Schabauer C, Riedl C, Engelhardt PF. Psychological
stress assessment of patients suffering from prostate cancer. Scand J Urol. 2013; 47(2):101–7. Epub
2012/07/13. https://doi.org/10.3109/00365599.2012.700946 PMID: 22783914
11. Department of Health. Review of cancer waiting times standards—improving outcomes: A strategy for
cancer. London, UK: Department of Health 2011. https://doi.org/10.1002/cncr.25644
12. Batty GD, Russ TC, Stamatakis E, Kivimaki M. Psychological distress in relation to site specific cancer
mortality: pooling of unpublished data from 16 prospective cohort studies. BMJ. 2017;356. https://doi.
org/10.1136/bmj.j108 PMID: 28122812
13. Elit LM, O’Leary EM, Pond GR, Seow H-Y. Impact of wait times on survival for women with uterine can-
cer. J Clin Oncol. 2014; 32(1):27–33. https://doi.org/10.1200/JCO.2013.51.3671 PMID: 24276779
14. Bleicher RJ, Ruth K, Sigurdson ER, Beck JR, Ross E, Wong YN, et al. Time to Surgery and Breast Can-
cer Survival in the United States. JAMA Oncol. 2016; 2(3):330–9. https://doi.org/10.1001/jamaoncol.
2015.4508 PMID: 26659430
15. NHS Executive. Breast cancer waiting times—Achieving the two-week target. London: Department of
Health, 1998.
16. Department of Health. The NHS Cancer Plan: a plan for investment, a plan for reform. London: Depart-
ment of Health, 2000.
17. Department of Health. Cancer Reform Strategy. London: Department of Health, 2007.
18. Department of Health. Improving outcomes: a strategy for cancer. London: Department of Health,
2011. https://doi.org/10.1002/cncr.26280
19. Independent Cancer Taskforce. Achieving world-class cancer outcomes: a strategy for England 2015–
2020. London: NHS England, 2015.
20. Cancer Waiting Times Team. National Cancer Waiting Times Monitoring Dataset Guidance, version
9.0. London: NHS England, 2015.
21. Samuels M, Pottage C, Dai D, McDonnell P. Waiting Times for Suspected and Diagnosed Cancer
Patients 2015–16 Annual Report. London, UK: NHS, 2016.
Can we assess Cancer Waiting Time targets with cancer survival?
PLOS ONE | https://doi.org/10.1371/journal.pone.0201288 August 22, 2018 19 / 21

22. NHS England. Cancer Waiting Times 2015. Available from: https://www.england.nhs.uk/statistics/
statistical-work-areas/cancer-waiting-times/
23. Cancer Waiting Times Team. Cancer waiting times—Commissioner Time Series by CCG Q1 2013–14
to Q1 2016–17 London: NHS England; 2016. Available from: https://www.england.nhs.uk/statistics/
statistical-work-areas/cancer-waiting-times/
24. Gray R. More than two years of missed NHS cancer targets and real people are still being left in limbo.
Cancer Research UK Science Blog [Internet]. July 2016. Available from: http://scienceblog.
cancerresearchuk.org/2016/05/12/more-than-two-years-of-missed-nhs-cancer-targets-and-real-
people-are-still-being-left-in-limbo/
25. National Cancer Intelligence Network. Trends in Cancer Waiting Times metrics, England, 2009/10 to
2014/15. London, UK: Public Health England, 2016.
26. Redaniel MT, Martin RM, Cawthorn S, Wade J, Jeffreys M. The association of waiting times from diag-
nosis to surgery with survival in women with localised breast cancer in England. Br J Cancer. 2013; 109
(1):42–9. Epub 2013/06/27. https://doi.org/10.1038/bjc.2013.317 PMID: 23799851
27. Murchie P, Raja EA, Brewster DH, Campbell NC, Ritchie LD, Robertson R, et al. Time from first presen-
tation in primary care to treatment of symptomatic colorectal cancer: effect on disease stage and sur-
vival. Br J Cancer. 2014; 111(3):461–9. Epub 2014/07/06. https://doi.org/10.1038/bjc.2014.352 PMID:
24992583
28. Sharpe D, Williams RN, Ubhi SS, Sutton CD, Bowrey DJ. The "two-week wait" referral pathway allows
prompt treatment but does not improve outcome for patients with oesophago-gastric cancer. Eur J Surg
Oncol. 2010; 36(10):977–81. Epub 2010/08/13. https://doi.org/10.1016/j.ejso.2010.07.002 PMID:
20702059
29. Probst HB, Hussain ZB, Andersen O. Cancer patient pathways in Denmark as a joint effort between
bureaucrats, health professionals and politicians—a national Danish project. Health Policy. 2012; 105
(1):65–70. https://doi.org/10.1016/j.healthpol.2011.11.001 PMID: 22136810
30. van Harten MC, Hoebers FJ, Kross KW, van Werkhoven ED, van den Brekel MW, van Dijk BA. Determi-
nants of treatment waiting times for head and neck cancer in the Netherlands and their relation to sur-
vival. Oral Oncol. 2015; 51(3):272–8. Epub 2014/12/30. https://doi.org/10.1016/j.oraloncology.2014.12.
003 PMID: 25541458
31. Li R, Abela L, Moore J, Woods LM, Nur U, Rachet B, et al. Control of data quality for population-based
cancer survival analysis. Cancer Epidemiol. 2014; 38:314–20. https://doi.org/10.1016/j.canep.2014.02.
013 PMID: 24685409
32. Department for Communities and Local Government. The English Indices of Deprivation 2007. London:
2008.
33. Benitez-Majano S, Fowler H, Maringe C, Di Girolamo C, Rachet B. Deriving stage at diagnosis from
multiple population-based sources: colorectal and lung cancer in England. Br J Cancer. 2016; 115
(3):391–400. Epub 2016/06/22. https://doi.org/10.1038/bjc.2016.177 PMID: 27328310
34. Sobin LH, Gospodarowicz M, Wittekind C, editors. TNM Classification of Malignant Tumours. 7th ed.
New York: John Wiley & Sons; 2009.
35. Giobbie-Hurder A, Gelber RD, Regan MM. Challenges of guarantee-time bias. J Clin Oncol. 2013; 31
(23):2963–9. Epub 2013/07/10. https://doi.org/10.1200/JCO.2013.49.5283 PMID: 23835712
36. Spika D. Cancer Survival Group UK life tables London 2015. Available from: http://csg.lshtm.ac.uk/
tools-analysis/uk-life-tables/
37. Pohar Perme M, Stare J, Estève J. On estimation in relative survival. Biometrics. 2012; 68:113–20.
https://doi.org/10.1111/j.1541-0420.2011.01640.x PMID: 21689081
38. The King’s Fund. The UK private health market. London: The King’s Fund, 2014.
39. Di Girolamo C, Walters S, Gildea C, Benitez Majano S, Coleman MP, Rachet B, et al. Which patients
are not included in the English Cancer Waiting Times monitoring dataset, 2009–2013? Implications for
use of the data in research. Epub 2018/01/18. Br J Cancer. 2018. https://doi.org/10.1038/bjc.2017.452
PMID: 29348489
40. Visser E, Leeftink AG, van Rossum PSN, Siesling S, van Hillegersberg R, Ruurda JP. Waiting time from
diagnosis to treatment has no impact on survival in patients with esophageal cancer. Ann Surg Oncol.
2016; 23:2679–89. https://doi.org/10.1245/s10434-016-5191-6 PMID: 27012988
41. McKie C, Ahmad UA, Fellows S, Meikle D, Stafford FW, Thomson PJ, et al. The 2-week rule for sus-
pected head and neck cancer in the United Kingdom: referral patterns, diagnostic efficacy of the guide-
lines and compliance. Oral Oncol. 2008; 44(9):851–6. Epub 2008/02/01. https://doi.org/10.1016/j.
oraloncology.2007.10.010 PMID: 18234546
Can we assess Cancer Waiting Time targets with cancer survival?
PLOS ONE | https://doi.org/10.1371/journal.pone.0201288 August 22, 2018 20 / 21
42. Tørring ML, Frydenberg M, Hansen RP, Olesen F, Hamilton W, Vedsted P. Time to diagnosis and mor-
tality in colorectal cancer: a cohort study in primary care. Br J Cancer. 2011; 104(6):934–40. https://doi.
org/10.1038/bjc.2011.60 PMID: 21364593
43. Leiva A, Esteva M, Llobera J, Macià F, Pita-Fernandez S, Gonzalez-Lujan L, et al. Time to diagnosis
and stage of symptomatic colorectal cancer determined by three different sources of information: A pop-
ulation based retrospective study. Cancer Epidemiol. 2017; 47:48–55. https://doi.org/10.1016/j.canep.
2016.10.021 PMID: 28126583
44. Forrest LF, Adams J, White M, Rubin G. Factors associated with timeliness of post-primary care refer-
ral, diagnosis and treatment for lung cancer: population-based, data-linkage study. Br J Cancer. 2014;
111(9):1843–51. Epub 2014/09/10. https://doi.org/10.1038/bjc.2014.472 PMID: 25203519
45. Tørring ML, Frydenberg M, Hansen RP, Olesen F, Vedsted P. Evidence of increasing mortality with lon-
ger diagnostic intervals for five common cancers: a cohort study in primary care. Eur J Cancer. 2013; 49
(9):2187–98. Epub 2013/03/05. https://doi.org/10.1016/j.ejca.2013.01.025 PMID: 23453935
46. Klein R. The NHS in the age of anxiety: rhetoric and reality—an essay by Rudolf Klein. BMJ. 2013;347.
https://doi.org/10.1136/bmj.f5104 PMID: 23965509
Can we assess Cancer Waiting Time targets with cancer survival?
PLOS ONE | https://doi.org/10.1371/journal.pone.0201288 August 22, 2018 21 / 21