Ferranti Presentation slide
16
ELECTRICAL ENGINEERING DEPARTMENT ELEG-465X : EMTFPS Fall 2016 Transient Overvoltage from Line Energization-The Ferranti Effect (Names of Presenters) Purushottam Adhikari (1003057) Md Ziaur Rahman Zishan (1003537)
-
Upload
purushottam-adhikari -
Category
Documents
-
view
107 -
download
14
Transcript of Ferranti Presentation slide

ELECTRICAL ENGINEERING DEPARTMENT
ELEG-465X : EMTFPS
Fall 2016
Transient Overvoltage from Line Energization-The Ferranti Effect
(Names of Presenters)Purushottam Adhikari (1003057)Md Ziaur Rahman Zishan (1003537)

Objective of the Project
Demonstrate
Ferranti effect at receiving end of TL
Effect in different
frequency systems
Compensating effect by installing shunt
reactors
Finding charging
MVAR for different line
lengths

I. Introdruction
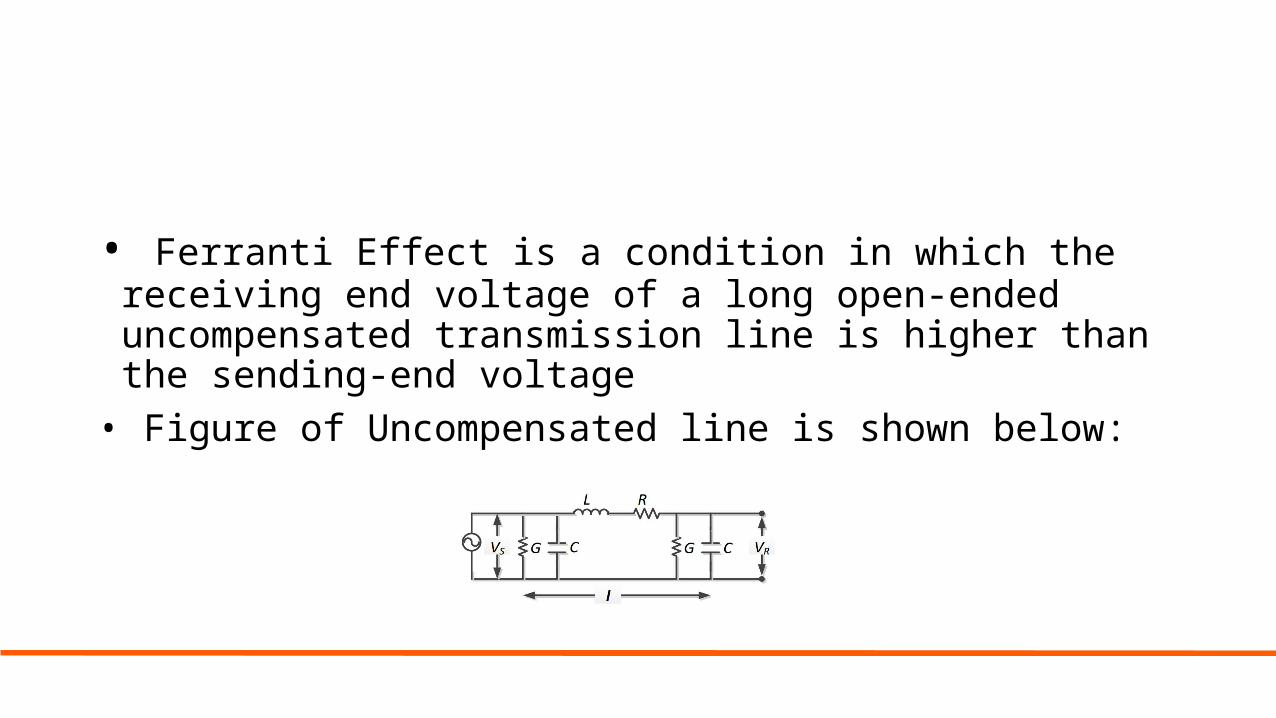
• Ferranti Effect is a condition in which the receiving end voltage of a long open-ended uncompensated transmission line is higher than the sending-end voltage• Figure of Uncompensated line is shown below:

• For no load condition, we have the relation as shown below:
…. (A)
Where, VS=sending end voltage, VR=receiving end voltage, l=length of line• Also,
ϒ=α+jβ
Where, ϒ=propagation constant, α=attenuation constant,β=phase constant• Also, β=2π/λ……. (1)
λ=c/f……. (2)
Where, λ=wavelength
c=speed of light
f=frequency• For 50 Hz system, β=6 degree/ 100 km… (B)• The above relations (A) and (B) shows that for a long transmission line, the line length should not exceed 1500km if voltage
control method is not used. It means the receiving end voltage reaches infinity when line length is 1500 km at 50 Hz system.• Similarly, for 60 Hz system, β=7.2 degree/100km.

II.Methodology
• Let us consider single line diagram of a long transmission line as shown in the figure above for our study purpose.
• Calculation for 100 km line, VREC/VSEND=1/Cos (0.072*100) =1.0079

Similarly, the rest calculation is done and result is shown in the table below:

EMTP Simulation diagram for the uncompensated system

Charging MVAr can by calculated using the formula as shown at right hand side.• E.g. Calculation for 100 km line.
C= (10^9*100)/ (400*3*10^8) µF=0.833333µF
Xc= 1/ (2*3.14*60*0.833333*10^-6) = 3184.713 Ω
MVAR= (345*345)/ 3184.713=3184.713

EMTP Simulation diagram for the compensated system

III. Results and Discussion
0 100 200 300 400 500 600 700 800 900 10000
0.5
1
1.5
2
2.5
1.0079 1.0324 1.0755 1.141151.2361
1.37181.5688
1.8663
2.3486
Line Length(km)
Rece
ivin
g en
d vo
ltage
per
uni
t of s
endi
ng
end
volta
ge
Fig: Receiving end voltage per unit sending end voltage vs line length graph
From the graph, we can see that the receiving end voltage per unit sending end voltage for 100 km line is 1.0079 which becomes 2.3486(more than 2 times) for 900 km.

Fig: Rise in Receiving-End voltages for an unloaded 345 KV line for various shunt reactors of sizes and different line lengths
0 100 200 300 400 500 600 700 800 900 10000
0.5
1
1.5
2
2.5
Uncompensated line
100 MVAR
150 MVAR
200 MVAR
250 MVAR
300 MVAR(Most compensated line)
Line Length(km)
Rece
ivin
g en
d vo
ltage
per
uni
t of s
endi
ng e
nd v
olta
ge
From the graph, we can see that the Ferranti effect is higher for long transmission line. For 100 km line, the receiving end voltage per unit of sending end voltage is 1.009 and for 900 km line, it is 2.3486 in uncompensated line. When 100 MVAR shunt reactor is introduced at the end of transmission line, the receiving end voltage per unit of sending end voltage reduces to 0.966 for 100 km line and for 900 km line, it reduces to 1.35. Similarly, the receiving end voltage per unit sending end voltage goes on decreasing with the increment of shunt reactor compensation level. Hence, among the shunt reactors, the reactor having 300 MVAR give the most compensation to Ferranti effect at the receiving end.

Table5: Comparison of receiving end voltage per unit sending end Voltage between 50 Hz and 60 Hz system
Line(km) VR/VS for 50 Hz system VR/VS for 60 Hz system
100 1.0055 1.0079
200 1.0223 1.0324
300 1.0514 1.0755
400 1.0946 1.14115
500 1.1547 1.2361
600 1.2360 1.3718
700 1.3456 1.5688
800 1.4944 1.8663
900 1.7013 2.3486
From above table, we see that the receiving end voltage per unit sending end voltage decreases with the decrement in system frequency. For instance, the VR/VS for 60 Hz system is 2.3486 for 900 km line and it decreases to 1.7013 when the system frequency is 50 Hz. This is because the phase constant for transmission line decreases with decrement in system frequency. Thus, the Ferranti effect decreases with increment of cosine of multiple of phase constant and line length.

IV. Conclusions
• Ferranti effect increases with increment of line length • Ferranti effect decreases with decrement of system frequency• Shunt reactor of higher compensation reduces the Ferranti effect more
Thank you!

Any Questions?