GENETIC CONTROL OF THE EXPRESSION PATHWAY IN HUB …
18
GENETIC CONTROL OF THE EXPRESSION PATHWAY IN HUB GENES FROM Saccharomyces cerevisiae Laura Llobet Reixach Treball de fi de grau, BIOLOGIA HUMANA 2010-2014 Tutor: Robert Castelo Universitat Pompeu Fabra
Transcript of GENETIC CONTROL OF THE EXPRESSION PATHWAY IN HUB …
GENETIC CONTROL OF THE EXPRESSION
PATHWAY IN HUB GENES FROM
Saccharomyces cerevisiae
Laura Llobet Reixach
Treball de fi de grau, BIOLOGIA HUMANA 2010-2014
Tutor: Robert Castelo
Universitat Pompeu Fabra
Coordinadors de l’assignatura Treball Fi de Grau
Facultat de Ciències de la Salut i de la Vida
Universitat Pompeu Fabra
Benvolguts/des coordinadors/res de l’assignatura Treball Fi de Grau,
Autorizo na Laura Llobet i Reixach a l’entrega i presentació del seu Treball de Fi de
Grau titulat “Genetic control of the expression pathway in hub genes from
Saccharomyces cerevisiae” que ha realitzat sota la meva supervisió.
Atentament,
Robert Castelo
Professor Titular
Dept. de Ciències Experimentals i de la Salut
Universitat Pompeu Fabra
Barcelona, 17 de juny de 2014
INDEX
Abstract 2
Introduction 3
Problem approach and objectives 3
Materials and methods 4
Results 6
Discussion and conclusions 11
References 12
Annex 13
ABSTRACT
The genetic bases of complex traits are a challenging matter of study, given the
complexity of the underlying regulation. High-throughput technologies enable collecting
data about cellular traits, such as gene expression, which acts as an intermediate
molecular layer between genotype and phenotype. In this project, we carried out a
statistical analysis to identify loci involved in regulation of gene expression (known as
expression quantitative trait loci - eQTL), map them on the Saccharomyces cerevisiae
genome and quantify their contribution by estimating the proportion of expression
variance explained by them. We have compared data from six different experimental
conditions to study the influence played by environment in genetic control of
expression. In addition, we also calculate the degree of connectivity of our genes under
study with all other genes of the data set, so correlation between connectivity and
genetic control of gene expression can be analyzed. Our results indicate that genes
with a strong genetic regulation of their expression levels show also a large degree of
connectivity with other genes, becoming hubs in the underlying gene regulatory
network. Additionally, they are characterized by a very homogenous eQTL map,
despite environmental conditions; in contrast to those genes with a very poor genetic
regulation, which show a very variable control of gene expression.
2
INTRODUCTION
Understanding the relationship between genotype and phenotype is very helpful for
solving current biological problems, such as predicting disease risk in human
population, improving productivity in farming and cattle raising, and predicting
adaptative evolution.
Most heritable traits show continuous phenotypic variation, mainly due to underlying
complex genetic regulation. It is a consequence of multiple interacting loci, with
different allelic effects depending on environmental conditions; so it is not a trivial
problem to handle with [1].
Genetic loci associated with quantitative heritable traits are known as quantitative
trait loci (QTL). QTL mapping requires both phenotypic and genotypic data and it
consists of determining if there is a statistically significant phenotypic difference among
individuals with different genotype background. Once detected and localised, it is
important to quantify the magnitude of such genetic effects. One of such magnitudes is
the percentage of phenotypic variance explained by each QTL. It is important to keep
in mind that variance explained by QTLs is often far from the percentage of the
phenotypic variance with a genetic origin. This is known as “the missing heritability
problem”, and is a current matter of debate in complex traits studies [2].
Recent technological developments in genome and transcriptome sequencing have
enabled us to get new information about molecular intermediates between genotype
and phenotype, which provide new insights into the genetic regulation of complex
heritable traits. In 2002, Brem et al. [3] showed that cellular traits, such as gene
expression, are inherited in a quantitative fashion as well, so studying genetic variants
that affect gene expression is a good approach to increase statistical power to study
genetic bases of complex traits, as well as to better understand underlying genetic
regulatory mechanisms.
PROBLEM APPROACH AND OBJECTIVES
In a recent study by Tur et al. [5], where eQTLs were mapped to the yeast genome
using data from a yeast cross published by Brem et al. [3], it was discovered that genes
whose eQTLs explain 70% or more or their expression variance were highly connected
in the functional network estimated from their expression profiles.
This project aims to study expression QTL (eQTL) in the Saccharomyces cerevisiae
genome. Starting from a first data set of expression levels from 8382 genes in five
different environments, eQTL mapping was restricted to a limited set of genes in order
3
to do a more simple and accurate analysis. However, we introduced data from them all,
so we are able to elucidate the degree of connectivity of those we are studying, taking
into account all 8382. We performed our analysis in 13 genes, involved in 3 different
cellular pathways: 7 in mating regulation, 3 in daughter cells separation and 3 in
leucine biosynthesis. They were chosen from those identified in a recent study by Tur
et al. [5], whose eQTLs explain 70% or more of their expression variance and are
located in a different chromosome from the linked gene. By doing so, it is intended to (i)
understand the architecture of genetic regulation of expression of these genes more
accurately, (ii) elucidate the role of environment in genetic expression and (iii) study
implications of eQTLs in different cellular pathways.
MATERIALS AND METHODS
Strains and expression data
Experimental data was produced by Gagneur and colleagues [6]. They gathered
information about expression of 8382 genes (both coding and non-coding) from an
average of 35 individuals of S.cerevisiae in 5 different experimental conditions
(glucose, low iron, rapamycin, ethanol and maltose). In order to be able to correlate a
given phenotype with a determinate genotype, haploid organisms are recommended.
So, in this kind of analysis, haploid spores from tetrads are used. This is made possible
by doing crosses between haploid MATα and MATa strains, putting the resulting diploid
through meiosis and sporulation, and physically dissecting the four ascospores from an
ezimatically digested tetrad. Spores are allowed to germinate and the phenotypes of all
segregants are determined [7]. Expression levels were estimated by tiling-array
assays, in mid-exponential phase culture.
Segregants used in each experimental condition were chosen randomly from an
initial data set of 159 individuals, which were obtained from Mancera and colleagues [8]
data. These were derived from a cross of S.cerevisiae strains S96 (MATa ho:: lys5
gal2) and YJM789 (MAT ho::hisG lys2 gal2).
Regarding Tur et al. data, they used gene expression information by Brem et al. [9].
They used a yeast cross between BY4716, an isogenic to the the lab strain S288C,
and the wild isolate RM11-1a.
Data availability
Expression data used in this project were downloaded from the ArrayExpress
repository (http://www.ebi.ac.uk/arrayexpress/) under accession number E-MTAB-
1398. Genotype data were obtained from the supplementary information available in
the electronic version of Mancera et al. paper [8]
4
Processing of genotype data
Position of the markers in Mancera et al. data were specified in physical distances,
but our analysis required genetic distances. So, we convert them following equivalence
data available in Saccharomyces Genome Database (SGD,
http://www.yeastgenome.org), where genetic distance vs. physical distances ratios for
each chromosome are specified.
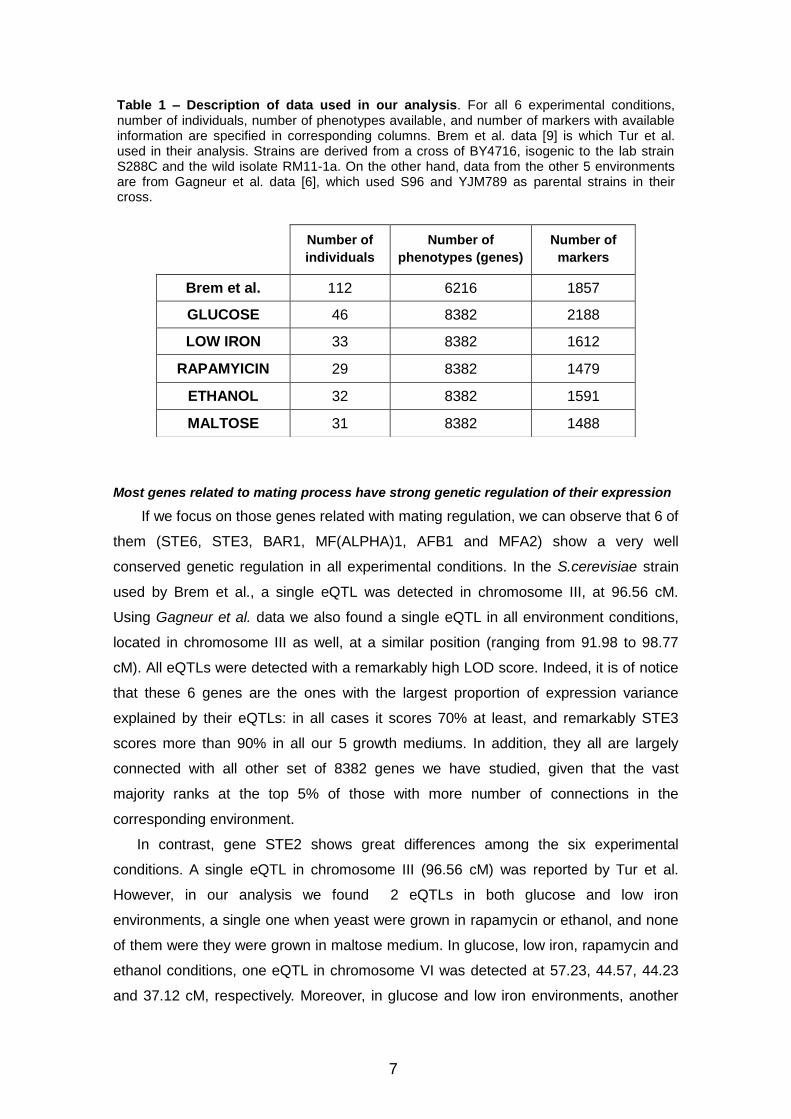
Moreover, there were some markers with missing genotypes or which were not
informative that were removed using R/qtl package. At the end, our analysis was
performed with the filtered data specified in Table 1.
eQTL mapping
eQTL mapping was conducted by single marker regression, which considers each
marker individually. Individuals are split into groups according to their genotypes, and
phenotype averages of each group are compared. Given that we analyse haploid
spores from a tetrad, individuals have only two possible genotypes, just as in a
backcross, so we perform our analyses as a backcross. This process is carried out
using R/qtl package. [13]
Evidence of a QTL is measured by a LOD score: the log10 likelihood ratio comparing
the hypothesis that there is a QTL at the marker to the hypothesis that there is no QTL
at the marker. Larger LOD scores indicate stronger association between the marker
and the phenotype. To assess which are statistically significant, we consider the global
null hypothesis that there is no QTL anywhere in the genome. To test such hypothesis,
a null distribution of the genome-wide maximum LOD scores has been derived by a
permutation test. It consists of shuffling the phenotypes relative to the genotype data,
getting a new data set, on which the QTL mapping method will be also applied. LOD
score values corresponding to the top 5% of this distribution will be taken as the cutoff
to consider a LOD score significant. Permutation tests are computationally demanding
in R, so we ran these calculations in parallel by using packages snow and rlecuyer.
Calculation of percentage of variance explained by eQTLs
The proportion of variance of gene expression explained by eQTLs is calculated as
the difference in unexplained variance between the null and alternative models, divided
by the total phenotype variance, using the function fitqtl() from the R/qtl package.
In cases where we got more than 1 QTL per gene, we fit a multiple QTL linear
model using again fitqtl() to assess the significance of each QTL, given the others.
By doing so, we are able to elucidate if some of them are tagging the same causal
variant and discard the redundant ones.
5
Calculation of degree of connectivity
Using each expression data set and the algorithm developed by Tur et al. [5]
implemented in the R package qpgraph, we calculated the number of genes that are
functionally related with each of the 13 genes we are analyzing in each experimental
condition. This algorithm estimates the presence of a gene-gene functionally
relationship from expression data adjusting for indirect effects. To enable this
adjustment, q-order correlations are calculated from the entire expression data set,
using q=75 (Brem et al.), q=23 (glucose), q=16 (low iron), q=14 (rapamycin), q=16
(ethanol) and q=15 (maltose). From the resulting q-order correlations, a network was
estimated by a graph with gene pairs for which the null hypothesis of no q-order
correlation was rejected 90% or more of the times it was tested.
Given that the number of connections we get depend on the sample size, and it is
different for the 6 experimental conditions, we ranked them in each condition and
calculated the percentile of genes below every observed degree of connectivity, so that
we can compare results between different experimental conditions.
RESULTS
We performed eQTL mapping of each of the selected 13 genes with more than 70%
of expression variance explained by their eQTL located in a different chromosome, as
observed in Tur et al. data. It was carried out using data from 6 different eQTL
experiments, which are described in Table 1. For each data set, we calculated the LOD
score for determininig which markers tag the corresponding eQTL, the percentage of
variance explained by them and the degree of connectivity of each gene with all the
other ones in the functional network estimated from the expression data of the
corresponding environment.
Results obtained in eQTL mapping assay, as well as the percentage of expression
variance due to each eQTL and connectivity analyses are plotted in Figure 1, where
colour, shape and size of dots represent the experimental condition, number of eQTLs
and ranking in connectivity analysis, respectively. In addition all numerical data from
these experiments are described in detail in Table S1, on the supplementary data.
6
Most genes related to mating process have strong genetic regulation of their expression
If we focus on those genes related with mating regulation, we can observe that 6 of
them (STE6, STE3, BAR1, MF(ALPHA)1, AFB1 and MFA2) show a very well
conserved genetic regulation in all experimental conditions. In the S.cerevisiae strain
used by Brem et al., a single eQTL was detected in chromosome III, at 96.56 cM.
Using Gagneur et al. data we also found a single eQTL in all environment conditions,
located in chromosome III as well, at a similar position (ranging from 91.98 to 98.77
cM). All eQTLs were detected with a remarkably high LOD score. Indeed, it is of notice
that these 6 genes are the ones with the largest proportion of expression variance
explained by their eQTLs: in all cases it scores 70% at least, and remarkably STE3
scores more than 90% in all our 5 growth mediums. In addition, they all are largely
connected with all other set of 8382 genes we have studied, given that the vast
majority ranks at the top 5% of those with more number of connections in the
corresponding environment.
In contrast, gene STE2 shows great differences among the six experimental
conditions. A single eQTL in chromosome III (96.56 cM) was reported by Tur et al.
However, in our analysis we found 2 eQTLs in both glucose and low iron
environments, a single one when yeast were grown in rapamycin or ethanol, and none
of them were they were grown in maltose medium. In glucose, low iron, rapamycin and
ethanol conditions, one eQTL in chromosome VI was detected at 57.23, 44.57, 44.23
and 37.12 cM, respectively. Moreover, in glucose and low iron environments, another
Number of
individuals
Number of
phenotypes (genes)
Number of
markers
Brem et al. 112 6216 1857
GLUCOSE 46 8382 2188
LOW IRON 33 8382 1612
RAPAMYICIN 29 8382 1479
ETHANOL 32 8382 1591
MALTOSE 31 8382 1488
Table 1 – Description of data used in our analysis. For all 6 experimental conditions, number of individuals, number of phenotypes available, and number of markers with available information are specified in corresponding columns. Brem et al. data [9] is which Tur et al. used in their analysis. Strains are derived from a cross of BY4716, isogenic to the lab strain S288C and the wild isolate RM11-1a. On the other hand, data from the other 5 environments are from Gagneur et al. data [6], which used S96 and YJM789 as parental strains in their cross.
7

eQTL was detected in chromosome III at 94.74 cM and 101.65 cM, respectively.
Additionally, in these mediums STE2 show a high degree of connectivity. On the
contrary, it is very low in rapamyicin, ethanol and maltose. In STE2, we didn't find so
strong association between markers and eQTL as in previous six genes, given that
LOD scores are notably lower, ranging from 5.1 to 6.56, and also the proportion of
variance explained by them is more moderate: it scores between 52.01 and 82.33 %.
Expression of genes which control daughter cells separation is homogeneous among
different conditions
Genes involved in daughter cells separation pathways (DSE1, SCW11 and DSE2)
show very well conserved genetic regulation. For all three genes and all five growth
mediums tested, a single eQTL has been detected with notably high LOD scores (5.74
– 19.56). In all cases, it is located in chromosome II at a very similar position, in a
range from 165.04 to 172.66 cM, just as in Brem et al. strain, which it is reported to be
in chromosome II, at 166.9 cM. They also show homogenous percentage of expression
variance explained by such eQTLs, which scores between 57.38 and 85.88%.
Similarly, from a connectivity point of view, they all rank between 90% and 95% in
corresponding environments.
Genes which play a role in leucine biosynthesis are differently regulated depending on
environment
Finally, genes involved in leucine biosynthesis (BAT1, LEU1 and OAC1) show a
very variable genetic regulation, depending on growth medium and genetic
background. Strains used by Brem et al. were reported to have an eQTL each,
localised in chromosome III, at 39.27cM for BAT1 and 44.34 cM for LEU1 and OAC1,
but in our analysis we got very different results. In glucose conditions, LEU1 and OAC1
show a single eQTL each, both in chromosome XV, at 169.86 cM and 166.39 cM,
respectively. Proportion of variance explained by them is quite similar in both cases
(42.44% in LEU1 and 38.68% in OAC1), as well as degree of connectivity (LEU1 ranks
at 68.59%, and OAC1, at 51.81%). However, it is of notice that, comparing data with
Brem et al. data, there is a notable difference in both percentage of variance (30%, at
least) and degree of connectivity. In a maltose medium, one eQTL in chromosome VII
(395.05 cM) is found for all three genes and, additionally, BAT1 shows a second eQTL
in chromosome XVI (206.22 cM). Variance explained by them is around 70% both in
BAT1 and OAC1, similar to data from Brem et al, but it scores only 41.6% in LEU1.
Degree of connectivity is zero in both BAT1 and LEU1, and extremely low in OAC1.
8
Overall, it is observed that eQTL map pattern differs depending on the cellular
pathway we focus on. Almost all genes involved in mating regulation, in all conditions,
show a single eQTL in chromosome III at a very similar position. There is only a single
exception, gene STE2, which shows high variability in its eQTL, depending on the
environment. Genes related to daughter cells separation have a single eQTL in
chromosome II, at almost the same position for all conditions studied. Finally, genes
responsible for leucine biosynthesis show very variable eQTL maps. In Figure 2,
differences between genes with different eQTL map pattern are shown.
Remarkable differences in genetic control of gene expression are seen among cellular
pathways
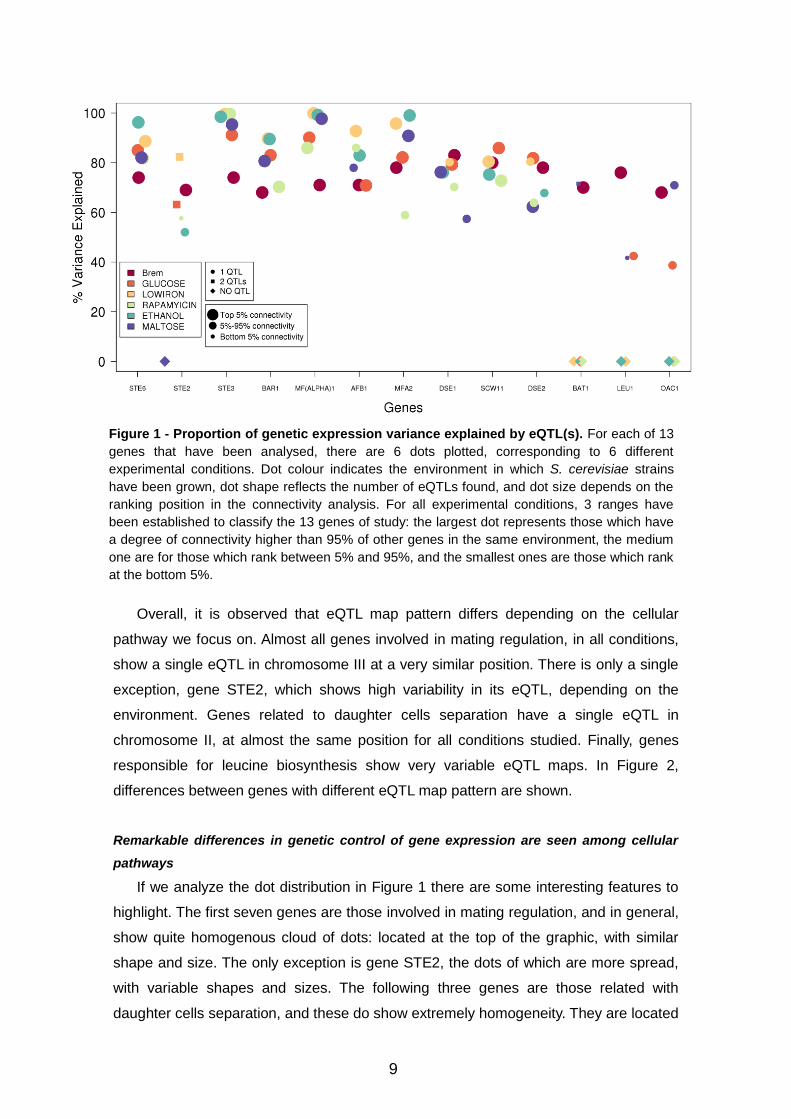
If we analyze the dot distribution in Figure 1 there are some interesting features to
highlight. The first seven genes are those involved in mating regulation, and in general,
show quite homogenous cloud of dots: located at the top of the graphic, with similar
shape and size. The only exception is gene STE2, the dots of which are more spread,
with variable shapes and sizes. The following three genes are those related with
daughter cells separation, and these do show extremely homogeneity. They are located
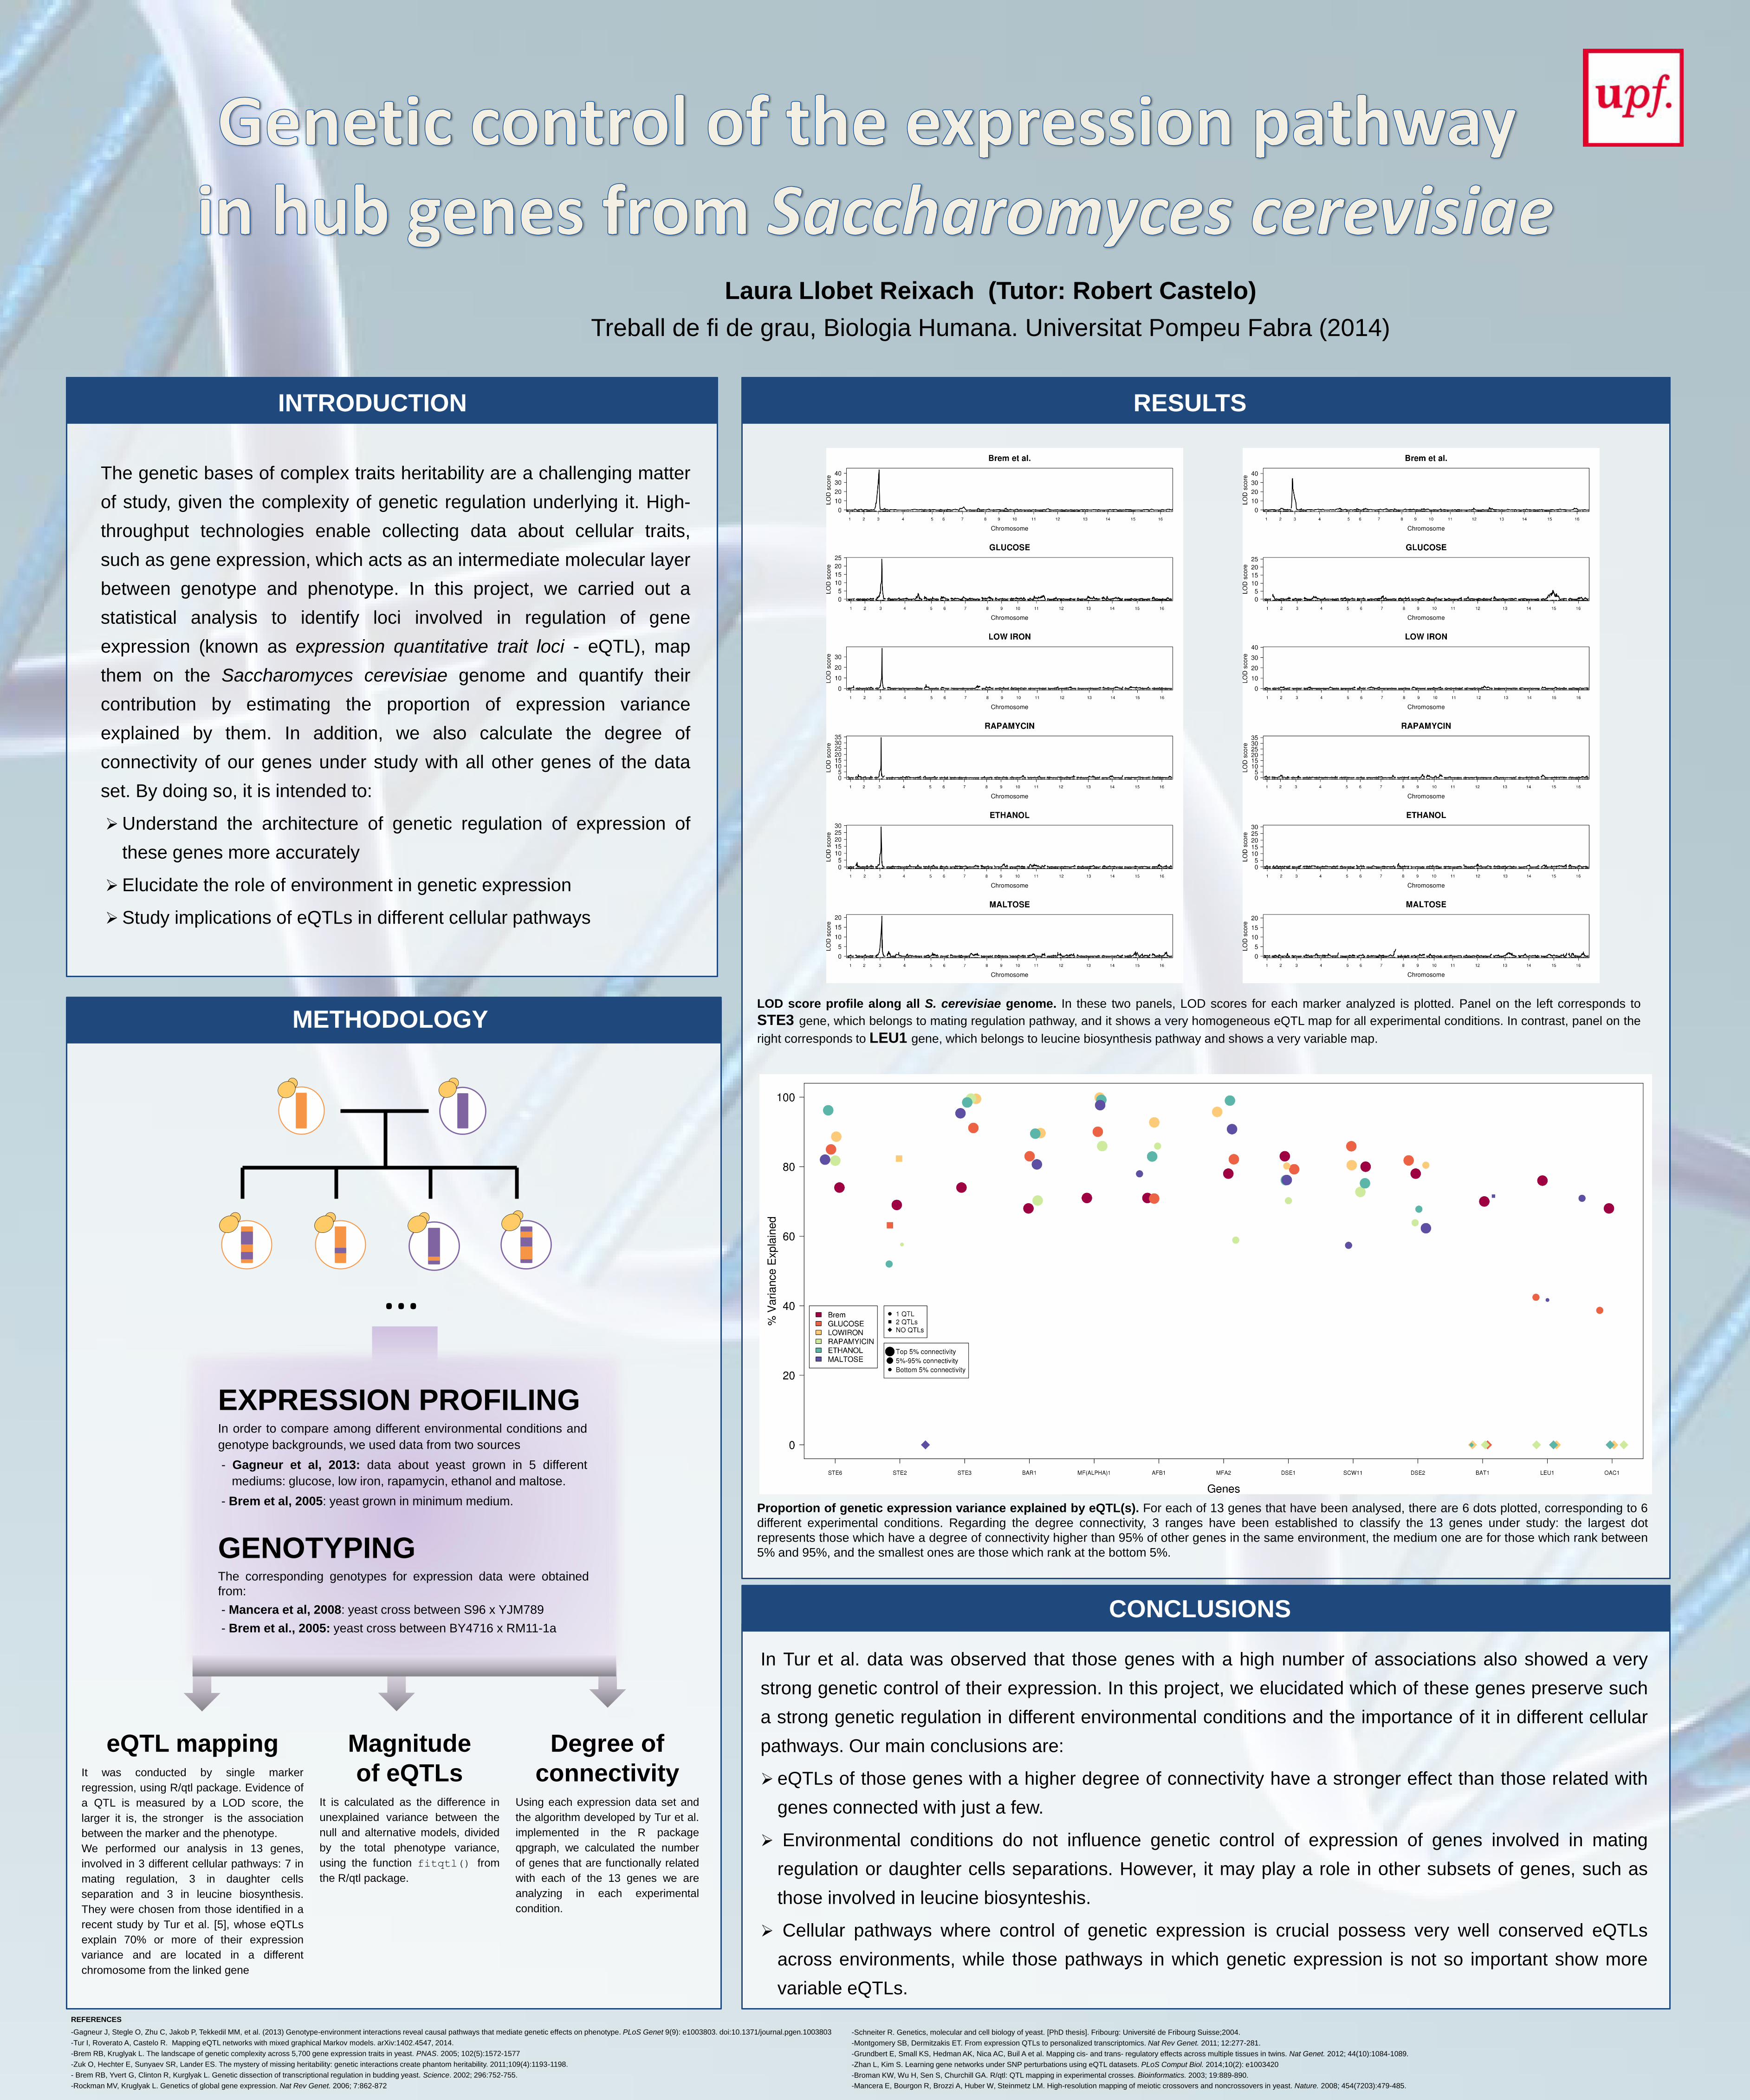
Figure 1 - Proportion of genetic expression variance explained by eQTL(s). For each of 13
genes that have been analysed, there are 6 dots plotted, corresponding to 6 different
experimental conditions. Dot colour indicates the environment in which S. cerevisiae strains
have been grown, dot shape reflects the number of eQTLs found, and dot size depends on the
ranking position in the connectivity analysis. For all experimental conditions, 3 ranges have
been established to classify the 13 genes of study: the largest dot represents those which have
a degree of connectivity higher than 95% of other genes in the same environment, the medium
one are for those which rank between 5% and 95%, and the smallest ones are those which rank
at the bottom 5%.
9
at slightly lower level than the previous ones, but they all show same shapes and sizes.
The last three genes are those involved in leucine biosynthesis, and one feature to
highlight is that only eQTLs have been found when yeast have been grown in mediums
rich in carbohydrates (glucose and maltose). There is an exception in BAT1, where no
eQTLs have been found in glucose conditions, but on the other hand we found 2 of
them in maltose environment. Brem et al. strains have been grown in minimum
medium, which also contains hydrates of carbon. Another important feature to highlight
is that we don’t find large points at the bottom of the figure, neither small ones at the
top, indicating that those genes with a strong genetic regulation, given that their eQTLs
explain a large proportion of their expression variance, are also those with a high
degree of connectivity in the gene functional network.
In conclusion, notable differences can be noticed among genes belonging to the
three different pathways, not only for the percentage of expression variance explained
by their eQTLs, but also for the pattern in their eQTL maps. In addition, there is a
correlation between strong genetic regulation and a high degree of connectivity, in all
cases of study.
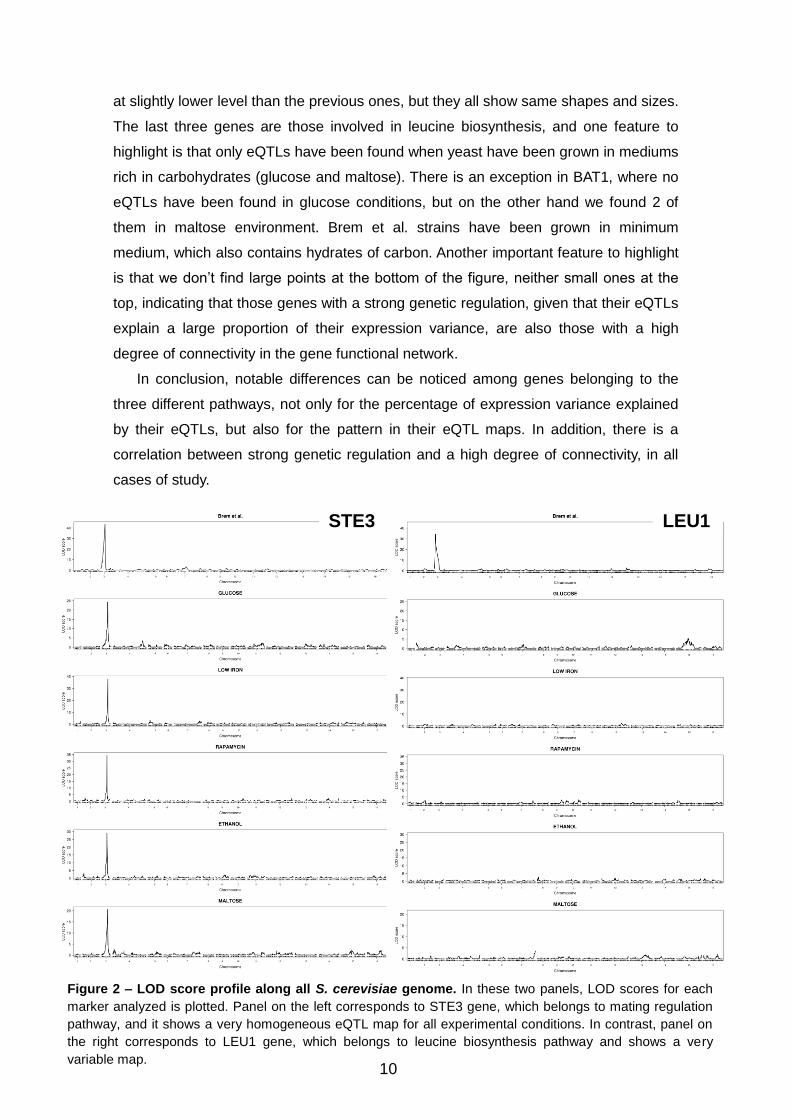
Figure 2 – LOD score profile along all S. cerevisiae genome. In these two panels, LOD scores for each
marker analyzed is plotted. Panel on the left corresponds to STE3 gene, which belongs to mating regulation
pathway, and it shows a very homogeneous eQTL map for all experimental conditions. In contrast, panel on
the right corresponds to LEU1 gene, which belongs to leucine biosynthesis pathway and shows a very
variable map.
STE3 LEU1
10
DISCUSSION AND CONCLUSIONS
The genetic bases of gene expression play an important role in gene regulation
underlying most large-scale phenotypes. Yet, mapping and interpreting the genetic
components of expression variance is difficult due to the fact that gene expression is a
high-dimensional multivariate molecular phenotype. A way to approach this complexity
is to think of genes as forming a network of functional associations with direct and
indirect effects, some of which with a genetic origin. In Tur et al. data was observed
that those genes with a high number of associations also showed a very strong genetic
control of their expression. In this project, we elucidated which of these genes preserve
such a strong genetic regulation in different environmental conditions and the
importance of it in different cellular pathways
The architecture of gene networks has been studied by calculating degree of
connectivity of each gene given all the others in each corresponding environment. We
could observe that, similar to Tur et al. analyses, those genes that are related to a
higher number of genes also present a stronger genetic regulation of their expression.
We could think that this may be because of the higher number of connections they
have, but we have realised that in general, all genes have one single eQTL, two at
maximum. So that, we have to conclude that eQTL of genes with a higher degree of
connectivity have a stronger effect than those related with genes connected with just a
few.
Regarding the role of environment in the control of genetic expression, we have
observed that in the major part of cases we have studied, genetic regulation is similar
among all different experimental conditions, so it does not have a very strong effect in
this subset of genes under strong genetic regulatory control. However, genes involved
in biosynthesis of leucine aminoacid, show remarkable differences. In these cases, we
only found genetic regulation when yeasts were grown in mediums rich in hydrates of
carbon, like glucose and maltose, but not in ethanol, rapamycin or low iron conditions.
Comparing data obtained from eQTL mapping in each of three cellular pathways
analysed, it is clearly seen that cellular pathways that contain genes with a very strong
genetic regulation, show a single eQTL in all conditions which maps at a very similar
position in all cases, whereas those genes with a very poor genetic control of their
expression show a very variable map of their eQTLs. So, we can conclude that cellular
pathways where control of genetic expression is crucial possess very well conserved
eQTLs, while those pathways in which genetic expression is not so important show
more variable eQTLs.
11

REFERENCES
1. Mackay TFC, Stone EA, Ayroles JF. The genetics of quantitative traits: challenges
and prospects. Nat Rev Genet. 2009; 10:565-577.
2. Zuk O, Hechter E, Sunyaev SR, Lander ES. The mystery of missing heritability:
genetic interactions create phantom heritability. 2011;109(4):1193-1198.
3. Brem RB, Yvert G, Clinton R, Kurglyak L. Genetic dissection of transcriptional
regulation in budding yeast. Science. 2002; 296:752-755.
4. Rockman MV, Kruglyak L. Genetics of global gene expression. Nat Rev Genet.
2006; 7:862-872
5. Tur I, Roverato A, Castelo R. Mapping eQTL networks with mixed graphical Markov
models. arXiv:1402.4547, 2014.
6. Gagneur J, Stegle O, Zhu C, Jakob P, Tekkedil MM, et al. (2013) Genotype-
environment interactions reveal causal pathways that mediate genetic effects on
phenotype. PLoS Genet 9(9): e1003803. doi:10.1371/journal.pgen.1003803
7. Schneiter R. Genetics, molecular and cell biology of yeast. [PhD thesis]. Fribourg:
Université de Fribourg Suisse;2004.
8. Mancera E, Bourgon R, Brozzi A, Huber W, Steinmetz LM. High-resolution mapping
of meiotic crossovers and noncrossovers in yeast. Nature. 2008; 454(7203):479-
485.
9. Brem RB, Kruglyak L. The landscape of genetic complexity across 5,700 gene
expression traits in yeast. PNAS. 2005; 102(5):1572-1577.
10. Montgomery SB, Dermitzakis ET. From expression QTLs to personalized
transcriptomics. Nat Rev Genet. 2011; 12:277-281.
11. Grundbert E, Small KS, Hedman AK, Nica AC, Buil A et al. Mapping cis- and trans-
regulatory effects across multiple tissues in twins. Nat Genet. 2012; 44(10):1084-
1089.
12. Zhan L, Kim S. Learning gene networks under SNP perturbations using eQTL
datasets. PLoS Comput Biol. 2014;10(2): e1003420
13. Broman KW, Wu H, Sen S, Churchill GA. R/qtl: QTL mapping in experimental
crosses. Bioinformatics. 2003; 19:889-890.
12
GENE EXPERIMENTAL
CONDITION
eQTL Degrees of connectivity
(Ranking within environment - %)
Name
Cellular pathway
Chr Chr Position
(cM) LOD score
Variance explained
(%)
STE6
Mating regulation
XI
Brem et al III 96,56 53,90 74,00 25 (99,97)
GLUCOSE III 94,74 18,93 84,97 42 (97,98)
LOW IRON III 98,70 15,59 88,64 41 (97,83)
RAPAMYICIN III 96,60 10,71 81,75 38 (97,04)
ETHANOL III 91,98 22,77 96,22 37 (97,40)
MALTOSE III 98,77 11,56 82,03 42 (95,89)
STE2
Mating regulation
VI
Brem et al III 96,56 43,10 69,00 20 (98,58)
GLUCOSE III 94,74 5,45
63,15 24 (92,68) VI 57,23 6,22
LOW IRON III 101,65 6,56
82,33 13 (86,89) VI 44,57 5,44
RAPAMYICIN VI 44,23 5,41 57,63 0 (0)
ETHANOL VI 37,12 5,10 52,01 1 (0)
MALTOSE - - - - 6 (65,77)
STE3
Mating regulation
XI
Brem et al III 96,56 43,70 74,00 23 (99,47)
GLUCOSE III 94,74 24,21 91,14 43 (98,22)
LOW IRON III 98,70 38,07 99,51 38 (97,18)
RAPAMYICIN III 96,60 34,43 99,58 44 (97,84)
ETHANOL III 91,98 29,07 98,48 40 (97,88)
MALTOSE III 98,77 20,66 95,36 44 (96,22)
BAR1
Mating regulation
IX
Brem et al III 96,56 41,40 68,00 21 (99,01)
GLUCOSE III 94,74 17,10 83,00 45 (98,46)
LOW IRON III 98,70 16,25 89,65 39 (97,49)
RAPAMYICIN III 96,60 7,64 70,27 31 (95,48)
ETHANOL III 91,98 15,66 89,50 35 (96,91)
MALTOSE III 98,77 11,06 80,66 41 (95,64)
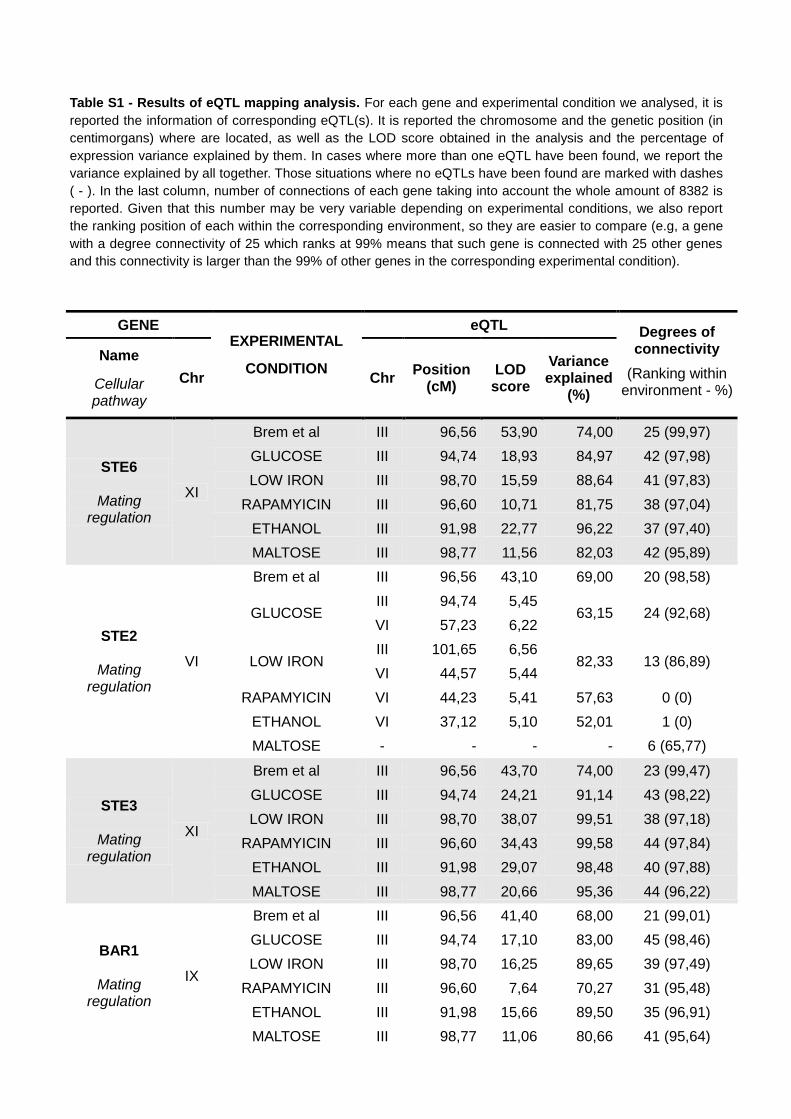
Table S1 - Results of eQTL mapping analysis. For each gene and experimental condition we analysed, it is
reported the information of corresponding eQTL(s). It is reported the chromosome and the genetic position (in
centimorgans) where are located, as well as the LOD score obtained in the analysis and the percentage of
expression variance explained by them. In cases where more than one eQTL have been found, we report the
variance explained by all together. Those situations where no eQTLs have been found are marked with dashes
( - ). In the last column, number of connections of each gene taking into account the whole amount of 8382 is
reported. Given that this number may be very variable depending on experimental conditions, we also report
the ranking position of each within the corresponding environment, so they are easier to compare (e.g, a gene
with a degree connectivity of 25 which ranks at 99% means that such gene is connected with 25 other genes
and this connectivity is larger than the 99% of other genes in the corresponding experimental condition).
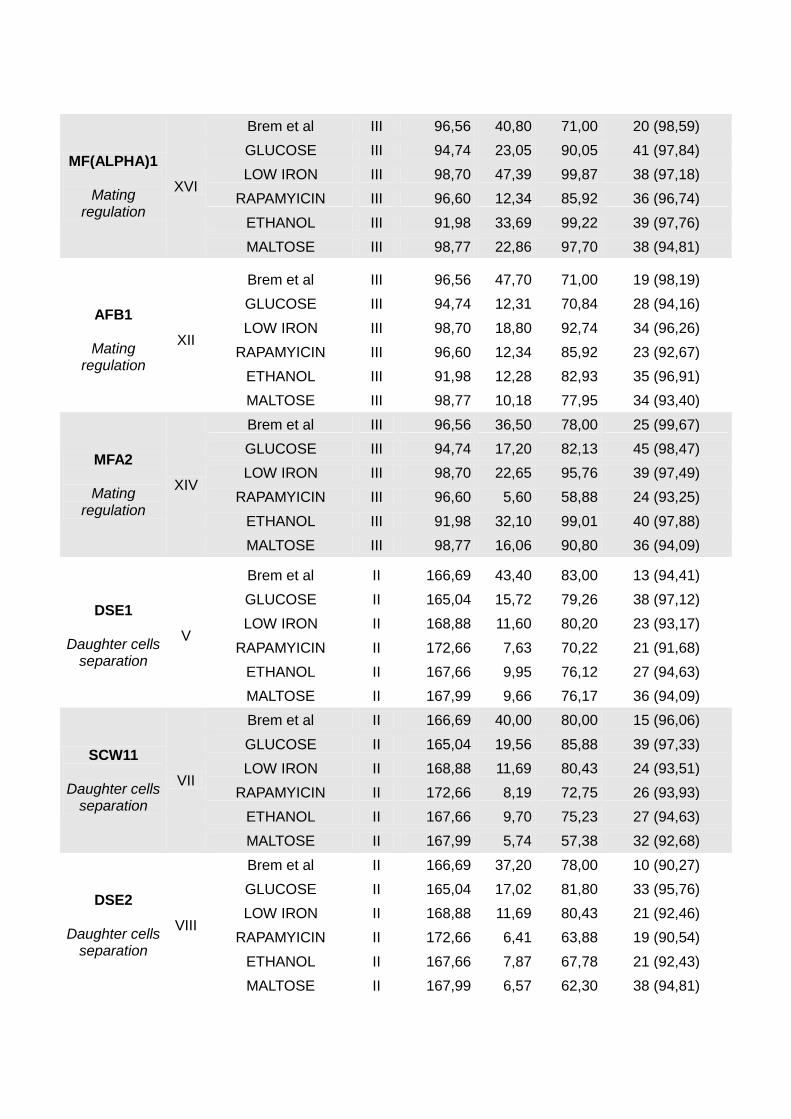
MF(ALPHA)1
Mating regulation
XVI
Brem et al III 96,56 40,80 71,00 20 (98,59)
GLUCOSE III 94,74 23,05 90,05 41 (97,84)
LOW IRON III 98,70 47,39 99,87 38 (97,18)
RAPAMYICIN III 96,60 12,34 85,92 36 (96,74)
ETHANOL III 91,98 33,69 99,22 39 (97,76)
MALTOSE III 98,77 22,86 97,70 38 (94,81)
AFB1
Mating regulation
XII
Brem et al III 96,56 47,70 71,00 19 (98,19)
GLUCOSE III 94,74 12,31 70,84 28 (94,16)
LOW IRON III 98,70 18,80 92,74 34 (96,26)
RAPAMYICIN III 96,60 12,34 85,92 23 (92,67)
ETHANOL III 91,98 12,28 82,93 35 (96,91)
MALTOSE III 98,77 10,18 77,95 34 (93,40)
MFA2
Mating regulation
XIV
Brem et al III 96,56 36,50 78,00 25 (99,67)
GLUCOSE III 94,74 17,20 82,13 45 (98,47)
LOW IRON III 98,70 22,65 95,76 39 (97,49)
RAPAMYICIN III 96,60 5,60 58,88 24 (93,25)
ETHANOL III 91,98 32,10 99,01 40 (97,88)
MALTOSE III 98,77 16,06 90,80 36 (94,09)
DSE1
Daughter cells separation
V
Brem et al II 166,69 43,40 83,00 13 (94,41)
GLUCOSE II 165,04 15,72 79,26 38 (97,12)
LOW IRON II 168,88 11,60 80,20 23 (93,17)
RAPAMYICIN II 172,66 7,63 70,22 21 (91,68)
ETHANOL II 167,66 9,95 76,12 27 (94,63)
MALTOSE II 167,99 9,66 76,17 36 (94,09)
SCW11
Daughter cells separation
VII
Brem et al II 166,69 40,00 80,00 15 (96,06)
GLUCOSE II 165,04 19,56 85,88 39 (97,33)
LOW IRON II 168,88 11,69 80,43 24 (93,51)
RAPAMYICIN II 172,66 8,19 72,75 26 (93,93)
ETHANOL II 167,66 9,70 75,23 27 (94,63)
MALTOSE II 167,99 5,74 57,38 32 (92,68)
DSE2
Daughter cells separation
VIII
Brem et al II 166,69 37,20 78,00 10 (90,27)
GLUCOSE II 165,04 17,02 81,80 33 (95,76)
LOW IRON II 168,88 11,69 80,43 21 (92,46)
RAPAMYICIN II 172,66 6,41 63,88 19 (90,54)
ETHANOL II 167,66 7,87 67,78 21 (92,43)
MALTOSE II 167,99 6,57 62,30 38 (94,81)
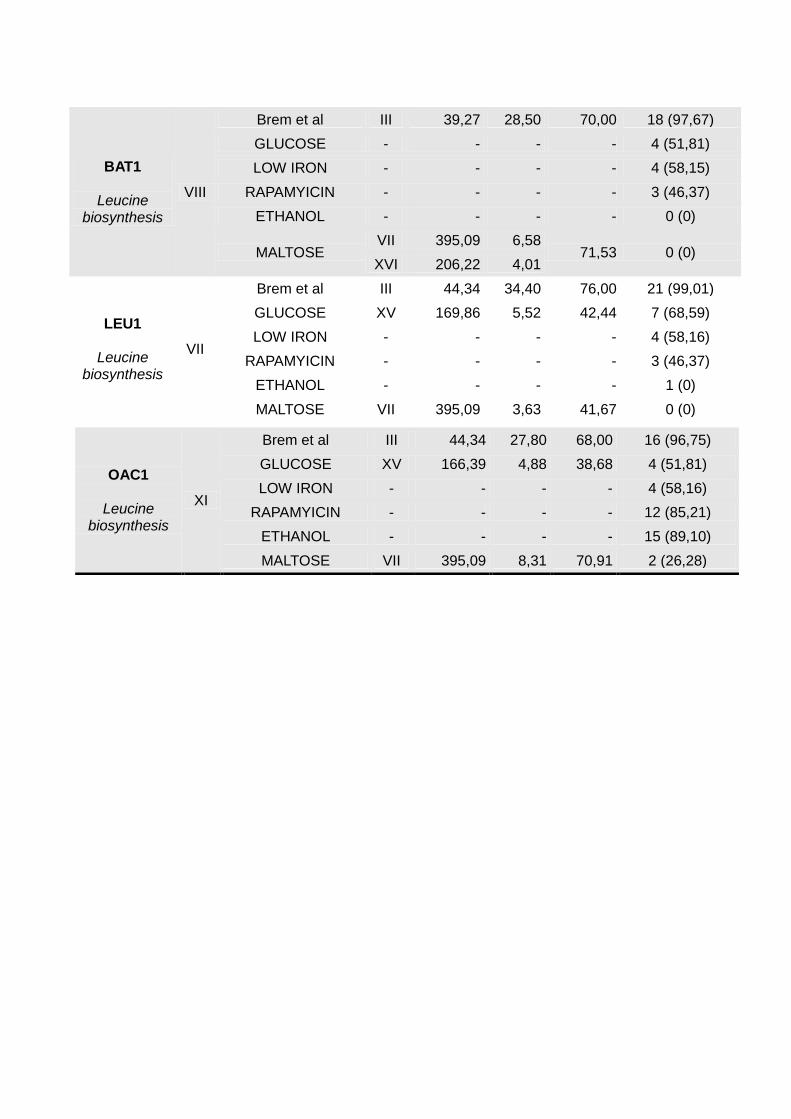
OAC1
Leucine biosynthesis
XI
Brem et al III 44,34 27,80 68,00 16 (96,75)
GLUCOSE XV 166,39 4,88 38,68 4 (51,81)
LOW IRON - - - - 4 (58,16)
RAPAMYICIN - - - - 12 (85,21)
ETHANOL - - - - 15 (89,10)
MALTOSE VII 395,09 8,31 70,91 2 (26,28)
BAT1
Leucine biosynthesis
VIII
Brem et al III 39,27 28,50 70,00 18 (97,67)
GLUCOSE - - - - 4 (51,81)
LOW IRON - - - - 4 (58,15)
RAPAMYICIN - - - - 3 (46,37)
ETHANOL - - - - 0 (0)
MALTOSE VII 395,09 6,58
71,53 0 (0) XVI 206,22 4,01
LEU1
Leucine biosynthesis
VII
Brem et al III 44,34 34,40 76,00 21 (99,01)
GLUCOSE XV 169,86 5,52 42,44 7 (68,59)
LOW IRON - - - - 4 (58,16)
RAPAMYICIN - - - - 3 (46,37)
ETHANOL - - - - 1 (0)
MALTOSE VII 395,09 3,63 41,67 0 (0)
Laura Llobet Reixach (Tutor: Robert Castelo)
Treball de fi de grau, Biologia Humana. Universitat Pompeu Fabra (2014)
INTRODUCTION
The genetic bases of complex traits heritability are a challenging matter
of study, given the complexity of genetic regulation underlying it. High-
throughput technologies enable collecting data about cellular traits,
such as gene expression, which acts as an intermediate molecular layer
between genotype and phenotype. In this project, we carried out a
statistical analysis to identify loci involved in regulation of gene
expression (known as expression quantitative trait loci - eQTL), map
them on the Saccharomyces cerevisiae genome and quantify their
contribution by estimating the proportion of expression variance
explained by them. In addition, we also calculate the degree of
connectivity of our genes under study with all other genes of the data
set. By doing so, it is intended to:
Understand the architecture of genetic regulation of expression of
these genes more accurately
Elucidate the role of environment in genetic expression
Study implications of eQTLs in different cellular pathways
…
eQTL mapping It was conducted by single marker
regression, using R/qtl package. Evidence of
a QTL is measured by a LOD score, the
larger it is, the stronger is the association
between the marker and the phenotype.
We performed our analysis in 13 genes,
involved in 3 different cellular pathways: 7 in
mating regulation, 3 in daughter cells
separation and 3 in leucine biosynthesis.
They were chosen from those identified in a
recent study by Tur et al. [5], whose eQTLs
explain 70% or more of their expression
variance and are located in a different
chromosome from the linked gene
Magnitude
of eQTLs It is calculated as the difference in
unexplained variance between the
null and alternative models, divided
by the total phenotype variance,
using the function fitqtl() from
the R/qtl package.
Degree of
connectivity Using each expression data set and
the algorithm developed by Tur et al.
implemented in the R package
qpgraph, we calculated the number
of genes that are functionally related
with each of the 13 genes we are
analyzing in each experimental
condition.
METHODOLOGY
RESULTS
In Tur et al. data was observed that those genes with a high number of associations also showed a very
strong genetic control of their expression. In this project, we elucidated which of these genes preserve such
a strong genetic regulation in different environmental conditions and the importance of it in different cellular
pathways. Our main conclusions are:
eQTLs of those genes with a higher degree of connectivity have a stronger effect than those related with
genes connected with just a few.
Environmental conditions do not influence genetic control of expression of genes involved in mating
regulation or daughter cells separations. However, it may play a role in other subsets of genes, such as
those involved in leucine biosynteshis.
Cellular pathways where control of genetic expression is crucial possess very well conserved eQTLs
across environments, while those pathways in which genetic expression is not so important show more
variable eQTLs.
GENOTYPING The corresponding genotypes for expression data were obtained
from:
- Mancera et al, 2008: yeast cross between S96 x YJM789
- Brem et al., 2005: yeast cross between BY4716 x RM11-1a
EXPRESSION PROFILING In order to compare among different environmental conditions and
genotype backgrounds, we used data from two sources
- Gagneur et al, 2013: data about yeast grown in 5 different
mediums: glucose, low iron, rapamycin, ethanol and maltose.
- Brem et al, 2005: yeast grown in minimum medium. Proportion of genetic expression variance explained by eQTL(s). For each of 13 genes that have been analysed, there are 6 dots plotted, corresponding to 6
different experimental conditions. Regarding the degree connectivity, 3 ranges have been established to classify the 13 genes under study: the largest dot
represents those which have a degree of connectivity higher than 95% of other genes in the same environment, the medium one are for those which rank between
5% and 95%, and the smallest ones are those which rank at the bottom 5%.
LOD score profile along all S. cerevisiae genome. In these two panels, LOD scores for each marker analyzed is plotted. Panel on the left corresponds to
STE3 gene, which belongs to mating regulation pathway, and it shows a very homogeneous eQTL map for all experimental conditions. In contrast, panel on the
right corresponds to LEU1 gene, which belongs to leucine biosynthesis pathway and shows a very variable map.
CONCLUSIONS
REFERENCES
-Gagneur J, Stegle O, Zhu C, Jakob P, Tekkedil MM, et al. (2013) Genotype-environment interactions reveal causal pathways that mediate genetic effects on phenotype. PLoS Genet 9(9): e1003803. doi:10.1371/journal.pgen.1003803
-Tur I, Roverato A, Castelo R. Mapping eQTL networks with mixed graphical Markov models. arXiv:1402.4547, 2014.
-Brem RB, Kruglyak L. The landscape of genetic complexity across 5,700 gene expression traits in yeast. PNAS. 2005; 102(5):1572-1577
-Zuk O, Hechter E, Sunyaev SR, Lander ES. The mystery of missing heritability: genetic interactions create phantom heritability. 2011;109(4):1193-1198.
- Brem RB, Yvert G, Clinton R, Kurglyak L. Genetic dissection of transcriptional regulation in budding yeast. Science. 2002; 296:752-755.
-Rockman MV, Kruglyak L. Genetics of global gene expression. Nat Rev Genet. 2006; 7:862-872
-Schneiter R. Genetics, molecular and cell biology of yeast. [PhD thesis]. Fribourg: Université de Fribourg Suisse;2004.
-Montgomery SB, Dermitzakis ET. From expression QTLs to personalized transcriptomics. Nat Rev Genet. 2011; 12:277-281.
-Grundbert E, Small KS, Hedman AK, Nica AC, Buil A et al. Mapping cis- and trans- regulatory effects across multiple tissues in twins. Nat Genet. 2012; 44(10):1084-1089.
-Zhan L, Kim S. Learning gene networks under SNP perturbations using eQTL datasets. PLoS Comput Biol. 2014;10(2): e1003420
-Broman KW, Wu H, Sen S, Churchill GA. R/qtl: QTL mapping in experimental crosses. Bioinformatics. 2003; 19:889-890.
-Mancera E, Bourgon R, Brozzi A, Huber W, Steinmetz LM. High-resolution mapping of meiotic crossovers and noncrossovers in yeast. Nature. 2008; 454(7203):479-485.