Impacto del petróleo - COnnecting REpositoriesDada la ubicuidad de esta cianobacteria en los...
212
UNIVERSIDAD AUTÓNOMA DE BARCELONA FACULTAD DE CIENCIAS Departamento de Genética y Microbiología IMPACTO DEL PETRÓLEO EN LA DISTRIBUCIÓN Y BIOMASA DE LAS CIANOBACTERIAS EN ECOSISTEMAS NATURALES Y ARTIFICIALES Elia Diestra Villanueva 2005
Transcript of Impacto del petróleo - COnnecting REpositoriesDada la ubicuidad de esta cianobacteria en los...
UNIVERSIDAD AUTÓNOMA DE BARCELONA
FACULTAD DE CIENCIAS
Departamento de Genética y Microbiología
IMPACTO DEL PETRÓLEO EN LA DISTRIBUCIÓN Y
BIOMASA DE LAS CIANOBACTERIAS EN ECOSISTEMAS NATURALES Y ARTIFICIALES
Elia Diestra Villanueva
2005
UNIVERSIDAD AUTÓNOMA DE BARCELONA
FACULTAD DE CIENCIAS
Departamento de Genética y Microbiología
IMPACTO DEL PETRÓLEO EN LA DISTRIBUCIÓN Y
BIOMASA DE LAS CIANOBACTERIAS EN ECOSISTEMAS NATURALES Y ARTIFICIALES
Memoria redactada para optar al Grado de Doctor en Biotecnología por la universidad Autónoma de Barcelona, por Elia Diestra Villanueva.
VºBº de los Directores de Tesis Dra. Isabel Esteve Martínez Dr. Antonio Solé i Cornellà
Bellaterra, Octubre del 2005

La ciencia, a pesar de sus progresos increíbles, no puede
ni nunca podrá explicarlo todo. Cada vez ganará nuevas
zonas a lo que hoy parece inexplicable. Pero las rayas
fronterizas del saber, por muy lejos que se eleven,
tendrán siempre delante un infinito mundo de misterio.
Gregorio Marañón

ÍNDICE

Índice
Resumen i
Capítulo I. Introducción 3
Capítulo II. Material y Métodos
2.1. Caracterización y Muestreo de Tapetes Microbianos Naturales y
Artificiales 20
2.1.1. Descripción de los ecosistemas naturales estudiados 20
2.1.2. Descripción de los ecosistemas artificiales 28
2.1.3. Procesamiento de muestras 30
2.1.4. Microscopía Láser Confocal 30
2.2. Cultivos Celulares. Microcoleus consorcio 32
2.2.1. Cultivo de enriquecimiento 32
2.2.2. Aislamiento de Microcoleus consorcio 32
2.2.3. Identificación 32
A. Aplicación de técnicas microscópicas de alta resolución 32
Microscopía Láser Confocal 32
Microscopía Electrónica de Transmisión 33
Microscopía Electrónica de Barrido 34
B. Técnicas Moleculares 34
Extracción de DNA 34
PCR-DGGE 35
Librería Genética y Análisis del Polimorfismo de Restricción de
la longitud del Fragmento de DNA 36
Secuenciación del rRNA 37
Número de Acceso 38
C. Técnicas de Análisis Químico 41
Capítulo III. Identificación y distribución de las cianobacterias en los tapetes
microbianos de Salins-de-Giraud en un ciclo día-noche
Introducción 43
Resultados 44
Identificación y distribución de las en los tapetes microbianos
de la Camarga 44
Distribución de Microcoleus chthonoplastes durante un ciclo
día-noche 45
Discusión 46
Capítulo IV. Diversidad de las cianobacterias en ambientes naturales y artificiales
contaminados por petróleo
Introducción 52
Resultados y Discusión 54
A. Análisis de la diversidad y determinación de la biomasa de las
cianobacterias en tapetes microbianos de de Europa con distinto
grado de contaminación 54
B. Análisis de la diversidad y determinación de la biomasa de
las cianobacterias en Mesocosmos 57
Capítulo V. Aislamiento y caracterización de un consorcio de microorganismos para
degradar petróleo
Introducción 67
Resultados 70
Aislamiento de un consorcio de microorganismos 70
Caracterización del consorcio mediante técnicas microscópicas 71
Determinación de las condiciones de cultivo que favorecen
el crecimiento óptimo de Microcoleus consorcio 72
Identificación de los microorganismos que constituyen el
consorcio por técnicas moleculares 72
Discusión 73

Conclusiones 84
Referencias Bibliográficas 87
Agradecimientos
i
Resumen
En el presente trabajo se ha estudiado el efecto del petróleo en las cianobacterias,
bacterias fototróficas oxigénicas que forman las poblaciones dominantes de los tapetes
microbianos. Se trata de ambientes bentónicos estratificados situados en costas litorales
y que se encuentran en ocasiones expuestos a los vertidos accidentales de petróleo. El
papel de las cianobacterias en la bioreparación del crudo es un tema que suscita mucho
interés, aunque no se han dado, hasta el presente momento, datos concluyentes sobre si
la degradación del petróleo se produce exclusivamente por un tipo de cianobacteria o
por un consorcio de microorganismos.
Considerando el objetivo anteriormente expuesto, se ha analizado la diversidad, y
determinado los perfiles de biomasa individual y total de las cianobacterias, mediante
microscopio láser confocal (CLSM) en los ambientes naturales contaminados y no
contaminados por petróleo (delta del Ebro, Salins-de-Giraud, Colònia de Sant Jordi,
Waulkmill bay, Swanbister bay y Etang de Bêrre) y en ecosistemas artificiales
(mesocosmos).
Así mismo, se ha aislado e identificado un consorcio de microorganismos con
capacidad para degradar el petróleo.
En los tapetes microbianos estudiados, se observan cambios tanto en la diversidad
de las cianobacterias, como en su biomasa total. En los ambientes no contaminados se
han identificado cianobacterias filamentosas como Microcoleus chthonoplastes,
Oscillatoria sp., Lyngbya sp., Limnothrix sp. y cianobacterias unicelulares como
Gloeocapsa sp., Chroococcus sp., Synechocystis sp., localizándose la concentración
máxima de biomasa total principalmente en la capa óxica de los tapetes. En los
ecosistemas poco contaminados, se han identificado principalmente cianobacterias
unicelulares correspondientes al grupo Pleurocapsa, siguiendo la biomasa total de estos
microorganismos un perfil parecido al de los ambientes anteriormente mencionados. En
los muy contaminados, se identificaron exclusivamente cianobacterias del tipo
filamentoso, observándose una reducción de la biomasa total a lo largo del tapete.
En los ecosistemas artificiales (mesocosmos), las cianobacterias del tipo unicelular
se detectaron solo en los contaminados por petróleo (aunque a muy baja concentración
de biomasa), mientras que Microcoleus chthonoplastes fue la cianobacteria dominante,
tanto en las muestras control, como en las contaminadas por el crudo.
ii
Dada la ubicuidad de esta cianobacteria en los diferentes tipos de ambientes
estudiados, y por su reconocido papel en la estabilización de los sedimentos, el objetivo
anterior se complementó con un análisis de la distribución de los perfiles de biomasa de
este microorganismo durante un ciclo día-noche en los tapetes microbianos de Salins-
de-Giraud. El estudio demostró la versatilidad metabólica de esta cianobacteria, al
presentar máximos de biomasa, en capas sometidas a parámetros ambientales muy
distintos: presencia de luz y O2 (31.22 mgC/cm3 de sedimento), presencia de luz y H2S
(28.91 mgC/cm3 de sedimento).
Finalmente, uno de los principales objetivos del trabajo, fue el aislamiento de
Microcoleus sp. en cultivos de laboratorio para analizar el efecto sobre el crecimiento de
este microorganismo, de dos tipos de petróleo: el Casablanca (con alto contenido de
hidrocarburos alifáticos) y el Maya (rico en azufre y en compuestos aromáticos) y muy
tóxico. A partir de dichos cultivos se aisló un consorcio de microorganismos, al que se
denominó Microcoleus consorcio.
La caracterización de este consorcio, se realizó utilizando técnicas microscópicas de
alta resolución. El CLSM, permitió caracterizar e identificar a la cianobacteria
filamentosa, mientras que la caracterización de las bacterias heterotróficas que
formaban parte del consorcio, se realizó mediante microscopía electrónica de
transmisión (TEM) y de barrido (SEM). La identificación de las bacterias antes
mencionadas se efectuó además mediante técnicas moleculares (Reacción en Cadena de
la Polimerasa-Electroforesis en Gel de Gradiente Desnaturalizante).
Los resultados obtenidos mostraban que el consorcio estaba formado por una
cianobacteria, Microcoleus chthonoplastes y diferentes bacterias heterotróficas incluidas
en la envuelta de exopolisacáridos de la cianobacteria. Las bacterias heterotróficas
identificadas, fueron en su mayoría fijadoras de nitrógeno y pertenecían a diferentes
grupos filogenéticos como a las α, β y γ, subclases de Proteobacteria, y al grupo CFB.
Es importante mencionar, que el análisis químico del petróleo, después del
crecimiento del consorcio, demostró que éste degradaba el crudo Maya; principalmente
los alquiltianos, alquiltiolanos y carbazoles, lo que podría tener un gran interés en
estudios futuros de ecotoxicidad.
iii
Summary
The present work studies the effect of oil on cyanobacteria, oxygenic phototrophic
bacteria that form the dominant populations of microbial mats. These are stratified
benthonic environments located in coastal sites and that are sometimes exposed to
accidental oil spills. The role of the cyanobacteria in the biorepair of oil is an issue that
has raised considerable interest, although to date no conclusive data has been
forthcoming on whether the degradation of oil is exclusively produced by a given
cyanobacterium or by a consortium of micro-organisms.
Bearing in mind the objective raised above, we have analysed the diversity—and
determined the profiles—of individual and total cyanobacteria biomass, through
confocal laser microscopy (CLSM), in natural environments (the Ebro delta, Salins-de-
Giraud, Colònia de Sant Jordi, Waulkmill bay, Swanbister bay and Etang de Bêrre) and
in artificial environments (mesocosms).
At the same time, we have isolated and identified a consortium of micro-organisms
capable of degrading oil.
In the microbial mats studied, changes are observed both in the diversity of the
cyanobacteria and in their total biomass. In the non-polluted environments, we have
observed filamentous cyanobacteria such as Microcoleus chthonoplastes, Oscillatoria
sp., Lyngbya sp., Limnothrix sp. and unicellular cyanobacteria such as Gloeocapsa sp.,
Chroococcus sp., Synechocystis sp., situating the maximum concentration of total
biomass basically in the oxic layer of the mats. In those environments that are only
slightly polluted, we have principally identified unicellular cyanobacteria corresponding
to the Pleurocapsa group, the total biomass of these micro-organisms following a
profile similar to that of the above-mentioned environments. In heavily polluted
environments, we exclusively identify cyanobacteria of the filamentous type, observing
a reduction in total biomass throughout the mat.
In artificial ecosystems (mesocosmos), unicellular type cyanobacteria are only
detected in oil contaminants (although at very low biomass concentrations), whilst
Microcoleus chthonoplastes was the dominant cyanobacterium, both in control samples
as well as in oil contaminants.
Given the ubiquity of this cyanobacterium in the various environment types studied,
and because of its recognised role in sediment stabilization, our earlier objective has
been complemented with an analysis of the biomass-profile distribution for this micro-
iv
organism during the day-night cycle in the Salins-de-Giraud microbial mats. The study
demonstrated the metabolic versatility of this cyanobacterium, on showing biomass
maximums, in those layers subjected to very distinct environmental parameters, namely,
the presence of light and O2 (31.22 mgC/cm3 of sediment), the presence of light and
H2S (28.91 mgC/cm3 of sediment).
Finally, one of the principal objectives of this work was that of isolating
Microcoleus sp. In laboratory cultures so as to analyse the effect on the growth of this
micro-organism of two types of oil: Casablanca (with a high content of aliphatic
hydrocarbons) and Maya (rich in sulphur and aromatic compounds) and highly toxic.
On the basis of these cultures, a consortium of micro-organisms was then isolated,
which was given the name of the Microcoleus consortium.
The characterization of this consortium was undertaken by high-resolution
microscope techniques. CLSM allows the characterization and identification of the
filamentous cyanobacterium, whilst characterization of the heterotrophic bacteria that
formed part of the consortium was undertaken by transmission-electronic microscopy
(TEM) and sweep microscopy (SEM). Identification of the above-mentioned bacteria
was additionally carried out through molecular techniques (Polymerase-Electrophoresis
Chain Reaction in Denaturalizing Gradient Gel).
The results obtained show that the consortium was formed by a cyanobacterium,
Microcoleus chthonoplastes, and different heterotrophic bacteria included within the
exopolisaccharide sheath of the cyanobacterium. The heterotrophic bacteria identified
were, in their majority, nitrogen fixers belonging to different phylogenetic groups such
as α, β and γ—subclasses of Proteobacteria—and the CFB group.
It is of importance to observe that the chemical analysis of oil, after the growth of
the consortium, showed that the consortium degraded the Maya oil, principally
alkylthiolanes, alkylthianes and carbazoles, which could be of considerable interest to
future studies of ecotoxicity.

CAPÍTULO I: INTRODUCCIÓN
Diversidad, Ecofisiología e Importancia
Evolutiva de las Cianobacterias
1. Ecofisiología de las Cianobacterias
2. Taxonomía y Diversidad de las
Cianobacterias
3. Las Cianobacterias y su Papel en la
Degradación del Petróleo
3
Introducción
Introducción:
Diversidad, Ecofisiología e Importancia Evolutiva de las Cianobacterias
En este primer capítulo se expone una introducción global a las cianobacterias. Se
las ubica taxonómica y filogenéticamente en el dominio Eubacteria y se resalta su
importancia en la evolución de la vida sobre la tierra.
Al tratarse de un grupo muy diverso de bacterias, con una extraordinaria
capacidad adaptativa a distintos ecosistemas y en general muy extremos para la vida, se
destacan los resultados obtenidos por diferentes investigadores para explicar dicha
adaptabilidad.
Finalmente, aunque son muchas las aplicaciones biotecnológicas de las
cianobacterias, se destaca su tolerancia e incluso la utilización de algunos
contaminantes, como el petróleo, lo que ha incrementado el interés sobre estos
microorganismos en su posible papel biorreparador de los ecosistemas naturales.
1. Ecofisiología de las Cianobacterias:
Las cianobacterias, son bacterias fototróficas oxigénicas que utilizan la luz como
fuente de energía, el CO2 como fuente de carbono y el agua como fuente de poder
reductor. Es importante mencionar que parte del éxito del desarrollo de estos
microorganismos en diferentes tipos de hábitats, tanto acuáticos como terrestres, se debe
a su larga historia evolutiva (Margulis et al. 1986, García-Pichel et al. 1996). Las
cianobacterias son capaces de colonizar ambientes muy distintos y en muchos casos
muy limitantes para la vida como son los tapetes microbianos, ecosistemas
estratificados bentónicos de pocos milímetros de grosor. Los tapetes microbianos
salinos ubicados en zonas litorales protegidas desarrollan poblaciones de
microorganismos que se disponen en capas de distintos colores en función de los
parámetros ambientales, principalmente luz, oxígeno y sulfhídrico. Los tapetes
microbianos y las cianobacterias que los constituyen se han tomado como modelo para
el estudio de los estromatolitos, que son estructuras órgano-sedimentarias, ampliamente

4
Introducción
distribuidas en la tierra durante el Arqueozoico y el Proterozoico (Grotzinger y Knoll,
1999) (Figura 1). Se han encontrado semejanzas entre los microfósiles preservados y las
cianobacterias actuales de los tapetes microbianos y también a nivel geoquímico y
geológico (Schopf J. W., 2000) (Figura 2).
Cianobacterias
Figura 1: División geológica de la tierra desde sus orígenes y localización de las cianobacterias. http:// homepage .mac.com/uriarte/tcianobaterias.html
Figura 2: Estromatolitos de Shark Bay (Australia). http:// homepage .mac.com/uriarte/testromatolitos.html

5
Introducción
La historia de la tierra ha estado condicionada por los eventos geoquímicos
volcánicos y tectónicos, el impacto de la temperatura global y de la irradiación
(incluyendo la luz ultravioleta), la desecación, la disponibilidad de nutrientes y la
composición iónica (salinidad). Actualmente estas condiciones se dan en hábitats muy
extremos para la vida y en los que normalmente se encuentran cianobacterias. Éstas son
capaces de colonizar ambientes marinos costeros (Mir et al. 1991, Caumette et al. 1994,
Esteve et al. 1994, Benlloch et al. 2002), ambientes hipersalinos (Giani et al. 1989,
Demergasso et al. 2003, Fourçans et al. 2004), fuentes termales (Ferris et al., 1996) y
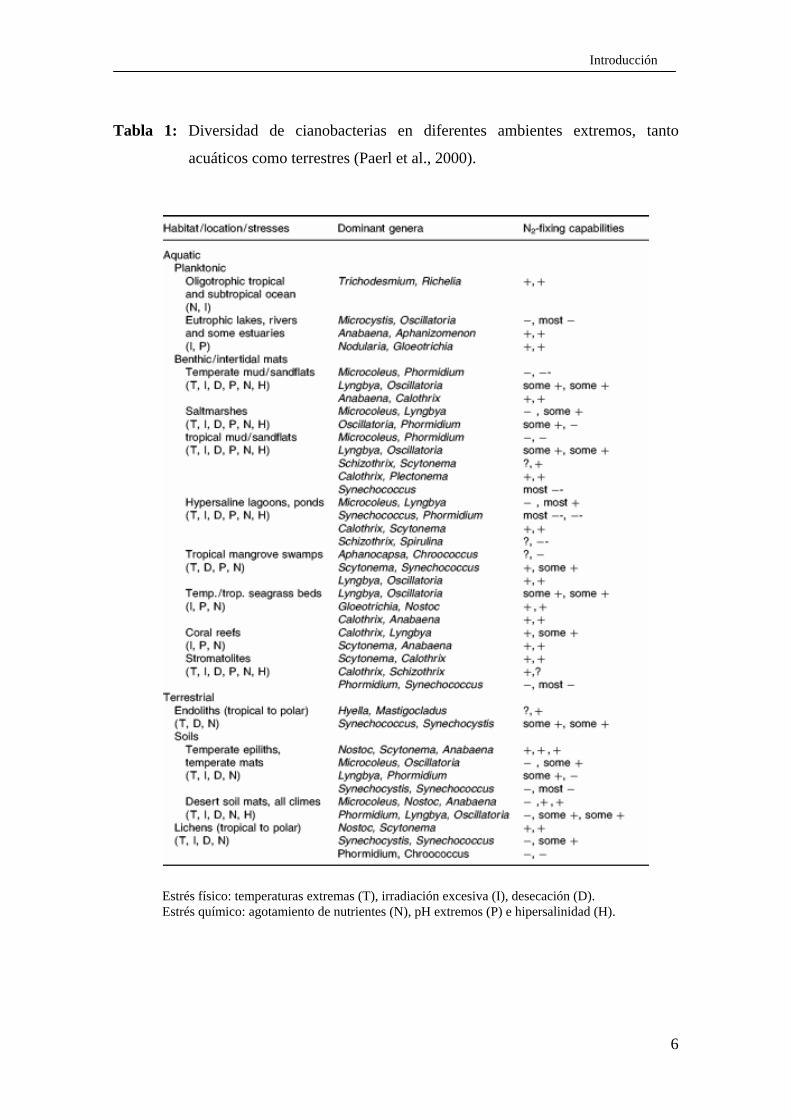
lagos alcalinos (Brock T. D., 1978) (Tabla 1).
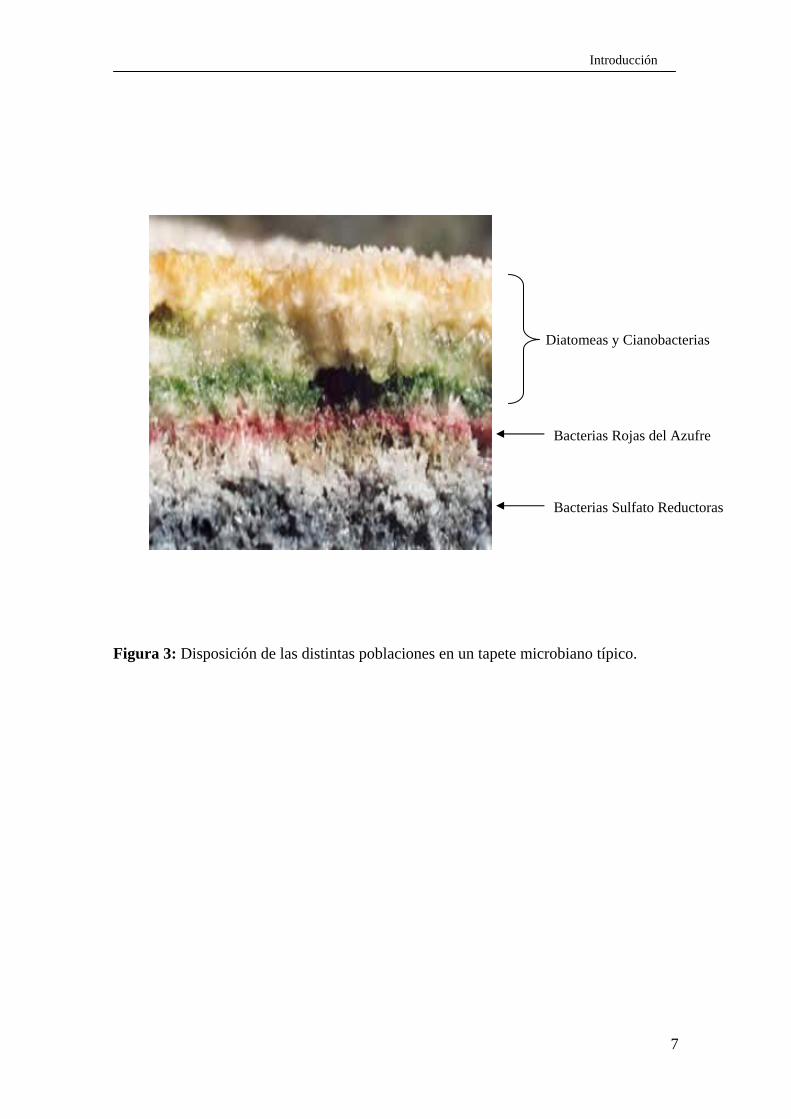
En ambientes litorales, salinos e hipersalinos y normalmente protegidos por una
barrera de dunas se encuentran los tapetes microbianos. Éstos, como se ha dicho con
anterioridad, están constituidos por comunidades bentónicas verticalmente estratificadas
en capas. De manera general la disposición de las distintas poblaciones (desde la
superficie hasta la capa más profunda) es la siguiente (Figura 3): diatomeas (capa
amarilla-parduzca), cianobacterias (capa verde), bacterias rojas del azufre (capa rojiza),
bacterias verdes del azufre, que no suelen formar una lámina de color evidente, aunque
se han detectado debajo de la capa roja en cultivos de enriquecimiento. Finalmente y
por debajo de la zona pigmentada se encuentra un sedimento negruzco debido a la
actividad de las bacterias sulfato reductoras, que producen H2S al utilizar el sulfato
como aceptor final de electrones. Los sulfuros de hierro que forman al reaccionar el
sulfhídrico con el hierro son principalmente los responsables de dicha coloración.
6
Introducción
Tabla 1: Diversidad de cianobacterias en diferentes ambientes extremos, tanto
acuáticos como terrestres (Paerl et al., 2000).
Estrés físico: temperaturas extremas (T), irradiación excesiva (I), desecación (D). Estrés químico: agotamiento de nutrientes (N), pH extremos (P) e hipersalinidad (H).
7
Introducción
Figura 3: Disposición de las distintas poblaciones en un tapete microbiano típico.
Diatomeas y Cianobacterias
Bacterias Rojas del Azufre
Bacterias Sulfato Reductoras
8
Introducción
En todos estos ambientes las cianobacterias suelen realizar una fotosíntesis
oxigénica en la capa verde, siendo la clorofila a su principal pigmento fotosintético. Es
importante mencionar que muchas veces la capa verde, que contiene a las
cianobacterias, se encuentra recubierta por una capa de arena o una capa de mucílago
orgánico, el cual contiene un pigmento llamado escitonemina, de color marrón
amarillento. Este pigmento está producido por las cianobacterias que están expuestas a
elevadas intensidades de luz y que por lo tanto tiene un papel protector frente la
excesiva irradiación ultravioleta (García Pichel y Castenholz, 1991). La escitonemina se
encuentra principalmente en las vainas exopolisacáridas y se caracteriza por ser
altamente recalcitrante, por lo que se la puede encontrar en las vainas mucilaginosas
vacías, eliminadas por las cianobacterias. Otros pigmentos accesorios son las
ficobilinas: la ficocianina, que es de color azul y que junto al verde de la clorofila a son
los pigmentos responsables del color azul verdoso de estos microorganismos (también
conocidos como algas verde-azuladas) y la ficoeritrina, una ficobilina roja que da un
color rojizo a las especies que la producen. Las ficobilinas se localizan dentro de los
tilacoides, estructuras intracelulares del aparato fotosintético de las cianobacterias.
Se ha demostrado que algunas cianobacterias también pueden realizar una
fotosíntesis anoxigénica. Se pueden distinguir dos grupos de cianobacterias con respecto
a la capacidad de realizar fotosíntesis anoxigénica. Un grupo se caracteriza porque la
fotosíntesis oxigénica se inhibe a bajas concentraciones de sulfhídrico, induciéndose en
este caso la fotosíntesis anoxigénica. El otro grupo presenta ambos tipos de fotosíntesis
que pueden llevarse a cabo al mismo tiempo; a bajas concentraciones de sulfhídrico la
fotosíntesis oxigénica es la más importante (Cohen y Rosenberg 1989, Canfield y Des
Marais 1991, Moezelaar et al. 1996). En ambos grupos de cianobacterias, la fotosíntesis
anoxigénica es inducida y depende exclusivamente de la concentración de sulfhídrico y
del espectro de luz que éstas reciben. Los microorganismos que han demostrado tener la
capacidad de realizar los dos tipos de fotosíntesis, como es el caso de Microcoleus
chthonoplastes, tienen una gran ventaja ecológica, puesto que en aquellos ambientes en
los que las concentraciones de sulfhídrico fluctúen, pueden colonizar un mayor espacio.
Diferentes estudios indican que las cianobacterias poseen en ocasiones metabolismo
alternativos ya que han sido encontradas en capas anóxicas, en las que probablemente
realizan un metabolismo fermentativo en la oscuridad.

9
Introducción
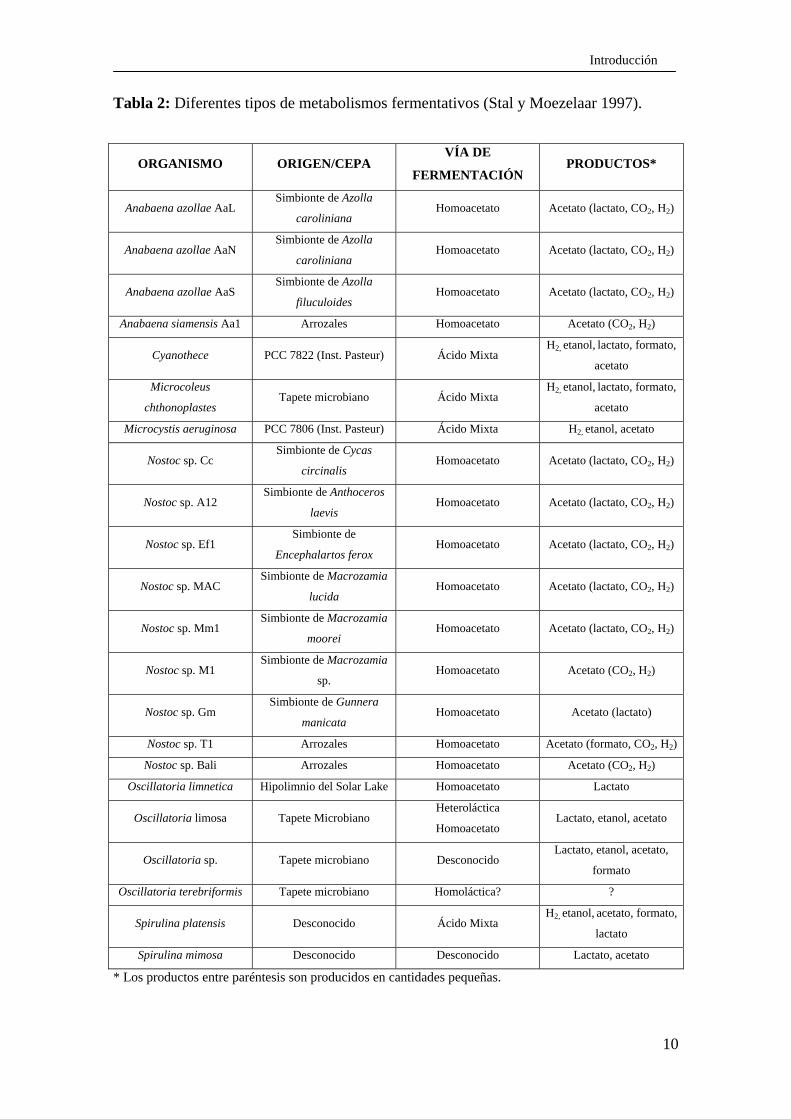
Esta capacidad metabólica fue descrita en Oscillatoria limnetica en los tapetes
microbianos de Solar Lake (Sinaí) (Oren y Shilo 1979). Esta cianobacteria filamentosa
se caracteriza porque fermenta el glicógeno produciendo lactato. Stal y Moezelaar
(1997) realizaron una serie de estudios que demuestran que existen diferentes
posibilidades de metabolismo fermentativo en las cianobacterias (Tabla 2).
10
Introducción
Tabla 2: Diferentes tipos de metabolismos fermentativos (Stal y Moezelaar 1997).
* Los productos entre paréntesis son producidos en cantidades pequeñas.
ORGANISMO ORIGEN/CEPA VÍA DE
FERMENTACIÓN PRODUCTOS*
Anabaena azollae AaL Simbionte de Azolla
caroliniana Homoacetato Acetato (lactato, CO2, H2)
Anabaena azollae AaN Simbionte de Azolla
caroliniana Homoacetato Acetato (lactato, CO2, H2)
Anabaena azollae AaS Simbionte de Azolla
filuculoides Homoacetato Acetato (lactato, CO2, H2)
Anabaena siamensis Aa1 Arrozales Homoacetato Acetato (CO2, H2)
Cyanothece PCC 7822 (Inst. Pasteur) Ácido Mixta H2, etanol, lactato, formato,
acetato
Microcoleus
chthonoplastes Tapete microbiano Ácido Mixta
H2, etanol, lactato, formato,
acetato
Microcystis aeruginosa PCC 7806 (Inst. Pasteur) Ácido Mixta H2, etanol, acetato
Nostoc sp. Cc Simbionte de Cycas
circinalis Homoacetato Acetato (lactato, CO2, H2)
Nostoc sp. A12 Simbionte de Anthoceros
laevis Homoacetato Acetato (lactato, CO2, H2)
Nostoc sp. Ef1 Simbionte de
Encephalartos ferox Homoacetato Acetato (lactato, CO2, H2)
Nostoc sp. MAC Simbionte de Macrozamia
lucida Homoacetato Acetato (lactato, CO2, H2)
Nostoc sp. Mm1 Simbionte de Macrozamia
moorei Homoacetato Acetato (lactato, CO2, H2)
Nostoc sp. M1 Simbionte de Macrozamia
sp. Homoacetato Acetato (CO2, H2)
Nostoc sp. Gm Simbionte de Gunnera
manicata Homoacetato Acetato (lactato)
Nostoc sp. T1 Arrozales Homoacetato Acetato (formato, CO2, H2)
Nostoc sp. Bali Arrozales Homoacetato Acetato (CO2, H2)
Oscillatoria limnetica Hipolimnio del Solar Lake Homoacetato Lactato
Oscillatoria limosa Tapete Microbiano Heteroláctica
Homoacetato Lactato, etanol, acetato
Oscillatoria sp. Tapete microbiano Desconocido Lactato, etanol, acetato,
formato
Oscillatoria terebriformis Tapete microbiano Homoláctica? ?
Spirulina platensis Desconocido Ácido Mixta H2, etanol, acetato, formato,
lactato
Spirulina mimosa Desconocido Desconocido Lactato, acetato

11
Introducción
Con respecto a la capacidad de las cianobacterias de fijar nitrógeno, se ha
estudiado que muchas de ellas pueden fijarlo (Bergman et al. 1997). Además algunos
miembros pueden hacerlo (Tabla 1), usando células especiales llamadas heterocistos.
Así mismo, son capaces de producir un compuesto nitrogenado conocido como
cianoficina, que está formada por un polímero de arginina y ácido aspártico. La
cianoficina, puede representar hasta el 8% del peso seco celular y es un reservorio de
nitrógeno. Las cianobacterias son capaces de utilizar el N2 como única fuente de
nitrógeno para su crecimiento. Estos microorganismos se pueden dividir en tres grupos,
dependiendo de su capacidad para fijar nitrógeno: Grupo I, corresponde a los
microorganismos filamentosos que presentan heterocistos. La fijación del nitrógeno, en
este caso se lleva a cabo gracias a la presencia de una enzima compleja llamada
nitrogenasa. Grupo II, está comprendida por cianobacterias filamentosas y unicelulares
y que no presentan heterocistos, siendo capaces de llevar a cabo la fijación del N2 en
condiciones anóxicas, en diversos ambientes incluyendo los tapetes microbianos. Las
condiciones anóxicas se dan cuando existen elevadas concentraciones de sulfhídrico, y
que por lo tanto inhibe la fotosíntesis oxigénica. Se ha descrito en este caso que, las
cianobacterias pueden crecer diazotróficamente cuando el sulfuro de hidrógeno este
presente en los tapetes microbianos (Villbrandt y Stal, 1996). Grupo III, comprende a
las cianobacterias filamentosas y unicelulares que no tienen heterocistos y que fijan
nitrógeno atmosférico aeróbicamente.
Por otra parte muchas de las cianobacterias estudiadas poseen la capacidad de
producir exopolisacáridos (Decho A. W., 1990). Las estructuras mucilaginosas,
excreciones extracelulares de sustancias poliméricas (EPS), que algunas cianobacterias
poseen, aglutinan las partículas del suelo, retienen la humedad y la protegen de factores
negativos externos. Las cianobacterias filamentosas son las que principalmente forman
una red, que envolviéndose de una matriz polisacárida consolidan el sedimento
(d’Amelio et al. 1987). Los EPS, se caracterizan además por ser un gran reservorio de
agua, ya que cuando éstos están completamente hidratados, retienen hasta el 99%.
Finalmente, los EPS también evitan la difusión de diferentes metales tóxicos; cuya
presencia genera a veces una excesiva producción de sustancias poliméricas (de
Philippis et al. 1998).
12
Introducción
Es importante mencionar que se conoce poco acerca de los EPS en los tapetes
microbianos. Además, algunos polisacáridos parecen ser recalcitrantes a la degradación
microbiológica, mientras que otros no lo son.
2. Taxonomía y Diversidad de las Cianobacterias:
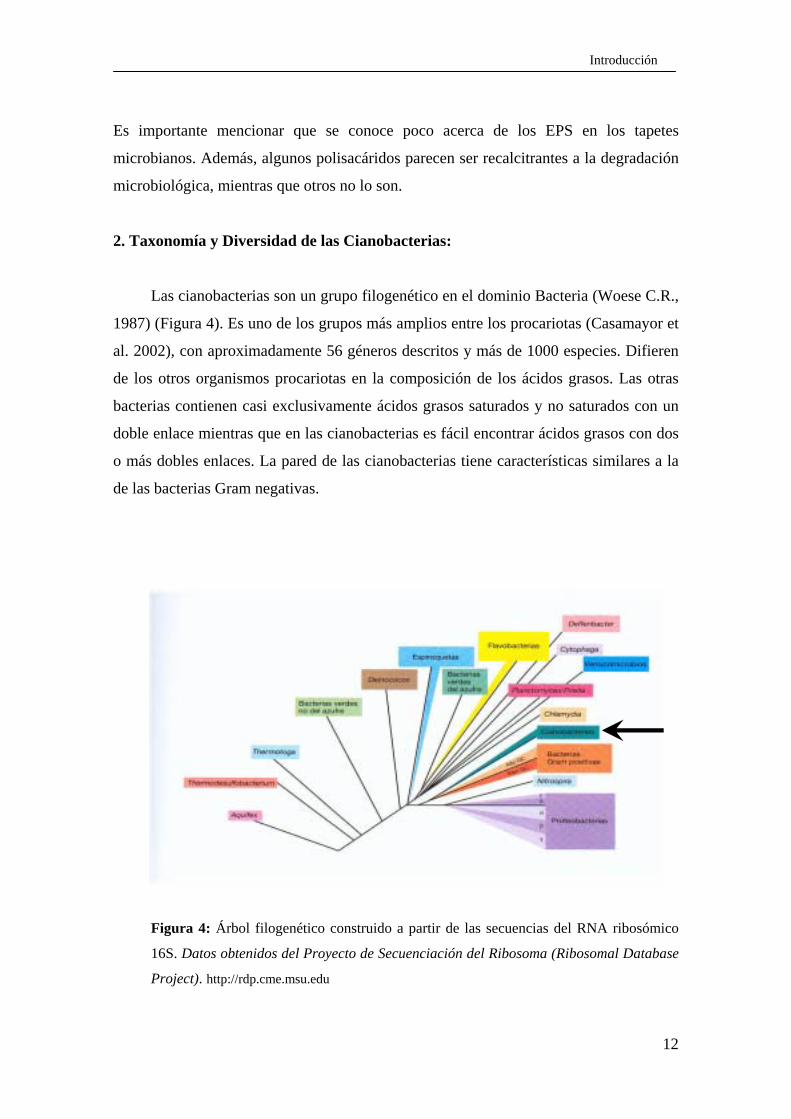
Las cianobacterias son un grupo filogenético en el dominio Bacteria (Woese C.R.,
1987) (Figura 4). Es uno de los grupos más amplios entre los procariotas (Casamayor et
al. 2002), con aproximadamente 56 géneros descritos y más de 1000 especies. Difieren
de los otros organismos procariotas en la composición de los ácidos grasos. Las otras
bacterias contienen casi exclusivamente ácidos grasos saturados y no saturados con un
doble enlace mientras que en las cianobacterias es fácil encontrar ácidos grasos con dos
o más dobles enlaces. La pared de las cianobacterias tiene características similares a la
de las bacterias Gram negativas.
Figura 4: Árbol filogenético construido a partir de las secuencias del RNA ribosómico
16S. Datos obtenidos del Proyecto de Secuenciación del Ribosoma (Ribosomal Database
Project). http://rdp.cme.msu.edu

13
Introducción
Estos microorganismos, tal como se ha expuesto en el apartado anterior, son un
grupo muy diverso tanto morfológica como fisiológicamente. Castenholz et al. (2001)
las clasifica en cinco órdenes: A) Orden Chroococcales, formado por microorganismos
unicelulares que se reproducen por fisión binaria o por gemación, la división puede
ocurrir en uno, dos o tres planos. El diámetro de la célula varía entre 0.5 y 30 µm y
suelen presentar una vaina que envuelve grupos de células. B) Orden Pleurocapsales,
microorganismos que se reproducen por fisión múltiple, cuyas células se caracterizan
por su diversidad en formas y tamaños. C) Orden Oscillatoriales, bacterias filamentosas
que presentan una división celular por fisión binaria y en un solo plano,
reproduciéndose por fragmentación del tricoma (cadena de células sin la envuelta
mucopolisacárida). Las células presentan un diámetro variable, entre 0.5 y 100 µm; y
muestran dos tipos de morfología: alargada (célula más larga que ancha) y forma de
disco (célula más ancha que larga). Las células de la especie Oscillatoria princeps son
las mayores conocidas dentro de las cianobacterias. D) Orden Nostocales, son
organismos filamentosos, que se dividen exclusivamente por fisión binaria; el diámetro
de su tricoma varía entre 2 y 15 µm, además se caracterizan principalmente por
presentar células diferenciadas, unas llamadas heterocistos (en las que se fija el
nitrógeno), y otras acinetos (que las hace resistentes a los cambios de temperatura) y
finalmente, E) Orden Stigonematales, las células de estos filamentos se dividen por
fisión binaria en múltiples planos, lo que origina que los filamentos presenten
ramificaciones a lo largo de su tricoma.
El conocimiento de la diversidad de las cianobacterias, que habitan los
ecosistemas anteriormente mencionados, se ha realizado en gran parte gracias a la
aplicación de técnicas clásicas de cultivo y aislamiento; de análisis microscópico y del
contenido específico de pigmentos a partir de cultivos aislados de muestras naturales.
No obstante en los últimos años, se ha ampliado mucho el conocimiento sobre su
biodiversidad, aplicando las técnicas moleculares y las de microscopía de alta
resolución. Las primeras se han utilizado para hacer estudios filogenéticos de estos
microorganismos (García-Pichel et al. 2001).

14
Introducción
No obstante la aplicación de técnicas moleculares (en tapetes microbianos) para la
identificación de cianobacterias tiene también su dificultad, puesto que los EPS, que
muchas de ellas producen, dificultan en ocasiones la extracción de los ácidos nucleicos
(López-Cortés et al. 2001).
Entre las técnicas microscópicas de alta resolución, se han utilizado con el mismo
objetivo la microscopía electrónica (TEM y SEM) y la microscopía láser confocal
(CLSM). El TEM permite visualizar la ultraestructura de estos microorganismos;
mientras que el SEM es útil para caracterizar los diferentes morfotipos permitiendo
estudiar tanto la distribución vertical de los microorganismos en muestras intactas como
las interacciones entre ellos y las partículas de sedimento (Mir y Esteve, 1992). Es
importante mencionar que estas técnicas de microscopía electrónica necesitan
exhaustivos protocolos para la preparación de las muestras (Esteve et al. 1992).
También la microscopía de fluorescencia convencional se ha utilizado con éxito en
muestras procedentes de ambientes acuáticos; pero en tapetes microbianos, donde
abundan las cianobacterias filamentosas en interacción con el sedimento, dicha
microscopía ofrece una menor resolución.
Nuestro grupo de trabajo aplicó el CLSM en tapetes microbianos (Solé et al. 1998) para
obviar las dificultades anteriormente expuestas. El CLSM permite que las
cianobacterias puedan ser observadas “in vivo”. Debido a que estos microorganismos
emiten fluorescencia natural, por poseer pigmentos fotosintéticos, se evita la aplicación
de tinciones específicas. Este microscopio permite obtener diferentes secciones ópticas
con elevado poder de resolución, a partir de una muestra gruesa de tapete. Es por ello,
que hoy en día el uso del CLSM, proporciona nueva y valiosa información referente a la
estructura y composición de los tapetes microbianos, ayudando en la caracterización e
identificación de los microorganismos (Johnson I. 1999, Solé et al. 2001). También su
aplicación proporciona importantes resultados en la determinación de la biomasa de las
cianobacterias (Solé et al. 2003) pudiéndose hacer un seguimiento individualizado de
cada una de ellas en profundidad dentro de una muestra de tapete.
Actualmente y gracias a la aplicación, sobre stacks de imágenes (ver material y
métodos), del programa Image J de análisis de imagen, pueden analizarse además un
número elevado de muestras en muy poco tiempo, lo que proporciona un mayor número
de datos (Solé et al., enviado a Journal of Microscopy).
15
Introducción
3. Las Cianobacterias y su Papel en la Degradación del Petróleo:
En la actualidad se ha incrementado el interés por el estudio de las cianobacterias
con respecto al papel que pueden desempeñar en la posible biorreparación de ambientes
contaminados, en especial por petróleo, ya que los tapetes microbianos de las costas
litorales afectadas, se ven recubiertos al poco tiempo por las cianobacterias.
El petróleo es una sustancia aceitosa de color oscuro formada básicamente por: Carbono
(84-87%), Hidrógeno (11-14%), Azufre (0-2%) y Nitrógeno (0.2%), generando tres
fracciones principales: los hidrocarburos alifático aromáticos, las resinas o compuestos
polares y los asfaltenos (García de Oteyza T. 2003).
Los hidrocarburos pueden estar en estado líquido o en estado gaseoso. En el primer caso
es un aceite al que se le denomina crudo. En el segundo caso se le conoce como gas
natural.
El origen del petróleo y del gas natural es de tipo orgánico y sedimentario, por lo
que el petróleo es el resultado de un complejo proceso físico-químico producido en el
interior de la tierra, y donde debido a la alta presión y temperatura, se produce la
descomposición de enormes cantidades de materia orgánica en aceite y gas. Aunque es
mucha la información que se tiene sobre la capacidad de diferentes microorganismos
para degradar el petróleo (Mejharaj et al. 2000, Medina et al. 2005, Menezes et al.
2005), en realidad se conoce muy poco sobre el papel de las cianobacterias en la
degradación de este compuesto orgánico.
En los últimos años ha crecido el interés por estos microorganismos debido a los
frecuentes desastres ecológicos, que producen los vertidos de petróleo desde los buques
de transporte en las zonas litorales. Los mencionados vertidos llegan en muchas
ocasiones a las costas litorales y contaminan los tapetes microbianos formados
mayoritariamente por cianobacterias. Diferentes estudios demuestran la capacidad de
persistencia de las cianobacterias en tapetes microbianos contaminados (Al-Hasan et al.
1994, 1998, 2001). También se han realizado experimentos de laboratorio con cultivos
axénicos de algunas cianobacterias, como Oscillatoria sp. y Phormidium sp. (Cohen Y.
2002) analizando su papel en la degradación del petróleo pero los datos en forma
generalizada no son muy concluyentes.

16
Introducción
Microcoleus sp. es la cianobacteria más abundante en la mayoría de los tapetes
microbianos analizados en el presente trabajo. Aún cuando algunos de ellos han sufrido
en los últimos años contaminación por petróleo, su papel en la utilización del crudo ha
sido muy cuestionado. Una de las principales cuestiones planteadas es si la degradación
finalmente observada, es debido a la actividad de esta cianobacteria, o a la de los
microorganismos heterotróficos que frecuentemente se asocian a Microcoleus sp.
El objetivo global del presente trabajo, ha sido analizar el efecto que el petróleo
puede causar en las poblaciones de microorganismos fototróficos oxigénicos. Se han
considerado principalmente los tapetes microbianos por tratarse de zonas litorales
frecuentemente expuestas a la contaminación por el crudo.
Para ello se ha analizado la diversidad y los perfiles de biomasa de las cianobacterias en
diferentes tapetes microbianos de Europa sometidos a diferente grado de contaminación
por petróleo. Se han hecho ensayos similares en sistemas artificiales como en los
mesocosmos y finalmente se ha aislado y caracterizado un consorcio de
microorganismos con capacidad para degradar petróleo, en este caso se ha ensayado
especialmente el Maya, un petróleo rico en azufre y por lo tanto muy tóxico.
17
Introducción
Estructura de la Tesis
La investigación realizada forma parte del proyecto europeo MATBIOPOL
“Role of Microbial Mats in Bioremediations of hydrocarbon Polluted coastal zones”.
Todo ello queda reflejado en los capítulos de la tesis que a continuación se expone.
Capítulo I: En este capítulo se introducen de forma general las cianobacterias,
considerando su importancia tanto evolutiva como ecofisiológica. Se
hace énfasis en su papel colonizador de ambientes contaminados por
petróleo y se centran los objetivos de la tesis.
Capítulo II: Se describe la metodología utilizada. Cuando se han requerido poner a
punto métodos específicos no estandarizados, éstos se describen
formando parte de los resultados, como es el caso del aislamiento de
Microcoleus consorcio, descrito en el capítulo V.
Capítulo III: Entre los tapetes microbianos naturales no contaminados estudiados, los
que presentan una estructura estratificada más estable son los del delta
del Ebro y los de Salins-de-Giraud. En el primer caso, la diversidad y los
cambios poblacionales de las cianobacterias mediante CLSM ya han sido
previamente estudiados. En el presente trabajo se ha realizado el análisis
de la diversidad, la abundancia relativa en profundidad de las
cianobacterias y los perfiles de biomasa de Microcoleus chthonoplastes
de los tapetes microbianos de Salins-de-Giraud. Este estudio se ha hecho
extensivo a su distribución, en un ciclo día-noche y se han correlacionado
los resultados con los obtenidos (por otros autores durante el mismo
muestreo) para las bacterias fototróficas anoxigénicas.
Capítulo IV: Se identifican las cianobacterias de todos los ambientes estudiados tanto
naturales como artificiales. Se evalúan los cambios en la diversidad y en
los perfiles de biomasa que experimentan las poblaciones de dichos

18
Introducción
microorganismos, cuando se encuentran expuestos a contaminación por
petróleo.
Capítulo V: En el presente trabajo se ha aislado por primera vez un consorcio de
Microcoleus con capacidad para degradar el petróleo.
En este apartado se describen las técnicas para su aislamiento y cultivo.
También se identifican los microorganismos que forman el consorcio
mediante técnicas microscópicas y moleculares.
Finalmente se exponen las conclusiones generales del trabajo a partir de los resultados
expuestos en cada uno de los apartados.
CAPÍTULO II: MATERIAL Y
MÉTODOS
2.1. Caracterización y Muestreo de Tapetes
Microbianos Naturales y Artificiales
2.2. Cultivos Celulares Microcoleus consorcio
2.2.1. Cultivos de Enriquecimiento
2.2.2. Aislamiento de Microcoleus
consorcio
2.2.3. Identificación
A. Técnicas Microscópicas
B. Técnicas Moleculares
C. Técnicas de Análisis Químicos

20
Material y Métodos
Material y Métodos:
En este apartado se describen las zonas de muestreo y los métodos utilizados
para el procesamiento de las muestras obtenidas de los tapetes microbianos
contaminados y no contaminados por petróleo.
2.1. Caracterización y Muestreo de Tapetes Microbianos Naturales y Artificiales
Las muestras de los ambientes naturales y artificiales se tomaron y procesaron
de acuerdo a los métodos que se exponen a continuación.
2.1.1. Descripción de los ecosistemas naturales estudiados
La descripción de los tapetes microbianos y sus características
ambientales se describen en los siguientes apartados:
La Camarga (Francia)
Se han realizado muestreos en dos tapetes microbianos de esta zona,
Salins-de-Giraud, no contaminado por petróleo y Etang de Bêrre,
contaminado por petróleo.
Los tapetes microbianos de Salins-de-Giraud (Figura 5A) están
situados a la derecha del río Rhône. El lugar estudiado es una laguna
hipersalina, donde la salinidad oscila entre 70 y 150‰. Las muestras
fueron obtenidas en Mayo del 2000 y en Junio del 2001.
Etang de Bêrre (Figura 5B), es una laguna que se encuentra a la
izquierda del río Rhône y cuya salinidad varía entre 15 y 20‰. Esta
laguna recibe vertidos de una refinería y su sedimento contiene una
cantidad muy elevada de hidrocarburos, por lo que presenta un alto grado
de contaminación desde hace varios años. Los muestreos se realizaron en
Mayo del 2000.
21
Material y Métodos
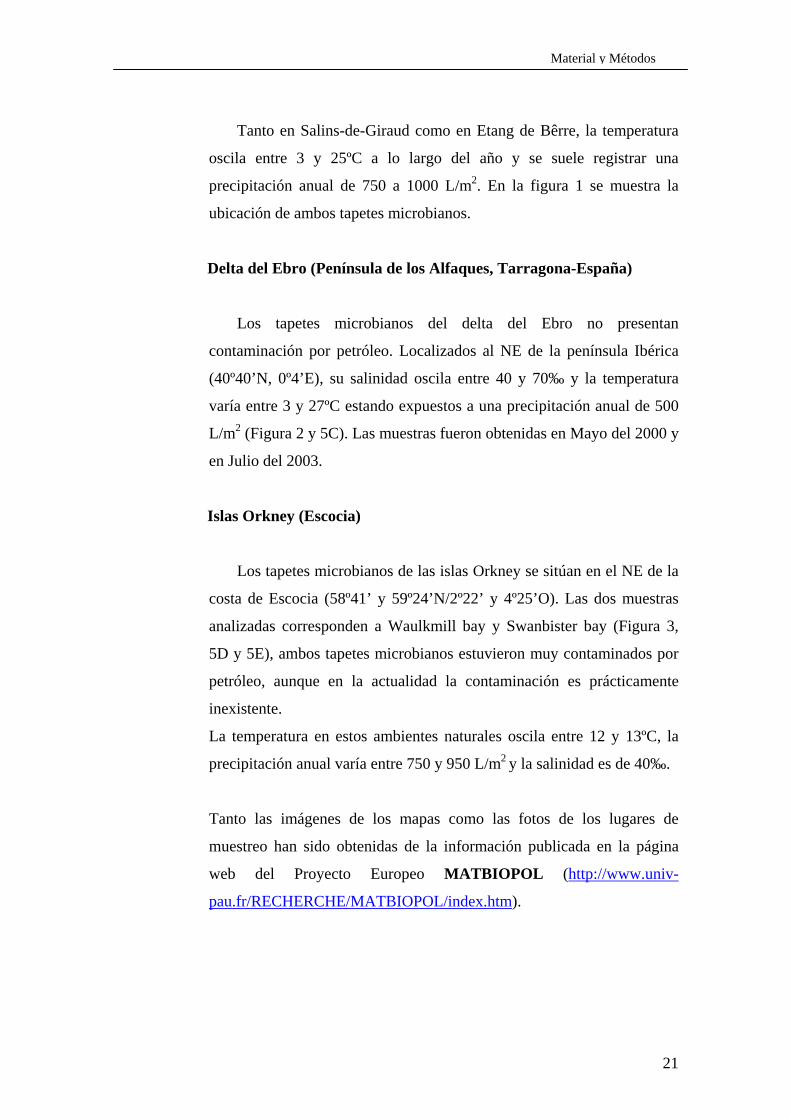
Tanto en Salins-de-Giraud como en Etang de Bêrre, la temperatura
oscila entre 3 y 25ºC a lo largo del año y se suele registrar una
precipitación anual de 750 a 1000 L/m2. En la figura 1 se muestra la
ubicación de ambos tapetes microbianos.
Delta del Ebro (Península de los Alfaques, Tarragona-España)
Los tapetes microbianos del delta del Ebro no presentan
contaminación por petróleo. Localizados al NE de la península Ibérica
(40º40’N, 0º4’E), su salinidad oscila entre 40 y 70‰ y la temperatura
varía entre 3 y 27ºC estando expuestos a una precipitación anual de 500
L/m2 (Figura 2 y 5C). Las muestras fueron obtenidas en Mayo del 2000 y
en Julio del 2003.
Islas Orkney (Escocia)
Los tapetes microbianos de las islas Orkney se sitúan en el NE de la
costa de Escocia (58º41’ y 59º24’N/2º22’ y 4º25’O). Las dos muestras
analizadas corresponden a Waulkmill bay y Swanbister bay (Figura 3,
5D y 5E), ambos tapetes microbianos estuvieron muy contaminados por
petróleo, aunque en la actualidad la contaminación es prácticamente
inexistente.
La temperatura en estos ambientes naturales oscila entre 12 y 13ºC, la
precipitación anual varía entre 750 y 950 L/m2 y la salinidad es de 40‰.
Tanto las imágenes de los mapas como las fotos de los lugares de
muestreo han sido obtenidas de la información publicada en la página
web del Proyecto Europeo MATBIOPOL (http://www.univ-
pau.fr/RECHERCHE/MATBIOPOL/index.htm).

22
Material y Métodos
Colònia de Sant Jordi:
Los tapetes microbianos de la Colònia de Sant Jordi no se encuentran
contaminados por petróleo. Están localizados en el ángulo sur de
Mallorca (2º39’E y a 39º34’N) (Figura 4 y 5F), y la temperatura oscila
entre 17 y 22ºC, con una precipitación anual de 450 L/m2. Las muestras
analizadas se obtuvieron en Julio del 2001, éstas no formaban parte del
proyecto anteriormente mencionado, pero aportan nuevos datos de
ambientes no contaminados y por este motivo se han incluido en el
presente trabajo.

23
Material y Métodos
Figura 1. Mapa de la Camarga. Tapetes Microbianos de Salins-de-Giraud y Etang
de Bêrre.
de Salins-de-Giraud
Etang de Bêrre

24
Material y Métodos
Figura 2. Mapa del delta del Ebro. Localización de los tapetes microbianos.

25
Material y Métodos
Figura 3. Mapa de las Islas Orkney. Tapetes Microbianos de Swanbister bay y
de Waulkmill bay.

26
Material y Métodos
Figura 4. Localización de los tapetes microbianos de la Colònia de Sant Jordi.
Colònia de Sant Jordi

27
Material y Métodos
Figura 5. Tapetes Microbianos A. Salins-de-Giraud (La Camarga-Francia) B. Etang de Bêrre (La Camarga-Francia) C. delta del Ebro (Tarragona-España) D. Swanbister Bay (Islas Orkney-Escocia) E. Waulkmill Bay (Islas Orkney-Escocia) F. Colònia de Sant Jordi (Mallorca- España)
A B
C D
E F

28
Material y Métodos
2.1.2. Descripción de los ecosistemas artificiales
Estos ecosistemas se prepararon tanto a pequeña (microcosmos) como a
gran escala (mesocosmos). La descripción de estos ambientes se detalla a
continuación:
A. Microcosmos
Los microcosmos son sistemas experimentales de laboratorio en los
que se simulan condiciones ambientales naturales. En el presente trabajo
se han utilizado para el aislamiento de cianobacterias con capacidad para
degradar petróleo.
El inóculo que se utilizó inicialmente en la preparación de los
microcosmos procedía de los tapetes microbianos del delta del Ebro, en la
zona de las Salinas de la Trinidad.
Se prepararon dos tipos de microcosmos: Uno de ellos era un
microcosmo sin contaminar (control) y el otro contaminado por petróleo
(Figura 6). Para su preparación un inóculo de 125 g de tapete microbiano
se homogenizó con 100 ml de solución salina y 13.5 dm3 de agua de mar
(de la misma zona de muestreo). Los inóculos obtenidos se depositaron,
para ambos casos, en cajas de polipropileno (33 x 41 x 25 cm) y se
incubaron a 25ºC y a una intensidad de luz de 150µEm-2s-1 (Llirós et al.
2003).
Del microcosmos contaminado se extrajeron muestras para la
preparación de los cultivos de enriquecimiento de las cianobacterias.
Figura 6: Microcosmos. Cortesía Marc Llirós.
29
Material y Métodos
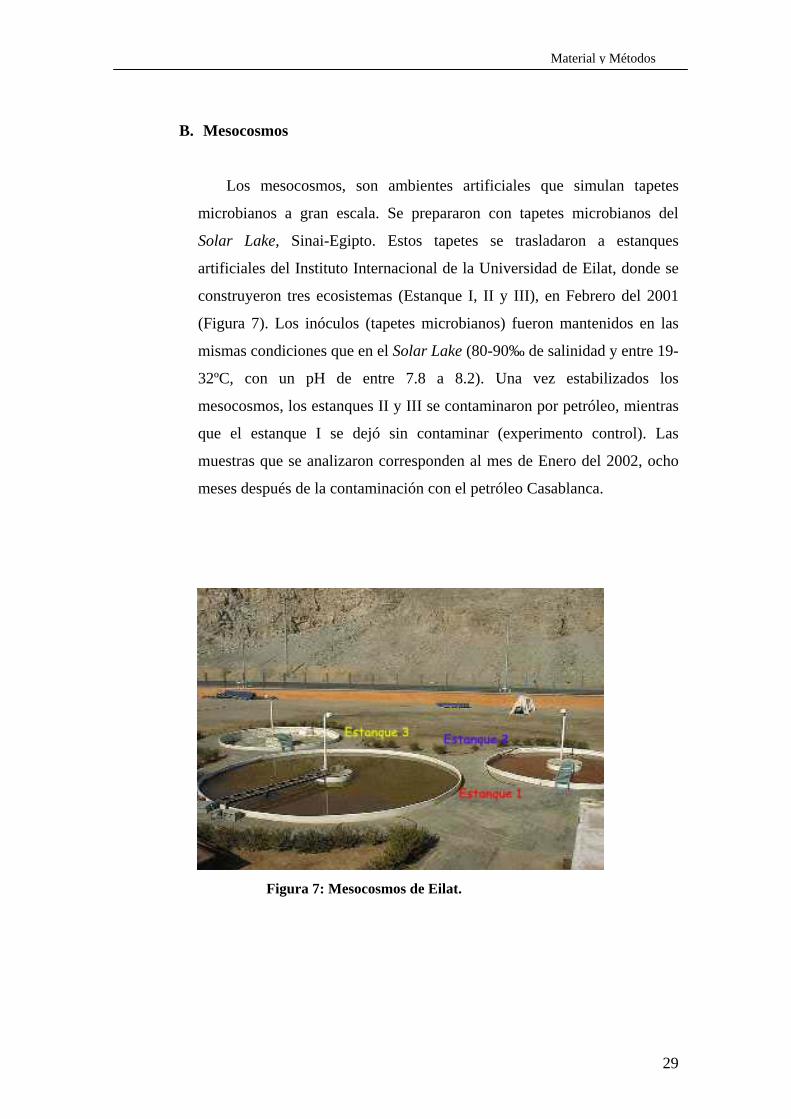
B. Mesocosmos
Los mesocosmos, son ambientes artificiales que simulan tapetes
microbianos a gran escala. Se prepararon con tapetes microbianos del
Solar Lake, Sinai-Egipto. Estos tapetes se trasladaron a estanques
artificiales del Instituto Internacional de la Universidad de Eilat, donde se
construyeron tres ecosistemas (Estanque I, II y III), en Febrero del 2001
(Figura 7). Los inóculos (tapetes microbianos) fueron mantenidos en las
mismas condiciones que en el Solar Lake (80-90‰ de salinidad y entre 19-
32ºC, con un pH de entre 7.8 a 8.2). Una vez estabilizados los
mesocosmos, los estanques II y III se contaminaron por petróleo, mientras
que el estanque I se dejó sin contaminar (experimento control). Las
muestras que se analizaron corresponden al mes de Enero del 2002, ocho
meses después de la contaminación con el petróleo Casablanca.
Figura 7: Mesocosmos de Eilat.
30
Material y Métodos
2.1.3. Procesamiento de las muestras
Con las muestras correspondientes a los estanques mencionados, se
realizó el mismo tipo de estudio que en los ambientes naturales. No obstante,
dado el tiempo de transporte, las muestras se fijaron con glutaraldheído al
2,5%. Posteriormente se lavaron repetidas veces con tampón fosfato, para
eliminar los restos del fijador y se conservaron en nevera a 4ºC hasta su
posterior procesamiento.
2.1.4. Microscopía Láser Confocal (CLSM)
El análisis de las muestras tanto para la identificación como para la
determinación de la biomasa total se realizó por Microscopía Láser Confocal
(Leica TCS 4d, Heildeberg,Alemania). Además la biomasa individual de cada
cianobacteria se realizó en los ambientes contaminados por petróleo (Etang
de Bêrre y Mesocosmos) basándose en la misma técnica microscópica. El
CLSM (Confocal Laser Scanning Microscopy) se seleccionó ya que se trataba
de una técnica microscópica que permitía la observación con escasa
manipulación de la muestra. Así mismo permitió realizar series ópticas
(stacks∗) de pocas micras de grosor de los tapetes microbianos, e identificar
de manera nítida los diferentes géneros de cianobacterias basándose en la
autofluorescencia que éstas emiten cuando se excitan a una determinada
longitud de onda (Solé et al. 1998, 2001).
Caracterización e identificación de las cianobacterias
La caracterización e identificación de cianobacterias se realizó de
acuerdo al Manual de Bergey’s (Castenholz et al. 2001) considerando el
diámetro, la septación y la presencia o no de vacuolas de gas y de la envuelta
mucopolisacárida (EPS).
∗conjunto de imágenes o serie óptica formada a partir de sucesivas secciones
ópticas tomadas en profundidad en un mismo punto de la muestra.

31
Material y Métodos
Determinación de la biomasa
Se ha trabajado en la continua optimización de un método, especialmente
indicado, para determinar de manera rápida la biomasa de las cianobacterias
en muestras de tapetes microbianos. En este trabajo experimental se han
usado dos métodos cuya aplicación, separada en el tiempo, se ha basado en
programas de análisis de imagen y en las mejoras aportadas por cada uno de
ellos.
El primer programa informático utilizado fue el UTHSCSA Image tool
3.0, utilizando las proyecciones suma (imágenes bidimensionales) obtenidas
por CLSM. Estas imágenes se transformaron en imágenes binarias
(blanco/negro) usando el programa Adobe Photoshop 6.0 para Windows. De
dichas imágenes se seleccionaron exclusivamente los contornos negros que
correspondían a Microcoleus chthonoplastes, el resto de cianobacterias se
eliminaron. Finalmente, a partir de datos de área y perímetro de cada
contorno y de la aplicación de fórmulas descritas por Solé et al. (2001) se
obtuvieron los resultados finales de biomasa expresados en mgC/cm3 de
sedimento.
El segundo método utilizado para la obtención de biomasa fue aplicando
el programa Image J 1.33f. Este proceso utiliza stacks de imágenes que al
igual que en el método anterior, se transformó todo el stack en imágenes
binarias. Para obtener mejores resultados, en dicho programa se aplicó el
plugin Voxel Counter. Esta aplicación específica permite la evaluación del
porcentaje de píxeles entre el biovolumen de las cianobacterias y el volumen
total de sedimento. Los resultados finales de biomasa también se expresaron
en mgC/cm3 de sedimento.
32
Material y Métodos
2.2. Cultivos Celulares. Microcoleus consorcio
2.2.1. Cultivo de enriquecimiento
Los cultivos de enriquecimiento se obtuvieron a partir de los
microcosmos contaminados por petróleo 0.5 cm2 de capa verde se inocularon
en medio mineral Pfenning (van Gemerden y Beeftink, 1983) y se ensayaron
diferentes condiciones de cultivo que se muestran en la tabla 1 del capítulo V.
En todos los casos, la incubación de los diferentes cultivos se realizó en
condiciones aeróbicas y anaeróbicas a una intensidad de luz de 15µEm-2s-1 y a
27ºC.
2.2.2. Aislamiento de Microcoleus consorcio
El método descrito para el aislamiento de Microcoleus consorcio forma
parte de los resultados del presente trabajo y por ello se describe en el
capítulo V.
2.2.3. Identificación
A. Aplicación de técnicas microscópicas de alta resolución
Para la caracterización de los microorganismos se utilizaron las
siguientes técnicas microscópicas:
Microscopía Láser Confocal (CLSM)
La microscopia láser confocal se utilizó para la caracterización e
identificación de la cianobacteria filamentosa Microcoleus
chthonoplastes en muestras de cultivo líquido.
33
Material y Métodos
Las muestras se depositaron en portaobjetos excavados y se
observaron a 63X. Se obtuvieron secciones ópticas, proyecciones suma
(2D) e imágenes estereoscópicas (3D).
Microscopía Electrónica de Transmisión (TEM)
Para determinar la caracterización ultraestructural de los
microorganismos del consorcio, se realizaron secciones ultrafinas que se
analizaron al microscopio electrónico de transmisión (TEM: Transmision
Electron Microscopy).
Las muestras de los cultivos, procedentes tanto de medio líquido como
sólido, se fijaron con glutaraldheído en tampón fosfato a una
concentración final del 2,5% durante 2-3 horas a 4ºC (Esteve et al. 1990).
Luego se realizaron varios lavados de las muestras, de una duración de
20 minutos cada una, para eliminar el exceso de fijador, utilizando para
ello el mismo tampón. Posteriormente las muestras se fijaron con
tetróxido de osmio (OsO4) a 4ºC durante dos horas y se lavaron de nuevo
con tampón fosfato.
A continuación, las muestras se centrifugaron a 5000xg durante 10
minutos y el pellet obtenido se incluyó en agar puro al 2%. Una vez
solidificado el agar, se cortó en pequeños cubos que se deshidrataron en
concentraciones crecientes de acetona (30, 50, 70 y 100%).
Posteriormente, estas muestras se lavaron dos veces en óxido de
propileno al 100%.
Finalmente las muestras fueron incluidas en resina Spur, utilizándose
el piramidotomo (TM 60, C. Reichert AG. Wien, Austria) para piramidar
las muestras y el ultramicrotomo (LKB 8800 Ultratome III. LKB-
Produkter AB. Bromma, Suecia) para obtener las secciones ultrafinas.
Los cortes ultrafinos se depositaron en rejillas de carbón y se tiñeron con
citrato de plomo según el metodo descrito por Reynolds (1963).
Las muestras fueron observadas en el microscopio electrónico de
transmisión HITACHI H-7000 (Hitachi Ltd. Japón).

34
Material y Métodos
Microscopía Electrónica de Barrido (SEM)
El SEM (Scanning Electron Microscopy) se utilizó para la
caracterización de los microorganismos de Microcoleus consorcio.
Las muestras se fijaron durante 2 horas a 4ºC con glutaraldheído al
2,5%. El fijador se eliminó mediante repetidos lavados en tampón
fosfato, de acuerdo con el método descrito por Miloning (1961).
Posteriormente las muestras se filtraron en un filtro nucleopore, se
deshidrataron en concentraciones crecientes de acetona (30, 50, 70 y
100%) y se procesaron de acuerdo al método aplicado por Nogués et al.
(1994).
A continuación las muestras se desecaron al punto crítico, se
montaron sobre unos soportes metálicos especiales y se metalizaron
recubriéndose la superficie con una capa de 96 nm de oro.
Finalmente las muestras se observaron en el microscopio de barrido
HITACHI S 570 (Hitachi Ltd., Japón).
B. Técnicas Moleculares
La identificación de los microorganismos heterotróficos del consorcio
se realizó por las siguientes técnicas moleculares:
Extracción de DNA
La extracción de los ácidos nucleicos de los cultivos se realizó según
el método descrito por Massana et al. (1997). A partir de las placas de
agar Pfenning que contenían la muestra a analizar, se recogieron las
colonias de Microcoleus consorcio y se resuspendieron en 2 ml de
tampón de lisis (50 mM Tris-HCl, pH 8.3; 40mM EDTA, pH 8.0; 0.75 M
sucrosa). Se agregaron a la muestra perlas de cristal estériles de 0,5 mm
de diámetro y se agitaron en un vórtex para romper la vaina
exopolisacárida de los filamentos de la cianobacteria. El DNA se extrajo
35
Material y Métodos
usando el método de lisis/fenol como se describe a continuación. La
lisozima (1 mg.ml-1) se añadió a las muestras, que posteriormente se
incubaron a 37ºC y en agitación leve durante 45 minutos. A
continuación, se agregaron: dodecil sulfato de sodio (concentración final
del 1%) y proteinasa K (con una concentración final de 0.2 mg.ml-1) a la
muestra, incubándose la mezcla a 55ºC durante 60 minutos y con
agitación. Los ácidos nucleicos se extrajeron con alcohol isoamílico
fenolcloroformo (25:24:1, vol:vol:vol), realizándose este proceso dos
veces. El fenol residual se eliminó con cloroformo-alcohol isoamílico
(24:1, vol:vol). Los ácidos nucleicos se purificaron y concentraron con
un Centricon-100 (millipore). La integridad del DNA se comprobó por
electroforesis en gel de agarosa, y se cuantificó usando un marcador de
DNA estándar (Low DNA mass ladder, Invitrogen). Se separaron
muestras para el análisis por DGGE y para la librería genética.
PCR-DGGE (Reacción en Cadena de la Polimerasa-Electroforesis en
Gel de Gradiente Desnaturalizante)
Los fragmentos del gen 16S rRNA para el análisis de DGGE se
obtuvieron usando el cebador específico para bacterias 358F-GC y el
cebador universal 907RM (Muyzer et al. 1998 y Schauer et al. 2000). La
PCR se llevó a cabo con un termociclador Biometra usando el siguiente
programa: desnaturalización inicial a 94°C (5 minutos); 10 ciclos de
desnaturalización a 94°C (un minuto); anillamiento de 65 a 55°C (un
minuto), disminuyendo un gradocentígrado en cada ciclo y una extensión
a 72°C (3 minutos); 20 ciclos estándares a 55°C (1 minuto) y una
extensión final a 72°C (5 minutos).
Los cebadores 344f-GC y 915r se utilizaron para la amplificación del
16S rRNA de arqueobacterias (Raskin et al. 1994 y Stahl et al. 1991). El
protocolo de PCR incluyó un paso inicial de desnaturalización a 94ºC (5
minutos), seguido por 20 ciclos más de desnaturalización a 94ºC (un
minuto), anillamiento de 71 a 61ºC (un minuto) disminuyendo un grado
36
Material y Métodos
centígrado cada ciclo, y una extensión a 72ºC (3 minutos). Se añadieron
15 ciclos adicionales a 61ºC.
Las mezclas de PCR llevaban: 1-10ng de DNA, con deoxinucleósido
trifosfato a una concentración de 200 µM, 1.5 mM MgCl2, los cebadores
estaban a una concentración de 0.3 µM, 2.5 U de Taq polimerasa
(Invitrogen) y tampón de PCR. Se agregó BSA (albúmina sérica bovina)
a una concentración final de 600 µgml-1 para reducir al mínimo el efecto
inhibitorio de sustancias húmicas (Harry et al. 1999). El volumen de
reacción era de 50µl. Los productos de PCR se verificaron y
cuantificaron por electroforesis en gel de agarosa con un marcador DNA
estándar (Low DNA mass ladder, Invitrogen). El análisis por DGGE se
realizó en un sistema de DCode (Bio-Rad) según Muyzer et al. (1998).
Se preparó un gel de poliacrilamida al 6% en gradiente desnaturalizante
mezclando soluciones al 0 y al 80% de agente desnaturalizante (urea 7M
más 40% de formamida desionizada). 700 ng de producto de PCR se
cargaron para cada muestra y el gel se hizo correr a 100V-60ºC durante
18h en tampón TAE 1x (40 mM Tris [ pH 7.4 ], 20 mM acetato del sodio,
1M EDTA). El gel se tiñó con SybrGold (Molecular Probes) durante 45
minutos y se visualizó con luz UV en un Gel Doc (EQ -Bio-Rad).
Las bandas más prominentes se escindieron del gel y se
resuspendieron en agua desionizada durante toda una noche. Las
muestras se reamplificaron y purificaron con el Kit llamado High Pure
Product Purification (Roche) para su secuenciación.
Librería Genética y Análisis del Polimorfismo de Restricción de la
Longitud del Fragmento de DNA
Para la clonación, el gen 16S rRNA se amplificó entre las posiciones
27 y 1492 (numeración de la secuencia del gen 16S rRNA de Escherichia
coli), con los cebadores 27F (5’-AGA GTT TGA TCM TGG CTC AG-
3’) y 1492R (5’-GGT TAC CTT GTT ACG ACT T-3’). Las mezclas de
PCR contenían 10 ng del DNA estándar, cada deoxinucleósido trifosfato
37
Material y Métodos
estaba a una concentración de 200 µM, de 1.5 mM MgCl2, cada cebador
a una concentración de 0.3 µM, 2.5 U de Taq polimerasa (Invitrogen) y
tampón de PCR.
Las reacciones se realizaron en un termociclador automatizado
(Biometra) con el siguiente ciclo: un paso inicial de desnaturalización a
94ºC (5 minutos), seguido por 30 ciclos a 94ºC (un minuto), a 55ºC (un
minuto) y a 72ºC (2 minutos), y de un paso de extensión final a 72ºC (10
minutos). El producto de PCR se clonó con el kit TOPO TA (Invitrogen)
según las instrucciones del fabricante. Las colonias positivas escogidas se
transfirieron a una placa multiwell que contenía el medio de Luria-
Bertani y glicerol al 7%, y se almacenaron a -80ºC. Los plásmidos
recombinantes se extrajeron usando el kit QIAprep spin miniprep
(QIAgen), siguiendo las instrucciones del fabricante. Los plásmidos
purificados se digerieron a 37ºC con HaeIII (Invitrogen) y el producto se
procesó en gel de agarosa de bajo punto de fusión al 2.5%. Los patrones
de bandas diferentes se eligieron para la secuenciación parcial. La
cobertura de la biblioteca se calculó de acuerdo con la siguiente
ecuación: C=1-(n/N), donde n es el número de clones únicos y N es el
número total de clones examinados (Ravenschlag et al. 1999).
La elección de los cebadores utilizados (358F cola GC y 907R para el
análisis de DGGE, y 27F y 1492R para la biblioteca) se hizo
deliberadamente porque no amplifican Microcoleus sp. De esta manera
se eliminó la amplificación de esta cianobacteria sin interferir en los
resultados finales.
Secuenciación del rRNA
Las reacciones de secuenciación lo realizó la empresa Macrogen
(Corea) utilizando los cebadores 907R para las bandas bacterianas de
DGGE (500 pb de longitud, aproximadamente), y 27F para los genes
clonados del 16S rRNA. Se utilizó el kit Big-dye Terminator versión 3.1
38
Material y Métodos
para la secuenciación y las reacciones se efectuaron en un analizador
automático ABI 3730XL – Analyzer con 96 capilares.
Las secuencias se analizaron con el programa informático BLAST
(Altschul et al. 1997), para conseguir un primer indicio de la afiliación
filogenética, y con el programa de CHECK-CHIMERA de RDP (Maidak
et al. 2000), para determinar los artefactos quiméricos potenciales. Las
secuencias se alinearon usando la herramienta de alineación automática
del software ARB (http://www.mikro.biologie.tu-muenchen.de) (Ludwig
et al. 1998). Las secuencias parciales se insertaron en el árbol optimizado
derivado de datos completos de la secuencia utilizando Quick add using
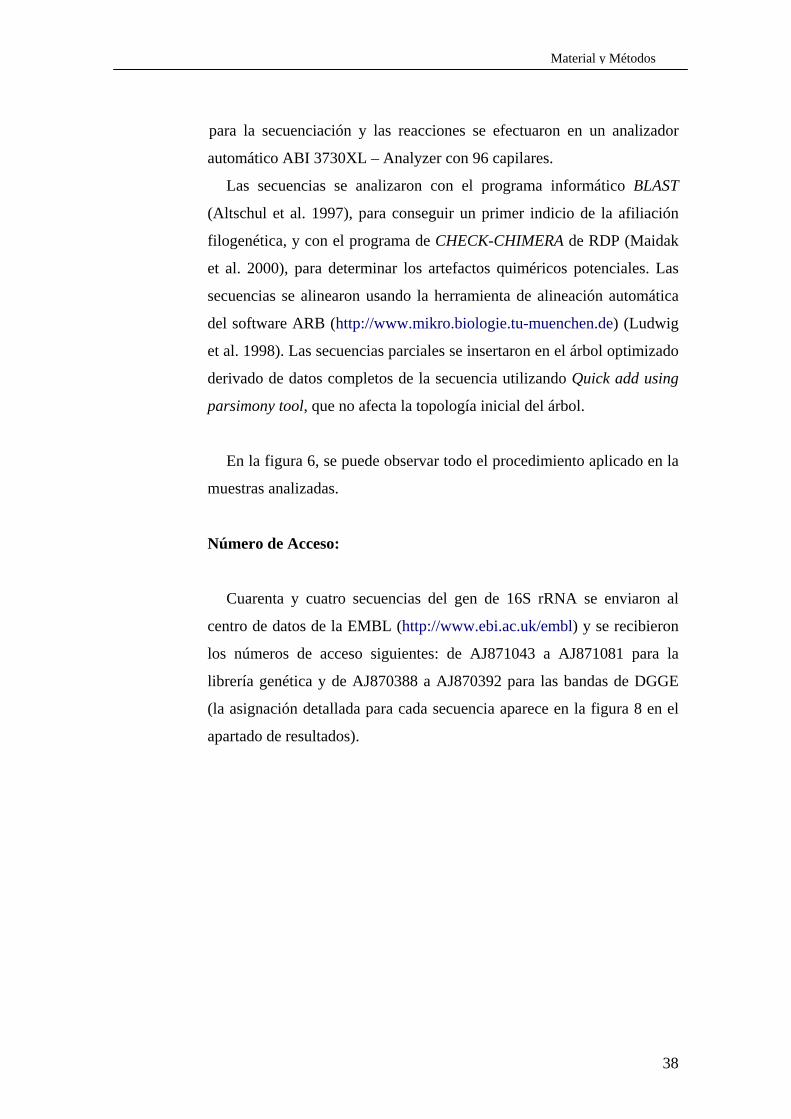
parsimony tool, que no afecta la topología inicial del árbol.
En la figura 6, se puede observar todo el procedimiento aplicado en la
muestras analizadas.
Número de Acceso:
Cuarenta y cuatro secuencias del gen de 16S rRNA se enviaron al
centro de datos de la EMBL (http://www.ebi.ac.uk/embl) y se recibieron
los números de acceso siguientes: de AJ871043 a AJ871081 para la
librería genética y de AJ870388 a AJ870392 para las bandas de DGGE
(la asignación detallada para cada secuencia aparece en la figura 8 en el
apartado de resultados).
39
Material y Métodos
BIOMASABIOMASA
11
2233
3PCRDGGE
Purificar con Kit High Pure Product Purification
PCR 16S rRNA
EXTRACCIÓN DE DNA
Cebadores BIBLIOTECA? (1500 pb)
DGGE
Cortar bandas
Escherichia coli 1 2
3
Β-galactosidasa
11
2233
11
2233
11
2233
11
2233
3PCR-cebadores DGGE
Secuenciar
Programa Informático BLAST
PCR 16S
EXTRACCIÓN DE DNA
?
Kit de Clonación TOPO TA
DGGE
Cortar bandas
1 2 3
Plásmidos con insertos
1 2 31 2 31 2 3
Escherichia coli 1 2
3
Β-galactosidasa
Escherichia coli 1 2
3
Β-galactosidasa
1 2
3
1 2
3
1 211 2
33
Β-galactosidasa
40
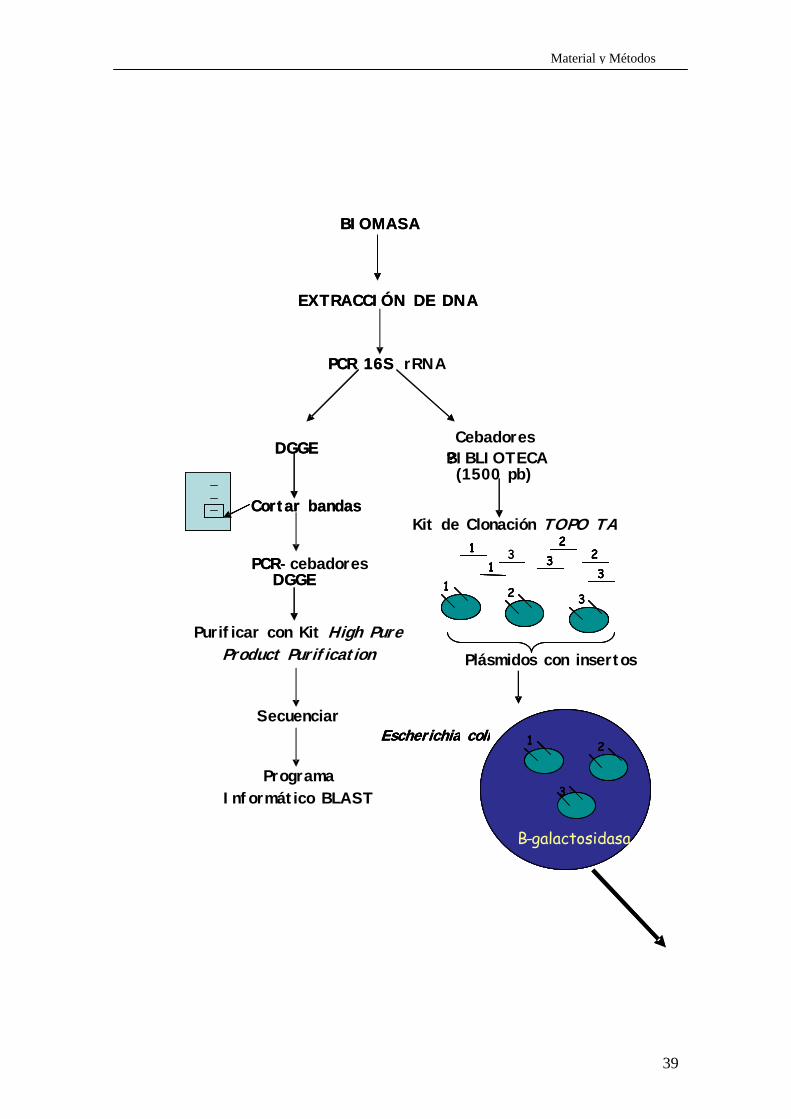
Material y Métodos
Plásmido sin inserto
Plásmido con inserto
LB + X-Gal + Antibiótico
LB + Antibiótico
Multiwell plates
2 ml de cultivo
Extracción plasmídica (KIT) PCR de cada muestra
Digestión con enzima de restricción Hae III
A B C
1500 Bases
Screening clones
Escoger diferentes patrones
Secuenciar a partir de DNA plasmídico
Figura 6: Técnicas moleculares aplicadas en la identificación de los microorganismos heterótrofos.
41
Material y Métodos
C. Técnicas de Análisis Químicos:
Las muestras, de los cultivos control y de los contaminados por
petróleo del consorcio, se analizaron en el CSIC (Consell Superior
d’Investigacions Científiques) por García de Oteyza et al. 2004.
El objetivo era determinar si el consorcio, toleraba o era capaz de
degradar el petróleo Maya (seleccionado en este trabajo por ser muy
tóxico). Para ello se realizó: separación por cromatografía de columna
(CC), cromatografía de gases y cromatografía de gases acoplada a
espectrometría de masas. Los resultados obtenidos de este estudio se
comentan en el capítulo V en la discusión de los resultados.
CAPÍTULO III: IDENTIFICACIÓN Y DISTRIBUCIÓN DE LAS CIANOBACTERIAS EN LOS TAPETES MICROBIANOS DE SALINS-DE-GIRAUD EN UN CICLO DÍA-NOCHE
Introducción Resultados: Identificación y Distribución de las Cianobacterias en los
Tapetes Microbianos de la Camarga Distribución de Microcoleus chthonoplastes durante un
ciclo día-noche Discusión

43
Identificación y distribución de las cianobacterias en los tapetes microbianos de Salins-de-Giraud
Introducción:
Como se ha indicado en el capítulo introductorio, los tapetes microbianos están
compuestos por diferentes comunidades microbianas cuya distribución depende de los
gradientes químicos generados por la actividad de éstas. Los microorganismos
fototróficos oxigénicos y anoxigénicos se encuentran mayoritariamente en estos
ecosistemas y son los que desempeñan el papel más importante como productores
primarios. Las cianobacterias se encuentran en la capa superficial formando una
compleja red y por lo tanto ayudando a la estabilización de estos ambientes.
Microcoleus chthonoplastes es la cianobacteria más importante y dominante en los
tapetes microbianos del delta del Ebro y Salins-de-Giraud, es por ello que a éstos se les
denomina frecuentemente Microcoleus mats.
En las capas anóxicas más profundas de dichos tapetes, y en las que todavía incide
la luz, las bacterias fototróficas del azufre participan en el flujo de energía, puesto que
realizan simultáneamente la detoxificación de H2S y la fotoasimilación de CO2. Durante
la noche, los gradientes químicos cambian drásticamente y exponen a las bacterias a
diferentes condiciones ambientales. Como respuesta, los microorganismos efectúan
movimientos migratorios, lo que les permite ubicarse a diferentes profundidades del
tapete microbiano, este efecto se ha visto también en ambientes artificiales (Kühl &
Fenchel 2000). Aunque las migraciones verticales se han descrito para diferentes
microorganismos: bacterias oxidadoras del azufre (Nelson et al. 1986 a y b, Richardson
L. 1996, Thar y Kühl 2001); bacterias sulfato reductoras (Krekeler et al. 1998, Teske et
al. 1998) y cianobacterias (Whal y Walbsy 1984, Richardson et al. 1987, García-Pichel
et al. 1994, Bebout y García-Pichel 1995), es difícil evaluar los parámetros que
controlan la distribución vertical de las poblaciones, ya que interactúan entre ellos.
Esta es la causa de que muchas de las investigaciones se hayan centrado en los
movimientos migratorios de un solo tipo de microorganismo como Thioploca spp.
(Huettel et al. 1996) y Synechococcus sp. (Ramsing et al. 2000).
De los tapetes microbianos estudiados, los del delta del Ebro (Tarragona-España) y
Salins-de-Giraud (La Camarga-Francia) son los más estabilizados y mantienen una
típica estructura laminar. Puesto que la diversidad de las cianobacterias de los tapetes
44
Identificación y distribución de las cianobacterias en los tapetes microbianos de Salins-de-Giraud
del delta del Ebro, mediante el CLSM ha sido estudiada con anterioridad (Solé et al.
2003), en este capítulo se centra el estudio en Salins-de-Giraud, analizando la diversidad
y la abundancia relativa en profundidad de las distintas cianobacterias identificadas. Así
mismo se determinan los perfiles de biomasa de Microcoleus chthonoplastes y se
estudia el movimiento migratorio de esta cianobacteria en un ciclo día-noche mediante
CLSM.
Resultados:
El presente estudio se ha realizado en los tapetes microbianos de Salins-de-Giraud
los días 11 y 12 de Junio del 2001, y a diferentes tiempos (9.40, 15.00, 18.00, 22.00,
4.00 y a las 7.30 horas). Las muestras se han procesado y analizado de acuerdo al
método descrito en el apartado 2.1.3. de material y métodos.
Identificación y distribución de las cianobacterias en los tapetes microbianos de la
Camarga:
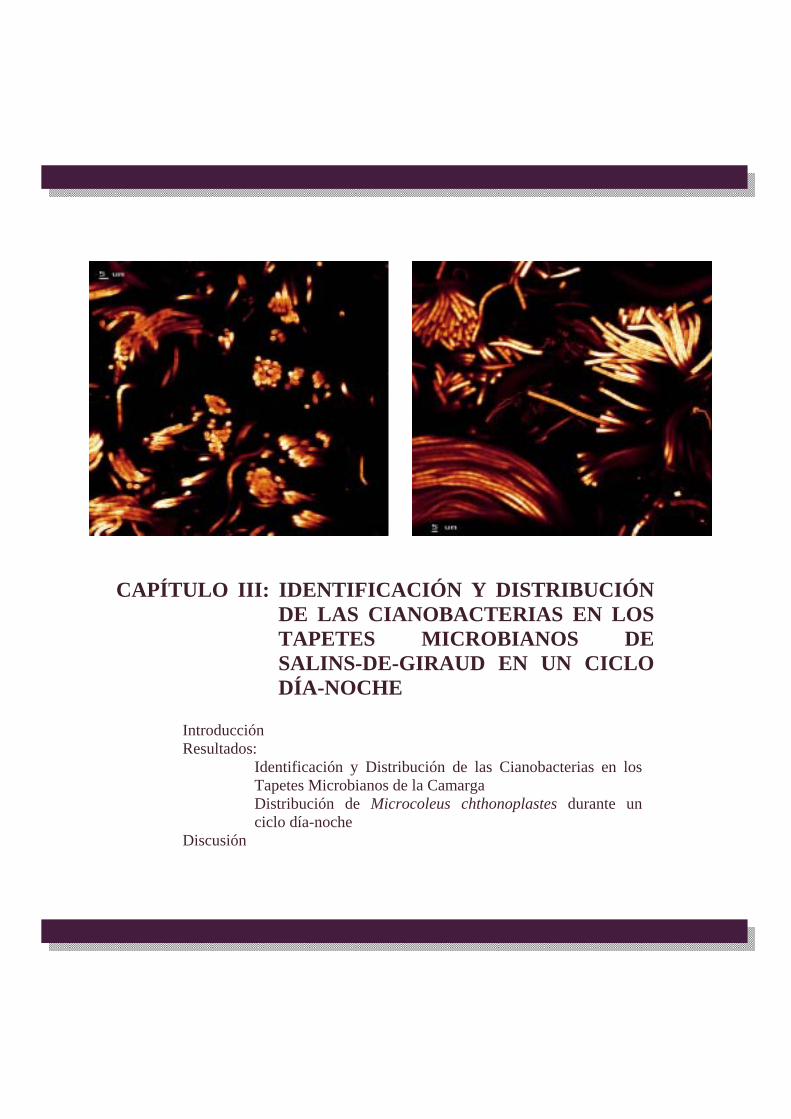
En los tapetes microbianos de Salins-de-Giraud se han identificado mediante CLSM
y de acuerdo con el Manual de Bergey’s las siguientes cianobacterias filamentosas:
Microcoleus chthonoplastes, Halomicronema excentricum, Pseudanabaena sp. y una
picocianobacteria de 0.96 µm de diámetro. Entre las unicelulares Gloeocapsa sp. y
miembros del grupo Pleurocapsa.
Las abundancias relativas de estas cianobacterias a diferentes profundidades del tapete
se determinaron durante un ciclo día y noche (Figura 1). M. chthonoplastes (Figura 2)
se encuentra uniformemente distribuido en el tapete y es la cianobacteria más
abundante; distribuyéndose mayoritariamente en su superficie durante el día.
Halomicronema excentricum, una cianobacteria típica de ambientes salinos, se
distribuye a lo largo del tapete durante el día, mientras que por la noche se sitúa entre
los 0 y 1.5 mm de profundidad. Pseudanabaena sp. se localiza a los 3.25 mm de
profundidad y únicamente a las 9.40 h. Finalmente las picocianobacterias tienen su
máxima abundancia entre los 2 y 4 mm. Entre las cianobacterias unicelulares
mencionamos a Gloeocapsa sp. y que se encuentra a diferentes profundidades entre 0.5

45
Identificación y distribución de las cianobacterias en los tapetes microbianos de Salins-de-Giraud
y 2 mm a las 15.00h; a 0.25 mm a las 22.00h; y a 0.75 mm a las 4.00h; mientras que
miembros del grupo Pleurocapsa tienen su máximo a las 4.00h a 2.25 mm.
Distribución de Microcoleus chthonoplastes durante un ciclo día y noche:
Los resultados obtenidos en el apartado anterior dan información sobre la
abundancia relativa de cada cianobacteria por separado en profundidad. No obstante y
puesto que Microcoleus chthonoplastes es la cianobacteria dominante se han estudiado
los perfiles de biomasa de esta cianobacteria mediante CLSM, según el método descrito
en el apartado anterior 2.1.4. de material y métodos.
En la figura 3, se aprecia que Microcoleus chthonoplastes a las 9.40h presentó
valores altos de biomasa después de un periodo de oscuridad: a 1 mm (39.7 mgC/cm3 de
sedimento), a 1.75 mm (24.27 mgC/cm3 de sedimento) y a 2.5 mm (29.53 mgC/cm3 de
sedimento).
A las 15.00 h, los filamentos se distribuyeron principalmente en la superficie del tapete
con una concentración de 31.22 mgC/cm3 de sedimento. A las 18.00h Microcoleus
chthonoplastes alcanzó su máxima concentración (52.80 mgC/cm3 de sedimento) a
0.5mm; mientras que las concentraciones más bajas se encontraron en las zonas más
profundas del tapete.
Durante la noche (22.00h) esta cianobacteria filamentosa se localizó entre 0 y 1.5
mm de profundidad y no se detectó a partir de los 2.25 mm. A las 4.00h M.
chthonoplastes se distribuyó homogéneamente a lo largo de los 3 mm del tapete
estudiado.
Finalmente a las 7.30 h, la distribución de Microcoleus chthonoplastes era similar a
la descrita a las 9.40 h. El máximo se dio entre 0.75 y 1 mm (35.25 mgC/cm3 de
sedimento – 33.25 mgC/cm3 de sedimento). La concentración de biomasa de esta
cianobacteria fue disminuyendo en profundidad, siendo de 25.88 mgC/cm3 de
sedimento a 1.75 mm y de 10.49 mgC/cm3 de sedimento a 2.5 mm de profundidad.
46
Identificación y distribución de las cianobacterias en los tapetes microbianos de Salins-de-Giraud
Discusión:
Las cianobacterias en los tapetes microbianos de Salins-de-Giraud muestran
movimientos verticales migratorios individuales durante el ciclo día y noche. M.
chthonoplastes, una cianobacteria característica de los ambientes hipersalinos
(Caumette et al.1994, Abed et al. 2002a) es la cianobacteria filamentosa más abundante
y se ubica en diferentes capas del tapete a diferentes horas. Su distribución vertical es
homogénea (de 4.00h a 7.30h) después de un periodo de oscuridad (de 6 a 9 horas) y es
máxima cerca de la superficie (18.00h) después de casi 12 horas de un periodo de
iluminación (Figura 3). Si esta distribución se compara además con los perfiles de
oxígeno y de sulfhídrico del tapete, obtenidos por Wieland et al. 2005, se observa que
los óptimos de crecimiento de Microcoleus chthonoplastes se dan en las capas óxicas
(Epping et al. 1999, Wieland y Kühl 2000) y por tanto en ausencia de H2S. No obstante
también se observa que dicha cianobacteria puede crecer en presencia de H2S, lo cual
sugiere o bien una adaptación metabólica por parte de M. chthonoplastes, que en este
caso podría realizar una fotosíntesis anoxigénica, puesto que en esta capa todavía incide
la luz, o bien la presencia de dos poblaciones distintas de esta cianobacteria.
Por otra parte, en todos los perfiles la concentración de H2S determinada siempre
fue inferior a la descrita por de Witt y van Gemerden (1987) como inhibitoria para la
fotosíntesis anoxigénica. Miller & Bebout (2004), también han estudiado el desarrollo
de diferentes cianobacterias frente a las variaciones en la concentración de sulfhídrico
del ambiente natural.
Las cianobacterias coexisten en los tapetes microbianos con las poblaciones de
bacterias fototróficas anoxigénicas que se distribuyen en capas inferiores en las que
todavía incide la luz y donde se encuentra el H2S. Para estudiar el efecto que las propias
poblaciones de bacterias fototróficas oxigénicas tiene sobre las anoxigénicas teniendo
en cuenta los parámetros ambientales (descritos por Wieland et al. 2005), Fourçans et al.
2004 realizaron un análisis canónico de correspondencia entre los citados parámetros.
Este análisis contempló los datos obtenidos en este apartado para la distribución vertical
de las cianobacterias. El oxígeno, el pH y la biomasa de Microcoleus chthonoplastes se
definieron como factores negativos para el desarrollo de las bacterias fototróficas
anoxigénicas (PAB). M. chthonoplastes y otras cianobacterias podrían influenciar en la

47
Identificación y distribución de las cianobacterias en los tapetes microbianos de Salins-de-Giraud
distribución de las PAB, ya que ambos tipos de poblaciones pueden competir por
determinados parámetros químicos (H2S y O2). La fotosíntesis oxigénica en la
superficie del tapete durante el día produjo oxígeno con un incremento del pH a 9.4 a lo
largo de los 1.5 milímetros desde la superficie del mismo (Wieland et al. 2005)
generándose condiciones adversas para las PAB. Durante la noche, la concentración de
oxígeno y el pH (6.8) fueron mucho más bajos, debido a la ausencia de fotosíntesis
oxigénica y por tanto estas condiciones fueron más favorables para mantener a las PAB.
Estudios semejantes se describieron con anterioridad para Chromatium sp. por van
Gemerden y Beeftink (1981).
Los movimientos migratorios aquí descritos, para las cianobacterias y su relación
con los microorganismos fototróficos anoxigénicos descritos por Fourçans et al.
(enviado a FEMS Microbial Ecology), nos permite constatar la eficacia del CLSM y las
técnicas moleculares en la distribución de los microorganismos. La distribución
cuantitativa de Microcoleus chthonoplastes abre nuevas posibilidades a la distribución
individualizada de cada tipo de cianobacteria en profundidad a escala micrométrica.
Aunque a dicha escala, sí se poseía información sobre la distribución de parámetros
ambientales (micro-electrodos) y también de distribución de la luz (fibra óptica) no era
posible contabilizar las cianobacterias de forma tan precisa, como la que se obtiene por
la aplicación de esta metodología. La distribución de Microcoleus chthonoplastes
cuando es cuantitativa, nos aporta datos que correlacionados con los parámetros
ambientales permite hipotetizar sobre el metabolismo que puede estar desarrollando esta
cianobacteria directamente en el tapete, no solo en un ciclo día y noche, sino también en
periodos de tiempos más largos.
La distribución precisa de las cianobacterias por esta técnica, ayuda a comprender la
distribución de las PAB influida por los cambios en los parámetros físicos y químicos
que producen las primeras con su metabolismo.

48
Identificación y distribución de las cianobacterias en los tapetes microbianos de Salins-de-Giraud
Microcoleus chthonoplastesHalomicronema excentricumPicocianobacteria
Gloeocapsa sp. Grupo PleurocapsaPseudanabaena sp.
Abundancia Relativa (%)
0 20 40 60 80 100
7:30 h (12/6/01)
0 20 40 60 80 100
00.25
0.50.75
11.25
1.51.75
22.25
2.52.75
33.25
3.53.75
4
4:00 h (12/6/01)
22:00 h (11/6/01)0
0.250.5
0.751
1.251.5
1.752
2.252.5
2.753
3.253.5
3.754
18:00 h (11/6/01)
4
00.250.5
0.751
1.251.5
1.752
2.252.5
2.753
3.253.5
9:40 h (11/6/01) 15:00 h (11/6/01)
Prof
undi
dad
(mm
)
Figura 1: Abundancia relativa (%) en profundidad de las cianobacterias caracterizadas e identificadas por CLSM durante el ciclo día-noche en los tapetes microbianos de Salins-de-Giraud.

49
Identificación y distribución de las cianobacterias en los tapetes microbianos de Salins-de-Giraud
Figura 2: Microcoleus chthonoplastes formando haces de filamentos.
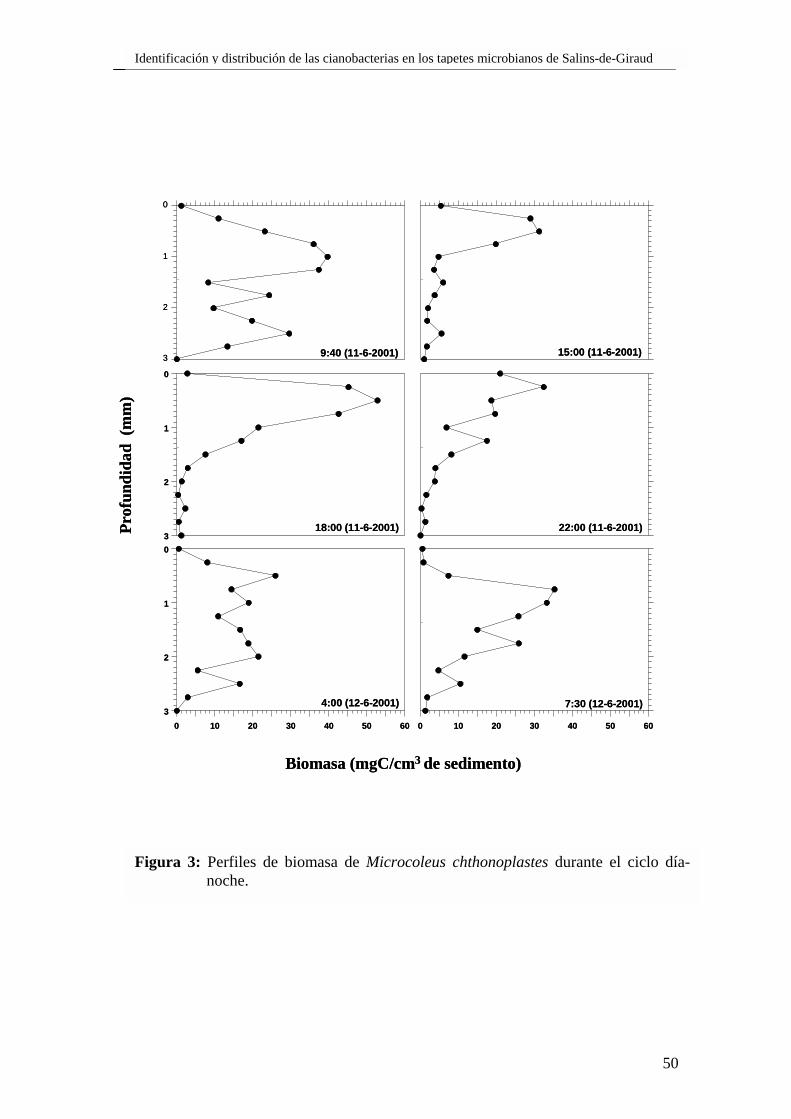
50
Identificación y distribución de las cianobacterias en los tapetes microbianos de Salins-de-Giraud
Figura 3: Perfiles de biomasa de Microcoleus chthonoplastes durante el ciclo día-noche.
0
1
2
3 9:40 (11-6-2001) 15:00 (11-6-2001)
0
1
2
318:00 (11-6-2001) 22:00 (11-6-2001)
0 10 20 30 40 50 60
0
1
2
34:00 (12-6-2001)
0 10 20 30 40 50 60
7:30 (12-6-2001)
Biomasa (mgC/cm3 de sedimento)
Prof
undi
dad
(mm
)
0
1
2
3 9:40 (11-6-2001) 15:00 (11-6-2001)
0
1
2
318:00 (11-6-2001) 22:00 (11-6-2001)
0 10 20 30 40 50 60
0
1
2
34:00 (12-6-2001)
0 10 20 30 40 50 60
7:30 (12-6-2001)
Biomasa (mgC/cm3 de sedimento)
Prof
undi
dad
(mm
)

CAPÍTULO IV: DIVERSIDAD DE LAS CIANOBACTERIAS EN AMBIENTES NATURALES Y ARTIFICALES CONTAMIANDOS POR PETRÓLEO. ANÁLISIS CUANTITATIVO
Introducción
Resultados y Discusión:
Análisis de la diversidad y determinación de la biomasa
de las cianobacterias en tapetes microbianos de Europa
con distinto grado de contaminación.
Análisis de la diversidad y determinación de la biomasa
de las cianobacterias en Mesocosmos.
52
Diversidad de las cianobacterias en ambientes naturales y artificiales contaminados por petróleo
Introducción:
Los tapetes microbianos se han definido en el capítulo I del presente trabajo, como
sedimentos estratificados bentónicos de pocos milímetros de grosor, estando
estructurados en capas de diferentes coloraciones, que se corresponden con las
poblaciones de microorganismos fotosintéticos. La ubicación de estos se ve influenciada
por micro-gradientes de parámetros ambientales tanto químicos como físicos (Herbert R.
A. 1985, Esteve et al. 1994, Wieland et al. 2003, Diestra et al. 2004, Fourçans et al.
2004). Estos parámetros, a su vez se ven afectados por la propia actividad de los
microorganismos.
En general, existe un gran interés por determinar la diversidad microbiana en los
ambientes naturales y en especial en los ambientes extremos para la vida, como son los
tapetes microbianos. Diferentes estudios estiman que la diversidad conocida está tan solo
entre el 0.1 y el 10% de la real, hecho probablemente debido a la dificultad para
identificar a los microorganismos que actualmente no son cultivables. El desarrollo de
las técnicas moleculares ha facilitado en parte la identificación de éstos (Fuhrman et al.
1993, Gray et al. 1996, Martin A. P. 2002).
No obstante, las estimas de la diversidad basadas en la de las distintas poblaciones de
un ecosistema, tampoco encuentran solución en la aplicación de dichas técnicas ya que
no son cuantitativas. Las cianobacterias de los tapetes microbianos no son una excepción
a la problemática expuesta, aunque su mayor tamaño y la presencia de pigmentos, que
emiten fluorescencia natural hacen más fácil, no solo su identificación sino también su
cuantificación (Solé et al. 2003).
Las cianobacterias en general son ubicuas y toleran amplios márgenes de parámetros
limitantes para la vida, como son; las elevadas temperaturas (Ferris et al. 1996) y la
salinidad (Demergaso et al. 2003). Entre los parámetros químicos, el N2 suele ser el
factor más limitante y su fijación se ve regulada por el pH, la pO2, el NH4, el carbono
orgánico disponible, el H2S y la disponibilidad del agua (Steppe et al. 2001).
Estudios sobre la distribución espacial de los microorganismos demuestran que las
mismas poblaciones pueden desarrollar diferentes características fisiológicas cuando se
encuentran en distintos hábitats, tratándose no obstante de microorganismos que están

53
Diversidad de las cianobacterias en ambientes naturales y artificiales contaminados por petróleo
genéticamente relacionados, lo que todavía dificulta más su identificación (Moore et al.
1998).
En los últimos años, nuestro grupo de trabajo ha desarrollado una metodología
utilizando el microscopio láser confocal, basada en la autofluorescencia natural emitida
por las cianobacterias y en la obtención de secciones ópticas de alta resolución. Todo
ello ha permitido la caracterización e identificación de estos microorganismos y además
gracias a técnicas de análisis de imagen, la determinación de su biomasa.
Recientemente el análisis de imágenes por stacks y el uso del programa informático
Image J ha hecho posible optimizar los cálculos de biomasa, al tratarse de un sistema
fiable y rápido de obtención de datos precisos y que permite además analizar un gran
número de muestras (Solé et al. enviado a Journal Microscopy).
En el presente capítulo, se analiza la diversidad de las cianobacterias en muestras
procedentes de tapetes microbianos de diferentes puntos de Europa, con distinto grado de
contaminación con petróleo. Además se valoran los cambios producidos en las
poblaciones de cianobacterias en sistemas experimentales (mesocosmos) contaminados
con petróleo Casablanca.
El objetivo principal es determinar, si los cambios en diversidad y biomasa total e
individual de cada cianobacteria en profundidad, son atribuibles a la contaminación con
petróleo, tanto en ambientes naturales como artificiales. Al mismo tiempo al comparar la
diversidad de las cianobacterias en distintos tipos de tapetes microbianos, se obtiene
información sobre la biogeografía de estas bacterias.
54
Diversidad de las cianobacterias en ambientes naturales y artificiales contaminados por petróleo
Resultados y Discusión:
En los últimos años, existe un creciente interés por el papel que las cianobacterias
pueden desempeñar en las zonas costeras contaminadas con petróleo, de allí la
importancia del estudio de su diversidad en ambientes contaminados y no contaminados.
Es por ello que se han caracterizado e identificado dichos microorganismos, y se ha
determinado los perfiles de biomasa total. De forma más precisa también se han
analizado las variaciones cuantitativas en profundidad de cada tipo de cianobacterias
encontradas en Etang de Bêrre y en Mesocosmos, ambos ambientes contaminados con
petróleo.
A. Análisis de la diversidad y determinación de la biomasa de las cianobacterias
en tapetes microbianos de Europa con distinto grado de contaminación.
Diversidad
Se han caracterizado mediante CLSM tapetes microbianos no contaminados
con petróleo (delta del Ebro, Colònia de Sant Jordi, Salins-de-Giraud), poco
contaminados (Islas Orkney) y muy contaminados (Etang de Bêrre).
La identificación de los distintos géneros de las cianobacterias se ha
realizado según la caracterización propuesta por Castenholz et al. (2001). Ver
tablas 1 y 2 y figura 1.
Las cianobacterias de tipo filamentoso como Microcoleus chthonoplastes
dominaron en los tapetes microbianos del delta del Ebro, Salins-de-Giraud y de la
Colònia de Sant Jordi. En estos dos últimos ambientes se detectaron también
Halomicronema excentricum, cianobacteria que se caracteriza por desarrollarse
en ambientes salinos y cuyo diámetro es de 0.96 µm; Leptolyngbya sp. y las
cianobacterias todavía no identificadas de 1.25 µm de diámetro fueron
dominantes en Salins-de-Giraud.
En Etang de Bêrre no se observaron ni Microcoleus chthonoplastes ni
Oscillatoria sp., siendo las cianobacterias filamentosas Lyngbya sp. y
Phormidium sp. las más abundantes. Se destaca la ausencia total de
cianobacterias unicelulares, este hecho podría significar que el petróleo era
55
Diversidad de las cianobacterias en ambientes naturales y artificiales contaminados por petróleo
significativamente tóxico para estos microorganismos. Al-Hasan el. (1998) y
Sorkhoh et al. (1995), proponen el efecto bioreparador que las cianobacterias
filamentosas podrían desempeñar frente al petróleo; ya que existe un gran interés
por el papel que puedan desempeñar las vainas de mucopolisacáridos de estos
microorganismos ante esta sustancia tóxica.
En todos los ambientes no contaminados estudiados, se identificaron las
cianobacterias unicelulares: Synechocystis sp. y Chroococcus sp., aunque
también se detectó Gloeocapsa sp. en los tapetes del delta del Ebro y en la
Colònia de Sant Jordi (Tabla 2). Las cianobacterias correspondientes al grupo
Pleurocapsa, se observaron en los tapetes microbianos que presentan una baja
contaminación, siendo éstas las mayoritarias en estos ecosistemas junto a Borzia
sp., cianobacteria filamentosa que se caracteriza por presentar filamentos de 2 a 8
células.
Es interesante constatar la dominancia de cianobacterias filamentosas en los
ambientes naturales que nunca estuvieron contaminados con petróleo. Por el
contrario aquellos ambientes que presentaban una baja contaminación con
petróleo como los tapetes microbianos de las Islas Orkney presentaban una
mayor incidencia de cianobacterias unicelulares correspondientes a los dos tipos
del grupo Pleurocapsa caracterizados.
Biomasa
Los tapetes microbianos estudiados tienen una textura distinta. Los del delta
del Ebro, Salins-de-Giraud y Colònia de Sant Jordi son tapetes estratificados de
textura consistente, favorecida por la presencia de la cianobacteria filamentosa
Microcoleus chthonoplastes, que se encuentra a menudo formando redes de
filamentos entrecruzados entre sí, ayudando de esta manera a la estabilización de
estos ecosistemas (Mazor et al. 1996). Por otra parte los tapetes microbianos de
las Islas Orkney son de tipo granuloso y muy poco estables, mientras que las
muestras de Etang de Bêrre son densas y espesas, debido a la presencia
continuada del crudo en este último ambiente. En los mesocosmos, las muestras
son de textura mucilaginosa.
56
Diversidad de las cianobacterias en ambientes naturales y artificiales contaminados por petróleo
La estructura de las muestras ha motivado que tanto la diversidad como el
cálculo de la biomasa se haya efectuado con mayor precisión en los tapetes de
textura consistente.
Los perfiles de biomasa individual y total de las cianobacterias se determinó
haciendo uso del programa informático Image J aplicado a los distintos stacks de
imágenes obtenidas por CLSM a partir de los diferentes ecosistemas estudiados.
En los tapetes microbianos de la Colònia de Sant Jordi la concentración
máxima de biomasa se encuentra entre 0,50 y 1 mm; en el delta del Ebro entre
0,50 y 1,75 mm y en Salins-de-Giraud entre 0,25 y 1,25 mm (Tabla 3). En estos
dos últimos, los valores máximos de biomasa se corresponden con la zona fótica
del tapete (Sole et al. 2003, Fourçans et al. 2004). Así mismo, cabe destacar que
las cianobacterias en general no solo se encuentran en la capa óxica del tapete,
sino que también se les puede encontrar en las capas anóxicas del mismo, lo que
puede significar cierta versatilidad metabólica.
Fourçans et al. (2004) demostraron que en Salins-de-Giraud la capa anóxica se
sitúa a partir del segundo milímetro, lo que justifica la baja concentración de
biomasa de las cianobacterias a partir de dicha profundidad.
De los tapetes de las Islas Orkney, el de Waulkmill bay presentaba un mayor
grado de estratificación que el de Swanbister bay. En el primer caso, la
distribución de la biomasa total seguía un perfil parecido al de los ambientes
anteriormente mencionados, con una concentración de 19,72 mgC/cm3 de
sedimento a 1.85 mm de profundidad. Esta distribución no se daba en el caso de
Swanbister bay (Tabla 4).
En Etang de Bêrre, se observa una reducción de la biomasa total con 31,37
mgC/cm3 de sedimento, en la superficie y 0,06 mgC/cm3 de sedimento, a 3,6 mm
de profundidad. No obstante el análisis de la diversidad muestra claras
diferencias con respecto a los no contaminados. En este caso, las cianobacterias
más abundantes son Lyngbya sp. y Phormidium sp. con una biomasa de 22,52
mgC/cm3 de sedimento, y 8,85 mgC/cm3 de sedimento, respectivamente (Tabla
5), mientras que no se detectaron Microcoleus chthonoplastes ni las
cianobacterias unicelulares que se encontraban en los no contaminados.

57
Diversidad de las cianobacterias en ambientes naturales y artificiales contaminados por petróleo
B. Análisis de la diversidad y determinación de la biomasa de las cianobacterias
en Mesocosmos.
En el apartado anterior se ha estudiado el efecto del petróleo en ambientes
naturales. La dificultad de interpretar todas las posibles variables que pueden
influir en el crecimiento de los microorganismos, además del petróleo, se intenta
subsanar en este apartado mediante la utilización de mesocosmos.
Estos ambientes artificiales, en los que los parámetros ambientales están
controlados de manera constante, permiten evaluar de manera más selectiva el
efecto del petróleo sobre las cianobacterias, al comparar los resultados con los
obtenidos en el mesocosmos control (sin contaminación).
En la tabla 6 se recogen los resultados obtenidos tanto en diversidad como en
biomasa individual y total de las cianobacterias, en ambos tipos de mesocosmos;
siendo la distribución la siguiente: en el primer milímetro, no se observan
cambios de diversidad en ambos tipos de muestras. En el segundo milímetro,
Microcoleus chthonoplastes es la cianobacteria dominante en el mesocosmos
control (35,81 mgC/cm3 de sedimento), siendo indetectables las otras
cianobacterias. En cambio en presencia del crudo Casablanca, la concentración
de biomasa de esta cianobacteria filamentosa disminuye (10,25 mgC/cm3 de
sedimento) mientras se detectan otras cianobacterias, aunque el perfil de biomasa
total de estas últimas es mucho menor. En el tercer milímetro Microcoleus
chthonoplastes se encuentra a una concentración de 16,83 mgC/cm3 de sedimento
en el experimento control y no experimenta grandes cambios en el mesocosmos
contaminado (13,91 mgC/cm3 de sedimento).
Podría concluirse que Microcoleus chthonoplastes no se ve afectado por la
presencia del petróleo, y que los microorganismos restantes se encuentran a bajas
concentraciones. Por otra parte la distribución de Microcoleus chthonoplastes en
la muestra control es muy similar al de los ambientes naturales no contaminados
estudiados. Los análisis de biomasa total refuerzan estos resultados.
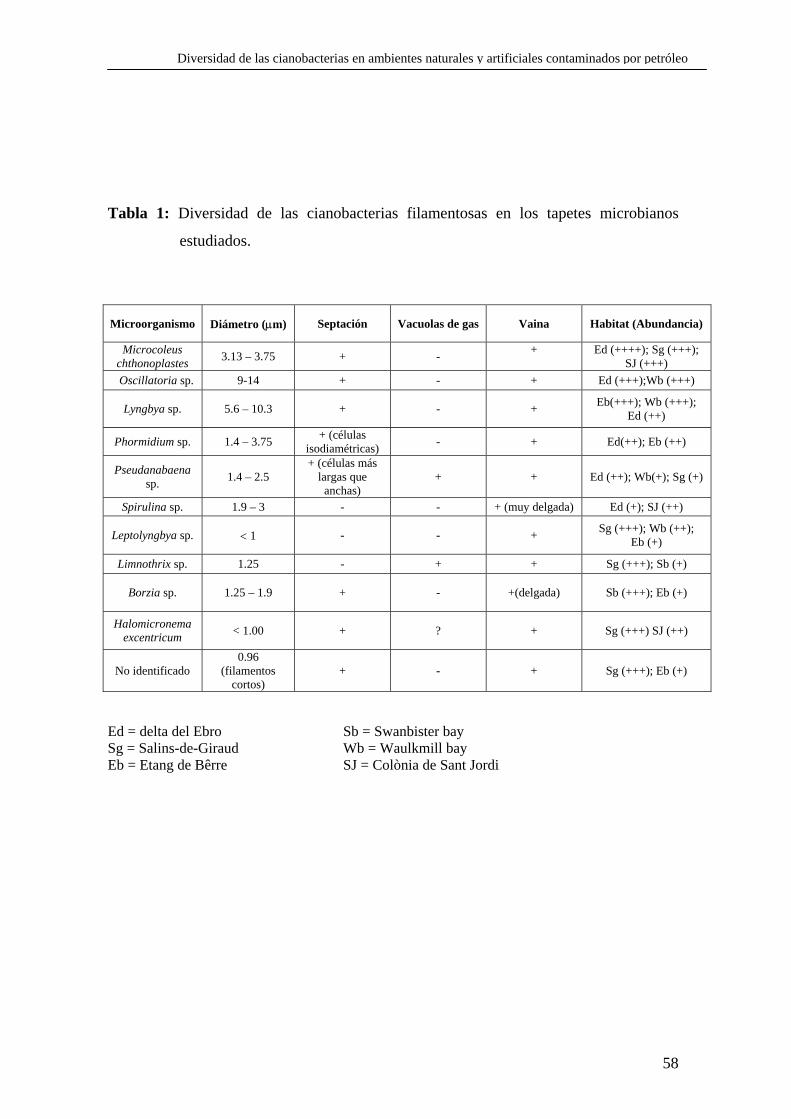
58
Diversidad de las cianobacterias en ambientes naturales y artificiales contaminados por petróleo
Tabla 1: Diversidad de las cianobacterias filamentosas en los tapetes microbianos
estudiados.
Microorganismo Diámetro (µm) Septación Vacuolas de gas Vaina Habitat (Abundancia)
Microcoleus chthonoplastes 3.13 – 3.75 + - + Ed (++++); Sg (+++);
SJ (+++) Oscillatoria sp. 9-14 + - + Ed (+++);Wb (+++)
Lyngbya sp. 5.6 – 10.3 + - + Eb(+++); Wb (+++); Ed (++)
Phormidium sp. 1.4 – 3.75 + (células isodiamétricas) - + Ed(++); Eb (++)
Pseudanabaena sp. 1.4 – 2.5
+ (células más largas que
anchas) + + Ed (++); Wb(+); Sg (+)
Spirulina sp. 1.9 – 3 - - + (muy delgada) Ed (+); SJ (++)
Leptolyngbya sp. < 1 - - + Sg (+++); Wb (++); Eb (+)
Limnothrix sp. 1.25 - + + Sg (+++); Sb (+)
Borzia sp. 1.25 – 1.9 + - +(delgada) Sb (+++); Eb (+)
Halomicronema excentricum < 1.00 + ? + Sg (+++) SJ (++)
No identificado 0.96
(filamentos cortos)
+ - + Sg (+++); Eb (+)
Ed = delta del Ebro Sb = Swanbister bay Sg = Salins-de-Giraud Wb = Waulkmill bay Eb = Etang de Bêrre SJ = Colònia de Sant Jordi

59
Diversidad de las cianobacterias en ambientes naturales y artificiales contaminados por petróleo
Tabla 2: Diversidad de las cianobacterias unicelulares en los tapetes microbianos
estudiados.
Microorganismos Diámetro (µm) División de las Células Vaina Habitat (Abundancia)
Gloeocapsa sp. 4 × 14 2 ó 3 planos + Ed (+++); Wb (+++); SJ(++)
Chroococcus sp. 19 × 28 2 planos + Ed (++); SJ(+)
Synechocystis sp. 3.5 × 3.5 2 ó 3 planos + (delgada) Ed(++); Sg (++)
Aphanothece sp. 5 × 7 Diferentes planos + (delgada) Wb (++)
Myxosarcina sp. 6 × 8 Fisión binaria en 3 planes + Ed (+)
Microcystis sp. 1.9 × 1.9 Fisión binaria en diferentes planos + Sb (+++); Wb (++)
Stanieria 2 × 3 Fisión múltiple o en
combinación con una limitada (1-3) fisión binaria
+ Sb (+)
Grupo Pleurocapsa Diverso en tamaño y forma
Fisión binaria en muchos planos (pseudofilamentos) - Sb (+++); Wb (++)
Grupo Pleurocapsa 2 × 3 Fisión binaria en planos diferentes (agregados) + Wb (+++)
Ed = delta del Ebro Sb = Swanbister bay Sg = Salins-de-Giraud Wb = Waulkmill bay Eb = Etang de Bêrre SJ = Colònia de Sant Jordi

60
Diversidad de las cianobacterias en ambientes naturales y artificiales contaminados por petróleo
Fig: 1A. Oscillatoria sp. (Ed), 1B.a. Chroococcus sp. (Ed), 1B.b. Myxosarcina sp. (Ed), 1C. Microcoleus chthonoplastes (Sg), 1D. Leptolyngbya sp. (Sg), 1E. Phormidium sp. (Eb), 1F. Lyngbya sp. (Eb), Fig: 1G. Grupo Pleurocapsa (pseudofilamentos) (Sb), 1H.a. Microcystis sp. (Sb), 1H.b. Stanieria sp. (Sb), 1I.a. Lyngbya sp. (Wb), 1I.b. Microcystis sp. (Wb) 1I.c. Oscillatoria sp. (Wb), 1I.d. Gloeocapsa sp. (Wb), 1J.a. Grupo Pleurocapsa (agregados) (Wb), 1J.b. Gloeocapsa sp. (Wb), 1J.c. Aphanothece sp. (Wb), 1K.a. Gloeocapsa sp., (SJ), 1K.b. Chroococcus sp., (SJ), 1L. Halomicronema excentricum (SJ).
Ed: delta del Ebro, Sg: Salins-de-Giraud, Eb: Etang de Bêrre, Sb: Swanbister Bay, Wb: Waulkmill Bay, SJ: Colònia Sant Jordi.

61
Diversidad de las cianobacterias en ambientes naturales y artificiales contaminados por petróleo
1E 1F
1A 1B
a
b
1C 1D

62
Diversidad de las cianobacterias en ambientes naturales y artificiales contaminados por petróleo
a
b
1G 1H
a
b
c
d
1I
a
b
c
1J
1K 1L
a b

Tabla 3: Biomasa total de los ambientes naturales no contaminados con petróleo.
BIOMASA TOTAL (mgC/cm3 de sedimento)COLÒNIA DESANT JORDI
0,00 5,04 7,49 4,430,25 5,71 14,57 21,420,50 10,61 37,23 26,140,75 9,67 43,11 23,171,00 10,08 58,76 16,421,25 7,95 43,62 11,891,50 8,12 46,63 4,851,75 5,86 25,21 2,06
2 4,19 12,42 1,742,25 3,74 12,56 0,282,50 5,47 10,53 2,152,75 11,03 1,463,00 2,36 1,04
Tabla 4: Biomasa total de los ambientes naturales ligeramente contaminados con petróleo.
BIOMASA TOTAL (mgC/cm3 de sedimento)PROFUNDIDAD SWANBISTER BAY PROFUNDIDAD WAULKMILL BAY
(mm) (mm)0 14,84 0 11,9
1,55 5,9 1,85 19,723,35 7,93 3,2 8,32
5,1 6,63
PROFUNDIDAD(mm) DELTA DEL EBRO SALINS-DE-GIRAUD
63
63

Tabla 5: Diversidad, biomasa individual y total de las cianobacterias en Etang de Bêrre.
PROFUNDIDAD
(mm) MICROORGANISMOS BIOMASA (mgC/cm3 de sedimento) BIOMASA TOTAL (mgC/cm3 de sedimento)
Lyngbya sp. 22,52 0 Phormidium sp. 8,85 31,37
1,25 Lyngbya sp. 14,26 14,26 Lyngbya sp. 2,71
filamentos no identificados 0,10
Borzia sp. 0,18 2,35
Otros 1,61
4,60
3,6 Borzia sp. 0,06 0,06
64

Tabla 6: Diversidad, biomasa individual y total de las cianobacterias crecidas en mesocosmos sin contaminar y contaminados con petróleo Casablanca.
BIOMASA (mgC/cm3 de sedimento) BIOMASA TOTAL (mgC/cm3 de sedimento) PROFUNDIDAD
(mm) MICROORGANISMOS
CONTROL CASABLANCA CONTROL CASABLANCA Microcoleus chthonoplastes 3,75 10,00
Spirulina sp. 0,67 0,44 Leptolyngbya sp. 1,22 0,29 Synechocystis sp. 0,14 0,78
Grupo Pleurocapsa 2,99 1,93
1
Gloeocapsa sp. No detectado 0,35
8,77 13,79
Microcoleus chthonoplastes 35,81 10,25 Leptolyngbya sp. No detectado 0,04 Gloeocapsa sp. No detectado 0,55
Synechocystis sp. No detectado 0,22 2
Grupo Pleurocapsa No detectado 1,41
35,81 12,47
Microcoleus chthonoplastes 16,83 13,91 Grupo Pleurocapsa No detectado 0,36 Synechocystis sp. No detectado 0,23 3
Gloeocapsa sp. No detectado 1,70
16,83 16,20
65
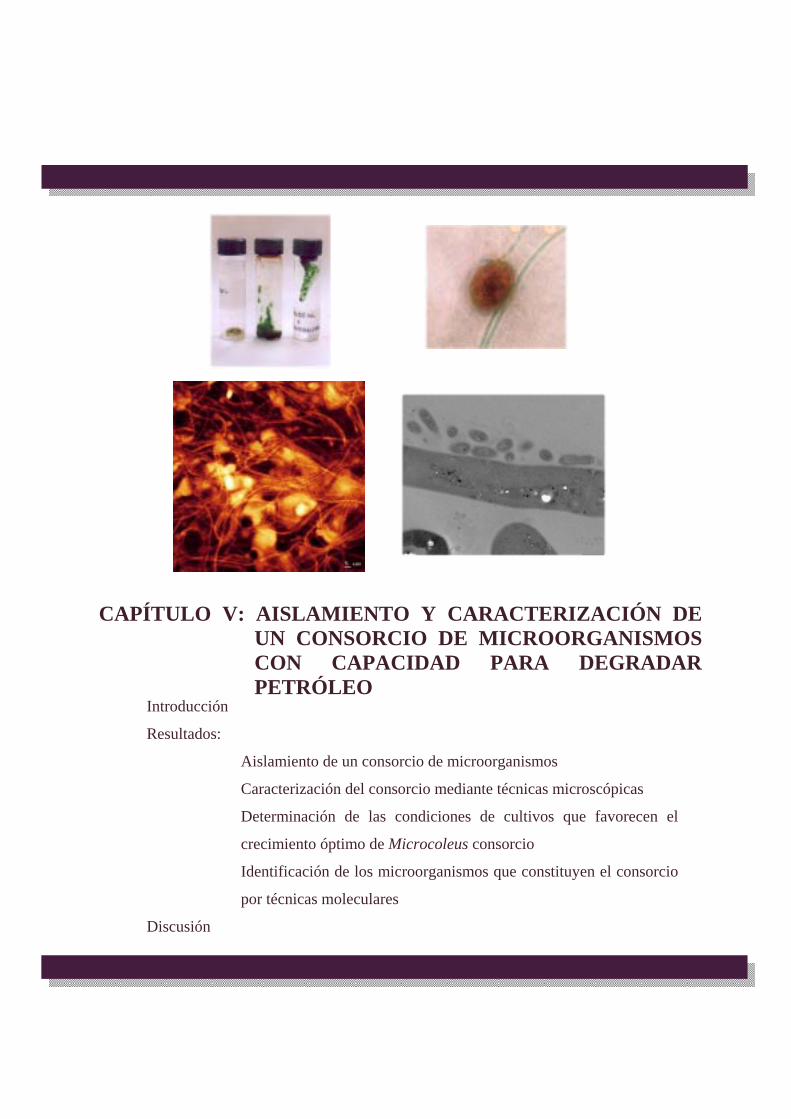
CAPÍTULO V: AISLAMIENTO Y CARACTERIZACIÓN DE UN CONSORCIO DE MICROORGANISMOS CON CAPACIDAD PARA DEGRADAR PETRÓLEO
Introducción
Resultados:
Aislamiento de un consorcio de microorganismos
Caracterización del consorcio mediante técnicas microscópicas
Determinación de las condiciones de cultivos que favorecen el
crecimiento óptimo de Microcoleus consorcio
Identificación de los microorganismos que constituyen el consorcio
por técnicas moleculares
Discusión
67
Aislamiento y caracterización de un consorcio de microorganismos con capacidad para degradar petróleo
Introducción:
En ambientes extremos para la vida, las asociaciones entre microorganismos son
muy frecuentes. Dichas asociaciones son taxonómicamente complejas y
metabólicamente interactivas.
Diferentes autores han designado como consorcios este tipo de asociaciones, que a
veces comprenden pocas especies de microorganismos, mientras que en otros casos
abarcan poblaciones o se refieren a una comunidad microbiana completa (Paerl y
Pinckney 1996, Abellá et al. 1998, Paerl et al. 2000). Este es el caso de los tapetes
microbianos, en los que las asociaciones se favorecen a nivel de micro-escala con la
finalidad de tamponar el efecto de diferentes parámetros extremos para la vida. Aún
cuando los tapetes microbianos se han tomado como referencia para explicar la vida en
condiciones limitantes, no todos los ambientes extremos son necesariamente el
resultado de procesos naturales.
La agricultura, la urbanización de territorios, la industrialización, la conversión a
gran escala de los ecosistemas naturales para la explotación humana, han dejado un gran
impacto en el paisaje terrestre tanto estructural como funcionalmente (Vitousek et al.
1997). También las catástrofes naturales, como los vertidos de petróleo, pertenecen a
este último apartado.
Los tapetes microbianos se han visto afectados en diferentes ocasiones por dichos
vertidos, lo que somete a las poblaciones de bacterias de dichos ecosistemas a un efecto
negativo añadido. Repetidas veces estos ambientes naturales han sufrido contaminación
por diferentes sustancias tóxicas, siendo una de ellas el petróleo. El interés por estudiar
los tapetes microbianos contaminados se inició después de la guerra del Golfo en 1991.
Estudios en estos ecosistemas demostraron que existió una degradación de
hidrocarburos, tanto aeróbica como anaeróbicamente (Al-Hasan et al. 1998). Abed et al.
(2002b) demostraron que las cianobacterias tenían la capacidad de degradar compuestos
de petróleo bajo condiciones aeróbicas, lo que implicaba que esta acción se realizaba en
la capa superior de estos ecosistemas, la cual está formada básicamente por
cianobacterias y bacterias heterotróficas.
Al-Hasan et al. (1998), demostraron que cultivos no axénicos de Microcoleus
chthonoplastes y Phormidium corium, aislados a partir de tapetes microbianos
68
Aislamiento y caracterización de un consorcio de microorganismos con capacidad para degradar petróleo
contaminados del Golfo de Arabia, eran capaces de degradar n-alcanos, además otros
autores demostraron que diferentes cepas de estas bacterias fototróficas eran capaces de
degradar también compuestos del petróleo (Radwan y Al-Hasan 2000, Raghukumar et
al. 2001). Es importante mencionar que muchos de estos estudios remarcan la
imposibilidad de obtener cultivos axénicos de las cianobacterias aisladas a partir de los
tapetes microbianos contaminados, por lo que se han realizado diversas investigaciones
donde las bacterias heterotróficas asociadas a las cianobacterias podrían ser las
responsables de la biodegradación. Abed y Köster (2005), demostraron que las
cianobacterias por sí mismas no son responsables de la degradación de los
hidrocarburos, pero juegan un papel esencial en el desarrollo y actividad de los
verdaderos degradadores, las bacterias heterotróficas. Aunque existen por tanto
referencias puntuales al posible papel de las cianobacterias en la degradación de
hidrocarburos, se sabe todavía muy poco sobre su efecto o utilización por parte de
Microcoleus chthonoplastes, en general, la cianobacteria dominante en estos
ecosistemas.
Microcoleus sp. es capaz en estos ambientes de producir importantes cantidades de
EPS, que engloba haces de filamentos de dicha cianobacteria. Esta matriz orgánica
semisólida, no solo estabiliza los sedimentos, sino que proporciona superficie y sustento
para el crecimiento; ejerciendo además una actividad protectora frente los
contaminantes, tales como, el petróleo, toxinas y diferentes metales pesados.
Algunos de los tapetes microbianos estudiados en el presente trabajo, están
dominados por Microcoleus sp. y han sufrido contaminación por petróleo en distintas
ocasiones. Es por ello que para estudiar el efecto del crudo, hemos desarrollado sistemas
experimentales (microcosmos) en los que estudiar su efecto sobre las poblaciones de
bacterias fotosintéticas oxigénicas (Llirós et al. 2003).
No obstante el objetivo de la investigación de este capítulo, era el aislamiento de
Microcoleus, a partir de microcosmos contaminados y el estudio en cultivo axénico de
su capacidad para degradar petróleo. Dado que desde las primeras observaciones se hizo
patente que Microcoleus sp. se encontraba asociado a otros microorganismos, se
denominó a los cultivos de dicha cianobacteria con el nombre de Microcoleus
consorcio.
69
Aislamiento y caracterización de un consorcio de microorganismos con capacidad para degradar petróleo
En este apartado se describe: el aislamiento y cultivo de dicho consorcio; la
identificación de los microorganismos que lo componen mediante técnicas
microscópicas de alta resolución y técnicas moleculares; y el tipo de simbiosis que se
establece entre la cianobacteria y los microorganismos heterotróficos que constituyen el
consorcio.
También se valoran las fracciones de petróleo Maya degradas por el consorcio y la
posible implicación ecológica de dicho efecto.

70
Aislamiento y caracterización de un consorcio de microorganismos con capacidad para degradar petróleo
Resultados:
Aislamiento de un consorcio de microorganismos con capacidad para el degradar
petróleo:
Los cultivos del consorcio se obtuvieron a partir de las muestras tomadas de los
microcosmos contaminados con petróleo (1A). En primer lugar, para obtener los
cultivos de enriquecimiento, se inocularon fracciones de capa verde, procedente de los
microcosmos, en botellas que contenían en todos los casos medio mineral Pfenning (van
Gemerden y Beeftink, 1983) y diferentes condiciones de cultivo que se exponen a
continuación:
a. Cultivo Control: Capa verde + Medio Pfenning sin carbonatos
b. Cultivos con Petróleo: Capa verde + Medio Pfenning + Petróleo Casablanca
(alto contenido en hidrocarburos alifáticos) o Maya (hidrocarburos aromáticos y
rico en compuestos azufrados).
c. Cultivos sin Petróleo: Capa verde + Medio Pfenning con carbonatos
En todos los casos los cultivos se incubaron en condiciones aeróbicas y anaeróbicas
a una intensidad de luz de 15µEm-2s-1 y a 27ºC (Figura 1C).
Microcoleus consocio se obtuvo a partir de los cultivos de enriquecimiento
correspondientes al cultivo tipo b (Figura 1B) y crecidos en condiciones anóxicas
(Figuras 1D y 1E). A partir de estos cultivos se realizaron siembras en cultivo líquido y
en placas, en anaerobiosis. Las placas contenían 150 µl de crudo Casablanca o Maya y
se incubaron anaeróbicamente (jarras GasPak o bolsas anaeróbicas Anaerocult P de la
casa Merck) y en las mismas condiciones de iluminación y temperatura utilizadas
anteriormente.
Los cultivos líquidos se analizaron antes y después de la adición de los dos tipos de
petróleo, indicados para determinar la capacidad del consorcio para degradar el crudo.
El consorcio aislado (1F y 1G) degradó principalmente los compuestos azufrados
heterocíclicos alifáticos tales como los alkyltiolanos y alkyltianos del petróleo Maya
(García de Oteyza et al. 2004).
71
Aislamiento y caracterización de un consorcio de microorganismos con capacidad para degradar petróleo
En la figura 2A, se observan masas densas del consorcio adheridas al crudo
mediante la matriz polisacárida que excreta Microcoleus sp. Posteriormente, el
consorcio se hizo crecer en medio sólido (Medio Mineral Pfenning + Agar), con la
finalidad de obtener colonias aisladas. En la figura 2B se pueden distinguir dichas
colonias y en la figura 3C, se aprecia un crecimiento confluente de Microcoleus
consorcio sobre la placa de agar.
Caracterización del consorcio mediante técnicas microscópicas de alta resolución:
En este estudio aplicamos el CLSM, el TEM y el SEM para caracterizar los
microorganismos del consorcio. El CLSM se utilizó para caracterizar e identificar a la
cianobacteria que forma parte de este consorcio. En la figura 2D se puede observar la
cianobacteria filamentosa entre gotas de petróleo. Los filamentos se caracterizan por
presentar células más largas que anchas y con un diámetro de 3 µm, además muestran
claras constricciones en su pared. Esta cianobacteria filamentosa, se ha identificado
como Microcoleus chthonoplastes (Figura 2E) de acuerdo a la clasificación taxonómica
propuesta por Castenholz et al. (2001). Las técnicas de microscópica electrónica como
el SEM y el TEM se utilizaron para determinar si las colonias estaban formadas
únicamente por Microcoleus chthonoplastes o si dicha cianobacteria se encontraba
asociada a otros microorganismos. Las imágenes obtenidas por SEM indican la
presencia de distintos bacilos unidos a la envoltura exopolisacárida (EPS) de la
cianobacteria (Figura 3C). Las secciones ultrafinas de las mismas muestras, muestran
las diferentes bacterias heterotróficas en el interior de la matriz de EPS y en asociación
con Microcoleus chthonoplastes (Figura 3D). Este último fácilmente reconocible por la
presencia de tilacoides, estructuras membranosas que contienen los pigmentos
fotosintéticos (Figura 3A).
En la figura 3B, se pueden observar además unas inclusiones electrodensas. Aunque aún
no se ha demostrado la naturaleza de estas inclusiones, algunos autores han descrito
estructuras similares en otros microorganismos cuando crecen en presencia de petróleo
(Singer y Finnerty, 1984).
En la imagen obtenida por SEM, se observan dos de los morfotipos de bacterias
heterotróficas en contacto con la vaina polisacárida de Microcoleus chthonoplastes

72
Aislamiento y caracterización de un consorcio de microorganismos con capacidad para degradar petróleo
(Figura 3C). La media de los diámetros de los tres tipos de bacterias obtenidas por TEM
fueron: tipo I 0.30 µm con una desviación estándar de 0.033; tipo II 0.22 µm con una
desviación estándar de 0.026 y el tipo III 0.50 µm con una desviación estándar de
0.060. La abundancia relativa fue de 76.5, 15.5 y 8% respectivamente.
Determinación de las condiciones de cultivo que favorecen el crecimiento óptimo
de Microcoleus consorcio.
Una vez caracterizado el consorcio, se ensayaron diferentes condiciones de cultivo
numeradas del 1 al 8 (Tabla 1), para determinar en primer lugar su dependencia a la luz
y al O2. Además se ensayaron como fuentes de carbono la presencia de carbonatos o el
petróleo.
En dicha tabla se observa que Microcoleus consorcio presenta un crecimiento
óptimo en presencia de luz, en anaerobiosis y con petróleo como única fuente de
carbono (cultivo 1). Dado que en condiciones anaeróbicas y cuando el consorcio se
incuba en ausencia de luz (cultivos 5 y 7), no existe crecimiento del consorcio,
deducimos que los microorganismos heterotróficos son aeróbicos, por lo tanto dependen
del oxígeno producido por Microcoleus chthonoplastes.
En ningún cultivo los microorganismos heterótrofos del consorcio crecieron en
ausencia de luz, aunque estuvieran presentes en el medio mineral Pfenning los
carbonatos (cultivos 6 y 7) o el petróleo (cultivos 5 y 8), lo que demuestra una total
dependencia de éstos hacia la cianobacteria.
Identificación de los microorganismos que constituyen el consorcio por técnicas
moleculares:
Aunque las técnicas microscópicas y en especial el TEM permitieron determinar los
tipos morfológicos de las distintas bacterias heterotróficas que formaban el consorcio,
se utilizó el RNA ribosómico 16S para su completa identificación.
El estudio se realizó a partir de los cultivos de Microcoleus consorcio crecidos en
medio mineral Pfenning y de cultivos crecidos en presencia de petróleo.
73
Aislamiento y caracterización de un consorcio de microorganismos con capacidad para degradar petróleo
La figura 4 muestra los resultados de la DGGE del cultivo control y del
contaminado con el petróleo, donde se pueden observar diferencias entre ambas
muestras.
Además, los resultados indican que los microorganismos heterotróficos
identificados pertenecen a grupos con capacidad para fijar nitrógeno. Éstos además
están repartidos en diferentes grupos filogenéticos, tales como las subclases Alfa, Beta y
Gamma del grupo Proteobacteria y del grupo CBF (Figura 5). El consorcio utilizado
como control estaba en cambio dominado por un microorganismo (88% de los clones)
muy afín a Pseudoxanthomonas mexicana (con una similitud del 99.8%) (Tabla 2).
Discusión:
El CLSM, se ha utilizado en muchas ocasiones para caracterizar e identificar a las
cianobacterias en ambientes naturales y artificiales bentónicos, con un alto grado de
resolución. También en el presente trabajo se ha utilizado para identificar la
cianobacteria del consorcio como Microcoleus chthonoplastes (Solé et al. 2003, Diestra
et al. 2005). Por otro lado, el SEM y el TEM (particularmente este último) han
permitido la determinación de la abundancia relativa de cada uno de los
microorganismos heterotróficos del consorcio y la caracterización ultraestructural del
mismo.
El uso de estas técnicas microscópicas de alta resolución, no solo han permitido la
caracterización de los microorganismos que conforman el consorcio, sino también
determinar la ubicación de los microorganismos heterótrofos, dentro del mucílago que
rodea a Microcoleus chthonoplastes.
No obstante para la identificación de las bacterias heterotróficas se utilizaron
además técnicas moleculares (Sánchez et al. 2005). Los resultados demuestran que las
bacterias asociadas a Microcoleus chthonoplastes, desarrolladas en presencia de
petróleo, pertenecen a las siguientes familias: Rhizobiaceae (Rhizobium sp.,
Agrobacterium tumefaciens, 26,6%), Rhodobacteraceae (Thioclava pacifica,
Roseobacter sp., 28, 7%), Phyllobacterisceae (Parvibaculum lavamentivorans, 13,9%) y
Xhantomonadaceae (Pseudoxanthomonas japonensis, 11,7%).
74
Aislamiento y caracterización de un consorcio de microorganismos con capacidad para degradar petróleo
En los cultivos que crecieron en ausencia de petróleo, la bacteria heterotrófica
Pseudoxanthomonas mexicana era la más abundante 87,7% y pertenece a la familia
Xhantomonadaceae.
En el presente trabajo se demuestra que varias secuencias de los genes 16S rRNA
recuperadas de las bibliotecas genéticas corresponden a microorganismos fijadores de
nitrógeno (Tabla 3).
Secuencias de Rhizobium sp. y Agrobacterium sp. se detectaron en los cultivos
desarrollados en presencia de petróleo. Pseudomonas stutzeri ha sido detectado tanto en
cultivos controles como en cultivos contaminados con el crudo. Este microorganismo
fija el nitrógeno en condiciones de microaerofilia y en estado libre (Desnoues et al.
2003). Se especula mucho sobre el papel de estos microorganismos como abastecedores
de nitrógeno para el desarrollo de Microcoleus sp. bajo ciertas condiciones. Además se
ha demostrado que Rhizobium sp. y Agrobacterium sp. son bacterias degradadoras de
petróleo (Lebkowska et al. 1995, Frassineti et al. 1998). Estos estudios están de acuerdo
con los de otros autores que demuestran la tendencia de las cianobacterias a formar
consorcios (Paerl y Pinckney 1996) y a los realizados por Steppe (2001) que demuestran
la existencia de bacterias epifitas fijadoras de nitrógeno asociadas a Microcoleus sp.
Los resultados sugieren que los microorganismos asociados a Microcoleus
chthonoplastes, podrían realizar la fijación del nitrógeno y la degradación de los
hidrocarburos, mientras que Microcoleus chthonoplastes proporcionaría un hábitat y
oxígeno a las bacterias heterotróficas.
Por otra parte se ha demostrado que el consorcio está implicado en la degradación
de los compuestos heterocíclicos alifáticos del petróleo Maya (García de Oteyza et al.
2004). Así mismo ni este último ni el petróleo Casablanca tienen ningún efecto tóxico
sobre Microcoleus consorcio, siendo el primero el que potencia el crecimiento de dicho
consorcio.
Por otra parte se ha demostrado que aunque el consorcio se desarrolle tanto en
presencia de petróleo Casablanca como en el Maya, degrada especialmente los
compuestos heterocíclicos alifáticos como los alquiltiolanos y los alquiltianos
(compuestos azufrados) del petróleo Maya. Estos resultados son importantes desde el
punto de vista ambiental, ya que este crudo es muy tóxico.
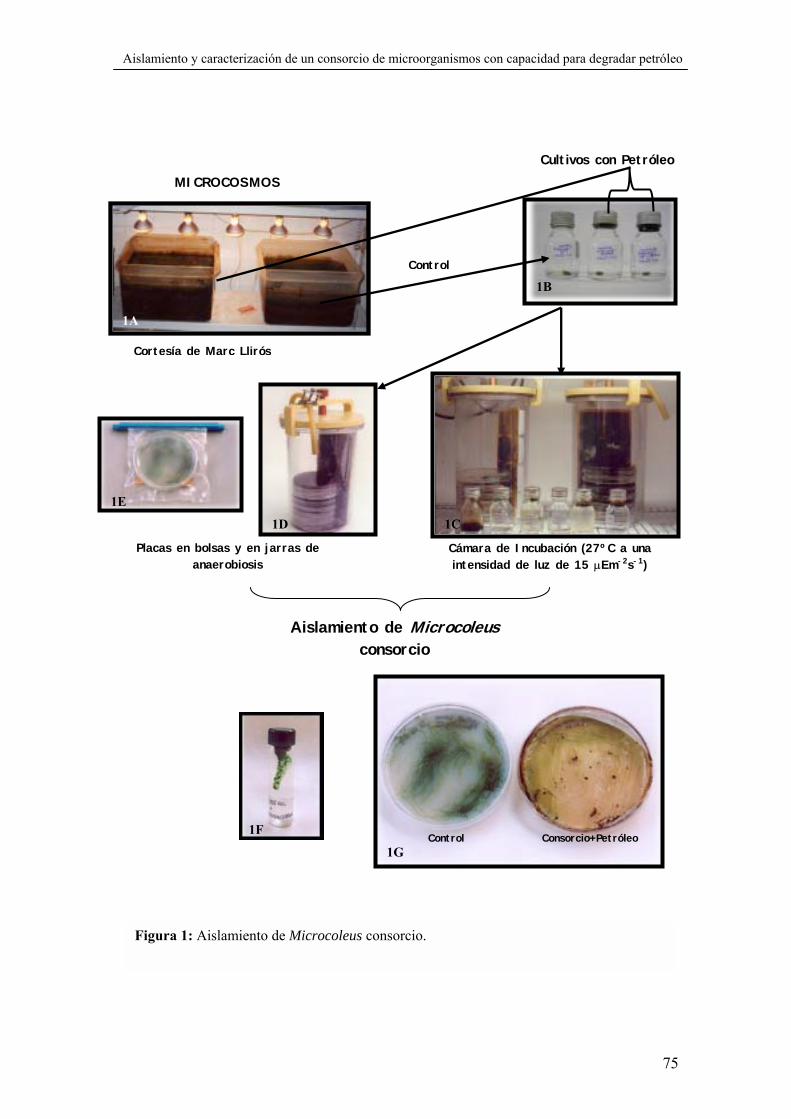
75
Aislamiento y caracterización de un consorcio de microorganismos con capacidad para degradar petróleo
Placas en bolsas y en jarras de anaerobiosis
Control
1A
Cortesía de Marc Llirós
MICROCOSMOS Cultivos con Petróleo
1B
Cámara de Incubación (27ºC a una intensidad de luz de 15 µEm-2s-1)
1C1D
1E
Control Consorcio+Petróleo
Aislamiento de Microcoleus consorcio
1F
1G
Figura 1: Aislamiento de Microcoleus consorcio.

76
Aislamiento y caracterización de un consorcio de microorganismos con capacidad para degradar petróleo
Fig. 2B Fig. 2C Fig. 2A
Fig. 2D Fig. 2E
Figura 2: 2A. Microcoleus consorcio adherido al petróleo Maya. 2B. Microcoleus consorcio en colonias aisladas en cultivo control. 2C. Microcoleus consorcio, creciendo en presencia del crudo. 2D. Filamentos de Microcoleus chthonoplastes entre gotas de petróleo. 2E. Filamentos de Microcoleus chthonoplastes.

77
Aislamiento y caracterización de un consorcio de microorganismos con capacidad para degradar petróleo
Fig. 3D
Fig. 3B
Fig. 3A
Fig. 3C
a
b
Figura 3: 3A. Sección ultrafina de Microcoleus chthonoplastes, las flechas señalan los tilacoides (1µm). 3B. Sección ultrafina de Microcoleus chthonoplastes de cultivos contaminados con petróleo. Las flechas indican la presencia de las inclusiones electrodensas (500µm). 3C. (a y b) Microorganismos heterotróficos adheridos a la vaina exopolisacárida de Microcoleus chthonoplastes (1µm). 3D. Microorganismos heterótrofos dentro de la vaina exopolisacárida de Microcoleus chthonoplastes (1µm).
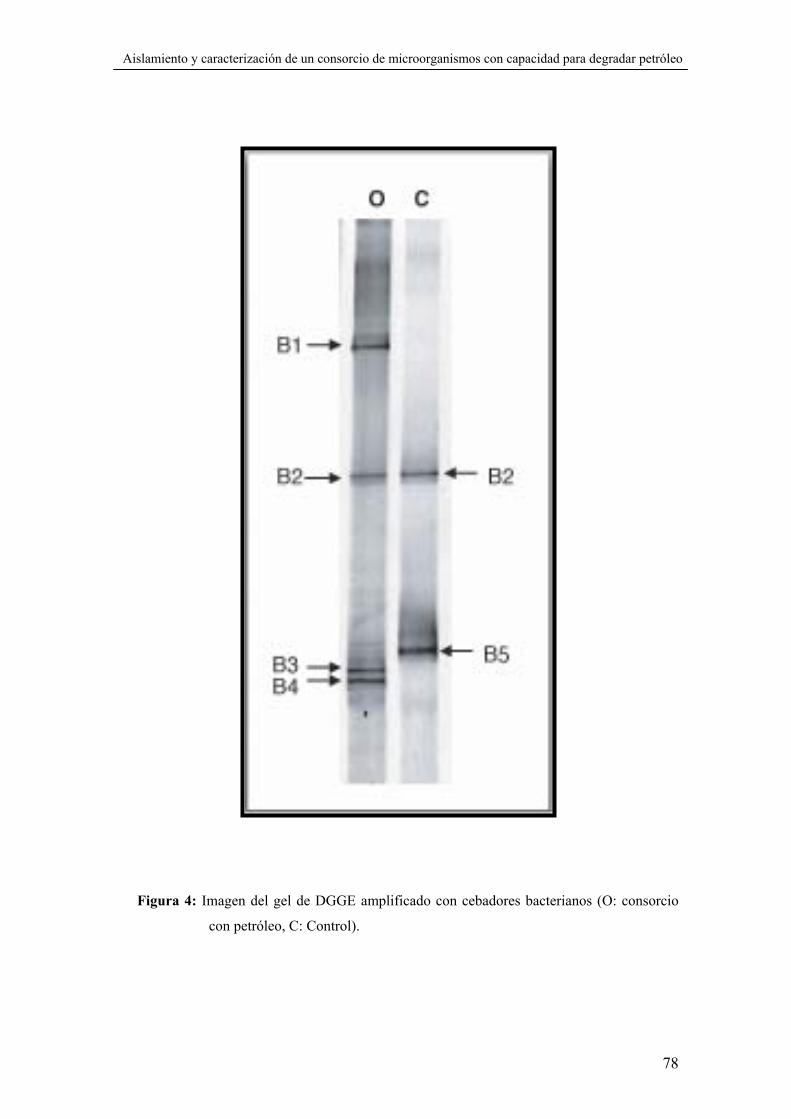
78
Aislamiento y caracterización de un consorcio de microorganismos con capacidad para degradar petróleo
Figura 4: Imagen del gel de DGGE amplificado con cebadores bacterianos (O: consorcio
con petróleo, C: Control).

79
Aislamiento y caracterización de un consorcio de microorganismos con capacidad para degradar petróleo
Figura 5: Árbol filogenético, incluyendo las secuencias de dos librerías genéticas (O: consorcio con petróleo, C: control). La barra indica el 10% de similitud de la secuencia. Las secuencias que aparecen en el gel de DGGE y las librerías genéticas se marcan en rectángulos grises.

80
Aislamiento y caracterización de un consorcio de microorganismos con capacidad para degradar petróleo
Tabla 1: Cultivos de Microcoleus consorcio bajo diferentes condiciones de crecimiento.
Fuente de Carbono Cultivo Luz O2
CO3- Petróleo
Crecimiento
1
2
3
4
5
6
7
8
+
+
+
+
-
-
-
-
-
+
-
+
-
+
-
+
-
-
-
+
-
+
+
-
+
+
-
-
+
-
-
+
++++
++
+
+
-
-
-
-
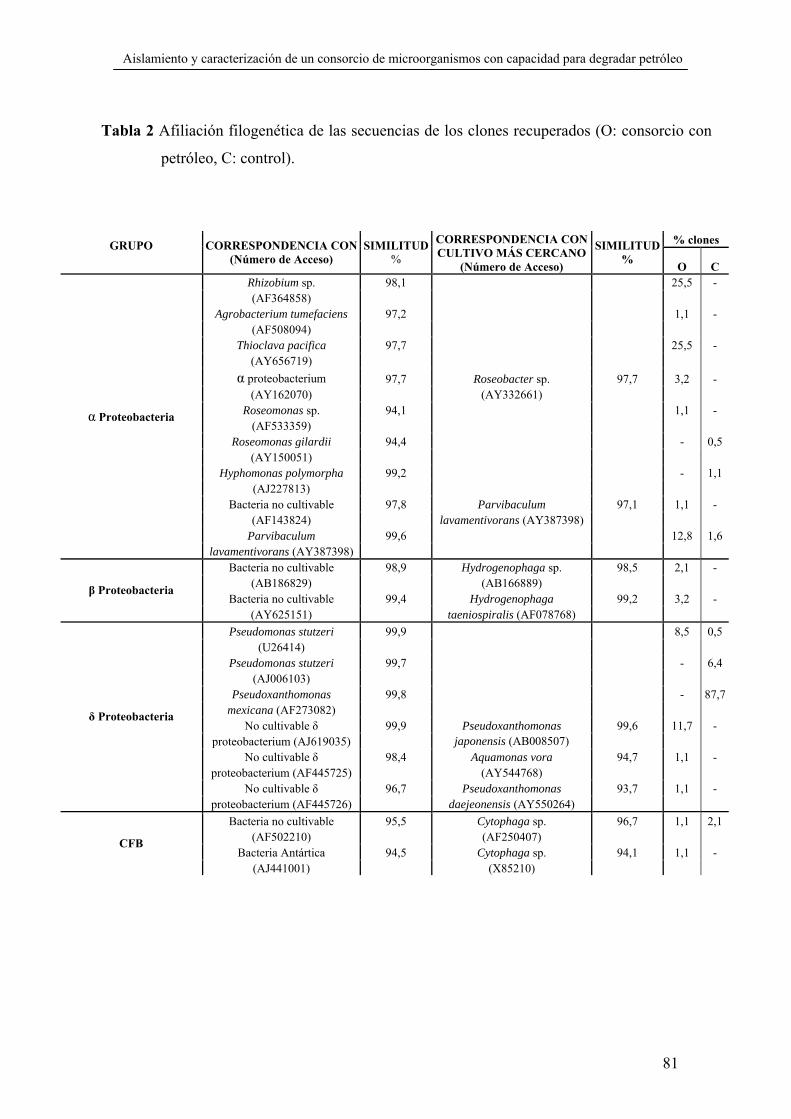
81
Aislamiento y caracterización de un consorcio de microorganismos con capacidad para degradar petróleo
Tabla 2 Afiliación filogenética de las secuencias de los clones recuperados (O: consorcio con
petróleo, C: control).
% clones GRUPO
CORRESPONDENCIA CON
(Número de Acceso) SIMILITUD
%
CORRESPONDENCIA CON CULTIVO MÁS CERCANO
(Número de Acceso)
SIMILITUD% O C
Rhizobium sp. 98,1 25,5 - (AF364858)
Agrobacterium tumefaciens 97,2 1,1 - (AF508094)
Thioclava pacifica 97,7 25,5 - (AY656719)
α proteobacterium 97,7 Roseobacter sp. 97,7 3,2 - (AY162070) (AY332661)
Roseomonas sp. 94,1 1,1 - (AF533359)
Roseomonas gilardii 94,4 - 0,5 (AY150051)
Hyphomonas polymorpha 99,2 - 1,1 (AJ227813)
Bacteria no cultivable 97,8 Parvibaculum 97,1 1,1 - (AF143824) lavamentivorans (AY387398)
Parvibaculum 99,6 12,8 1,6
α Proteobacteria
lavamentivorans (AY387398) Bacteria no cultivable 98,9 Hydrogenophaga sp. 98,5 2,1 -
(AB186829) (AB166889) Bacteria no cultivable 99,4 Hydrogenophaga 99,2 3,2 -
β Proteobacteria
(AY625151) taeniospiralis (AF078768) Pseudomonas stutzeri 99,9 8,5 0,5
(U26414) Pseudomonas stutzeri 99,7 - 6,4
(AJ006103) Pseudoxanthomonas 99,8 - 87,7
mexicana (AF273082) No cultivable δ 99,9 Pseudoxanthomonas 99,6 11,7 -
proteobacterium (AJ619035) japonensis (AB008507) No cultivable δ 98,4 Aquamonas vora 94,7 1,1 -
proteobacterium (AF445725) (AY544768) No cultivable δ 96,7 Pseudoxanthomonas 93,7 1,1 -
δ Proteobacteria
proteobacterium (AF445726) daejeonensis (AY550264) Bacteria no cultivable 95,5 Cytophaga sp. 96,7 1,1 2,1
(AF502210) (AF250407) Bacteria Antártica 94,5 Cytophaga sp. 94,1 1,1 -
CFB
(AJ441001) (X85210)
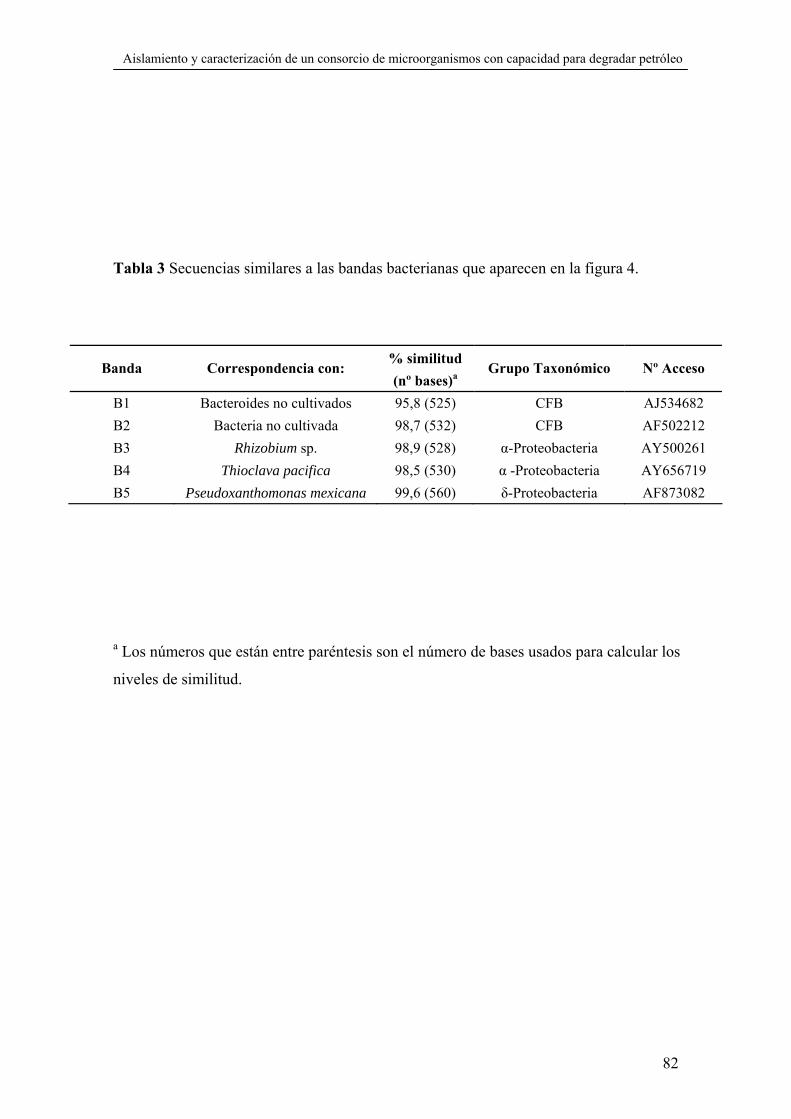
82
Aislamiento y caracterización de un consorcio de microorganismos con capacidad para degradar petróleo
Tabla 3 Secuencias similares a las bandas bacterianas que aparecen en la figura 4.
a Los números que están entre paréntesis son el número de bases usados para calcular los
niveles de similitud.
% similitud Banda Correspondencia con:
(nº bases)a Grupo Taxonómico Nº Acceso
B1 Bacteroides no cultivados 95,8 (525) CFB AJ534682 B2 Bacteria no cultivada 98,7 (532) CFB AF502212 B3 Rhizobium sp. 98,9 (528) α-Proteobacteria AY500261 B4 Thioclava pacifica 98,5 (530) α -Proteobacteria AY656719 B5 Pseudoxanthomonas mexicana 99,6 (560) δ-Proteobacteria AF873082

84
Conclusiones
Conclusiones:
1. El CLSM es la técnica microscópica que mejores resultados ha dado en la
caracterización e identificación de las cianobacterias de los tapetes microbianos.
Este tipo de microscopía que utiliza una fuente de luz láser, permite realizar
secciones ópticas de pocos milímetros de grosor en sedimentos compactados,
como son los tapetes microbianos, a la vez que detecta la autofluorescencia
producida por las cianobacterias “in vivo” y con escasa manipulación de la
muestra. Así mismo, a partir de las imágenes obtenidas por el CLSM, se ha
podido determinar los perfiles de biomasa de las cianobacterias, aplicando
técnicas de análisis de imagen, donde el programa Image J 1.33f es el que ofrece
mayor precisión e información.
Los tapetes microbianos estudiados responden a diferentes grados de
contaminación por petróleo, lo que ha permitido hacer un estudio comparativo
de la influencia de éste en la selección de las poblaciones de cianobacterias.
2. En los ambientes no contaminados por petróleo (delta del Ebro, Salins-de-
Giraud y Colònia de Sant Jordi) se han identificado tanto cianobacterias
filamentosas (Microcoleus chthonoplastes, Oscillatoria sp. Lyngbya sp.,
Limnothrix sp.) como unicelulares (Gloeocapsa sp., Chroococcus sp,
Synechocystis sp.). Los valores más altos de biomasa total se encontraron en la
capa óxica.
3. En los tapetes microbianos de las Islas Orkney (Swanbister y Waulkmill bay)
poco contaminados por petróleo, se identificaron principalmente cianobacterias
unicelulares correspondientes al grupo Pleurocapsa. La concentración máxima
de biomasa total de cianobacterias, en el caso de Swanbister bay, se localizó
entre 0 y 1.55 mm (14,84 mgC/cm3 de sedimento), y en el caso de Waulkmill
bay, entre 1.85 y 3.2 mm (19,72 mgC/cm3 de sedimento).
85
Conclusiones
4. En Etang de Bêrre, tapete microbiano permanentemente contaminado por
petróleo, se caracterizaron e identificaron exclusivamente cianobacterias de tipo
filamentoso, y se observó una disminución de biomasa total a lo largo del tapete.
Lyngbya sp. fue la cianobacteria más abundante, con una biomasa individual de
22, 52 mgC/cm3 de sedimento entre 0 y 1.25 mm.
5. En los ecosistemas artificiales de Eilat (Mesocosmos), se observó que la
cianobacteria dominante fue Microcoleus chthonoplastes tanto en las muestras
control como en las contaminadas por el petróleo Casablanca. Además se pudo
observar, que las cianobacterias unicelulares se detectaron solo en los tapetes
contaminados, aunque en muy baja concentración.
6. Microcoleus chthonoplastes es la cianobacteria dominante en la mayoría de los
tapetes microbianos estudiados. Se trata de una cianobacteria ubicua que tolera
altos niveles de contaminación por petróleo. En ambientes no contaminados,
como los tapetes de Salins-de-Giraud se encuentra tanto en las capas óxicas
(31.22 mgC/cm3 de sedimento) como anóxicas (28.91 mgC/cm3 de sedimento) y
en presencia de H2S, lo que indica además la versatilidad metabólica de dicha
cianobacteria.
7. Se ha aislado Microcoleus consorcio, una agrupación estable de
microorganismos, que presenta unas condiciones óptimas de crecimiento cuando
se cultiva en medio Pfenning en presencia de petróleo y en anaerobiosis, a 27ºC
y con una intensidad de luz de 15 µEm-2s-1.
8. La caracterización del consorcio por técnicas microscópicas de alta resolución
revelan que Microcoleus consorcio está formado por una cianobacteria
Microcoleus chthonoplastes y diferentes bacterias heterotróficas que se
encuentran en el interior de la envuelta exopolisacárida de la cianobacteria.
86
Conclusiones
9. Se ha visto que los microorganismos heterotróficos identificados mediante las
técnicas moleculares fueron en su mayoría fijadoras de nitrógeno y que
pertenecen a varios grupos filogenéticos como a las α, β y γ, subclases de
Proteobacteria, y al grupo CFB.
10. Los resultados del apartado anterior junto con los obtenidos del crecimiento del
consorcio en diferentes condiciones de cultivo (presencia y ausencia de luz,
oxígeno y fuente de carbono) demuestran que Microcoleus chthonoplastes
proporciona probablemente oxígeno a las bacterias heterotróficas y que éstas
fijan el nitrógeno, que suministran a la cianobacteria, a la vez que degradan el
petróleo.
11. De las conclusiones anteriores se podría deducir, que en los ambientes naturales
y también en los artificiales las cianobacterias en general toleran la presencia del
petróleo, aún cuando se producen cambios en las poblaciones y en su biomasa
por el efecto del crudo.
En el caso de Microcoleus chthonoplastes, la cianobacteria dominante, se ha
demostrado que ésta además degrada las fracciones más tóxicas del petróleo
Maya, por su acción conjunta con microorganismos heterotróficos, con los que
forma un consorcio.

88
Referencias Bibliográficas
Referencias Bibliográficas:
1. Abed R. M., García-Pichel F. & Hernández-Mariné M. (2002a) Polyphasic
characterization of benthic, moderately halophilic, moderately thermophilic
cyanobacteria with very thin trichomes and the proposal of Halomicronema
excentricum gen. nov., sp. nov. Arch. Microbiol. 177: 361-370.
2. Abed R. M. M., Safi N. M. D., Köster J., de Beer D., El-Nahhal Y., Rullköter J.
& García-Pichel F. (2002b) Microbial diversity of a heavily polluted microbial
mats and its community changes following degradation of petroleum compounds.
Appl Environ Microbiol. 68: 1674-1683.
3. Abed R. M. M. & Köster J. (2005) The direct role of aerobic heterotrophic bacteria
associated with cyanobacteria in the degradation of oil compounds. Int Biodeterior
Biodegrad. 55: 29-37.
4. Abellá C. A., Cristine X. P., Martínez A., Pibernat I. & Vila, X. (1998) Two new
motile phototrophic consortia: “Chlorochromatium lunatum” and “Pelochromatium
selenoides”. Arch Microbiol. 169: 452-459.
5. Al-Hasan R. H., Sorkhoh N. A., Al-Bader D. & Radwan, S.S. (1994) Utilization
of hydrocarbons by cyanobacteria from microbial mats on oily coasts of the Gulf.
Appl Microbiol Biotechnol. 41: 615-619.
6. Al-Hasan, R.H., Al-Bader, D., Sorkhoh, N.A. & Radwan, S.S. (1998) Evidence
for n-alkane consumption and oxidation by filamentous cyanobacteria from oil-
contaminated coasts of the Arabian Gulf. Mar Biol. 130, 521-527.
7. Al-Hasan, R.H.,Khanafer M., Eliyas M. & Radwan, S.S. (2001) Hydrocarbon
accumulation by picocianobacteria from the Arabian Gulf. J Appl Microbiol. 91:
531-540.
8. Altschul S. F., Madden T. L., Shäfer A. A., Zhang J, Zhang Z., Miller W. &
Lipman D. J. (1997) Gapped BLAST and PSI-BLAST: a new generation of protein
database search programs. Nucleic Acids Res. 25: 3389-3402.
9. Bebout, M. & García-Pichel, F. (1995) UV-B. Induced vertical migrations of
cyanobacteria in microbial mats. Appl. Environ. Microbiol. 61: 4215-4222.
89
Referencias Bibliográficas
10. Benlloch S., López-López A., Casamayor E. O., Ovreas L., Goddard V., Daae,
F. L., Smerdon G., Massana R., Joint I., Thingstad F., Pedros-Alio C. &
Rodriguez-Valera, F. (2002) Prokaryotic genetic diversity throughout the salinity
gradient of a coastal solar saltern. Environ. Microbiol. 4: 349-360.
11. Bergman B., Gallon J. R., Rai A. N. & Stal, L.J. (1997) N2 fixation by non–
heterocystous cyanobacteria. FEMS Microbiol. Ecol. 19: 139-18.
12. Brock T. D. (1978) The habitats. Thermophilic microorganisms and life at high
temperatures, Springer-Verlag. New York.
13. Campbell S. E. (1979) Soil stabilization by a prokaryotic desert crust: implications
for Precambrian land biota. Orig. Life 9: 335-348.
14. Canfield D. E. & Des Marais D. J. (1991) Aerobic sulfate reduction in microbial
mats. Science 251:1471-1473.
15. Casamayor E. O., Massana R., Benlloch S., Ovreas L., Diez B., Goddard V. J.,
Gasol J. M., Joint I., Rodríguez-Valera F. & Pedrós-Alió C. (2002) Changes in
archaeal, bacterial and eukaryal assemblages along a salinity gradient by
comparison of genetic fingerprinting methods in a multipond solar saltern. Appl
Environ Microbiol. 4: 338-348.
16. Castenholz R. W. (2001) Phylum BX. Cyanobacteria. Oxygenic photosynthetic
bacteria. In: Boone DR, Castenholz RW (Eds.) Bergey’s Manual of Systematic
Bacteriology. The Archea and the Deeply Branching and Phototrophic Bacteria, vol
1. Springer, Berlin, pp 473–599.
17. Caumette P., Matheron R., Raymond N. & Relexans J. C. (1994) Microbial mats
in the hypersaline ponds of Mediterranean salterns (Salins-de-Giraud, France).
FEMS Microbiol Ecol. 13: 273-286.
18. Cohen, Y. & Rosenberg E. (1989) Photosynthesis in cyanobacterial mats and its
relation to the sulfur cycle. pp. 22-36. In: Microbial mats, physiological ecology of
benthic microbial communities. A model for microbial sulfur interactions. Am. Soc.
Microb. Washington, D. C.
19. Cohen Y. (2002) Bioremediation of oil by marine microbial mat. Int Microbiol.
5(4): 189-193.

90
Referencias Bibliográficas
20. d'Amelio E. D., Cohen Y. & Des Marais, D. J. (1987) Association of a new type
of gliding, filamentous, purple phototrophic bacterium inside bundles of
Microcoleus chthonoplastes in hypersaline cyanobacterial mats. Arch Microbiol.
147: 213-220.
21. de Philippis R., Margheri M. C., Materassi R. & Vincenzini M. (1998) Potential
of unicellular cyanobacteria from saline environments as exopolysaccharide
producers. Appl. Environ. Microbiol. 64: 1130-1132.
22. de Wit R. & van Gemerden H. (1987) Oxidation of sulfide to thiosulfate by
Microcoleus chthonoplastes. FEMS Microbiol Lett. 45: 7-13.
23. Decho, A.W. (1990) Microbial exopolymer secretions in ocean environments: their
role(s) in food webs and marine process. Oceanogr Mar Bio. Ann. Rev. 28: 73-153.
24. Demergasso C., Chong G., Galleguillos P., Escudero L., Esteve I. & Martínez-
Alonso M. (2003) Tapetes microbianos del Salar de Llamará, Norte de Chile.
Revista Chilena de Historia Natural. 76: 485-499.
25. Desnoues N., Lin M., Guo X., Ma L., Carreno-López R. & Elmerich C. (2003)
Nitrogen fixation genetics and regulation in a Pseudomonas stutzeri strain
associated with rice. Microbiology. 149: 2251-2262.
26. Diestra E., Solé A. & Esteve I. (2004). A comparative study of cyanobacterial
diversity in polluted and unpolluted microbial mats by jeans CLSM. Ophelia 58 (3):
151-156.
27. Diestra E., Solé A., Martí M., García de Oteyza T., Grimal J. O. & Esteve I.
(2005) Characterization of an oil-degrading Microcoleus consortium by means of
confocal laser scanning microscopy, scanning electron microscopy and transmission
electron microscopy. Scanning. 27: 176-180.
28. Epping E. H. G., Khalili A. & Thar R. (1999) Photosynthesis and the dynamics of
oxygen consumption in a microbial mat as calculated from transient oxygen
microprofiles. Limnol Oceanogr. 44:1936–1948.
29. Esteve I., Montesinos E., Mitchell J. G. & Guerrero R. (1990) A quantitative
ultrastructural study of Chromatium minus in the bacterial layer of Lake Cisó
(Spain). Arch Microbiol. 153: 316-323.

91
Referencias Bibliográficas
30. Esteve I., Martínez M., Mir J. & Guerrero, R. (1992) Typology and structure of
microbial mats communities in Spain: A preliminary study. Limnetica 8: 185-195.
31. Esteve I., Cevallos D., Martínez-Alonso M., Gaju N. & Guerrero, R. (1994)
Development of versicolored microbial mats: Succession environmental
significance. NATO ASI Series. G-35: 415-420.
32. Ferris M. J., Muyzer G. & Ward D. M. (1996) Denaturing gradient gel
electrophoresis profiles 16s rRNA-defined populations inhabiting a hot spring
microbial mat community. Appl Environ Microbiol. 62: 340-346.
33. Fourçans A., García de Oteyza T., Wieland A., Solé A., Diestra E., van
Bleijswijk J., Grimalt J. O., Kühl M., Esteve I., Muyzer G., Caumette P. &
Durán, R. (2004). Characterization of functional bacterial groups in a hypersaline
microbial mat community (Saline-de-Giraud, Camargue, France). FEMS Microbial
Ecol. 51: 55-70.
34. Fourçans A., Solé A., Diestra E., Ranchau-Peyruse A., Esteve I., Caumette P. &
Durán, R. Vertical migrations of phototrophic bacterial populations in a hypersaline
microbial mat from Saline-de-Giraud (Camargue, France).Submitted to FEMS
Microbial Ecol.
35. Frassinetti S., Setti L., Corti A., Farrinelli P., Montevechi P. & Vallini G.
(1998) Biodegradation of dibenzothiophene by a nodulating isolate of Rhizobium
melilote. Can J Microbiol. 44 (3): 289-297.
36. Fuhrman J. A., McCallen K. & Davis A. A. (1993) Phylogenetic diversity of
substrate marine microbial communities from the Atlantic and Pacific oceans. Appl
Environ Microbiol. 59: 1294-1302.
37. García de Oteyza Tirso. (2003) Procesos de fotooxidación y biodegradación por
tapices microbianos en petróleos. Departamento de Química Ambiental. Instituto de
Investigaciones Químicas y Ambientales de Barcelona. Tesina-Proyecto de Tesis.
38. García de Oteyza T., Grimalt J. O., Diestra E., Solé. A. & Esteve I. (2004)
Changes in the composition of polar and apolar crude oil fractions Ander the action
of Microcoleus consortia. Appl Microbiol Biotechnol. 66: 226-232.

92
Referencias Bibliográficas
39. García-Pichel F. & Castenholz R. W. (1991) Characterization and biological
implication of scytonemina a cyanobacterial sheath pigment. J Phycol. 27: 395-409.
40. García-Pichel F., Mechling M. & Castenholz R. W. (1994) Diel migrations of
microorganims within a benthic, hypersaline mat community. Appl. Environ.
Microbiol. 60: 1500-1511.
41. García-Pichel F., Prufert-Bebout L. & Muyzer, G. (1996) Phenotypic and
cosmopolitan cyanobacterium. Appl. Environ. Microbiol. 62: 3284-3291.
42. García-Pichel F., López- Cortés A. & Nübel U. (2001) Phylogenetic
morphological diversity of cyanobacteria in soil desert crusts from the Colorado
Plateau. Appl. Environ. Microbiol. 67: 1902-1910.
43. Giani D., Seeler J., Giani L. & Krumbein, W. E. (1989) Microbial mats and
physicochemistry in a saltern in the Bretagne (France) and in a laboratory scale
saltern model. FEMS Microbiol. Ecol. 62: 151-162.
44. Gray J. P. & Herwing R. P. (1996) Phylogenetic analysis of the bactrrial
communities in marine sediments. Appl Environ Microbiol. 62: 4049-4059.
45. Groetzinger J. P. & Knoll A. H. (1999) Stromatolites in Precrambian carbonates:
evolutionary milepost or environmental dipsticks? Ann Earth Planet Sci. 27: 313-
358.
46. Harry M., Gambier B., Bourezgui Y & Garnier-Sillam E. (1999) Evaluation of
purification procedures for DNA extracted from organic samples: interferences with
humic substances. Analysis 27: 439-442.
47. Herbert R. A (1985) Development of mass blooms of photo-synthetic bacteria on
sheltered beaches in Scapa Flow, Orkney Islands. Proc Roy Soc Edinburgh 87B:15-
25.
48. Huettel M., Forster S., Klöser S. & Fossing H, (1996) Vertical migration in the
sediment-dwelling sulphur bacteria Thioploca spp. In overcoming diffusion
limitations. Appl Environ Microbiol 1863-1872.
49. Johnson I. (1999) Fluorescent probes for living cells. Histochemical Journal. 30:
123-140.

93
Referencias Bibliográficas
50. Krekeler D., Teske A. & Cypionka H. (1998). Strategies of sulphate-reducing
bacteria to escape oxygen stress in a cyanobacterial mat. FEMS Microbiol Ecol. 25:
89-96.
51. Kühl M & Fenchel T. (2000) Bio-optical characteristics and vertical distribution of
photosynthetic pigments and photosynthesis in an artificial cyanobacterial mat.
Microb Ecol. 40:85-93
52. Lebkowska M., Kawowska E & Miaskiewicz E. (1995) Isolation and
identification of bacteria from petroleum derivatives contaminated soil. Act
Microbiol Pol. 44 (3-4): 297-303.
53. Llirós M., Munill X., Solé A., Martínez-Alonso M., Diestra E. & Esteve, I.
(2003). Analysis of cyanobacteria biodiversity in pristine and non polluted microbial
mats in microcosms by confocal laser scanning microscopy (CLSM). In: Science,
Technology and Education of Microscopy: an Overview, p. 483-489. In A. Mendez-
Vilas (ed.) FORMATEX Microscopy Book Series. Vol 1.
54. López-Cortés A., García-Pichel F., Nübel U. & Vázquez-Juárez R. (2001)
Cyanobacterial diversity in extremal environments in Baja California, México: A
polyphasic study. Int. Microbiol. 4: 227-236.
55. Ludwig W., Strunk O., Klugbauer S., Klugbauer N., Weinzenegger M.,
Neumaier J., Bachleitner M. & Schleifer K. H (1998) Bacterial phylogeny based
on comparative sequences análisis. Electrophoresis. 19: 554-568.
56. Maidak B. L., Cole J. R., Lilburnt T. G., Parker C. T. Jr., Sarman P. R.,
Stredwick J. M., Garrity G. M., Li B., Olsen G. S., Pramarik S., Schmidt J. M.
& Tiedje J. M. (2000). The RDP (Ribosomal Data Project) continues. Nucleic
Acids Res.28: 73-174.
57. Margulis L., López Baluja L., Awramik S. M.& Sagan D. (1986) Community
living long befote man: Fósil and living microbial mats and earthy life. Sci Total
Environ. 56: 379-397.
58. Martin A. P. (2002) Phylogenetic approaches communities. Appl Environ
Microbiol. 68: 3673-3682.

94
Referencias Bibliográficas
59. Massana R., Murray A. E., Preston M. & DeLong E. F. (1997) Vertical
distribution and phylogenetic characterization of marine planktonic Archea in the
Santa Barabara Chanel. Appl Environ Microbiol. 63: 50-56.
60. Mazor G., Kidron, G. J., Vonshak A. & Abeliovich, A. (1996) The role of
cyanobacterial exoploysaccharides in structuring desert microbial crusts. FEMS
Microbiol. Ecol. 21: 121-130.
61. Medina S. A., Huerta Ochoa S. & Gutierrez-Rojas M. (2005) Hydrocarbon
biodegradation in oxygen-limited sequential batch reactors by consortium from
weathered oil-contamined soil. Can J Microbiol./ Rev Can Micorbiol. 51 (3): 231-
239.
62. Mejharaj M., Singleton I., McClure N. C. & Naidu R. (2000) Influence of
petroleum hydrocarbon contamination on micro algae and microbial activities in a
long-term contaminated soil. Arch. Environ. Contam. Toxicol. 38: 439-445.
63. Menezes S. A., de Oliveira Camargo F. A., Okeke B. C. & Frankenberger W.
T. Jr. (2005) Diversty of biosurfactant producing microoganisms isolated from soil
contaminated with diesel oil. Microbiol Res. 160 (3): 249-255.
64. Miller S. R. & Bebout B. M. (2004) Variation in Sulfide Tolerance of Photosystem
II in Phylogenetically Diverse Cyanobacteria from Sulfidric Habitats. Appl.
Environ. Microbiol. 70: 736-744.
65. Miloning G. (1961) Advantages of phosphate buffer OsO4 solutions in fixation. J
Appl Phys. 32: 1637.
66. Mir J., Martínez-Alonso M., Esteve I. & Guerrero, R. (1991) Vertical
stratification and microbial assemblage of a microbial mat in the Ebro Delta (Spain).
FEMS Microbiol. Ecol. 86: 59-68.
67. Mir J. & Esteve I. (1992) The SEM in microbial ecology. Microsc Anal. 29: 31-
33.
68. Moezelaar R., Bijvank S. M. & Stal, L. (1996) Fermentation and sulfur reduction
in the mat-building cyanobacterium Microcoleus chthonoplastes. Appl. Environ.
Microbiol. 62: 1752-1758.
69. Moore L. R., Rocap G. & Chisholm S. W. (1998). Physiology and molecular
phylogrny of coexisting. Prochlorococcus ecotypes. Nature. 393: 464-467.

95
Referencias Bibliográficas
70. Muyzer G., Brinkhoff T., Nübel U., Santegoeds C., Schäfer H. & Wawer C.
(1998) Denaturing gradient gel electroforesis (DGGE) in microbial ecology. In:
Akkermans A. D.L, van Elsas J. D., Breeijn F. J. (eds.). Molecular microbial
ecology manual. Kluver Academic Publishers, Dordrecht. The Netherlands, pp.
3.4.4/ 1-27.
71. Nelson D. C., Revsbech N. P.& J∅rgensen B. B. (1986a) Microoxic-anoxic niche
of Beggiatoa spp.: microelectrode survey of marine and freshwater strains. Appl
Environ Microbiol. 52: 161-168.
72. Nelson D. C., J∅rgensen B. B. & Revsbech N. P. (1986b) Growth pattern and
yield of a chemoautotrophic Beggiatoa sp. In oxygen-sulfide microgradients. Appl
Environ Microbiol. 52: 225-233.
73. Nogués C., Martí M., Boada M. & Ponsà M. (1994). A simple method for
processing individual oocytes and embryos for electron microscopy. J. Microsc.
174: 51-54.
74. Oren A. & Shilo M. (1979) Anaerobic heterotrophic dark metabolism in the
cyanobacterium Oscillatoria limnetica and lactate fermentation. Arch Microbiol.
122: 77-84.
75. Paerl H. W & Pinckney J. L. (1996) Microbial consortia: Their roles in aquatic
production and biogeochemical cycling. Microb Ecol. 31: 225-247.
76. Paerl H. W., Pinckney J. L. & Steppe T. F. (2000) Cyanobacterial-bacterial mat
consortia: examining the functional unit of microbial survival and growth in extreme
environments. Environ Microbiol. 2 (1): 11-26.
77. Radwan S. S. & Al-Hasan R. H. (2000) Oil pollution and cyanobacteria, p. 307-
319. In: Whitton B. A: & Potts M. (ed.). The ecology of cyanobacteria. Kluwer
Academic Oublishers, Dordretch, The Netherlands.
78. Raghukumar C., Vipparty V., David J. J. & Chandramohan D. (2001)
Degradation of crude oil by marine cyanobacteria. Appl Microbiol Biotechnol. 57
(3): 433-436.
79. Ramsing N. B., Ferris M. J. & Ward D. M. (2000) Highly ordered vertical of
Synechococcus population within the one-millimeter-thick photic zone of a hot
spring cyanopbacterial mat. Appl Environ Microbiol. 66 (3): 1038-1049.

96
Referencias Bibliográficas
80. Raskin L., Stromley J. M., Rittman B. E. & Stahl D. A. (1994) Group-specific
16S rRNA hybridization probes to describe natural communities of methanogens.
Appl Environ Microbiol. 60: 1232-1240.
81. Ravenschlag K., Sahm K., Pernthaler J & Amann R. (1999) High bacterial
diversity in permanently cold marine sediments. Appl Environ Microbiol. 65: 3982-
3989.
82. Reynolds E. S. (1963). The use of lead citrate at high pH as an electron-opaque
stain in electron microscopy. J. Cell Biol. 17: 208-212.
83. Richardson L. L. & Castenholz R. W. (1987) Diel vertical movements of the
cyanobacterium Oscillatoria terebriformis in a sulfide-rich microbial mat. Appl.
Environ. Microbiol. 53: 2142-2150.
84. Richardson, L. L. (1996) Horizontal and vertical migration patterns of Phormidium
corallyticum and Beggiatoa spp. associated with black-band disease of corals.
Microb. Ecol. 32: 323-335.
85. Sánchez O., Diestra E., Esteve I. & Mas J. (2005) Molecular characterization o
fan oil-degradin cyanobacterial consortium. Microbiol Ecol. 000-000.
86. Schauer M., Massana R. & Pedrós-Alió C. (2000) Spatial differences in
bacterioplankton composition along the catalan coast (NW Mediterranean) assessed
by molecular fingerprinting. FEMS Microbial Ecol. 33: 51-59.
87. Schopf J. W. (2000) Solution to Darwin´s dilemma: discovery of the missing
Precrambian record of life. Proc Acad Sci USA. 97 (13): 6947-6953.
88. Singer M. E. & Finerty N. R. (1984) Microbial metabolism of straight-chain and
branched alkanes. In: Petroleum Microbiology (Ed. Atlas R. M.) Mac Millan
Oublishing Co., New York. 1: 1-53
89. Solé A., Gaju, N., Guerrero R. & Esteve I. (1998) Confocal laser scanning
microscopy of Ebro Delta microbial mats. Microsc. Anal. 29: 13-15.
90. Solé A., Gaju N., Mendez-Álvarez S. & Esteve, I. (2001) Confocal laser scanning
microscopy as a tool to determine cyanobacteria biomass in microbial mats. J.
Microscopy. 204: 258-262.
91. Solé A., Gaju N. & Esteve I. (2003) The biomass dynamics of cyanobacteria in an
annual cycle determined by confocal laser scanning microscopy. Scanning. 25: 1-7.

97
Referencias Bibliográficas
92. Solé A., Mas J. & Esteve I. Computerised image análisis for measuring
cyanobacterial biomasa by confocal laser scanning microscopy. Submitted to J
Microscopy.
93. Sorkhoh N. A., Al-Hasan R. H: Khanafer M. & Radwan S. S: (1995)
Establishment of oil-degrading bacteria associated with cyanobacteria in oil-polluted
soil.J Appl. Bacteriol. 78 (2): 194-199.
94. Stahl D. A. & Amann R. I. (1991) Development and application of nucleic acid
probes.IN: Stackebrandt E., Goodfellow M (eds.) Nucleic acid techniques in
bacterial systematics, Wiley, New York. N. Y. pp. 205-248.
95. Stal L. J. (1994) Microbial mats in coastal environments. In Microbial Mats. Stal,
L.J., and Caumette, P. (eds). Berlin Heidelberg: Springer-Verlag, pp. 21-32.
96. Stal L. J & Moezellar R. (1997) Fermetation in cyanobacteria. FEMS Microbial
Rev. 21: 179-211.
97. Steppe T. F., Pincknry J. L., Dybe J. & Paerl H. W. (2001) Diazotrophy in
modern marine bahamian stromatolites. Microbial Ecol. 42: 36-44.
98. Thar, R. & Kühl M. (2001) Motility of Marinochromatium gracile in response to
light, oxygen, and sullfide. Appl Environ Microbiol. 67: 5410-5419.
99. Teske A., Ramsing N. B., Habicht K., Fukui M., Kuver J., J∅rgensen B. B. &
Cohen Y. (1998) Sulfate-reducing bacteria and their activities in cyanobacterial
mats of solar lake (Sinai, Egypt). Appl Environ Microbiol. 64: 2943-2951.
100. van Gemerden H.& Beeftink H. H. (1981) Coexistence of Chlorobium and
Chromatium in a sulphide-limited continuous culture. Arch Microbiol. 129: 32-34.
101. van Gemerden H.& Beeftink H. H. (1983) Ecology of hotrophic bacteria, In:
Studies in Microbiology (Ed. Ormerod J. G.) Blackwell Scientific Publications,
Cambridge. 146-185.
102. Villbrandt M. & Stal L. J. (1996) The effect of sulfide on nitrogen fixation in
heterocystous and non-heterocystous cyanobacterial mat communities. Algol Stud.
83: 549-563.
103. Vitousek P. M., Mooney H. A., Lubchenko J. & Melillo J. M. (1997) Human
domination of earth’s ecosystems. Science. 277: 494-499.
104. Whale G. F. & Walsby A. E. (1984) Motility of the cyanobacterium
Microcoleus chthonoplastes in mud. Phycol. J. 19: 117-123.
98
Referencias Bibliográficas
105. Wieland A. & Kühl M. (2000) Irradiance and temperature regulation of
oxygenic photosynthesis and O2 consumption in a hypersaline cyanobacterial mat
(Solar Lake, Egypt). Mar Biol. 137:71–85.
106. Wieland A., Kühl M., McGowan L., Fourçans A., Duran R., Caumette P.,
García de Oteyza T., Grimalt J. O., Solé A., Diestra E., Esteve I. & Herbert, R.
A. (2003). Microbial Mats on the Orkney Islands Revisited: Microenvironment and
Microbial Community Composition. Microb Ecol. 46: 371-390.
107. Wieland A., Zopfi J., Benthien M. & Kühl, M. (2005) Biogeochemistry of an
iron-rich hypersaline microbial mat (Camargue, France). Microb Ecol. 49: 34-49.
108. Woese C. R. (1987) Bacterial Evolution. Microbiol Rev 51: 221-271.
Agradecimientos
Es una tarea difícil el agradecer a todas las personas que han contribuido en la
realización de este trabajo, la verdad es que no existen palabras para poder demostrar y
expresar todo mi agradecimiento.
En primer lugar, agradezco a mi directora de tesis, la Dra. Isabel Esteve, ya que
gracias a ella he tenido la oportunidad de realizar esta tesis doctoral, jamás terminaré de
agradecerle todo el apoyo y cariño brindado. He de mencionar a Toni, que también es
director de esta tesis, muchas gracias por el apoyo y por haberme enseñado el uso de mi
herramienta de trabajo el “CLSM”, en general gracias por todo!!!
Agradezco también al Servei de Microscòpia, especialmente a Mercé y Onofre, ya
que han sido ellos quienes me han orientado y enseñado durante estos años. Así mismo,
agradezco al Dr. Jordi Mas y a la Dra. Olga Sánchez por la colaboración y ayuda
prestada en cada momento, muchas gracias.
No podía dejar de agradecer a mi mami, que es por ella que he llegado hasta aquí,
su empeño y lucha han permitido y permite que mis hermanos y yo salgamos adelante.
He de agradecer a mi papi por apoyarme siempre, y a mis niños Cesarín, Karito y
Mariana espero que de alguna manera u otra se puedan sentir orgullosos de mí. Esta
tesis está dedicada a ustedes, mi verdadera inspiración. Los amo y mil gracias familia
por estar siempre conmigo!!!
Espero que a partir de ahora no me olvide de agradecer a nadie, si lo hago porfi
perdonarme, es la parte final y me emociono de solo saber que ya falta casi nada para
poder encuadernar la tesis…
No podía dejar de mencionar a mis amigos del alma, a quienes quiero con locura,
Eva y Leo, la verdad es que tendría que escribir páginas y páginas para decir gracias,
gracias, gracias…, pero comprenderán es una tesis doctoral y no un libro de
agradecimientos, ES BROMA (típico en mí, no?). Les deseo lo mejor del mundo y
siempre, siempre los voy a llevar dentro de mi “bobo”.
A mis amigas, churris y compañeras de laboratorio: Almu y Miris. Almu, cariño,
espero que en estas breves líneas queden plasmadas la gracias que he de darte, pero
mejor serán apuchorrones, no? Gracias por saber escucharme y sobre todo por realizar
las siembras de mis bebes (Microcoleus consorcio) durante este último año. Te quiero
corazón!!! Miris, mi ÑIÑA, piensa que eres un ser maravilloso y que te mereces lo

mejor, eres única e irremplazable. Sigue luchando por lo que quieres y sabes que cuando
necesites de alguien cuentas conmigo. Te quiero bixo.
Eli, gracias por ayudarme cuando lo necesité, te he llegado a coger un cariño enorme.
Gracias por todo bombón, como diría nuestra locumbeta.
Lidia, CUCHI, no me podía olvidar de ti. Con lo bien que nos lo pasábamos tomando
“coffe” con Marc y Toni. A veces echo tanto de menos aquellos momentos, gracias por
brindarme tu amistad.
Maira, gracias por haberme dedicado siempre un tiempito espero y deseo de corazón
que las cosas te salgan de maravilla.
Marc, fuiste la primera persona con quien empecé a trabajar en el “labo”, gracias por
haber sido tan amable conmigo, espero y deseo de corazón que te vaya bien por Gerona.
Quisiera mencionar también a todos mis amigos, incluidos los que están en Perú,
que a pesar de estar a más de 6000 Km. se que están conmigo. Maggy, Johi, Ruby, Ceci,
Carlos, Maribel, Raquel, Raúl, María, Carla, Sole…a todos mil gracias.
Todas las personas que he mencionado son especiales y cada una de ellas tienen un
lugar en mi corazón, pero me gustaría agradecer a esa personita que es tan especial para
mí, le agradezco que se haya preocupado por mí a lo largo de todo este tiempo. Te
adoro con toda mi alma, y mil gracias por haberme aconsejado y por haber estado allí
siempre, necesitaría más de cuatro líneas para agradecerte, en fin gracias!

Artículos publicados correspondientes al trabajo experimental realizado.

1
1
2
3
4
5
6
7
8
9
MOLECULAR CHARACTERIZATION OF AN OIL-DEGRADING 10
CYANOBACTERIAL CONSORTIUM 11
12
Olga Sánchez*, Elia Diestra, Isabel Esteve, and Jordi Mas 13
14
Departament de Genètica i Microbiologia, Universitat Autònoma de Barcelona, 15
08193 Bellaterra, Spain 16
17
18
19
20
21
An article submitted to: Microbial Ecology (13/6/05) 22
23
24
25
26
Running title: Oil-degrading Microcoleus chthonoplastes consortium 27
*Correspondence to: O. Sánchez, Departament de Genètica i Microbiologia, 28
Facultat de Ciències, Universitat Autònoma de Barcelona, 08193 Bellaterra, 29
Spain. Phone: 34-935813011. Fax: 34-935812387. E-mail: 30

2
Abstract 1
2 Recent studies have shown that the cyanobacterium Microcoleus 3
chthonoplastes forms a consortium with heterotrophic bacteria present within 4
the cyanobacterial sheath. These studies also show that this consortium is able 5
to grow in the presence of crude oil, degrading aliphatic heterocyclic organo-6
sulphur compounds as well as alkylated monocyclic and polycyclic aromatic 7
hydrocarbons. In this work we characterize this oil-degrading consortium 8
through the analysis of the 16S rRNA gene sequences. We carried out the 9
study in cultures of Microcoleus grown in mineral medium and in cultures of the 10
cyanobacterium grown in mineral medium supplemented with crude oil. The 11
results indicate that most of the clones found in the polluted culture correspond 12
to well-known oil-degrading and nitrogen-fixing microorganisms, and belong to 13
different phylogenetic groups, such as the Alpha, Beta and Gamma subclasses 14
of Proteobacteria, and the CFB group. The control is dominated by one 15
predominant organism (88% of the clones) closely affiliated to 16
Pseudoxanthomonas mexicana (similarity of 99.8%). The presence of 17
organisms closely related to well-known nitrogen fixers like Rhizobium and 18
Agrobacterium suggests that at least some of the cyanobacteria-associated 19
heterotrophic bacteria are responsible of nitrogen fixation and degradation of 20
hydrocarbon compounds inside the polysaccharidic sheath, while Microcoleus 21
would provide a habitat and a source of oxygen and organic matter. 22
23
Keywords: Microcoleus, consortium, crude oil, biodegradation 24
3
Introduction 1
2
Studies carried out by several authors [5, 17] attribute to cyanobacteria an 3
important role in the biodegradation of organic pollutants. In fact, there is 4
evidence that microbial communities dominated by cyanobacteria can be 5
actively involved in oil degradation [2]. Observations made after oil spills in the 6
Arabian Gulf showed that cyanobacteria grew forming heavy thick mats on the 7
top of the sediments [4, 39]. Other studies have focused on the capacity of 8
cyanobacteria isolates to degrade hydrocarbons. Cerniglia et al [9, 10] observed 9
the degradation of naphthalene, a major component of the water-soluble 10
fraction of crude oil, and biphenyl, by the same strain of Oscillatoria. It has also 11
been reported that phenanthrene can be metabolized by the unicellular marine 12
cyanobacterium Agmenellum quadruplicatum [27]. Also, Oscillatoria salina, 13
Plectonema tenebrans and Aphanocapsa sp. degraded crude oil when grown in 14
artificial medium and natural seawater [32]. 15
However, it is by no means clear whether oil degradation is carried out by 16
cyanobacteria alone or by heterotrophic bacteria associated to cyanobacteria. 17
Some studies point to heterotrophic bacteria associated to cyanobacteria as co-18
responsible of hydrocarbon degradation. Al-Hasan et al [5] demonstrated that 19
non-axenic cyanobacterial samples containing Microcoleus chthonoplastes and 20
Phormidium corium consumed and oxidized n-alkanes. They found that 21
cyanobacterial growth steadily declined with progressive axenity, and they 22
identified four genera and species of associated heterotrophic bacteria able to 23
oxidize n-alkanes, such as Rhodococcus rhodochrous, Arthrobacter nicotianae, 24
Pseudomonas sp. and Bacillus sp., although cyanobacteria contributed directly 25
to hydrocarbon uptake and oxidation. On the other hand, Al-Hasan et al [6] 26
demonstrated that picocyanobacteria from the Arabian Gulf accumulated 27
hydrocarbons from the water body, but did not utilize these compounds, and the 28
authors assumed that associated bacteria may be carrying out the degradation 29
of these contaminants. Furthermore, Abed and Köster [1] confirmed that 30
Oscillatoria-associated aerobic heterotrophic bacteria were responsible for the 31
biodegradation of n-alkanes. 32
Recent studies have shown that Microcoleus chthonoplastes developed forming 33
a consortium with heterotrophic bacteria capable of biodegrading crude oil [16]. 34

4
This consortium was able to grow in the presence of sulphur-rich petroleum, 1
although the changes in crude oil composition were small, involving essentially 2
degradation of aliphatic heterocyclic organo-sulphur compounds such as 3
alkylthiolanes and alkylthianes. Also other group of compounds, such as the 4
alkylated monocyclic and polycyclic aromatic hydrocarbons underwent some 5
degree of transformation. Ultrathin sections of this cyanobacterium revealed the 6
presence of different bacterial morphotypes inside the polysaccharidic 7
Microcoleus sheath [13]. 8
In this work we used molecular techniques, such as Denaturing Gradient Gel 9
Electrophoresis (DGGE) and clone libraries, in order to characterize the 10
components of this consortium. 11
12
13
Methods 14
15
Microorganism and culture conditions 16
Microcoleus chthonoplastes was isolated from microcosms of Ebro Delta 17
microbial mats (Tarragona, Spain) polluted with Maya crude oil by means of 18
serial transfers in agar plates containing the mineral medium described by Van 19
Gemerden and Beeftink [42] as previously described by Diestra et al [13]. The 20
cultures were grown in anoxic conditions under a continuous light regime (15 21
µE.m-2.s-1) at 27ºC. Initially, our aim was the isolation of pure cultures of 22
Microcoleus, but microscopic observations by TEM (Transmission Electron 23
Microscopy) and SEM (Scanning Electron Microscopy) indicated the existence 24
of other bacteria growing in intimate contact with Microcoleus filaments. With 25
TEM, we observed heterotrophic bacteria growing within the polysaccharidic 26
sheath, while SEM allowed the visualization of bacteria adhered to Microcoleus 27
filaments [13]. 28
The consortium was grown on agar plates both with mineral medium containing 29
carbonate as the only carbon source and with the same medium lacking 30
carbonate and supplemented with 150 µl of Maya crude oil spread on top of the 31
plate. 32
33

5
DNA extraction 1
Nucleic acid extraction of cultures was performed as described by Massana et 2
al [24]. Samples of cyanobacterial biomass collected from the surface of the 3
plates were suspended in 2 ml of lysis buffer (50 mM Tris-HCl, pH 8.3; 40 mM 4
EDTA, pH 8.0; 0.75 M sucrose). 0,5-mm-diameter sterile glass beads were 5
added to the cultures, and vortexed in order to disrupt the filaments. DNA was 6
extracted using the lysis/phenol extraction method as described below. 7
Lysozyme (1 mg·ml-1 final concentration) was added and samples were 8
incubated at 37ºC for 45 min in slight movement. Then, sodium dodecyl 9
sulphate (1% final concentration) and proteinase K (0.2 mg·ml-1 final 10
concentration) were added and samples were incubated at 55ºC for 60 min in 11
slight movement. Nucleic acids were extracted twice with phenol-chloroform-12
isoamyl alcohol (25:24:1, vol:vol:vol), and the residual phenol was removed 13
once with choloroform-isoamyl alcohol (24:1, vol:vol). Nucleic acids were 14
purified, desalted and concentrated with a Centricon-100 concentrator 15
(Millipore). DNA integrity was checked by agarose gel electrophoresis, and 16
quantified using a low DNA mass ladder as a standard (Invitrogen). The same 17
extract of the two samples was splitted for analysis by DGGE and clone library. 18
19
PCR-DGGE fingerprinting 20
Fragments of the 16S rRNA gene suitable for DGGE analysis were obtained by 21
using the bacterial specific primer 358F with a 40 bp GC-clamp, and the 22
universal primer 907RM [26, 35]. PCR was carried out with a Biometra thermal 23
cycler using the following program: initial denaturation at 94°C for 5 min; 10 24
touchdown cycles of denaturation (at 94°C for 1 min), annealing (at 65–55°C for 25
1 min, decreasing 1°C each cycle) and extension (at 72°C for 3 min); 20 26
standard cycles (annealing at 55°C, 1 min) and a final extension at 72°C for 5 27
min. 28
Primers 344f-GC and 915r were used for archaeal 16S rRNA amplification [33, 29
37]. The PCR protocol included an initial denaturation step at 94 ºC for 5 min, 30
followed by 20 touchdown cycles of denaturation (at 94 ºC for 1 min), annealing 31
(at 71 to 61 ºC for 1 min, decreasing 1 ºC each cycle), and extension at 72 ºC 32
for 3 min. This procedure was followed by 15 additional cycles at an annealing 33
6
temperature of 61 ºC. During the last cycle of the program, the length of the 1
extension step was 10 min [8]. 2
PCR mixtures contained 1-10 ng of template DNA, each deoxynucleoside 3
triphosphate at a concentration of 200 µM, 1.5 mM MgCl2, each primer at a 4
concentration of 0.3 µM, 2.5 U Taq DNA polymerase (Invitrogen) and PCR 5
buffer supplied by the manufacturer. BSA (Bovine Serum Albumin) at a final 6
concentration of 600 µg·ml-1 was added to minimize the inhibitory effect of 7
humic substances [18]. The volume of reactions was 50 µl. PCR products were 8
verified and quantified by agarose gel electrophoresis with a low DNA mass 9
ladder standard (Invitrogen). 10
The DGGE was run in a DCode system (Bio-Rad) as described by Muyzer et al 11
[26]. A 6% polyacrylamide gel with a gradient of DNA-denaturant agent was 12
cast by mixing solutions of 0% and 80% denaturant agent (100% denaturant 13
agent is 7 M urea and 40% deionized formamide). Seven hundred ng of PCR 14
product were loaded for each sample and the gel was run at 100 V for 18 h at 15
60°C in 1xTAE buffer (40 mM Tris [pH 7.4], 20 mM sodium acetate, 1 mM 16
EDTA). The gel was stained with SybrGold (Molecular Probes) for 45 min, 17
rinsed with 1xTAE buffer, removed from the glass plate to a UV-transparent gel 18
scoop, and visualized with UV in a Gel Doc EQ (Bio-Rad). 19
Prominent bands were excised from the gels, resuspended in milli-q water 20
overnight, reamplified and purified using a High Pure PCR Product Purification 21
Kit (Roche) for its sequencing. 22
23
Clone library and RFLP analysis 24
For cloning, bacterial 16S rRNA gene was amplified between positions 27 and 25
1492 (Escherichia coli 16S rRNA gene sequence numbering), using the primers 26
27F (5’-AGA GTT TGA TCM TGG CTC AG-3’) and 1492R (5’-GGT TAC CTT 27
GTT ACG ACT T-3’). PCR mixtures contained 10 ng of template DNA, each 28
deoxynucleoside triphosphate at a concentration of 200 µM, 1.5 mM MgCl2, 29
each primer at a concentration of 0.3 µM, 2.5 U Taq DNA polymerase 30
(Invitrogen) and PCR buffer supplied by the manufacturer. Reactions were 31
carried out in an automated thermocycler (Biometra) with the following cycle: an 32
initial denaturation step at 94ºC for 5 min, followed by 30 cycles of 1 min at 33

7
94ºC, 1 min at 55ºC and 2 min at 72ºC, and a final extension step of 10 min at 1
72ºC. 2
The PCR product was cloned with the TOPO TA cloning kit (Invitrogen) 3
according to manufacturer’s instructions. Putative positive colonies were picked, 4
transferred to a multi-well plate containing Luria-Bertani medium and 7% 5
glycerol, and stored at –80ºC. Recombinant plasmids were extracted using the 6
QIAprep spin miniprep kit (QIAgen), following manufacturer’s instructions. 7
Purified plasmids were digested at 37ºC overnight with HaeIII (Invitrogen) and 8
the product was run in 2.5% low melting point agarose gel. The different band 9
patterns were chosen for partial sequencing. The coverage of the clone library 10
was calculated according to the following equation: C=1-(n/N), where n is the 11
number of unique clones and N is the total number of clones examined [34]. 12
13
Our choice of these primers (358F with a GC clamp and 907R for DGGE 14
analysis, and 27F and 1492R for clone libraries) was deliberate because they 15
do not amplify Microcoleus. We checked this using the match probe tool of the 16
ARB program package applying as target strings the primer sequences and 17
also with cultures of Microcoleus. This allowed us to eliminate the high 18
background of this dominant microorganism, since it could have interfered in the 19
final results. 20
21
rRNA sequencing 22
Sequencing reactions were performed by Macrogen (Korea) with the primers 23
907R for bacterial DGGE bands (approximately 500 bp in length), and 27F for 24
cloned 16S rRNA genes. They utilized the Big-dye Terminator version 3.1 25
sequencing kit and reactions were run in an automatic ABI 3730XL Analyzer – 26
96 capillary type. 27
Sequences were subjected to a BLAST search [7] to get a first indication of the 28
phylogenetic affiliation, and to the CHECK-CHIMERA program from RDP [22] to 29
determine potential chimeric artifacts. Sequences were aligned by using the 30
automatic alignment tool of the ARB program package 31
(http://www.mikro.biologie.tu-muenchen.de) [20]. Then partial sequences were 32
inserted into the optimized tree derived from complete sequence data by the 33
Quick add using parsimony tool, which does not affect the initial tree topology. 34

8
The resulting tree was pruned to save space and only the closest relatives were 1
retained. 2
3
Accession numbers 4
Forty-four 16S rRNA gene sequences were sent to the EMBL database 5
(http://www.ebi.ac.uk/embl) and received the following accession numbers: from 6
AJ871043 to AJ871081 for the clone library and from AJ870388 to AJ870392 7
for the DGGE bands (the detailed assignation for each sequence appears in 8
Fig. 2). 9
10
11 Results 12
13
Microcoleus chthonoplastes was grown both on agar plates containing mineral 14
medium with carbonate as the only carbon source, and on agar plates with the 15
same medium composition, except for carbonate, which had been omitted and 16
replaced by a small amount of crude oil. Cyanobacterial biomass was collected 17
from the surface of the plates and after DNA extraction, the diversity of the 16S 18
rRNA genes present in the samples was characterized by DGGE analyses and 19
also by sequencing the clone libraries built from each, the control (C) and the 20
oil-polluted (O) culture. 21
22
DGGE analysis of the consortium 23
DGGE analysis of the control and the oil polluted culture using the general 24
bacterial primers 344F-GC and 907R showed the existence of substantial 25
differences between samples (Fig. 1). Comparison of the two cultures 26
demonstrated that in both cases, the number of bands observed in the DGGE 27
gel was low (two bands in the control and four bands in the oil polluted culture), 28
indicating low diversity of microorganisms associated to Microcoleus. 29
30
Prominent bands were sequenced, and the closest matches (and percentages 31
of similarity) for the sequences retrieved were determined by a BLAST search 32
(Table 1). The number of bases used to calculate each similarity value is also 33
shown in Table 1 as an indication of the quality of the sequence. One of the 34

9
bands (B2), present in both samples, was related to an uncultured 1
Bacteroidetes microorganism. In the oil polluted sample (O), one of the most 2
intense bands (band B3) corresponded to a microorganism closely related to 3
Rhizobium sp. Another two bands appeared in this lane; they were related to an 4
uncultured Bacteroidetes microorganism (band B1) and to Thioclava pacifica 5
(Rhodobacteraceae, band B4). The control had also one prominent band (band 6
B5) closely related to Pseudoxanthomonas mexicana (Xanthomonadaceae). 7
8
Clone library construction and rRNA sequencing 9
DGGE is a fingerprinting technique that allows easy and fast comparison of 10
related microbial profiles, but sequences obtained from excised DGGE bands 11
are short and of variable quality, sufficient to determine broad phylogenetic 12
affiliations but inadequate to carry out a precise phylogenetic analysis. Thus, we 13
investigated the phylogenetic composition of the two samples (O and C) by 14
building two independent clone libraries. We obtained 94 and 187 clones for 15
samples O and C, which resulted in different RFLP patterns respectively. A 16
representative clone of each OTU (Operational Taxonomic Unit) was partially 17
sequenced. Their frequency in the library, the similarity values and their closest 18
relatives are listed in Table 2. The coverage of the libraries were 87,2 and 19
95,7% for samples O and C respectively. Members of the α and γ subclasses of 20
Proteobacteria were the main components of the two samples. 21
In general, groups of bacteria that could only be detected in the oil 22
contaminated sample included members of the Rhizobiaceae (Rhizobium and 23
Agrobacterium tumefaciens, 26%), members of the Rhodobacteraceae 24
(Thioclava pacifica and Roseobacter, 29%), as well as ß- Proteobacteria closely 25
related to Hydrogenophaga (5%). Only one species of α-Proteobacteria 26
identified as Hyphomonas polymorpha was unique to the control sample (1.1%). 27
The remaining sequences were found both in the control and in the polluted 28
sample although with different frequencies, and included members of the 29
families Pseudomonadaceae, Xanthomonadaceae, Phyllobacteriaceae and the 30
CFB group. It is remarkable that 88% of the clones in the control sample (C) 31
corresponded to Pseudoxanthomonas mexicana. In general, there was 32
agreement between the DGGE and the gene library data. Inclusion of all the 33
sequences in a phylogenetic tree indicates that all the DGGE band sequences 34

10
corresponded to several of the most abundant clones recovered from the library 1
(see Fig. 2). However, a relatively large number of clones, some of them quite 2
abundant, were not represented in the DGGE gel. 3
4
5
Discussion 6
7 Basically, our results demonstrate that bacteria associated to Microcoleus 8
chthonoplastes grown in the presence of crude oil belong to the following four 9
families: Rhizobiaceae (Rhizobium sp., Agrobacterium tumefaciens, 26.6%). 10
Rhodobacteraceae (Thioclava pacifica, Roseobacter sp., 28.7%), 11
Phyllobacteriaceae (Parvibaculum lavamentivorans, 13.9%) and 12
Xanthomonadaceae (Pseudoxanthomonas japonensis, 11.7%). In the control 13
culture grown in the absence of crude oil, the most abundant organism 14
(Pseudoxanthomonas mexicana, 87.7% of the clones) belongs to the family 15
Xanthomonadaceae. 16
Growth of heterotrophic bacteria associated to Microcoleus or other 17
cyanobacteria has been reported before [29]. Steppe et al [38] demonstrated 18
the existence of epiphytic nitrogen-fixing bacteria forming a diazotrophic 19
consortium with Microcoleus spp. This observation is particularly interesting 20
because Microcoleus, which does not have the capacity to fix nitrogen, is the 21
major constituent of marine microbial mats, well known for their ability to 22
proliferate in nitrogen deficient environments. 23
In a separate study, Olson et al [28] described a similar phenomenon in 24
cyanobacteria-dominated microbial aggregates embedded in the permanent ice 25
cover of Lake Bonney (Antartica) and in cyanobacterial mats found in soils 26
adajacent to the ice edge. Their microscopic observations revealed the 27
presence of heterotrophic bacteria associated to cyanobacteria and also 28
growing in their mucilaginous sheath. Based on the presence of nifH sequences 29
typical of heterotrophic organisms, the authors suggested that they were 30
probably contributing to nitrogen fixation. 31
In our case, several of the 16S rRNA sequences recovered from the gene 32
libraries correspond to nitrogen-fixing microorganisms. Two of these organisms 33
(Rhizobium and Agrobacterium) were only detected in the cultures of 34

11
Microcoleus which had been grown in the presence of oil. The third organism, 1
Pseudomonas stutzeri, found in the culture incubated with oil and also in the 2
control, fixes nitrogen under microaerophilic conditions in the free-living state 3
[12]. It is tempting to speculate about a possible role of these organisms as 4
nitrogen providers for growth of Microcoleus under the conditions tested. 5
6
There is evidence that some of the nitrogen-fixing species found (Rhizobium 7
and Agrobacterium) can also develop in oil-contaminated soils [3, 19, 31, 41]. 8
These publications pointed at the potential use of nodule-forming symbiotic 9
bacteria for oil bioremediation. 10
On the other hand, when the consortium was grown in the presence of oil, we 11
identified several clones closely related to Pseudomonas stutzeri. It was also 12
detected in the control, although at a lower percentage (7%). The genus 13
Pseudomonas has been associated extensively with the degradation of 14
petroleum compounds [23, 43]. Members of this group are able to degrade S- 15
and N-heterocyclic [15], alkanes and other polyaromatic hydrocarbons [26]. An 16
algal-bacterial consortium formed by Chlorella sorokiana and a Pseudomonas 17
migulae strain was able to degrade phenanthrene [25] in two-phase partitioning 18
bioreactors. Pseudomonas can also grow associated with cyanobacteria [5]. 19
Furthermore, Pseudomonas stutzeri was isolated from fuel-contaminated 20
Antarctic soils [14]; the authors pointed to a possible selection of diazotrophs, 21
since fuel-contaminated soils have adequate carbon but present nitrogen-22
limited conditions. 23
Several species of purple nonsulfur bacteria metabolize aromatic compounds 24
during phototrophic growth, including in particular the species 25
Rhodopseudomonas palustris, but also Rhodomicrobium vannieli, Rhodocyclus 26
purpureus, Phaeospirillum fulvum and Rhodobacter capsulatus [21]. We could 27
detect some members of the family Rhodobacteraceae in samples O and C, 28
although they seemed more abundant in the oil-polluted sample. 29
In addition, we could identify other minor groups capable of degrading 30
hydrocarbon compounds. Some clones shared a high similarity (99%) with 31
Parvibaculum lavamentivorans, a heterotroph that grow with octane and is able 32
to initiate catabolism of linear alkylbenzenesulfonate [36]. 33

12
It has also been described that the ß-Proteobacterium Hydrogenophaga sp., 1
which was detected in our oil-degrading consortium, can metabolize 4-2
aminobenzenesulfonate when growing in a mixed culture with Agrobacterium 3
[11]. 4
Pseudoxanthomonas mexicana was first described by Thierry et al [35]. Until 5
now, little is known about the physiology of this organism, beyond the fact that it 6
has a stricty respiratory metabolism and that it can reduce nitrite to N2O. 7
Exploration of the metabolic capabilities of this microorganism would be 8
essential in order to understand its ecological function in the consortium, 9
particularly the ability to degrade organic compounds. 10
11
In a recent study, Abed and Köster [1] evaluated the role of cyanobacteria and 12
their associated aerobic heterotrophic bacteria in biodegradation of petroleum 13
compounds. They found that five different cyanobacteria (Aphanothece 14
halophyletica, Dactyolococcopsis salina, Halothece strain EPUS, Oscillatoria 15
strain OSC, and Synechocystis strain UNIGA) were able to degrade n-alkanes, 16
while three isolates (Aphanothece halophyletica, Oscillatoria strain OSC and 17
Synechocystis strain UNIGA) degraded aromatic compounds. The authors 18
demonstrate that the heterotrophic bacteria associated with Oscillatoria strain 19
OSC are responsible for the observed biodegradation. The molecular analysis 20
of cultures of Oscillatoria grown on different petroleum model compounds 21
shows the presence of associated heterotrophic bacteria belonging to the γ 22
subclass of Proteobacteria. The control experiment (Oscillatoria culture without 23
model compounds) reveals the presence of a bacterial sequence from the 24
Cytophaga/Flavobacteria/Bacteroides group. 25
The metabolic capacities displayed by the organisms found in association with 26
Microcoleus in our study are in agreement with the type of degradation 27
previously reported for this consortium by Garcia de Oteyza et al [16]. 28
Summarizing, our findings suggest that the microorganisms associated with the 29
cyanobacterium Microcoleus chthonoplastes could be carrying out most of the 30
nitrogen fixation and degradation of hydrocarbon compounds inside the 31
polysaccharidic sheath. As discussed by other authors, degradation of 32
petroleum compounds is unlikely to be characteristic for cyanobacteria, 33

13
although they play an indirect role in mixed populations like microbial mats by 1
supporting the growth and activity of the actual degraders [1, 2]. 2
In general, as stated by Paerl and Pinckney [29], many prokaryotes develop 3
microbial consortial associations with other prokaryotes and eukaryotes 4
depending on their nutrient necessities. In our consortium Microcoleus would 5
provide a habitat and a readily available source of oxygen and organic matter 6
produced by excretion of photosynthates, cell lysis and decomposition, while 7
the accompanying bacteria would contribute to the consortium by fixing 8
nitrogen. Furthermore, the complete degradation of petroleum compounds to 9
CO2 can be used by cyanobacteria for photosynthesis. 10
11
12
Acknowledgments 13
14 This work was supported by grants BOS2000-0139, REN2000-0332-P4 and 15
DPI2003-0860-C03-02 from the Ministerio de Ciencia y Tecnología to J Mas. 16

14
References 1
2 1. Abed RMM, Köster J (2005) The direct role of aerobic heterotrophic 3
bacteria associated with cyanobacteria in the degradation of oil compounds. 4
Int Biodeter Biodegr 55: 29-37 5
2. Abed RMM, Safi NMD, Köster J, de Beer D, El-Nahhal Y, Rullkötter J, 6
Garcia-Pichel F (2002) Microbial diversity of a heavily polluted microbial mat 7
and its community changes following degradation of petroleum compounds. 8
Appl Environ Microbiol 68: 1674-1683 9
3. Aitken MD, Stringfellow WT, Nagel RD, Kazunga C, Chen SH (1998) 10
Characteristics of phenanthrene-degrading bacteria isolated from soils 11
contaminated with polycyclic aromatic hydrocarbons. Can J Microbiol 44: 12
743-752 13
4. Al-Hasan RH, Sorkhoh NA, Al-Bader DA, Radwan SS (1994) Utilization of 14
hydrocarbon by cyanobacteria from microbial mats on oily coasts of the 15
Gulf. Appl Microbiol Biotechnol 41: 615-619 16
5. Al-Hasan RH, Al-Bader DA, Sorkhoh NA, Radwan SS (1998) Evidence for 17
n-alkane consumption and oxidation by filamentous cyanobacteria from oil-18
contaminated coasts of the Arabian Gulf. Mar Biol 130: 521-527 19
6. Al-Hasan RH, Khanafer M, Eliyas M, Radwan SS (2001) Hydrocarbon 20
accumulation by picocyanobacteria from the Arabian Gulf. J Appl Microbiol 21
91: 533-540 22
7. Altschul SF, Madden TL, Schäffer AA, Zhang J, Zhang Z, Miller W, Lipman 23
DJ (1997) Gapped BLAST and PSI-BLAST: a new generation of protein 24
database search programs. Nucleic Acids Res 25: 3389-3402 25
8. Casamayor EO, Schäfer H, Bañeras Ll, Pedrós-Alió C, Muyzer G (2000) 26
Identification of and spatio-temporal differences between microbial 27
assemblages from two neighboring sulphurous lakes. Comparison by 28
microscopy and denaturing gel electrophoresis. Appl Environ Microbiol 66: 29
499-508 30

15
9. Cerniglia CE, Van Baalen C, Gibson DT (1980) Metabolism of naphthalene 1
by the cyanobacterium Oscillatoria sp., strain JCM. J Gen Microbiol 116: 2
485-494 3
10. Cerniglia CE, Van Baalen C, Gibson DT (1980) Oxidation of byphenyl by 4
the cyanobacterium Oscillatoria sp, strain JCM. Arch Microbiol 125:203-207 5
11. Dangmann E, Stolz A, Kuhm AE, Hammer A, Feigel B, Noisommit-Rizzi N, 6
Rizzi M, Reuss M, Knackmamss HJ (1996) Degradation of 4-7
aminobenzenesulfonate by a two-species baxcterial coculture. Physiological 8
interactions between Hydrogenphaga palleronii S1 and Agrobacterium 9
radiobacter S2. Biodegradation 7: 223-229 10
12. Desnoues N, Lin M, Guo X, Ma L, Carreño-López R, Elmerich C (2003) 11
Nitrogen fixation genetics and regulation in a Pseudomonas stutzeri strain 12
associated with rice. Microbiology 149: 2251-2262 13
13. Diestra E, Solé A, Martí M, Garcia de Oteyza T, Grimalt JO, Esteve I (2005) 14
Characterization of an oil-degrading Microcoleus consortium by means of 15
CLSM, SEM and TEM. Scanning 27 (in press) 16
14. Eckford R, Cook FD, Saul D, Aislabie J, Foght J (2002) Free-living 17
heterotrophic nitrogen-fixing bacteria isolated from fuel-contaminated 18
Antarctic soils. Appl Environ Microbiol 68: 5181-5185 19
15. Foght JM, Westlake WS (1998) Degradation of polycyclic aromatic 20
hydrocarbons and aromatic heterocycles by a Pseudomonas species. Can 21
J Microbiol 34: 1135-1141 22
16. Garcia De Oteyza T, Grimalt JO, Diestra E, Solé T, Esteve I (2004) 23
Changes in the composition of the polar and apolar crude oil fractions under 24
the action of Microcoleus consortia. Appl Microbiol Biotechnol 66: 226-232 25
17. Grötzschel S., Köster J, Abed RMM, de Beer D (2002) Degradation of 26
petroleum model compounds immobilized on clay by a hypersaline 27
microbial mat. Biodegradation 13: 273-283 28
18. Harry M, Gambier B, Bourezgui Y, Garnier-Sillam E (1999) Evaluation of 29
purification procedures for DNA extracted from organic samples: 30
interferences with humic substances. Analysis 27: 439-442 31
16
19. Lebkowska M, Karwowska E, Miaskiewicz E (1995) Isolation and 1
identification of bacteria from petroleum derivatives contaminated soil. Acta 2
Microbiol Pol 44: 297-303 3
20. Ludwig W, Strunk O, Klugbauer S, Klugbauer N, Weizenegger M, Neumaier 4
J, Bachleitner M, Schleifer KH (1998) Bacterial phylogeny based on 5
comparative sequence analysis. Electrophoresis 19: 554-568 6
21. Madigan MT, Jung DO, Resnick SM (2001). Growth of the purple bacterium 7
Rhodobacter capsulatus on the aromatic compound hippurate. Arch 8
Microbiol 175: 462-465 9
22. Maidak BL, Cole JR, Lilburn TG, Parker CTJr., Saxman PR, Stredwick JM, 10
Garrity GM, Li B, Olsen GJ, Pramanik S, Schmidt TM, Tiedje JM (2000). 11
The RDP (Ribosomal Database project) continues. Nucleic Acids Res 28: 12
73-174 13
23. Margesin R., Labbé D., Schinner F., Greer CW, Whyte LG (2003) 14
Characterization of hydrocarbon-degrading microbial populations in 15
contaminated and pristine alpine soils. Appl Environ Microbiol 69: 3085-16
3092 17
24. Massana, R., Murray AE, Preston M, DeLong EF (1997) Vertical distribution 18
and phylogenetic characterization of marine planktonic Archaea in the 19
Santa Barbara Channel. Appl Environ Microbiol 63: 50-56 20
25. Muñoz R, Guieysse B, Mattiasson B (2003) Phenanthrene biodegradation 21
by an algal-bacteria consortium in two-phase partitioning bioreactors. Appl 22
Microbiol Biotechnol 61: 261-267 23
26. Muyzer G, Brinkhoff T, Nübel U, Santegoeds C, Schäfer H, Wawer C. 24
(1998) Denaturing gradient gel electrophoresis (DGGE) in microbial 25
ecology. In: Akkermans ADL, van Elsas JD, Bruijn FJ (eds) Molecular 26
microbial ecology manual, Kluwer Academic Publishers, Dordrecht, The 27
Netherlans, pp. 3.4.4./1-27 28
27. Narro ML, Cerniglia CE, Van Baalen C, Gibson DT (1992) Metabolism of 29
phenanthrene by the marine cyanobacterium Agmenellum quadruplicatum 30
PR-6. Appl Environ Microbiol 58: 1351-1359 31

17
28. Olson JB, Steppe TF, Litaker RW, Paerl HW (1998) N2-fixing microbial 1
consortia associated with the Ice Cover of Lake Bonney, Antarctica. Microb 2
Ecol 36: 231-238 3
29. Paerl HW, Pinckney JL (1996) A mini-review of microbial consortia: their 4
roles in aquatic production and biogeochemical cycling. Microb Ecol 31: 5
225-247 6
30. Palleroni N (1993) Pseudomonas classification. Antonie Van Leeuwenhoek 7
64: 231-251 8
31. Prantera MT, Drozdowicz A, Gomes-Leite S, Soares-Rosado A (2002) 9
Degradation of gasoline aromatic hydrocarbons by two N2-fixing soil 10
bacteria. Biotechnol Lett 24: 85-89 11
32. Raghukumar C, Vipparty V, David JJ, Chandramohan D (2001) Degradation 12
of crude oil by cyanobacteria. Appl Microbiol Biotechnol 57: 433-436 13
33. Raskin L, Stromley JM, Rittmann BE, Stahl DA (1994) Group-specific 16S 14
rRNA hybridization probes to describe natural communities of 15
methanogens. Appl Environ Microbiol 60: 1232-1240 16
34. Ravenschlag K, Sahm K, Pernthaler J, Amann R (1999) High bacterial 17
diversity in permanently cold marine sediments. Appl Environ Microbiol 65: 18
3982-3989 19
35. Schauer M, Massana R, Pedrós-Alió C (2000) Spatial differences in 20
bacterioplankton composition along the Catalan coast (NW Mediterranean) 21
assessed by molecular fingerprinting. FEMS Microl Ecol 33: 51-59 22
36. Schleheck D, Tindall BJ, Rossello-Mora R, Cook AM (2004) Parvivaculum 23
lavamentivorans gen. nov., sp. nov., a novel heterotroph that initiates 24
catabolism of linear alkylbenzenesulfonate. Int J Syst Evol Microbiol 54: 25
1489-1497 26
37. Stahl DA, Amann RI (1991) Development and application of nucleic acid 27
probes. In: Stackebrandt E., Goodfellow M. (eds) Nucleic acid techniques in 28
bacterial systematics, Wiley, New York, NY, pp 205-248 29
18
38. Steppe TF, Olson JB, Paerl HW, Litaker RW, Belnap J (1996) Consortial N2 1
fixation: a strategy for meeting nitrogen requirements of marine and 2
terrestrial cyanobacterial mats. FEMS Microbiol Ecol 21: 149-156 3
39. Sorkhoh NA, Al-Hasan R, Radwan S, Hopner T (1992) Self-cleaning of the 4
Gulf. Nature 359:109 5
40. Suominen L, Jussila MM, Mäkeläinen K, Romantschuk M, Lindström K 6
(2000) Evaluation of the Galega-Rhizobium galegae system for the 7
bioremediation of oil-contaminated soil. Environ Pollut 107: 239-244 8
41. Thierry S, Macarie H, Iizuka T, Geissdorfer W, Assih EA, Spanevello M, 9
Verhe F, Thomas P, Fudou R, Monroy O, Labat M, Ouattara AS (2004) 10
Pseudoxanthomonas mexicana sp. nov, and Pseudoxanthomonas 11
japonensis sp. nov., isolated from diverse environments, and emended 12
descriptions of the genus Pseudoxanthomonas Finkmann et al. 2000 and of 13
its type species. Int J Syst Evol Microbiol 54: 2245-2255 14
42. Van Gemerden H, Beeftink HH (1983) Ecology of phototrophic bacteria. In: 15
Ormerod JG (ed) The phototrophic bacteria: anaerobic life in the light, 16
Blackwell Scientific Publications, Oxford, pp 146-185 17
43. Zhang H, Kallimanis A, Koukhou AI, Drainas C (2004) Isolation and 18
characterization of novel bacteria degrading polycyclic aromatic 19
hydrocarbons from polluted Greek soils. Appl Microbiol Biotechnol 65: 124-20
131 21
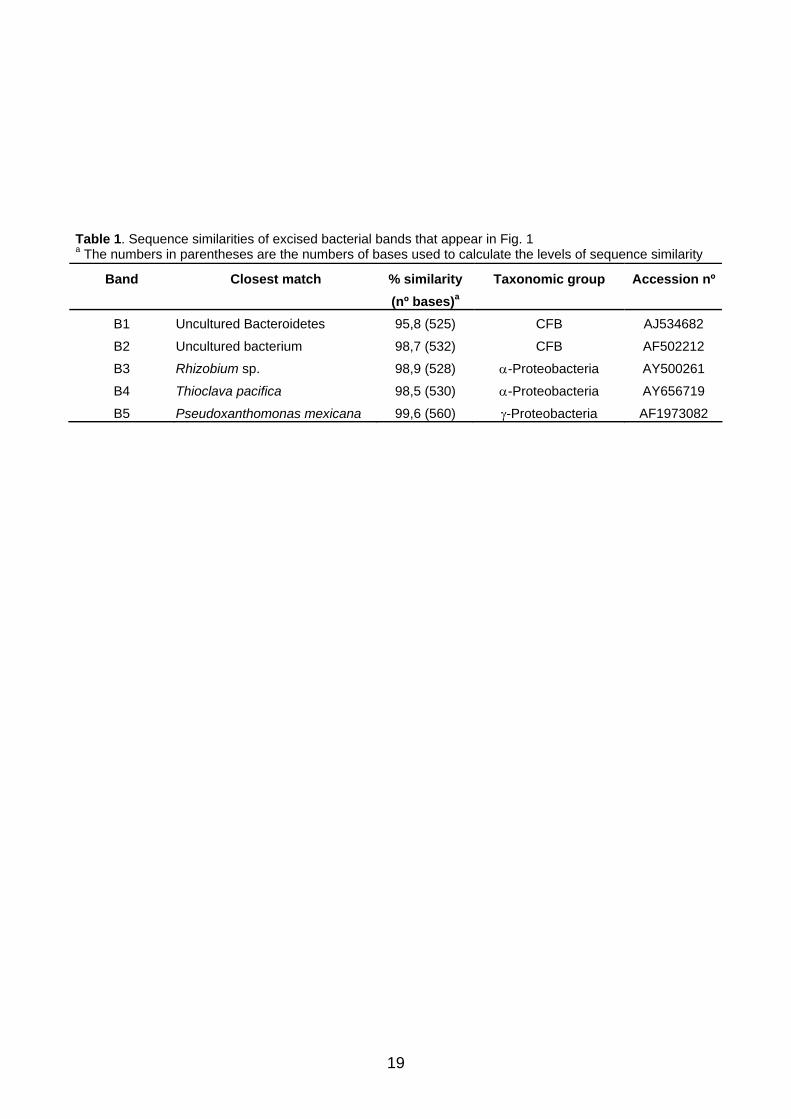
19
Table 1. Sequence similarities of excised bacterial bands that appear in Fig. 1 a The numbers in parentheses are the numbers of bases used to calculate the levels of sequence similarity
Band Closest match % similarity Taxonomic group Accession nº (nº bases)a
B1 Uncultured Bacteroidetes 95,8 (525) CFB AJ534682
B2 Uncultured bacterium 98,7 (532) CFB AF502212
B3 Rhizobium sp. 98,9 (528) α-Proteobacteria AY500261
B4 Thioclava pacifica 98,5 (530) α-Proteobacteria AY656719
B5 Pseudoxanthomonas mexicana 99,6 (560) γ-Proteobacteria AF1973082
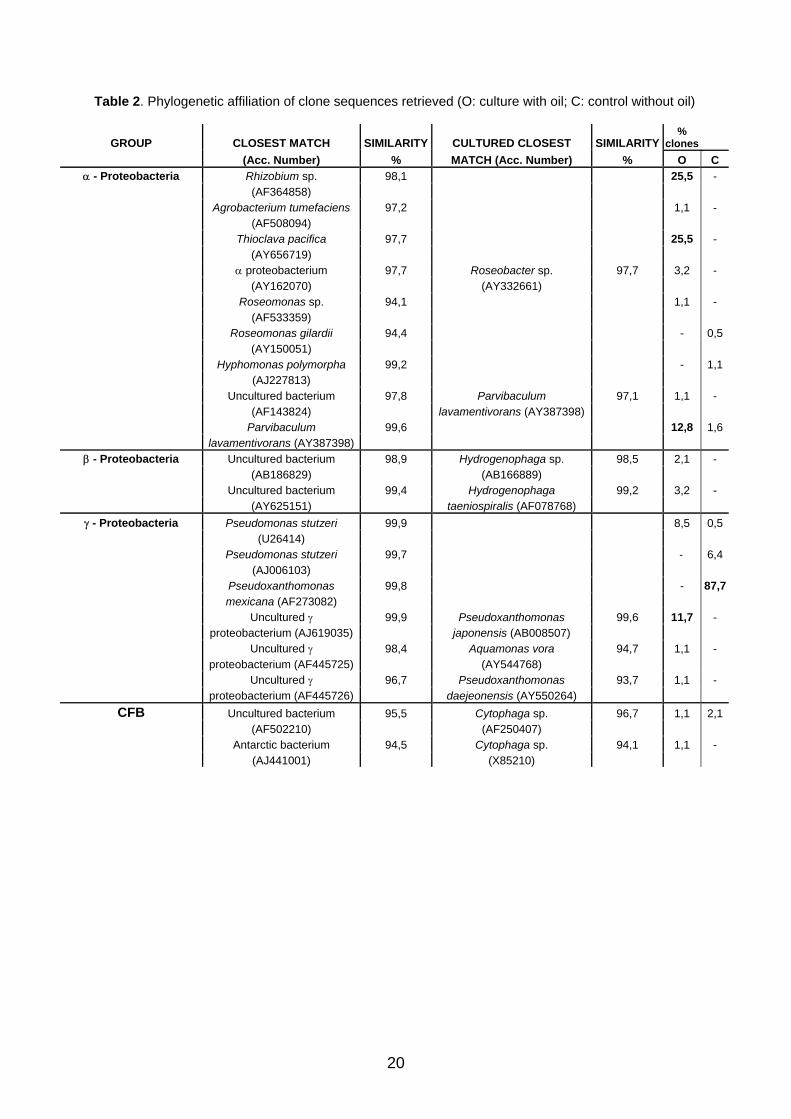
20
Table 2. Phylogenetic affiliation of clone sequences retrieved (O: culture with oil; C: control without oil)
GROUP CLOSEST MATCH SIMILARITY CULTURED CLOSEST SIMILARITY%
clones (Acc. Number) % MATCH (Acc. Number) % O C
α - Proteobacteria Rhizobium sp. 98,1 25,5 - (AF364858) Agrobacterium tumefaciens 97,2 1,1 - (AF508094) Thioclava pacifica 97,7 25,5 - (AY656719) α proteobacterium 97,7 Roseobacter sp. 97,7 3,2 - (AY162070) (AY332661) Roseomonas sp. 94,1 1,1 - (AF533359) Roseomonas gilardii 94,4 - 0,5 (AY150051) Hyphomonas polymorpha 99,2 - 1,1 (AJ227813) Uncultured bacterium 97,8 Parvibaculum 97,1 1,1 - (AF143824) lavamentivorans (AY387398) Parvibaculum 99,6 12,8 1,6 lavamentivorans (AY387398)
β - Proteobacteria Uncultured bacterium 98,9 Hydrogenophaga sp. 98,5 2,1 - (AB186829) (AB166889)
Uncultured bacterium 99,4 Hydrogenophaga 99,2 3,2 - (AY625151) taeniospiralis (AF078768)
γ - Proteobacteria Pseudomonas stutzeri 99,9 8,5 0,5 (U26414) Pseudomonas stutzeri 99,7 - 6,4 (AJ006103) Pseudoxanthomonas 99,8 - 87,7 mexicana (AF273082) Uncultured γ 99,9 Pseudoxanthomonas 99,6 11,7 - proteobacterium (AJ619035) japonensis (AB008507) Uncultured γ 98,4 Aquamonas vora 94,7 1,1 - proteobacterium (AF445725) (AY544768) Uncultured γ 96,7 Pseudoxanthomonas 93,7 1,1 - proteobacterium (AF445726) daejeonensis (AY550264)
CFB Uncultured bacterium 95,5 Cytophaga sp. 96,7 1,1 2,1 (AF502210) (AF250407) Antarctic bacterium 94,5 Cytophaga sp. 94,1 1,1 -
(AJ441001) (X85210)

21


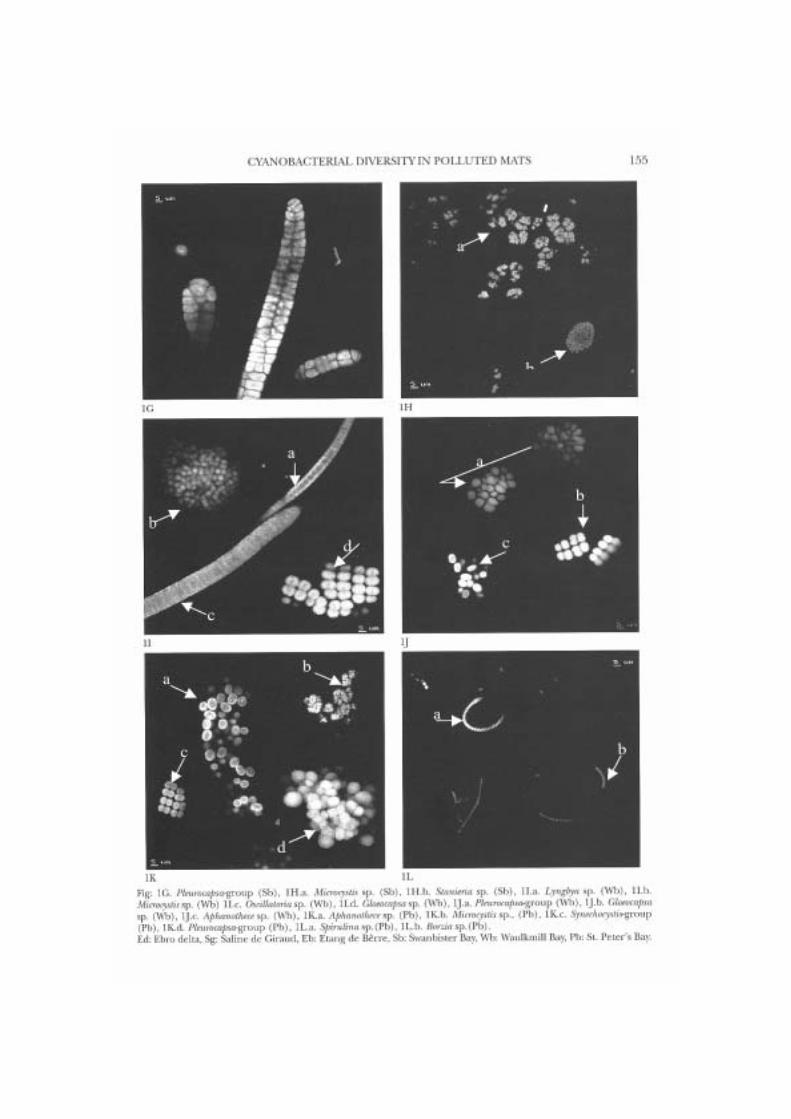
Appl Microbiol Biotechnol (2004) 66: 226–232DOI 10.1007/s00253-004-1694-3
ENVIRONMENTAL BIOTECHNOLOGY
Tirso Garcia De Oteyza . Joan O. Grimalt .Elia Diestra . Antonio Solé . Isabel Esteve
Changes in the composition of polar and apolar crude oilfractions under the action of Microcoleus consortia
Received: 1 April 2004 / Revised: 8 June 2004 / Accepted: 11 June 2004 / Published online: 5 August 2004# Springer-Verlag 2004
Abstract Cultures of Microcoleus consortia polluted withtwo different types of crude oil, one with high content inaliphatic hydrocarbons (Casablanca) and the other rich insulphur and aromatic compounds (Maya), were grown for50 days and studied for changes in oil composition. Notoxic effects from these oils were observed onMicrocoleusconsortia growth. In fact, the interface layer between theoils and the water culture medium proved to be the idealsite for consortia development, leading to a wrappingeffect of the oil layers by these organisms. Despite thisaffinity of cyanobacteria for the oil substrate, the changesin oil composition were small. Microcoleus consortia didnot induce transformation in the aliphatic-rich oil, and themodifications in the sulphur and aromatic-rich oil weresmall. The latter essentially involved degradation ofaliphatic heterocyclic organo-sulphur compounds such asalkylthiolanes and alkylthianes. Other groups of com-pounds, such as the alkylated monocyclic and polycyclicaromatic hydrocarbons, carbazoles, benzothiophenes anddibenzothiophenes, also underwent some degree of trans-formation, involving only the more volatile and lessalkylated homologues.
Introduction
Highly productive photosynthetic microbial mats developat the water-sediment interface in shallow environmentssuch as estuaries, lagoons or sheltered sandy beaches.Most of these mats form horizontally stratified layers in
which organisms are distributed along microgradients ofoxygen, sulphide, light and temperature, among others. Atypical microbial mat structure of marine coastal areasinvolves cyanobacteria on top, followed by purple sulphurphotosynthetic bacteria, green sulphur photosyntheticbacteria, and sulphate-reducing bacteria at the bottom(Cohen and Rosenberg 1989). These microbial systemshave been observed to play a role in the remediation of oil-polluted coastal areas in marine and hypersaline waters.Microbial mats have been observed to rapidly cover entireareas of oil-polluted sediment, e.g. within a few months,being considered a first step towards natural bioremedia-tion (Sorkhoh et al. 1992). In contrast, other reportsindicate that growth of cyanobacterial building matsresults in preservation of the oil residues (Barth 2003).Both approaches provide evidence that cyanobacteria arethe main and most abundant primary prokaryotic produ-cers in microbial mats, requiring that the effect of theseorganisms on crude oil degradation be addressed. Evi-dence supporting the biodegradation capacity of cyano-bacteria for the elimination of crude oil residues is stillvery limited, and is focussed on specific oil constituentssuch as n-alkanes (Al-Hasan et al. 1994, 1998; Raghuku-mar et al. 2001). In other cases, degradation experimentswith model compounds such as aromatic hydrocarbonshave been reported (Cerniglia 1984; Cerniglia et al. 1980;Raghukumar et al. 2001). To the best of our knowledge noresults on cyanobacterial degradation of either polar orapolar oil fractions have been described to date. Micro-coleus sp. is the dominant cyanobacterium in microbialmats in the Ebro Delta. Microcoleus is a filamentousoxygenic phototrophic bacterium that forms bundles oftrichomes enclosed by a polysaccharide sheath. Thiscyanobacterium has been shown to play an importantrole in stabilising delta sediments. Morphological char-acteristics and annual space-time variations of thiscyanobacterium biomass have been reported elsewhere(Solé et al. 2003). The ability of Microcoleus sp. totolerate petroleum has been demonstrated as it grows inpolluted microbial mats such as the Etang de Bêrre and inartificial laboratory systems (microcosms) polluted with
T. G. De Oteyza . J. O. Grimalt (*)Department of Environmental Chemistry (IIQAB-CSIC),Jordi Girona, 18,08034 Barcelona, Catalonia, Spaine-mail: [email protected].: +34-93-4006122Fax: +34-93-2045904
E. Diestra . A. Solé . I. EsteveDepartment of Genetics and Microbiology, Faculty of Sciences,Autonomous University of Barcelona,08193 Bellaterra, Catalonia, Spain

petroleum (Llirós et al. 2003). However, its role in thebiodegradation of petroleum has not yet been established.Cultures of this cyanobacterium from polluted microbialmats growing in microcosms have been obtained recently.Ultrastructural analysis of Microcoleus colonies grown onPetri dishes reveals the existence of Microcoleus consortiaformed by Microcoleus and heterotrophic bacteria in-cluded in the polysaccharide sheaths of Microcoleus sp.filaments. The present study describes the crude oiltransformations upon degradation with Microcoleus con-sortia. Two crude oils, Casablanca and Maya, wereselected as reference materials for this purpose. Casa-blanca crude contains mainly aliphatic hydrocarbons(59.5%) and, to a lesser extent, aromatic hydrocarbons(27%) (Table 1). Asphaltenes and polar compounds arepresent only in minor amounts. This oil is similar to manyoils from the Arabian Gulf such as Arabian light orKuwait. Maya oil is heavy and sulphur-rich, containingmore than 2% sulphur. Aromatic hydrocarbons (43%) aremore abundant than aliphatic hydrocarbons (29.5%)(Table 1). Asphaltenes and resins in the maltene fractionare present in relatively high amounts. In principle, thislatter crude oil is potentially more harmful to marineecosystems than Casablanca-type oils due to its higherviscosity and higher content of heterocyclic compounds(thiophenes, phenols, quinolines or acridines), which areoften toxic and water-soluble (Barron et al. 1999). Thechanges in composition of aliphatic and aromatic hydro-carbons, and nitrogen and sulphur-containing compoundsfrom these two oils are described.
Materials and methods
Microcoleus consortia isolated from polluted microbialmats were grown in mineral Pfenning medium (accordingto van Gemerden and Beeftink 1983). A 300 μl sample ofCasablanca or Maya oils was added on top of separateculture bottles (see Fig. 1). Control experiments wereperformed in parallel keeping the oils in the same mineralmedium but without Microcoleus consortia inoculum.Both controls and cultures were illuminated at15 μEm−2s−1 and kept at 27°C. Structural examinationof Microcoleus consortia was performed by confocal laserscanning microscopy using a Leica True Confocal ScannerTSC 4D. The samples were observed with a 63×1.4numerical aperture and a Plan Apochromat oil immersionobjective lens under 590 nm fluorescence excitation.
Control oils and oil samples (±100–150 μl crude oil) fromthe cultures at the beginning and at the end of theexperiments (50 days) were analysed. Samples weredissolved in n-hexane in order to precipitate theasphaltenes. The compounds soluble in n-hexane—themaltene fraction—were fractionated by column chroma-tography in a 34×0.9 cm2 i.d. column filled with 8 g eachof 5% water-deactivated alumina (top) and silica (bottom).The adsorbents in these columns, neutral silica gel (70–230 mesh, Merck) and alumina (70–230 mesh, Merck),were extracted with dichloromethane-methanol (2:1, v/v)in a Soxhlet apparatus for 24 h. After solvent evaporation,the silica and alumina were heated at 120°C and 350°C,respectively, for 12 h. These adsorbents were thendeactivated by addition of 5% Milli-Q-grade water. Sixfractions were separated by elution with 20 ml n-hexane(F1), 20 ml 10% dichloromethane in n-hexane (F2), 40 ml20% dichloromethane in n-hexane (F3), 40 ml 25% n-hexane in dichloromethane (F4), 20 ml 5% methanol indichloromethane (F5) and 40 ml 10% methanol indichloromethane (F6). The hydrocarbon fractions (F1–F3) were evaporated to dryness and re-dissolved in iso-octane. The polar fractions (F4–F6) were re-dissolved indichloromethane and derivatised with diazomethane. Gaschromatography (GC) was performed with a Varian ModelStar 3400 equipped with a flame ionisation detector and aVarian 8200 CX septum programmable injector (SPI). ADB-5 capillary column (30 m×0.25 mm i.d.; filmthickness 0.25 μm) was used. Hydrogen was the carriergas (50 cm/s). The oven temperature program was 70–140°C at 10°C/min, 140–310°C at 4°C/min (holding time20 min). The injector temperature program was from100°C to 300°C at 200°C/min. The detector temperaturewas 330°C. Nitrogen was used as make-up gas (30 ml/min). Detector gas flows were hydrogen (30 ml/min) andair (300 ml/min). The samples were also analysed by GCcoupled to a mass spectrometer (GC-MS) using a FisonsMD-800 instrument. Spectra were obtained in the electronimpact mode (70 eV) scanning from m/z 50 to 550 everysecond. A HP-5 capillary column (30 m ×0.25 mm i.d.;film thickness 0.25 μm) was used. Helium was the carriergas (1 ml/min). The oven temperature program was 70–140°C at 10°C/min, 140–310°C at 4°C/min (holding time20 min). Injector, transfer line and ion source temperatureswere 300, 280 and 200°C, respectively. Injection was inthe splitless mode (iso-octane, hot needle technique)keeping the split valve closed for 48 s.
Table 1 Relative proportion ofthe crude oil column chroma-tography fractions (%)
aNot degraded
Casablanca Maya
Original After degradation Original After degradation
F1 Aliphatic hydrocarbons 59.5 n.d.a 29.5 39F2 Aromatic hydrocarbons (monocyclic) 12 n.d. 10 12F3 Aromatic hydrocarbons (polycyclic) 15 n.d. 33 26F4 Polar compounds 5.7 n.d. 10 7.8F5 Polar compounds 0.8 n.d. 1.6 1.6F6 Polar compounds 6.8 n.d. 15.5 13
227
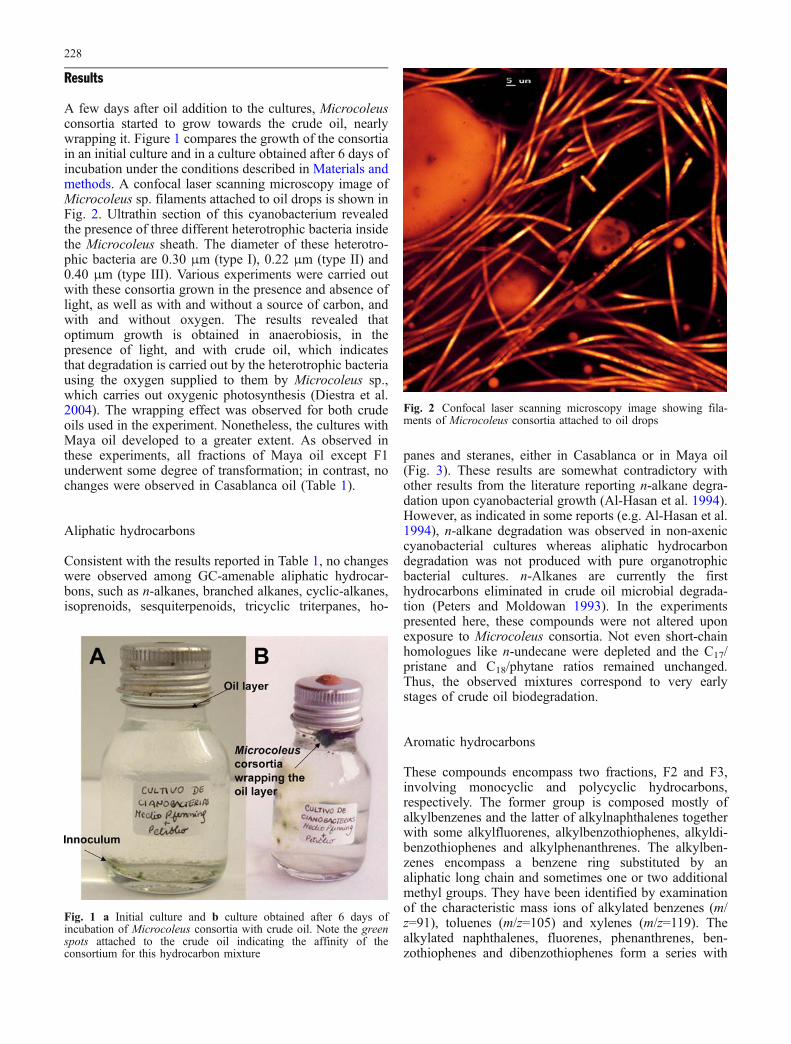
Results
A few days after oil addition to the cultures, Microcoleusconsortia started to grow towards the crude oil, nearlywrapping it. Figure 1 compares the growth of the consortiain an initial culture and in a culture obtained after 6 days ofincubation under the conditions described in Materials andmethods. A confocal laser scanning microscopy image ofMicrocoleus sp. filaments attached to oil drops is shown inFig. 2. Ultrathin section of this cyanobacterium revealedthe presence of three different heterotrophic bacteria insidethe Microcoleus sheath. The diameter of these heterotro-phic bacteria are 0.30 μm (type I), 0.22 μm (type II) and0.40 μm (type III). Various experiments were carried outwith these consortia grown in the presence and absence oflight, as well as with and without a source of carbon, andwith and without oxygen. The results revealed thatoptimum growth is obtained in anaerobiosis, in thepresence of light, and with crude oil, which indicatesthat degradation is carried out by the heterotrophic bacteriausing the oxygen supplied to them by Microcoleus sp.,which carries out oxygenic photosynthesis (Diestra et al.2004). The wrapping effect was observed for both crudeoils used in the experiment. Nonetheless, the cultures withMaya oil developed to a greater extent. As observed inthese experiments, all fractions of Maya oil except F1underwent some degree of transformation; in contrast, nochanges were observed in Casablanca oil (Table 1).
Aliphatic hydrocarbons
Consistent with the results reported in Table 1, no changeswere observed among GC-amenable aliphatic hydrocar-bons, such as n-alkanes, branched alkanes, cyclic-alkanes,isoprenoids, sesquiterpenoids, tricyclic triterpanes, ho-
panes and steranes, either in Casablanca or in Maya oil(Fig. 3). These results are somewhat contradictory withother results from the literature reporting n-alkane degra-dation upon cyanobacterial growth (Al-Hasan et al. 1994).However, as indicated in some reports (e.g. Al-Hasan et al.1994), n-alkane degradation was observed in non-axeniccyanobacterial cultures whereas aliphatic hydrocarbondegradation was not produced with pure organotrophicbacterial cultures. n-Alkanes are currently the firsthydrocarbons eliminated in crude oil microbial degrada-tion (Peters and Moldowan 1993). In the experimentspresented here, these compounds were not altered uponexposure to Microcoleus consortia. Not even short-chainhomologues like n-undecane were depleted and the C17/pristane and C18/phytane ratios remained unchanged.Thus, the observed mixtures correspond to very earlystages of crude oil biodegradation.
Aromatic hydrocarbons
These compounds encompass two fractions, F2 and F3,involving monocyclic and polycyclic hydrocarbons,respectively. The former group is composed mostly ofalkylbenzenes and the latter of alkylnaphthalenes togetherwith some alkylfluorenes, alkylbenzothiophenes, alkyldi-benzothiophenes and alkylphenanthrenes. The alkylben-zenes encompass a benzene ring substituted by analiphatic long chain and sometimes one or two additionalmethyl groups. They have been identified by examinationof the characteristic mass ions of alkylated benzenes (m/z=91), toluenes (m/z=105) and xylenes (m/z=119). Thealkylated naphthalenes, fluorenes, phenanthrenes, ben-zothiophenes and dibenzothiophenes form a series with
Fig. 1 a Initial culture and b culture obtained after 6 days ofincubation of Microcoleus consortia with crude oil. Note the greenspots attached to the crude oil indicating the affinity of theconsortium for this hydrocarbon mixture
Fig. 2 Confocal laser scanning microscopy image showing fila-ments of Microcoleus consortia attached to oil drops
228

Fig. 3 Aliphatic hydrocarbon fraction of the original (a, c) and biodegraded (b, d) Casablanca (a, b) and Maya (c, d) crude oils
Fig. 4 Original (a, d), control (b, e) and biodegraded (c, f) aromaticmonocyclic (a–c)and polycyclic (d–f) hydrocarbons of Maya crudeoil. CX-B Alkylbenzenes, N naphthalene, CX-N alkylnaphthalenes,
CX-F alkylfluorenes, CX-DBT alkydilbenzothiophenes, CX-Palkylphenanthrenes
229

the parent compound and homologues with increasingdegrees of methyl substitution at different positions. Theyhave been identified by examination of the mass fragmentsof the molecular ions of the parent compounds and C1, C2
and C3 substitution, e.g. m/z 128, 142, 156 and 170 for thealkylnaphthalenes, m/z for 166, 180, 194 and 208 for thealkylfluorenes, m/z 178, 192, 206 and 220 for thealkylphenanthrenes, m/z 162, 176, 190 and 204 for thealkylbenzothiophenes and m/z 184, 198, 212 and 226 forthe alkyldibenzothiophenes. Degradation of the lowermolecular weight compounds was observed in bothfractions of Maya oil (Fig. 4). Among alkylbenzenes, thebiodegraded oil contained no C4 homologues, about 50%of the initial C5 homologue content was eliminated, someC6 homologues were degraded to about 20%, and relativedecreases were observed in the C7 and C8 homologues. Inthe polycyclic aromatic fraction, naphthalene was elimi-nated and the methylnaphthalenes were depleted to around50%. Homologues with higher degrees of alkylation werenot degraded. The loss of the more volatile hydrocarbonsin these two aromatic fractions is not due to abioticprocesses, e.g. volatilisation or photooxidation, since thesecompounds were preserved in the control oils. Casablancaoil contains the same series of monocyclic and polycyclicaromatic compounds as Maya oil. However, no transfor-mation in the composition of these hydrocarbons wasobserved upon consortia growth. The main differencebetween the two oils is the relatively high proportion ofaliphatic hydrocarbons in the former. As indicated above,
these hydrocarbons are refractory to consortia action inboth cases. Perhaps the preservation of the aromaticcompounds in Casablanca oil can be explained by ahindering effect due to the higher proportion of aliphatichydrocarbons in this oil than in Maya, which preventseffective contact between the consortium and compoundsthat may by metabolised by it. Alternatively, it could alsobe that aromatic compounds are susceptible to degradationonly in the presence of other polar oil compounds that aremore labile to consortia metabolism such as the sulphur-containing compounds described below. These com-pounds could provide molecular moieties that are neededto initiate transformation of aromatic hydrocarbons byconsortia metabolism.
Sulphur-containing hydrocarbons
The GC-amenable compounds of Maya oil encompassseries of cis and trans mid-chain alkylthiolanes (m/z 87;Fig. 5), 2-alkylthianes (m/z 101; Fig. 5), alkylbenzothio-phenes (Fig. 6) and alkyldibenzothiophenes (Fig. 6). Bothalkylthiolanes and alkylthianes were identified accordingto mass spectral and retention time data reported elsewhere(Schmid et al. 1987; Sinninghe Damsté et al. 1989).Alkylbenzothiophenes were identified by comparison withthe mass spectral and retention time data reported forRozel Point oil (Sinninghe Damsté et al. 1987). Theproportions of the methyldibenzothiophenes, namely the
Fig. 5 Original (a, d), control (b, e) and biodegraded (c, f) alkylthianes (a–c) and alkylthiolanes (d–f) of Maya crude oil. CX-TAAlkylthianes, CX-TO alkylthiolanes, CX-BTE alkylbenzothiophenes
230

ratio between 1-methyldibenzothiophene and 3+2-methyl-dibenzothiophenes, is similar to the composition encoun-tered in oils from evaporitic environments such asAmposta (Albaiges et al. 1986) Analysis of the crude oilmixtures after this period of growth revealed that mostalkylthiolanes and alkylthianes had been eliminated(Fig. 5). Again, removal of these compounds is not dueto abiotic processes, e.g. volatilisation or photooxidation,since they remain in the oil controls (Fig. 5). In contrast,the distribution of alkylbenzothiophenes and alkyldiben-zothiophenes underwent a lower degree of transformation(Fig. 6). C2-benzothiophenes were depleted by about 30%and dibenzothiophene by about 10% whereas thedibenzothiophenes of higher degree of alkylation werenot degraded. Casablanca crude does not have thianes orthiolanes, and only a small quantity of benzothiophenesand dibenzothiophenes. No degradation was observed forthese compounds in this oil. The elimination of organo-sulphur compounds observed in these experiments occurssimilarly to previously described cases involving otherorganisms. Thus, aerobic microbial strains, e.g. Pseudo-monas sp., isolated from sites chronically polluted with oilresidues have also led to the elimination of alkylthiolanesand alkylthianes and a decrease in some alkylbenzothio-phenes and alkyldibenzothiophenes in sulphur-rich crudeoils such as Amposta oil (Grimalt et al. 1991). In this latter
case, oil biodegradation also involved a strong depletion ofn-alkanes, which were entirely eliminated. Alkylthiolanesand alkylthianes are therefore more labile to biodegrada-tion than alkylbenzothiophenes and alkyldibenzothio-phenes. These different properties reflect the stability ofthe sulphur-containing aromatic rings due to δ-electrondelocalisation in fused aromatic ring systems.
Nitrogen-containing hydrocarbons
Alkylcarbazoles are found in both Casablanca and Mayaoils. Microcoleus consortia action involves no transfor-mation of the former but depletion of carbazol andmethylcarbazoles in the latter, to about 60% and 40%,respectively (Fig. 6). Again, the lack of degradation inCasablanca oil could be due to the hindering effect of thelarge proportion of aliphatic hydrocarbons, or to therequirement of the presence of other compounds morelabile to consortia transformation, such as the sulphur-containing compounds, to initiate the transformation.
Fig. 6 Original (a, d, g), control (b, e, h) and biodegraded (c, f, I)alkylbenzothiophenes (a–c), alkyldibenzothiophenes (d–f) andalkylcarbazoles (g–I) of Maya crude oil. CX-BT Alkylbenzothio-
phenes, CX-DBT alkyldibenzothiophenes, C carbazole, CX-Calkylcarbazoles
231
Discussion
Microcoleus sp. can likely degrade crude oil due toconsortia containing the above-mentioned three differentheterotrophic organisms. Crude oil degradation was notobserved in control experiments. Neither aliphatic noraromatic sulphur-rich oils have any toxic effects on theMicrocoleus consortia. Conversely, the interface layerbetween the oil and water culture media seems to be anideal site for consortia growth. This observation isconsistent with field reports from oil-polluted coastalareas indicating the rapid growth of cyanobacteria in sitesoccupied by microbial mats (Sorkhoh et al. 1992). Theaffinity of Microcoleus consortia for oil is observedirrespective of oil composition. Thus, Casablanca andMaya oils represent end-member cases of oils extracted forcommercial purposes. In fact, Maya oil contains materialsthat enhance Microcoleus consortia growth even morethan Casablanca oil. This result is interesting from anenvironmental standpoint. Whereas Maya oil is moreviscous, less volatile, and contains more deleteriouscompounds (such as the stinking sulphur-containingmolecules) Casablanca oil essentially comprises aliphatichydrocarbons and is less viscous and more volatile. Thelatter is currently eliminated more easily from theenvironment both by abiotic processes and bacterialdegradation. Aliphatic hydrocarbons are refractory toMicrocoleus consortia attack. In contrast, aromatic hydro-carbons, both monocyclic and polycyclic, sulphur-contain-ing compounds such as thiolanes and thianes, andnitrogen-containing compounds such as carbazoles, aredegraded. In the case of both aromatic hydrocarbons andcarbazoles, the compounds undergoing higher transforma-tion are those with a lower degree of alkylation, which isagain consistent with the observed resistance of aliphatichydrocarbons to Microcoleus consortia metabolism. Thio-lanes and thianes are degraded irrespective of the degree ofalkyl substitution, indicating that thioether bonds areeasily accessible to transformation by Microcoleus con-sortia. However, when sulphur atoms are integrated intoaromatic polycyclic molecules, the compounds are muchmore resistant to degradation. Similar results wereobserved in a previous study involving microbial biodeg-radation of sulphur-rich crude oils with aerobic bacteriasuch as Pseudomonas sp. (Grimalt et al. 1991). Bothresults indicate that oil compounds containing saturatedsulphur-containing rings are more labile to degradationthan molecules with aromatic sulphur-containing rings.Overall, Microcoleus consortia appear to be organismswith the ability to biodegrade crude oil but to a lesserextent than several heterotrophic eubacteria, which are theorganisms currently identified to be responsible for crudeoil degradation in chronically polluted coastal sites. Thus,despite the fact that these organisms tend to grow attachedto oil residues, and therefore reduce the contact betweenspilled oil and marine ecosystems, they metabolise only aminor part of the oil constituents.
Acknowledgement Financial contribution from the EuropeanUnion MATBIOPOL project EVK3-CT-1999-00010 is acknowl-edged.
References
Albaiges J, Algaba J, Clavell E, Grimalt JO (1986) Petroleumgeochemistry of the Tarragona Basin (Spanish Mediterraneanoff-shore). Org Geochem 8:293–297
Al-Hasan R, Sorkhoh NA, Al-Bader DA, Radwan SS (1994)Utilization of hydrocarbon by cyanobacteria from microbialmats on oily coasts of the Gulf. Appl Microbiol Biotechnol41:615–619
Al-Hasan R, Al-Bader DA, Sorkhoh NA, Radwan SS (1998)Evidence for n-alkane consumption and oxidation by filamen-tous cyanobacteria from oil-contaminated coasts of the ArabianGulf. Mar Biol 130:521–527
Barron MG, Podrabsky T, Ogle S, Ricker RW (1999) Are aromatichydrocarbons the primary determinant of petroleum toxicity toaquatic organisms? Aquat Toxicol 46:253–268
Barth HJ (2003) The influence of cyanobacteria on oil pollutedintertidal soils at the Saudi Arabian Gulf shores. Mar PollutBull 46:1245–1252
Cerniglia CE (1984) Microbial metabolism of polycyclic aromatichydrocarbons. Adv Appl Microbiol 30:31–71
Cerniglia CE, Van Baalen C, Gibson DT (1980) Metabolism ofnaphthalene by the cyanobacterium Osillatoria sp., strain JCM.J Gen Microbiol 116:485–494
Cohen Y, Rosenberg E (1989) Microbial mats. Physiologicalecology of benthic microbial communities. ASM, Washington
Diestra E, Solé A, Martí M, García De Oteyza T, Grimalt JO, EsteveI (2004) Characterization of Microcoleus consortia withcapacity to degrade crude oil by means of CLSM, SEM andTEM. Res Microbiol (in press)
Gemerden H van, Beeftink HH (1983) Ecology of phototrophicbacteria. In: Ormerod JG (ed) The phototrophic bacteria:anaerobic life in the light. Studies in Microbiology, vol 4.Blackwell, Oxford, pp 146–185
Grimalt JO, Grifoll M, Solanas AM, Albaiges J (1991) Microbialdegradation of marine evaporitic crude oils. Geochim Cosmo-chim Acta 55:1903–1913
Llirós M, Munill X, Solé A, Martínez-Alonso M, Diestra E, Esteve I(2003) Analysis of cyanobacteria biodiversity in pristine andpolluted microbial mats in microcosmos by confocal laserscanning microscopy (CLSM). In: Mendez-Vilas (ed) Science,technology and education of microscopy: an overview. 288FORMATEX Microscopy Book Series, vol 1, pp 483–489
Peters KE, Moldowan JM (1993) The biomarker guide. Interpretingmolecular fossils in petroleum and ancient sediments. PrenticeHall, Englewood Cliffs
Raghukumar C, Vipparty V, David JJ, Chandramohan D (2001)Degradation of crude oil by marine cyanobacteria. ApplMicrobiol Biotechnol 57:433–436
Schmid JC, Connan J, Albrecht P (1987) Occurrence andgeochemical significance of long-chain dialkylthiacyclopen-tanes. Nature 329:54–56
Sinninghe Damsté JS, de Leeuw JW, Kok-van Dalen AC, de LeeuwMA, de Lange F, Rijpstra WIC, Schenck PA (1987) Theoccurrence and identification of series of organic sulphurcompounds in oils and sediment extracts. I. A study of RozelPoint Oil (USA). Geochim Cosmochim Acta 51:2369–2391
Sinninghe Damsté JS, Rijpstra WIC, de Leeuw JW, Schenck PA(1989) The occurrence and identification of series of organicsulphur compounds in oils and sediment extracts: II. Theirpresence in samples from hypersaline and non-hypersalinepalaeoenvironments and possible application as source, pa-laeoenvironmental and maturity indicators. Geochim Cosmo-chim Acta 53:1323–1341
Solé A, Gaju N, Esteve I (2003) The biomass dynamics ofcyanobacteria in an annual cycle determined by confocal laserscanning microscopy. Scanning 25:1–7
Sorkhoh N, Al-Hasan R, Radwan S, Hoepner T (1992) Self-cleaningof the Gulf. Nature 359:109
232

www.fems-microbiology.org
FEMS Microbiology Ecology 51 (2004) 55–70
Characterization of functional bacterial groupsin a hypersaline microbial mat community(Salins-de-Giraud, Camargue, France)
Aude Fourcans a, Tirso Garcıa de Oteyza b, Andrea Wieland c, Antoni Sole d,Elia Diestra d, Judith van Bleijswijk e, Joan O. Grimalt b, Michael Kuhl c, Isabel Esteve d,
Gerard Muyzer f, Pierre Caumette a, Robert Duran a,*
a Laboratoire d�Ecologie Moleculaire EA 3525, Universite de Pau et des Pays de l�Adour, avenue de l�Universite, BP 1155, F-64013 Pau Cedex, Franceb Department of Environmental Chemistry (ICER-CSIC), E-08034 Barcelona, Spain
c Marine Biological Laboratory, Institute of Biology, University of Copenhagen, DK-3000 Helsingør, Denmarkd Department of Genetics and Microbiology, Autonomous University of Barcelona, E-08193 Bellaterra, Spain
e Royal Netherlands Institute of Sea Research, Texel, The Netherlandsf Department of Biotechnology, Delft University of Technology, NL-2628 BC Delft, The Netherlands
Received 20 October 2003; received in revised form 19 April 2004; accepted 13 July 2004
First published online 20 August 2004
Abstract
A photosynthetic microbial mat was investigated in a large pond of a Mediterranean saltern (Salins-de-Giraud, Camargue,
France) having water salinity from 70& to 150& (w/v). Analysis of characteristic biomarkers (e.g., major microbial fatty acids,
hydrocarbons, alcohols and alkenones) revealed that cyanobacteria were the major component of the pond, in addition to diatoms
and other algae. Functional bacterial groups involved in the sulfur cycle could be correlated to these biomarkers, i.e. sulfate-reduc-
ing, sulfur-oxidizing and anoxygenic phototrophic bacteria. In the first 0.5 mm of the mat, a high rate of photosynthesis showed the
activity of oxygenic phototrophs in the surface layer. Ten different cyanobacterial populations were detected with confocal laser
scanning microscopy: six filamentous species, with Microcoleus chthonoplastes and Halomicronema excentricum as dominant
(73% of total counts); and four unicellular types affiliated to Microcystis, Chroococcus, Gloeocapsa, and Synechocystis (27% of total
counts). Denaturing gradient gel electrophoresis of PCR-amplified 16S rRNA gene fragments confirmed the presence of Microco-
leus, Oscillatoria, and Leptolyngbya strains (Halomicronema was not detected here) and revealed additional presence of Phormidium,
Pleurocapsa and Calotrix types. Spectral scalar irradiance measurements did not reveal a particular zonation of cyanobacteria, pur-
ple or green bacteria in the first millimeter of the mat. Terminal-restriction fragment length polymorphism analysis of PCR-ampli-
fied 16S rRNA gene fragments of bacteria depicted the community composition and a fine-scale depth-distribution of at least five
different populations of anoxygenic phototrophs and at least three types of sulfate-reducing bacteria along the microgradients of
oxygen and light inside the microbial mat.
� 2004 Federation of European Microbiological Societies. Published by Elsevier B.V. All rights reserved.
Keywords: Bacterial community composition; Biomarkers; Confocal microscopy; Microbial mat; Microsensors; Bacterial diversity
0168-6496/$22.00 � 2004 Federation of European Microbiological Societies
doi:10.1016/j.femsec.2004.07.012
* Corresponding author. Tel.: +33 5 5940 7468; fax: +33 5 5940
7494.
E-mail address: [email protected] (R. Duran).
1. Introduction
Photosynthetic microbial mats develop at the water–
sediment interface in shallow environments such as
. Published by Elsevier B.V. All rights reserved.

56 A. Fourcans et al. / FEMS Microbiology Ecology 51 (2004) 55–70
estuaries [1,2], sheltered sandy beaches [3,4], or hypersa-
line salterns [5,6]. Most of these microbial mats are
formed of horizontally stratified, multicolored and cohe-
sive thin layers of several functional groups of microor-
ganisms, such as cyanobacteria, colorless sulfur
bacteria, purple sulfur bacteria and sulfate-reducingbacteria, distributed along vertical microgradients of
oxygen, sulfide and light [7,8].
Hypersaline mats from salterns represent interesting
ecosystems adapted to fluctuating salinity conditions.
Microbial mats existing in the most hypersaline ponds
of the salterns of Salins-de-Giraud (Camargue, French
Mediterranean coast) have been described in ecological
and microbiological, and recently molecular studies overthe last 10 years [5,9–11]. These saline ponds with water
salinity between 150& and 300& (w/v) contain micro-
bial mats similar to those previously described in other
hypersaline habitats [6,12]. They are formed of an upper
layer of cyanobacteria belonging to the genus Phormi-
dium, covering a purple layer of phototrophic bacteria
mainly composed of members of the genera Halochro-
matium [13] andHalothiocapsa [14], well adapted to suchhigh salinities. Molecular studies [9] showed that the
bacterial composition of these mats was more diverse
than expected both in Bacterial and in Archaeal groups.
In the present study, we investigated another mat
from the same salterns growing in ponds with lower
salinity (70–150& (w/v)). This mat developed over sev-
eral decades in large areas used by the Saltern Company
as water reservoirs for salt production. The aim of thisanalysis was to characterize the composition of the func-
tional bacterial groups developing in the Camargue
microbial mat. The simultaneous use of different meth-
ods for analysis of bacterial composition and microenvi-
ronment, allowed a precise in situ analysis of the
Camargue mat. In the mat, the major bacterial groups
were investigated by characteristic biomarkers, confocal
laser scanning microscopy (CLSM), denaturing gradientgel electrophoresis (DGGE) and terminal-restriction
fragment length polymorphism (T-RFLP) analysis of
PCR amplified 16S rRNA genes or functional gene frag-
ments. In order to understand the bacterial occurrence
and distribution at the microscale level, all the microbio-
logical results were related to microenvironmental gradi-
ents determined by in situ microsensor measurements.
2. Materials and methods
2.1. Sampling site description
The sampling site was in a very large shallow pond at
the saltern of Salins-de-Giraud, close to the sand barrier
and the sea coast (43�27 03500 N, 04�41 02800 E, Camargue,France). This pond was used for the storage of pre-con-
centrated seawater. In this pond of about 10 km2 area,
the water column never exceeded 20 cm depth and its
salinity ranged from 70& to 150& (w/v). The photosyn-
thetic microbial mat covered a large proportion of this
pond and also of other adjacent ponds, and was consti-
tuted of thin laminated cohesive layers. Due to its devel-
opment over several decades, the mat was about 5–10cm thick. The underlying sediment was mostly com-
posed of a mixture of sand and clay.
2.2. Sampling procedure
All mat samples analyzed were collected in May 2000,
by mean of plexiglass cores. For biomarker analysis,
mat cores of 26 mm inner diamater were immediatelyfrozen until further analysis. For confocal laser scanning
microscopy, two cores (18 mm i.d.) were transferred into
small plastic tubes containing 2.5% (v/v) glutaraldehyde
in phosphate buffer (0.2 M, pH 7.4, adjusted to the
appropriate salinity with NaCl), and stored at 4 �C until
further processing. For DGGE and T-RFLP, the upper
10 mm of the mat cores (35 mm i.d.) were sliced off asep-
tically, transferred to sterile Petri dishes, frozen in liquidnitrogen, and then stored at �80 �C.
2.3. Microsensor measurements of O2 and oxygenic
photosynthesis profiles
Depth profiles of O2 and gross oxygenic photosynthe-
sis were measured in May 2000. Microsensor measure-
ments were done in situ from a small measuringplatform placed above the mat. A Clark-type O2 micro-
sensor [15] connected to a picoammeter (UniSense A/S,
Aarhus, Denmark) was manually operated with a
micromanipulator (Marzhauser, Wetzlar, Germany)
mounted on a heavy solid stand. Microsensor signals
were recorded with a strip battery-operated chart recor-
der (Servogor, Leeds, UK) operated via batteries. The
O2 microsensor had a tip diameter of 6 lm, a stirringsensitivity of �2% and a response time, t90, of 0.2 s.
The O2 microsensor was linearly calibrated on site from
readings of microsensor current in the overlying water
and in the anoxic part of the mat (2% O2). Dissolved
O2 concentrations in the overlying water were deter-
mined by Winkler titration [16]. Experimental light–
dark shifts for in situ measurements of oxygenic gross
photosynthesis [17] were performed with a custom-made, light-impermeable box, which was deployed by
avoiding physical contact with the sensor and thus dis-
turbance of microsensor readings.
2.4. Spectral scalar irradiance measurements with fiber-
optic microprobes
Mat samples were collected in February 2001 forspectral scalar irradiance measurements under control-
led conditions in a laboratory. Due to the time difference
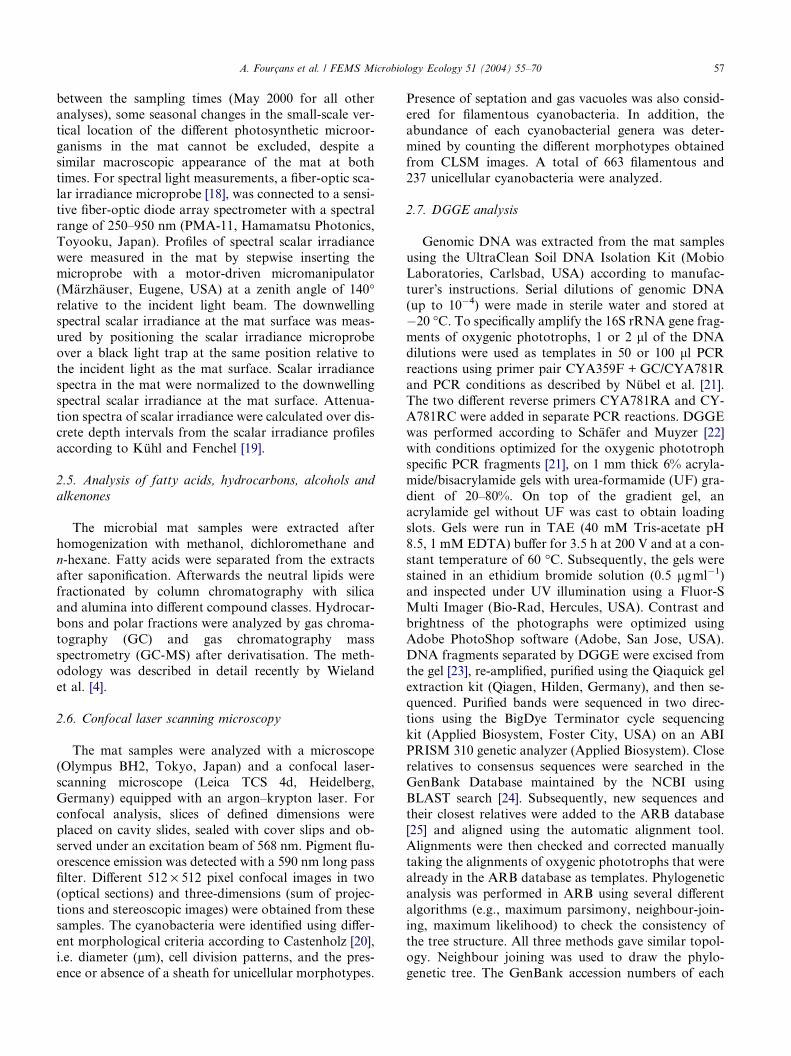
A. Fourcans et al. / FEMS Microbiology Ecology 51 (2004) 55–70 57
between the sampling times (May 2000 for all other
analyses), some seasonal changes in the small-scale ver-
tical location of the different photosynthetic microor-
ganisms in the mat cannot be excluded, despite a
similar macroscopic appearance of the mat at both
times. For spectral light measurements, a fiber-optic sca-lar irradiance microprobe [18], was connected to a sensi-
tive fiber-optic diode array spectrometer with a spectral
range of 250–950 nm (PMA-11, Hamamatsu Photonics,
Toyooku, Japan). Profiles of spectral scalar irradiance
were measured in the mat by stepwise inserting the
microprobe with a motor-driven micromanipulator
(Marzhauser, Eugene, USA) at a zenith angle of 140�relative to the incident light beam. The downwellingspectral scalar irradiance at the mat surface was meas-
ured by positioning the scalar irradiance microprobe
over a black light trap at the same position relative to
the incident light as the mat surface. Scalar irradiance
spectra in the mat were normalized to the downwelling
spectral scalar irradiance at the mat surface. Attenua-
tion spectra of scalar irradiance were calculated over dis-
crete depth intervals from the scalar irradiance profilesaccording to Kuhl and Fenchel [19].
2.5. Analysis of fatty acids, hydrocarbons, alcohols and
alkenones
The microbial mat samples were extracted after
homogenization with methanol, dichloromethane and
n-hexane. Fatty acids were separated from the extractsafter saponification. Afterwards the neutral lipids were
fractionated by column chromatography with silica
and alumina into different compound classes. Hydrocar-
bons and polar fractions were analyzed by gas chroma-
tography (GC) and gas chromatography mass
spectrometry (GC-MS) after derivatisation. The meth-
odology was described in detail recently by Wieland
et al. [4].
2.6. Confocal laser scanning microscopy
The mat samples were analyzed with a microscope
(Olympus BH2, Tokyo, Japan) and a confocal laser-
scanning microscope (Leica TCS 4d, Heidelberg,
Germany) equipped with an argon–krypton laser. For
confocal analysis, slices of defined dimensions wereplaced on cavity slides, sealed with cover slips and ob-
served under an excitation beam of 568 nm. Pigment flu-
orescence emission was detected with a 590 nm long pass
filter. Different 512 · 512 pixel confocal images in two
(optical sections) and three-dimensions (sum of projec-
tions and stereoscopic images) were obtained from these
samples. The cyanobacteria were identified using differ-
ent morphological criteria according to Castenholz [20],i.e. diameter (lm), cell division patterns, and the pres-
ence or absence of a sheath for unicellular morphotypes.
Presence of septation and gas vacuoles was also consid-
ered for filamentous cyanobacteria. In addition, the
abundance of each cyanobacterial genera was deter-
mined by counting the different morphotypes obtained
from CLSM images. A total of 663 filamentous and
237 unicellular cyanobacteria were analyzed.
2.7. DGGE analysis
Genomic DNA was extracted from the mat samples
using the UltraClean Soil DNA Isolation Kit (Mobio
Laboratories, Carlsbad, USA) according to manufac-
turer�s instructions. Serial dilutions of genomic DNA
(up to 10�4) were made in sterile water and stored at�20 �C. To specifically amplify the 16S rRNA gene frag-
ments of oxygenic phototrophs, 1 or 2 ll of the DNA
dilutions were used as templates in 50 or 100 ll PCRreactions using primer pair CYA359F + GC/CYA781R
and PCR conditions as described by Nubel et al. [21].
The two different reverse primers CYA781RA and CY-
A781RC were added in separate PCR reactions. DGGE
was performed according to Schafer and Muyzer [22]with conditions optimized for the oxygenic phototroph
specific PCR fragments [21], on 1 mm thick 6% acryla-
mide/bisacrylamide gels with urea-formamide (UF) gra-
dient of 20–80%. On top of the gradient gel, an
acrylamide gel without UF was cast to obtain loading
slots. Gels were run in TAE (40 mM Tris-acetate pH
8.5, 1 mM EDTA) buffer for 3.5 h at 200 V and at a con-
stant temperature of 60 �C. Subsequently, the gels werestained in an ethidium bromide solution (0.5 lgml�1)
and inspected under UV illumination using a Fluor-S
Multi Imager (Bio-Rad, Hercules, USA). Contrast and
brightness of the photographs were optimized using
Adobe PhotoShop software (Adobe, San Jose, USA).
DNA fragments separated by DGGE were excised from
the gel [23], re-amplified, purified using the Qiaquick gel
extraction kit (Qiagen, Hilden, Germany), and then se-quenced. Purified bands were sequenced in two direc-
tions using the BigDye Terminator cycle sequencing
kit (Applied Biosystem, Foster City, USA) on an ABI
PRISM 310 genetic analyzer (Applied Biosystem). Close
relatives to consensus sequences were searched in the
GenBank Database maintained by the NCBI using
BLAST search [24]. Subsequently, new sequences and
their closest relatives were added to the ARB database[25] and aligned using the automatic alignment tool.
Alignments were then checked and corrected manually
taking the alignments of oxygenic phototrophs that were
already in the ARB database as templates. Phylogenetic
analysis was performed in ARB using several different
algorithms (e.g., maximum parsimony, neighbour-join-
ing, maximum likelihood) to check the consistency of
the tree structure. All three methods gave similar topol-ogy. Neighbour joining was used to draw the phylo-
genetic tree. The GenBank accession numbers of each

58 A. Fourcans et al. / FEMS Microbiology Ecology 51 (2004) 55–70
partial 16S rRNA gene clone (SdG1 to SdG7) are
AY393850 to AY393856.
2.8. T-RFLP analysis
The upper 2 mm of the mat cores were sliced into 200lm sections with a cryomicrotome (MICROM GmbH,
Walldorf, Germany), and from the third mm into 500
lm section for vertical depth resolution. The mat slices
were ground together with liquid nitrogen in a mortar
with a pestle and genomic DNA was extracted using
the UltraClean Soil DNA isolation kit (MoBio Labora-
tories, Carlsbad, USA) according to the manufacturer.
All extracted genomic DNA samples were stored at�20 �C until further processing. T-RFLP analysis was
performed with different primer sets, 8f–926r [26,27],
8f–SRB385 [28], and pb557f–pb750r [29], according to
the experimental conditions described in Wieland et al.
[4]. Respectively, these primer sets targeted the whole
bacterial community, the sulfate-reducing bacteria
(SRB), and the phototrophic anoxygenic bacteria
(PAB). Restriction enzymes used in T-RFLP analysiswere HaeIII and RsaI (New England Biolabs, Beverly,
UK), for analysis of the entire bacterial diversity, and
HaeIII and Hin6I for the SRB and PAB. Triplicates
for each layer were analyzed to avoid analytical artifacts
and assure the reproducibility of the method. Dominant
terminal restriction fragments (T-RFs) over 100 fluores-
cent units in intensity and present in each replicate sam-
ple were selected. The size of each T-RF was determinedaccording to molecular weight standard TAMRA 500
(Applied Biosystem) with an acceptable error of ±1
bp. From T-RF values, genus or species identification
were made by predicted digestions using the TAP-
TRFLP program of the RDP (Ribosomal Database
Project) web site (http://rdp.cme.msu.edu/) [30]. T-
RFLP profiles were normalized by calculating relative
abundances of each T-RFs from height fluorescenceintensity. Combining data from each restriction enzyme,
we compared normalized T-RFLP profiles by corre-
spondence factorial analysis (CFA).
Table 1
Comparison of physical and chemical parameters in the water column of th
Dates Temperature (�C) O2 (lmol l�1)
23.05.00 20 17.0 ± 0.1
25.05.00 23 ND
ND, not determined.a Surface.b 10 mm depth.
2.9. Correspondence factorial analysis
CFA is an ordination method by similarity matrix
that reduces in two or three dimensions the dispersion
diagram of samples compared (in this case T-RFLP pro-
files). Axes correspond to synthetic variables (T-RFs)and their influence (percent relative abundance) in the
distribution of samples analyzed [31]. Using CFA,
two-dimensional plots were prepared, showing variance
within data sets on a series of axes. To clearly present
the results two graphs were constructed using MVSP
v3.12d software (Kovach Computing Service, Anglesey,
Wales) [32]. One graph was constructed for T-RFs (or
OTUs, operational taxonomic units) and the other forlayers using the same axis.
The fact that some samples do not appear in the CFA
graph is due to insufficient DNA yield for some
analyses.
3. Results
3.1. Description and environmental conditions of the
microbial mat
3.1.1. Structure of the microbial mat
The microbial mat was composed of three distinct co-
lored layers. An upper, approximately 2 mm thick,
brown–green colored layer was composed of filamen-
tous cyanobacteria morphologically related to the genusMicrocoleus, and of unicellular cyanobacteria similar to
the form genus Synechocystis. Under this dense cyano-
bacterial layer, an �1 mm thick purple layer was com-
posed of purple non-sulfur bacteria morphologically
resembling members of Rhodospirillaceae and Chro-
matiaceae families (R. Guyoneaud, personal communi-
cation). Beneath these two layers a black zone of more
than 1 cm occurred with iron sulfide precipitates, indi-cating intense sulfate-reduction activity. The physical
and chemical parameters measured in the sampling site
(Table 1) were generally constant.
e sampling site measured at 15 h each day of sampling
Redox (mV) pH Salinity (&)
+3a ± 1 8.39 ± 0.02 103 ± 1
�4b ± 1
+90a ± 1 8.50 ± 0.02 75 ± 1
NDb

400 500 600 700 800 9000
2
4
6
8
Atte
nuat
ion
coef
fici
ent,
K0
(mm
-1)
Wavelength (mm)
1
10
100
BChl c
Phycocyanin
Chl a
BChl a
0
0.2
0.4
0.5
0.6
0.7
0.8
Scal
arir
radi
ance
(%of
inci
dent
irra
dian
ce)
Fig. 2. Depth profiles of spectral scalar irradiance in the Camargue
A. Fourcans et al. / FEMS Microbiology Ecology 51 (2004) 55–70 59
3.1.2. Depth profiles of O2, gross photosynthesis, and
spectral scalar irradiance
High O2 consumption in the mat led to a low O2 con-
centration and O2 penetration in situ during the night
(5:32 h, 17 �C, 94& (v/w)), confining the oxic zone to
the top 0.2 mm of the mat (Fig. 1). In the afternoon(15:50 h, 30 �C, 100& (v/w)), high rates of oxygenic
photosynthesis led to a strong increase in O2 concentra-
tion both in the overlying water and within the mat. The
O2 penetration depth in the mat increased to 2 mm.
Gross oxygenic photosynthesis was measurable in the
top 0.6 mm of the mat with a peak in photosynthetic
activity at 0.3–0.6 mm depth. An important photosyn-
thetic activity at 0.3–0.6 mm depth indicated the pres-ence and/or activities of oxygenic phototrophs in the
upper mat layers.
From measured spectral scalar irradiance profiles,
distinct spectral regions of pronounced absorption could
be ascribed to the presence of different pigments (Fig. 2,
upper graph). The presence of cyanobacteria led to pro-
nounced scalar irradiance minima at around 630 and
680 nm, corresponding to phycocyanin and chlorophylla (Chl a) absorption, respectively. The scalar irradiance
minima in the region between 800 and 900 nm corre-
sponds to bacteriochlorophyll a (Bchl a) absorption,
indicating the presence of purple bacteria. A shoulder
at 740–750 nm indicated some absorption by Bchl c pre-
sent in green photosynthetic bacteria. In the spectral re-
gion of 400–550 nm, scalar irradiance was strongly
attenuated due to Chl a and carotenoid absorption.
2.0
1.5
1.0
0.5
0.0
-0.5
-1.0
0 300 600 900
Photosynthesis (nmol O2 cm-3 s-1)
O2 (5:32 h)O2 (15:50 h)
O2 concentration (µM)
Dep
th (
mm
)
0 5 10 15 20 25
Fig. 1. In situ depth profiles of O2 and gross photosynthesis (bars)
measured during the afternoon (15:50 h) and night (5:32 h) in mats
from a pre-concentration pond of the Salins-de-Giraud saltern.
mat normalized to the downwelling spectral scalar irradiance at the
mat surface (upper graph). Numbers indicate depth (mm). Average
attenuation spectrum of scalar irradiance over the depth interval of 0–
0.8 mm (lower graph), calculated from the profile shown in the upper
graph. Broken lines indicate the standard deviations of the attenuation
coefficients, K0.
Absorption by Chl a, phycocyanin, Bchl a, and Bchl c
occurred in all mat layers within the top 0.8 mm ofthe mat, indicating a homogeneous distribution of these
photosynthetic groups. However, the spectral scalar
irradiance in the wavelength regions of Chl a, phycocy-
anin and carotenoid absorption were more strongly
attenuated than wavelengths corresponding to Bchl a
and Bchl c absorption (Fig. 2, lower graph), indicating
as expected a dominance of cyanobacteria in the surface
layer of the mat.
3.2. Bacterial community composition in the top active
layers of the microbial mat
3.2.1. Bacterial community composition estimated by
biomarkers
Fatty acids were the major lipid compounds found
in the microbial mat. Their distribution essentiallyencompassed C14–C22 homologues, namely n-hexadec-
9(Z)-enoic, n-hexadecanoic, n-octadec-9(Z)-enoic,
60 A. Fourcans et al. / FEMS Microbiology Ecology 51 (2004) 55–70
n-octadec-11(Z)-enoic, iso-pentadecanoic and anteiso-
pentadecanoic acids (Fig. 3(a)), typically representative
of algal and bacterial communities [33,34].
0
100
%
5.000 7.500 10.000 12.500 15.000 17.500 20.000 22.50
C10
C12
C13
C14
C15
a-C15
i-C15
C16:2
C16:1n-9
C16
i-C17
C17:1
C17
C1n
C
branched C15
a-C14
i-C14
a-C17
branched C1
40.000 42.000 44.000 46.000 48.0000
100
%
0
100
%
C27
- ∆0
C27
- ∆5
C27
- ∆22
C27
- ∆5,
22
C28
- ∆0
C29
- ∆0
C28
- ∆5
C29
-∆5C28
- ∆5,
22
C29
-∆5,
2 2
C28
-∆22
C29
-∆22
C28
-∆5,
24(2
8)
5β-C
27- ∆
027
-nor
-5β-
C28
- ∆0
10.000 15.000 20.000 25.000 30.000
0
100
%
C18
C17
C17:1
Phyt
ane
C19
C20 C21 C22
C23
C24
P1
P3
P2
C16
C23:1
9-methylhexadecane
(a)
(b)
(c)
(d)
Fig. 3. Gas chromatographic profiles showing the major (a) fatty acids, (
phytenes) from Salins-de-Giraud microbial mat.
Cyclopropylnonadecanoic acid was also a major
compound in the distribution of fatty acids. This com-
pound is abundant in purple phototrophic bacteria such
0 25.000 27.500 30.000 32.500 35.000 37.500 40.000
C18
C18:1n-7
8:2-6
18:1n-9
C20:4n-6
C20:5n-3
C20:1C20
C22
C24
C23 C25
C26
cy-C19
7
50.000 52.000 54.000 56.000 58.000rt
C37:4C37:2
C37:3
C38:3
C38:2
C38:4
35.000 40.000 45.000 50.000
C25
C26
C27
C28
C29
C30
C31
C32
C33
C34 C35
C27
-2-e
n e
C28
-2-e
ne
diploptene
C31
:2
b) alcohol and (c) alkenone fractions, (d) hydrocarbons (P1, P2, P3
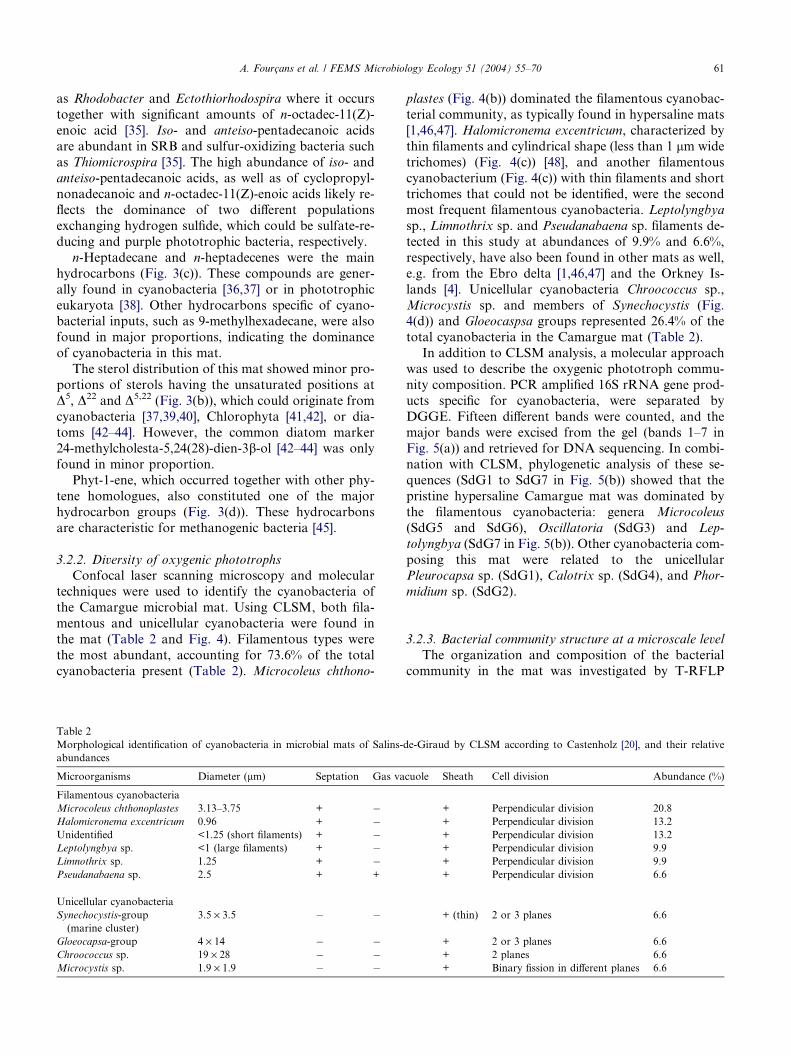
A. Fourcans et al. / FEMS Microbiology Ecology 51 (2004) 55–70 61
as Rhodobacter and Ectothiorhodospira where it occurs
together with significant amounts of n-octadec-11(Z)-
enoic acid [35]. Iso- and anteiso-pentadecanoic acids
are abundant in SRB and sulfur-oxidizing bacteria such
as Thiomicrospira [35]. The high abundance of iso- and
anteiso-pentadecanoic acids, as well as of cyclopropyl-nonadecanoic and n-octadec-11(Z)-enoic acids likely re-
flects the dominance of two different populations
exchanging hydrogen sulfide, which could be sulfate-re-
ducing and purple phototrophic bacteria, respectively.
n-Heptadecane and n-heptadecenes were the main
hydrocarbons (Fig. 3(c)). These compounds are gener-
ally found in cyanobacteria [36,37] or in phototrophic
eukaryota [38]. Other hydrocarbons specific of cyano-bacterial inputs, such as 9-methylhexadecane, were also
found in major proportions, indicating the dominance
of cyanobacteria in this mat.
The sterol distribution of this mat showed minor pro-
portions of sterols having the unsaturated positions at
D5, D22 and D5,22 (Fig. 3(b)), which could originate from
cyanobacteria [37,39,40], Chlorophyta [41,42], or dia-
toms [42–44]. However, the common diatom marker24-methylcholesta-5,24(28)-dien-3b-ol [42–44] was only
found in minor proportion.
Phyt-1-ene, which occurred together with other phy-
tene homologues, also constituted one of the major
hydrocarbon groups (Fig. 3(d)). These hydrocarbons
are characteristic for methanogenic bacteria [45].
3.2.2. Diversity of oxygenic phototrophs
Confocal laser scanning microscopy and molecular
techniques were used to identify the cyanobacteria of
the Camargue microbial mat. Using CLSM, both fila-
mentous and unicellular cyanobacteria were found in
the mat (Table 2 and Fig. 4). Filamentous types were
the most abundant, accounting for 73.6% of the total
cyanobacteria present (Table 2). Microcoleus chthono-
Table 2
Morphological identification of cyanobacteria in microbial mats of Salins-
abundances
Microorganisms Diameter (lm) Septation Gas va
Filamentous cyanobacteria
Microcoleus chthonoplastes 3.13–3.75 + �Halomicronema excentricum 0.96 + �Unidentified <1.25 (short filaments) + �Leptolyngbya sp. <1 (large filaments) + �Limnothrix sp. 1.25 + �Pseudanabaena sp. 2.5 + +
Unicellular cyanobacteria
Synechocystis-group
(marine cluster)
3.5 · 3.5 � �
Gloeocapsa-group 4 · 14 � �Chroococcus sp. 19 · 28 � �Microcystis sp. 1.9 · 1.9 � �
plastes (Fig. 4(b)) dominated the filamentous cyanobac-
terial community, as typically found in hypersaline mats
[1,46,47]. Halomicronema excentricum, characterized by
thin filaments and cylindrical shape (less than 1 lm wide
trichomes) (Fig. 4(c)) [48], and another filamentous
cyanobacterium (Fig. 4(c)) with thin filaments and shorttrichomes that could not be identified, were the second
most frequent filamentous cyanobacteria. Leptolyngbya
sp., Limnothrix sp. and Pseudanabaena sp. filaments de-
tected in this study at abundances of 9.9% and 6.6%,
respectively, have also been found in other mats as well,
e.g. from the Ebro delta [1,46,47] and the Orkney Is-
lands [4]. Unicellular cyanobacteria Chroococcus sp.,
Microcystis sp. and members of Synechocystis (Fig.4(d)) and Gloeocaspsa groups represented 26.4% of the
total cyanobacteria in the Camargue mat (Table 2).
In addition to CLSM analysis, a molecular approach
was used to describe the oxygenic phototroph commu-
nity composition. PCR amplified 16S rRNA gene prod-
ucts specific for cyanobacteria, were separated by
DGGE. Fifteen different bands were counted, and the
major bands were excised from the gel (bands 1–7 inFig. 5(a)) and retrieved for DNA sequencing. In combi-
nation with CLSM, phylogenetic analysis of these se-
quences (SdG1 to SdG7 in Fig. 5(b)) showed that the
pristine hypersaline Camargue mat was dominated by
the filamentous cyanobacteria: genera Microcoleus
(SdG5 and SdG6), Oscillatoria (SdG3) and Lep-
tolyngbya (SdG7 in Fig. 5(b)). Other cyanobacteria com-
posing this mat were related to the unicellularPleurocapsa sp. (SdG1), Calotrix sp. (SdG4), and Phor-
midium sp. (SdG2).
3.2.3. Bacterial community structure at a microscale level
The organization and composition of the bacterial
community in the mat was investigated by T-RFLP
de-Giraud by CLSM according to Castenholz [20], and their relative
cuole Sheath Cell division Abundance (%)
+ Perpendicular division 20.8
+ Perpendicular division 13.2
+ Perpendicular division 13.2
+ Perpendicular division 9.9
+ Perpendicular division 9.9
+ Perpendicular division 6.6
+ (thin) 2 or 3 planes 6.6
+ 2 or 3 planes 6.6
+ 2 planes 6.6
+ Binary fission in different planes 6.6
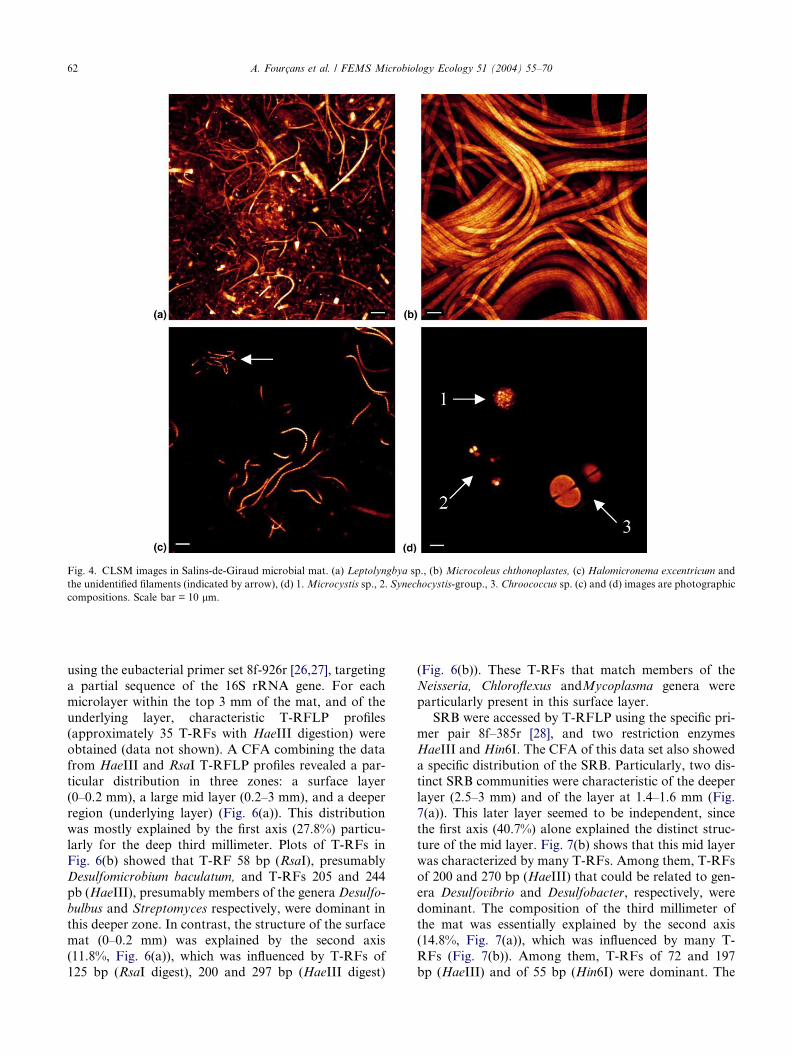
Fig. 4. CLSM images in Salins-de-Giraud microbial mat. (a) Leptolyngbya sp., (b) Microcoleus chthonoplastes, (c) Halomicronema excentricum and
the unidentified filaments (indicated by arrow), (d) 1.Microcystis sp., 2. Synechocystis-group., 3. Chroococcus sp. (c) and (d) images are photographic
compositions. Scale bar = 10 lm.
62 A. Fourcans et al. / FEMS Microbiology Ecology 51 (2004) 55–70
using the eubacterial primer set 8f-926r [26,27], targeting
a partial sequence of the 16S rRNA gene. For each
microlayer within the top 3 mm of the mat, and of the
underlying layer, characteristic T-RFLP profiles(approximately 35 T-RFs with HaeIII digestion) were
obtained (data not shown). A CFA combining the data
from HaeIII and RsaI T-RFLP profiles revealed a par-
ticular distribution in three zones: a surface layer
(0–0.2 mm), a large mid layer (0.2–3 mm), and a deeper
region (underlying layer) (Fig. 6(a)). This distribution
was mostly explained by the first axis (27.8%) particu-
larly for the deep third millimeter. Plots of T-RFs inFig. 6(b) showed that T-RF 58 bp (RsaI), presumably
Desulfomicrobium baculatum, and T-RFs 205 and 244
pb (HaeIII), presumably members of the genera Desulfo-
bulbus and Streptomyces respectively, were dominant in
this deeper zone. In contrast, the structure of the surface
mat (0–0.2 mm) was explained by the second axis
(11.8%, Fig. 6(a)), which was influenced by T-RFs of
125 bp (RsaI digest), 200 and 297 bp (HaeIII digest)
(Fig. 6(b)). These T-RFs that match members of the
Neisseria, Chloroflexus andMycoplasma genera were
particularly present in this surface layer.
SRB were accessed by T-RFLP using the specific pri-mer pair 8f–385r [28], and two restriction enzymes
HaeIII and Hin6I. The CFA of this data set also showed
a specific distribution of the SRB. Particularly, two dis-
tinct SRB communities were characteristic of the deeper
layer (2.5–3 mm) and of the layer at 1.4–1.6 mm (Fig.
7(a)). This later layer seemed to be independent, since
the first axis (40.7%) alone explained the distinct struc-
ture of the mid layer. Fig. 7(b) shows that this mid layerwas characterized by many T-RFs. Among them, T-RFs
of 200 and 270 bp (HaeIII) that could be related to gen-
era Desulfovibrio and Desulfobacter, respectively, were
dominant. The composition of the third millimeter of
the mat was essentially explained by the second axis
(14.8%, Fig. 7(a)), which was influenced by many T-
RFs (Fig. 7(b)). Among them, T-RFs of 72 and 197
bp (HaeIII) and of 55 bp (Hin6I) were dominant. The

Fig. 5. (a) DGGE analysis of 16S rRNA gene fragments of oxygenic phototrophs. The PCR products were obtained with two different primer sets
and genomic DNA from the microbial mat of Salins-de-Giraud (SdG). Lanes 1 and 6, marker fragments; lanes 2 and 3, PCR products obtained with
primers CYA359F and GC/CYA781Rb; lanes 4 and 5 PCR products obtained with primers CYA359F + GC/CYA781Ra. 300 ng PCR product was
loaded in each lane. The numbers in figures refer to bands that were excised from the gel, sequenced and used for phylogenetic analysis. (b)
Neighbour-joining phylogenetic tree based on 16S rRNA gene sequence data showing the affiliation of predominant oxygenic phototrophs (i.e.,
cyanobacteria and diatoms) in the microbial mat of Salins-de-Giraud. Sequences determined in this study are shown in bold. The consistency of the
tree structure was checked using several different algorithms. The sequences of Thermus aquaticus and Chloroflexus aurantiacus were used as the
outgroup, but were pruned from the tree. The scale bar represents 10% estimated sequence divergence.
A. Fourcans et al. / FEMS Microbiology Ecology 51 (2004) 55–70 63
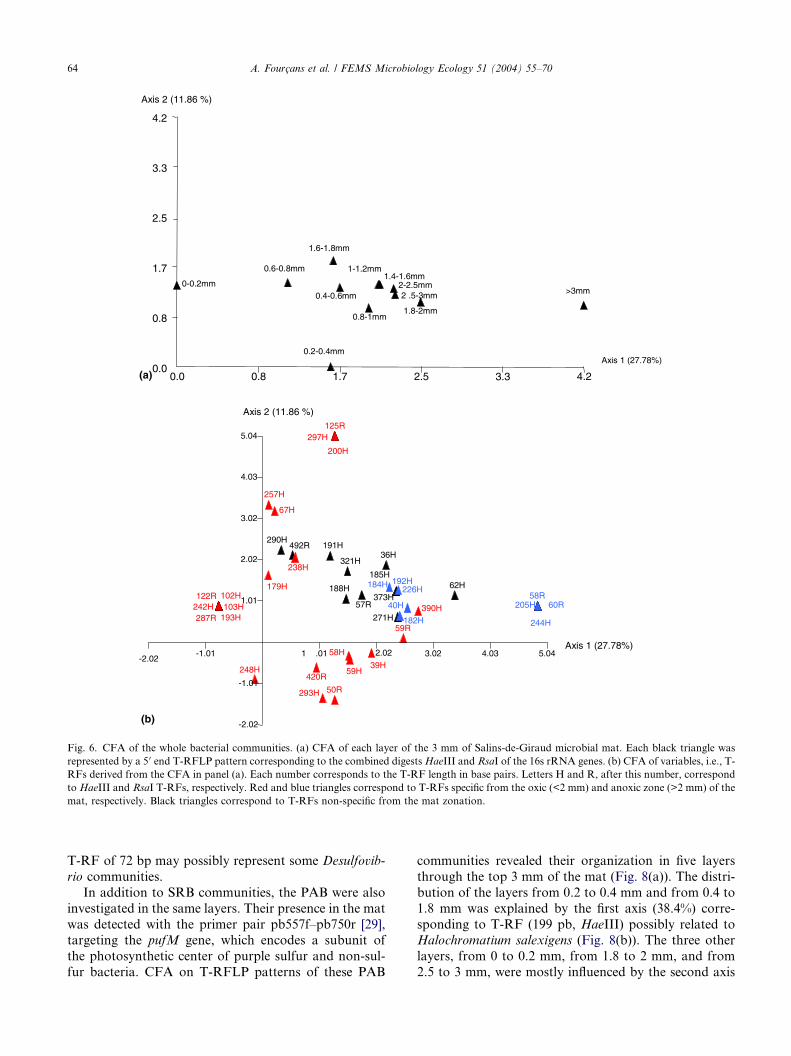
-2.02
Axis 2 (11.86 %)
Axis 2 (11.86 %)
Axis 1 (27.78%)
36H
39H
40H
50R
57R
58H
58R
59H
59R
60R
62H
67H
102H103H
122R
125R
179H
182H
184H185H
188H
191H
192H
193H
200H
205H
226H
238H
242H
244H
248H
257H
271H287R
290H
293H
297H
321H
373H390H
420R
492R
-1.01
-2.02
1.01
2.02
3.02
4.03
5.04
-1.01 1 .01 2.02 3.02 4.03 5.04
Axis 1 (27.78%)
0.0 0.8 1.7 2.5 3.3 4.2
2.5
3.3
4.2
1.7
0.8
0-0.2mm
0.2-0.4mm
0.4-0.6mm
0.6-0.8mm
0.8-1mm
1-1.2mm1.4-1.6mm
1.6-1.8mm
1.8-2mm
2-2.5mm2 .5-3mm >3mm
0.0(a)
(b)
Fig. 6. CFA of the whole bacterial communities. (a) CFA of each layer of the 3 mm of Salins-de-Giraud microbial mat. Each black triangle was
represented by a 5 0 end T-RFLP pattern corresponding to the combined digestsHaeIII and RsaI of the 16s rRNA genes. (b) CFA of variables, i.e., T-
RFs derived from the CFA in panel (a). Each number corresponds to the T-RF length in base pairs. Letters H and R, after this number, correspond
to HaeIII and RsaI T-RFs, respectively. Red and blue triangles correspond to T-RFs specific from the oxic (<2 mm) and anoxic zone (>2 mm) of the
mat, respectively. Black triangles correspond to T-RFs non-specific from the mat zonation.
64 A. Fourcans et al. / FEMS Microbiology Ecology 51 (2004) 55–70
T-RF of 72 bp may possibly represent some Desulfovib-
rio communities.
In addition to SRB communities, the PAB were also
investigated in the same layers. Their presence in the mat
was detected with the primer pair pb557f–pb750r [29],targeting the pufM gene, which encodes a subunit of
the photosynthetic center of purple sulfur and non-sul-
fur bacteria. CFA on T-RFLP patterns of these PAB
communities revealed their organization in five layers
through the top 3 mm of the mat (Fig. 8(a)). The distri-
bution of the layers from 0.2 to 0.4 mm and from 0.4 to
1.8 mm was explained by the first axis (38.4%) corre-
sponding to T-RF (199 pb, HaeIII) possibly related toHalochromatium salexigens (Fig. 8(b)). The three other
layers, from 0 to 0.2 mm, from 1.8 to 2 mm, and from
2.5 to 3 mm, were mostly influenced by the second axis
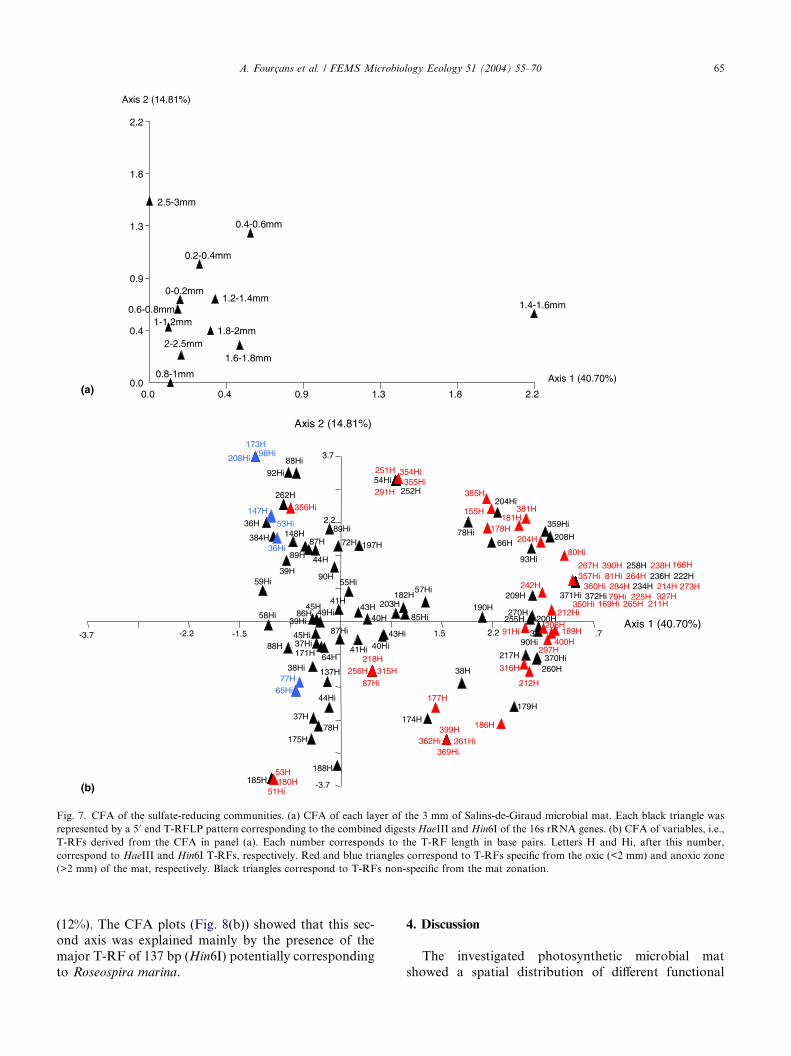
Axis 2 (14.81%)
Axis 1 (40.70%)
0-0.2mm
0.2-0.4mm
0.4-0.6mm
0.6-0.8mm
0.8-1mm
1-1.2mm
1.2-1.4mm1.4-1.6mm
1.6-1.8mm
1.8-2mm2-2.5mm
2.5-3mm
0.0
0.4
0.9
1.3
1.8
2.2
0.0 0.4 0.9 1.3 1.8 2.2
Axis 2 (14.81%)
Axis 1 (40.70%)
36H
37H
38H
39H
40H
41H43H
44H
45H
53H
64H
66H72H
77H
86H
87H
88H
89H
90H
137H
147H
148H
155H
166H
171H
173H
174H
175H
177H
178H
179H
180H
181H
182H
185H
186H
188H
189H
190H
197H
200H
203H
204H
206H
208H
209H211H
212H
214H
217H218H
222H
225H234H
236H238H
242H
251H
252H
255H
256H
258H
260H
262H
264H
265H
267H
270H
273H284H
291H
297H
315H 316H
327H
381H
384H
385H
390H
399H
400H
36Hi
37Hi
38Hi
39Hi
40Hi41Hi
43Hi45Hi
44Hi
49Hi
51Hi
53Hi
54Hi
55Hi57Hi
58Hi
59Hi
65Hi
78Hi
79Hi
80Hi
81Hi
85Hi
87Hi
87Hi
88Hi
89Hi
90Hi91Hi
92Hi
93Hi
98Hi
169Hi
204Hi
208Hi
212Hi350Hi
354Hi355Hi
356Hi
357Hi
359Hi
360Hi
361Hi362Hi369Hi
370Hi
371Hi 372Hi
-3.7
2.2
3.7
-2.2-3.7 1.5 3 .7
78H
2.2-1.5
(a)
(b)
Fig. 7. CFA of the sulfate-reducing communities. (a) CFA of each layer of the 3 mm of Salins-de-Giraud microbial mat. Each black triangle was
represented by a 5 0 end T-RFLP pattern corresponding to the combined digests HaeIII and Hin6I of the 16s rRNA genes. (b) CFA of variables, i.e.,
T-RFs derived from the CFA in panel (a). Each number corresponds to the T-RF length in base pairs. Letters H and Hi, after this number,
correspond to HaeIII and Hin6I T-RFs, respectively. Red and blue triangles correspond to T-RFs specific from the oxic (<2 mm) and anoxic zone
(>2 mm) of the mat, respectively. Black triangles correspond to T-RFs non-specific from the mat zonation.
A. Fourcans et al. / FEMS Microbiology Ecology 51 (2004) 55–70 65
(12%). The CFA plots (Fig. 8(b)) showed that this sec-ond axis was explained mainly by the presence of the
major T-RF of 137 bp (Hin6I) potentially corresponding
to Roseospira marina.
4. Discussion
The investigated photosynthetic microbial mat
showed a spatial distribution of different functional

Axis 2 (12.06%)
Axis 1 (38.43%)
0-0.2mm
0.2-0.4mm
0.4-0.6mm
0.6-0.8mm
0.8-1mm
1-1.2mm
1.2-1.4mm
1.4-1.6mm 1.6-1.8mm
1.8-2mm
2-2.5mm
2.5-3mm
0.0
0.3
0.5
0.8
1.0
1.3
0.0 0.3 0.5 0.8 1.0 1.3
Axis 1 (38.43%)
-4.3
Axis 2 (12.06%)
39H
93H
130H
136H
186H
199H
227H
40Hi
62Hi
93Hi
115Hi
130Hi
137Hi
146Hi
154Hi
196Hi
200Hi
209Hi
213Hi
-1.4
-2.9
1.4
2.9
4.3
5.8
7.2
-1.4-2.9-4.3 1.4 2.9 4.3 5.8 7.2
(a)
(b)
Fig. 8. CFA of the phototrophic anoxygenic communities. (a) CFA of each layer of the 3 mm of Salins de Giraud microbial mat. Each black triangle
was represented by a 5 0 end T-RFLP pattern corresponding to the combined digests HaeIII and Hin6I of the PufM encoding gene. (b) CFA of
variables, i.e., T-RFs derived from the CFA in panel (a). Each number corresponds to the T-RF length in base pairs. Letters H and Hi, after this
number, correspond toHaeIII andHin6I T-RFs, respectively. Red and blue triangles correspond to T-RFs specific from the oxic (<2 mm) and anoxic
zone (>2 mm) of the mat, respectively. Black triangles correspond to T-RFs non-specific from the mat zonation.
66 A. Fourcans et al. / FEMS Microbiology Ecology 51 (2004) 55–70
groups at the microscale level. As revealed by spectral
scalar irradiance (Fig. 2), by CLSM (Table 2), and byDGGE (Fig. 5), the cyanobacteria were dominant and
rather diverse photosynthetic microorganisms active in
the first millimeter of the mat. Analyses of biomarkers(Fig. 3) corroborated these observations of a dominance

A. Fourcans et al. / FEMS Microbiology Ecology 51 (2004) 55–70 67
of oxygenic phototrophs, since major fatty acids (n-oct-
adec-9(Z)-enoic acid), alcohols (5a(H)-stanols), and
hydrocarbons (n-heptadecane, n-heptadecenes, and 9-
methylhexadecane) found in this mat corresponded to
cyanobacteria [49].
Identification of oxygenic phototrophs down to thegenus or even species level was done by confocal laser
scanning microscopy and sequencing analysis (PCR-
DGGE-sequencing). Two dominant filamentous cyano-
bacteria Microcoleus sp. and Leptolyngbya sp. were
identified by both techniques. Other oxygenic photo-
trophs were either identified by CLSM (Halomicronema,
Limnothrix, Pseudanabaena, Synechocystis – group, Glo-
eocapsa – group, Chroococcus, and Microcystis) or bysequencing analysis (Phormidium, Calotrix, Pleurocapsa,
Oscillatoria). Thus, the combination of both CLSM and
DGGE was useful to fully describe the oxygenic photo-
trophic communities.
As described previously, bacterial biodiversity de-
pends on gradient salinity, with a decreasing bacterial
diversity when salinity increases [50–52]. However, in
this investigated halophilic microbial mat, the diversityof oxygenic phototrophs is moderate in comparison to
those previously described [53] with the dominance of
M. chthonoplastes a typical inhabitant of halophilic
microbial mat [54–56]. At higher salinities, other cyano-
bacterial morphotypes, like Phormidium, could be
dominant [5].
Within the mat, analysis of biomarkers revealed the
presence of purple bacteria like Rhodobacter andEctothiorhodospira, and also of SRB. Iso- and anteiso-
pentadecanoic acids are abundant in SRB and sulfur-
oxidizing bacteria such as Thiomicrospira [35].
Cyclopropylnonadecanoic acid was also a major com-
pound in the distribution of fatty acids. This compound
is abundant in purple phototrophic bacteria such as
Rhodobacter and Ectothiorhodospira where it occurs to-
gether with significant amounts of n-octadec-11(Z)-enoic acid [35]. The ratio between these two acids (0.5)
could be related to the growth status of the microbial
mat, with a high relative proportion of the cyclopropyl
acid being indicative of stationary growth [57]. The high
abundance of iso- and anteiso-pentadecanoic acids, as
well as of cyclopropylnonadecanoic and n-octadec-
11(Z)-enoic acids likely reflects the dominance of two
different populations exchanging hydrogen sulfide,which could be sulfate-reducing and purple photo-
trophic bacteria, respectively. By the use of specific
primer sets, T-RFLP allowed us to distinguish photo-
synthetic anoxygenic bacteria (PAB) and SRB organ-
ized in five and three distinct bacterial groups
among the first 3 mm of this mat, respectively (Figs. 7
and 8).
Measurements of the spectral scalar irradiance re-vealed the presence of purple bacteria in the surface
layer of the mat, especially in the zone at 0.5–0.8 mm
depth (Fig. 2). This confirms the observation with T-
RFLP, showing the presence of distinct populations at
0.4–1.8 mm. In contrast, only few PAB were observed
in the upper layer (0–0.4 mm) (Fig. 8(a)). Therefore,
the PAB developing at greater depths in the mat could
be adapted to lower light intensities, as compared tothe PAB community of the surface layer, since light is
strongly attenuated in the mat (Fig. 2). Moreover, oxy-
gen could also play a role in the stratification of the
PAB, discriminating populations of different tolerance
to the presence of oxygen, especially in the surface layer
of the mat with high oxygen concentrations (Fig. 1).
We could demonstrate the presence of Desulfobacter-
like and Desulfovibrio-like SRB, in the mid layer of themat, corresponding to the fluctuating oxic and anoxic
zone during the diel cycle (Fig. 1). Many Desulfovibrio
species were isolated from the oxic zone of microbial
mats, and were found to be able to tolerate and consume
oxygen [58,59]. An oxygen tolerant SRB community
that could not be correlated by T-RFLP to any known
SRB inhabited the 1.6 mm top layer that is completely
oxic during the day. Previous molecular studies have de-scribed the presence of Desulfonema-like species in the
oxic surface layer of several microbial mats [60,61]. They
were found to be metabolically versatile with a high
affinity to oxygen. In the deeper 3 mm layer, our study
showed that one SRB population was specific to the an-
oxic layer, indicating probably a high sensitivity to oxy-
gen. Thus, T-RFLP analysis illustrated a vertical
stratification of the SRB within the top 3 mm layers ofthe mat, that could be explained by their behavioral re-
sponses to oxygen including aggregation, migration to
anoxic zones, and aerotaxis [58].
The microscale zonation of these populations is
partly controlled by the microgradients of oxygen, sul-
fide and light. In the investigated mat, no free sulfide
was measurable with microsensors (Fig. 2), but iron sul-
fide precipitates, and measurements of sulfate reductionrates (SRR) (Rod Herbert, unpublished results) indi-
cated high bacterial sulfate reduction activity and subse-
quent precipitation of the produced sulfide by iron.
Investigation of the biogeochemistry of the mat in year
2001 confirmed that this Camargue mat is characterized
by high sulfate reduction rates and a high iron and FeS
content [62]. Additionally, in this mat Chloroflexus-like
bacteria, detected by T-RFLP, were found as importantmembers in the surface layer community (Fig. 6). Their
presence was also indicated by the BChl c absorption de-
tected in the top layer of the mat (Fig. 2). These micro-
organisms could play an important role in hypersaline
and iron-rich microbial mats [63].
Biomarkers also evidenced organic matter contribu-
tions to these microbial mats from other origins. Thus,
C37–C38 di-, tri- and tetra-unsaturated alkenones (Fig.3(b)) are specific of Hapthophyceae [64,65]. However,
their occurrence cannot be attributed to species typically
68 A. Fourcans et al. / FEMS Microbiology Ecology 51 (2004) 55–70
found in pelagic environments and are probably related
to unknown species. Moreover, a distribution of C23–
C35 n-alkanes predominated by the odd carbon num-
bered homologues, namely C29, C31 and C33, was found.
This distribution is representative of inputs from higher
plants [66] and is currently found in microbial sedimentsfrom coastal environments [67]. The allochthonous ori-
gin of these n-alkanes is clear based on their biosynthetic
origin. The absence of higher plants nearby hypersaline
systems suggest that their presence in microbial mat sys-
tems such as the one in Camargue may reflect the influ-
ence of wind transported remains from nearby higher
plants, as already observed in other hypersaline areas
[67]. Further evidence of the external origin of theseC23–C35 n-alkanes has been obtained in other coastal
Mediterranean systems from comparison of the d13 C
isotopic composition of these n-alkanes and in situ gen-
erated microbial mat lipids. Whereas the former exhibit
the typical values of higher plant compounds, e.g.
<�20&, the latter reflect the intense use of CO2 as con-
sequence of the high productivity and therefore the d13
C isotopic values are much heavier, >�20& [68].
5. Conclusions
The results presented here demonstrated a clear strat-
ification of the main photosynthetic and sulfur bacterial
populations in distinct and specific vertical microlayers
according to their physiological characteristics. The firstactive millimeter of this photosynthetic microbial mat
was dominated by filamentous cyanobacteria such as
M. chtonoplastes. Beneath this cyanobacterial layer, sul-
fur oxidizing bacteria like Thiomicrospira were present.
Although diverse anoxygenic phototrophic bacteria
such as Rhodobacter and Ectothiorhodospira inhabited
this mat, H. salexigens and R. marina were dominant
in surface and deep zones, respectively. Sulfate reducingbacteria responsible of high sulfate reduction rates were
distributed within the depth profile. Desulfonema domi-
nated the oxic surface, Desulfobacter and Desulfovibrio
the mid oxic–anoxic layer while oxygen sensitive SRB
were located in the deeper zone. Others organisms such
as algae and diatoms contributed to the microbial mat
structure and development.
In man-made artificial salterns, where such a type ofmat develops, environmental conditions can change dra-
matically on a short term [62]. The structures of bacte-
rial communities in microbial mats have mainly been
described globally at the macroscale level. In contrast,
this study of the hypersaline Camargue microbial mat
represents the first exhaustive investigation, which
clearly shows the structure and the distribution of the
main bacterial communities at the microscale levelaccording to the microgradients of oxygen and light.
Acknowledgements
We acknowledge the financial support by the EC
(MATBIOPOL project, grant EVK3-CT-1999-00010).
The authors are grateful to the company of Salins-du-
midi at Salins-de-Giraud for facilitating access to thesalterns, sampling and field experiments. A.F. is partly
supported by a doctoral grant from the general council
of Atlantic Pyrenees. M.K. was supported by the Danish
Natural Science Research Council (contract no.
9700549). Anni Glud is gratefully acknowledged for
microsensor construction and assistance during the field
experiment.
References
[1] Esteve, I., Martınez, M., Mir, J. and Guerrero, R. (1992)
Typology and structure of microbial mats communities in Spain:
A preliminary study. Limnetica 8, 185–195.
[2] Mir, J., Martınez-Alonso, M., Esteve, I. and Guerrero, R. (1991)
Vertical stratification and microbial assemblage of a microbial
mat in the Ebro Delta (Spain). FEMS Microbiol. Ecol. 86, 59–
68.
[3] van Gemerden, H., Tughan, C.S., de Wit, R. and Herbert, R.A.
(1989) Laminated microbial ecosystems on sheltered beaches in
Scapa Flow, Orkney Islands. FEMS Microbiol. Lett. 62, 87–
101.
[4] Wieland, A., Kuhl, M., McGowan, L., Fourcans, A., Duran, R.,
Caumette, P., Garcia De Oteyza, T., Grimalt, J.O., Sole, A.,
Diestra, E., Esteve, I. and Herbert, R.A. (2003) Microbial mats on
the Orkney islands revisited: microenvironment and microbial
community composition. Microbial Ecol. 46, 371–390.
[5] Caumette, P., Matheron, R., Raymond, N. and Relexans, J.C.
(1994) Microbial mats in the hypersaline ponds of Mediterranean
salterns (Salins-de-Giraud, France). FEMS Microbiol. Ecol. 13,
273–286.
[6] Giani, D., Seeler, J., Giani, L. and Krumbein, W.E. (1989)
Microbial mats and physicochemistry in a saltern in the Bretagne
(France) and in a laboratory scale saltern model. FEMS Micro-
biol. Ecol. 62, 151–162.
[7] van Gemerden, H. (1993) Microbial mats: A joint venture. Marine
Geol. 113, 3–25.
[8] Revsbech, N.P., Jørgensen, B.B., Blackburn, T.H. and Cohen, Y.
(1983) Microelectrode studies of the photosynthesis and O2, H2S
and pH profiles of a microbial mat. Limnol. Oceanogr. 28, 1062–
1074.
[9] Moune, S., Caumette, P., Matheron, R. and Willison, J.C. (2003)
Molecular sequence analysis of prokaryotic diversity in the anoxic
sediments underlying cyanobacterial mats of two hypersaline
ponds in Mediterranean salterns. FEMSMicrobiol. Ecol. 44, 117–
130.
[10] Moune, S., Eatock, C., Matheron, R., Willison, J.C., Hirschler,
A., Herbert, R. and Caumette, P. (2000) Orenia salinaria sp. nov.,
a fermentative bacterium isolated from anaerobic sediments of
Mediterranean salterns. Int. J. Syst. Evol. Microbiol. 50 (Pt 2),
721–729.
[11] Moune, S., Manac�h, N., Hirschler, A., Caumette, P., Willison,
J.C. and Matheron, R. (1999) Haloanaerobacter salinarius sp.
nov., a novel halophilic fermentative bacterium that reduces
glycine-betaine to trimethylamine with hydrogen or serine as
electron donors; emendation of the genus Haloanaerobacter. Int.
J. Syst. Bacteriol. 49 (Pt 1), 103–112.

A. Fourcans et al. / FEMS Microbiology Ecology 51 (2004) 55–70 69
[12] Jørgensen, B.B. and Des Marais, D.J. (1988) Optical properties of
benthic photosynthetic communities: Fiber-optic studies of
cyanobacterial mats. Limnol. Oceanogr. 33, 99–113.
[13] Caumette, P., Baulaigue, R. and Matheron, R. (1988) Character-
ization of Chromatium salexigens sp. nov., a halophilic Chromat-
iaceae isolated from Mediterranean salinas. Syst. Appl.
Microbiol. 10, 284–292.
[14] Caumette, P., Baulaigue, R. and Matheron, R. (1991) Thiocapsa
halophila sp. nov., a new halophilic phototrophic purple sulfur
bacterium. Arch. Microbiol. 155, 170–176.
[15] Revsbech, N.P. (1989) An oxygen microelectrode with a guard
cathode. Limnol. Oceanogr. 34, 474–478.
[16] Grasshoff, K., Ehrhardt, M. and Kremling, K. (1983) Methods of
seawater analysis, Weinheim.
[17] Revsbech, N.P. and Jørgensen, B.B. (1983) Photosynthesis of
benthic microflora measured with high spatial resolution by the
oxygen microprofile method: Capabilities and limitations of the
method. Limnol. Oceanogr. 28, 749–756.
[18] Lassen, C., Ploug, H. and Jørgensen, B.B. (1992) A fibre-optic
scalar irradiance microsensor: application for spectral light
measurements in sediments. FEMS Microbiol. Ecol. 86, 247–254.
[19] Kuhl, M. and Fenchel, T. (2000) Bio-optical characteristics and
the vertical distribution of photosynthetic pigments and photo-
synthesis in an artificial cyanobacterial mat. Microbial Ecol. 40,
94–103.
[20] Castenholz, R.W. (2001) Phylum Bx. Cyanobacteria. Oxygenic
Photosynthetic Bacteria, 2nd ed., New York, pp. 473–599.
[21] Nubel, U., Garcia-Pichel, F. and Muyzer, G. (1997) PCR primers
to amplify 16S rRNA genes from cyanobacteria. Appl. Environ.
Microbiol. 63, 3327–3332.
[22] Schafer, H. and Muyzer, G. (2001) Denaturing Gradient Gel
Electrophoresis in Marine Microbial Ecology. pp. 425–468.
[23] Muyzer, G., Brinkhoff, T., Nubel, U., Santegoeds, C., Schafer, H.
and Wawer, C. (1998) Denaturing gradient gel electrophoresis
(DGGE) in microbial ecology. Kluwer, Dordrecht, 1–27.
[24] Wheeler, D.L., Church, D.M., Federhen, S., Lash, A.E., Madden,
T.L., Pontius, J.U., Schuler, G.D., Schriml, L.M., Sequeira, E.,
Tatusova, T.A. and Wagner, L. (2003) Database resources of the
National Center for Biotechnology. Nucl. Acids Res. 31, 28–33.
[25] Ludwig, W., Strunk, O., Westram, R., Richter, L., Meier, H.,
Yadhukumar, A., Buchner, A., Lai, T., Steppi, S., Jobb, G.,
Forster, W., Brettske, I., Gerber, S., Ginhart, A.W., Gross, O.,
Grumann, S., Hermann, S., Jost, R., Konig, A., Liss, T.,
Lussmann, R., May, M., Nonhoff, B., Reichel, B., Strehlow, R.,
Stamatakis, A., Stuckmann, N., Vilbig, A., Lenke, M., Ludwig,
T., Bode, A. and Schleifer, K.-H. (2004) ARB: a software
environment for sequence data. Nucl. Acids. Res. 32, 1363–1371.
[26] Lane, D.J. (1991) rRNA Sequencing. pp. 115–175.
[27] Weisburg, W.G., Barns, S.M., Pelletier, D.A. and Lane, D.J.
(1991) 16S ribosomal DNA amplification for phylogenetic study.
J. Bacteriol. 173, 697–703.
[28] Amann, R., Binder, B., Olson, R., Chisholm, S., Devereux, R.
and Stahl, D. (1990) Combination of 16S rRNA-targeted oligo-
nucleotide probes with flow cytometry for analyzing mixed
microbial populations. Appl. Environ. Microbiol. 56, 1919–1925.
[29] Achenbach, L.A., Carey, J. and Madigan, M.T. (2001) Photo-
synthetic and phylogenetic primers for detection of anoxygenic
phototrophs in natural environments. Appl. Environ. Microbiol.
67, 2922–2926.
[30] Maidak, B.L., Cole, J.R., Lilburn, T.G., Parker Jr., C.T.,
Saxman, P.R., Farris, R.J., Garrity, G.M., Olsen, G.J., Schmidt,
T.M. and Tiedje, J.M. (2001) The RDP-II (Ribosomal Database
Project). Nucl. Acids Res. 29, 173–174.
[31] Gauch, J.H.G. (1982) Multivariate Analysis in Community
Ecology, New York, p. 298.
[32] Kovach, W.L. (1999) MVSP – a Multivariate Statistical Package
for Windows, ver. 3.1., Wales UK.
[33] Grimalt, J.O. and Albaiges, J. (1990) Characterization of the
depositional environments of the Ebro Delta (western Mediter-
ranean) by the study of sedimentary lipid markers. Marine Geol.
95, 207–224.
[34] Volkman, J.K., Johns, R.B., Guillan, F.T., Perry, G.J. and Bavor,
H.J. (1980) Microbial lipids of an intertidal sediment-I. Fatty
acids and hydrocarbons. Geochim. Cosmochim. Acta 44, 1133–
1143.
[35] Grimalt, J.O., de Witt, R., Teixidor, P. and Albaiges, J. (1992)
Lipid biogeochemistry of Phormidium andMicrocoleus mats. Org.
Geochem. 19, 509–530.
[36] Han, J., McCarthy, E.D., Calvin, M. and Benn, M.H. (1968)
Hydrocarbon constituents of the blue-green algae Nostoc musco-
rum, Anacystis nudulans, Phormidium luridum and Chlorogloea
fritschii. J. Chem. Soc., 2785–2791.
[37] Paoletti, C., Pushparaj, B., Florenzano, G., Capella, P. and
Lercker, G. (1976) Unsaponifiable matter of green and blue-green
algal lipids as a factor of biochemical differentiation of their
biomasses: II. Terpenic alcohol and sterol fractions. Lipids 11,
266–271.
[38] Blumer, M., Guillard, R.R.L. and Chase, T. (1971) Hydrocarbons
of marine phytoplankton. Marine Biol. 8, 183–189.
[39] Nes, W.R. and McKean, M.L. (1977). Biogeochemistry of
Steroids and Other Isoprenoids, Baltimore, MD.
[40] Nishimura, M. (1977) Origin of stanols in young lacustrine
sediments. Nature 270, 711–712.
[41] Patterson, G.W. (1974) Sterols of some green algae. Comp.
Biochem. Physiol. B 47, 453–457.
[42] Ballantine, J.A., Lavis, A. and Morris, R.J. (1979) Sterols of the
phytoplankton – effects of illumination and growth stage.
Phytochemistry 18, 1459–1466.
[43] Orcutt, D.M. and Paterson, G.W. (1975) Sterol, fatty acid and
elemental composition of diatoms grown in chemically defined
media. Comp. Biochem. Physiol. B 50, 579–583.
[44] Kates, M., Tremblay, P., Anderson, R. and Volcani, B.E. (1978)
Identification of the free and conjugated sterol in a non-
photosynthetic diatom, Nitzschia alba as 24-methylene choles-
terol. Lipids 13, 34–41.
[45] Tornabene, T.G., Langworthy, T.A., Holzer, G. and Oro, J.
(1979) Squalenes, phytanes and other isoprenoids as major
neutral lipids of methanogenic and thermoacidophilic ‘‘archae-
bacteria’’. J. Mol. Evolut. 13, 73–83.
[46] Sole, A., Gaju, N. and Esteve, I. (2003) The biomass dynamics of
cyanobacteria in an annual cycle determined by confocal laser
scanning microscopy. Scanning 25, 1–7.
[47] Sole, A., Gaju, N., Guerrero, R. and Esteve, I. (1998) Confocal
laser scanning microscopy of Ebro Delta microbial mats. Microsc.
Anal. (Europ. Ed) 29, 13–15.
[48] Abed, R.M., Garcia-Pichel, F. and Hernandez-Marine, M. (2002)
Polyphasic characterization of benthic, moderately halophilic,
moderately thermophilic cyanobacteria with very thin trichomes
and the proposal of Halomicronema excentricum gen. nov., sp.
nov. Arch. Microbiol. 177, 361–370.
[49] Chuecas, L. and Riley, J.P. (1969) Component fatty acids of the
total lipids of some marine phytoplankton. J. Marine Biol. Assoc.
UK 49, 97–116.
[50] Benlloch, S., Lopez-Lopez, A., Casamayor, E.O., Ovreas, L.,
Goddard, V., Daae, F.L., Smerdon, G., Massana, R., Joint, I.,
Thingstad, F., Pedros-Alio, C. and Rodriguez-Valera, F. (2002)
Prokaryotic genetic diversity throughout the salinity gradient of a
coastal solar saltern. Environ. Microbiol. 4, 349–360.
[51] Casamayor, E.O., Massana, R., Benlloch, S., Ovreas, L., Diez, B.,
Goddard, V.J., Gasol, J.M., Joint, I., Rodrıguez-Valera, F. and
Pedros-Alio, C. (2002) Changes in archaeal, bacterial and
eukaryal assemblages along a salinity gradient by comparison of
genetic fingerprinting methods in a multipond solar saltern.
Environ. Microbiol. 4, 338–348.
70 A. Fourcans et al. / FEMS Microbiology Ecology 51 (2004) 55–70
[52] Nubel, U., Garcıa-Pichel, F. and Muyzer, G. (2000) The
halotolerance and phylogeny of cyanobacteria with tightly coiled
trichomes (Spirulina Turpin) and the description of Halospirulina
tapeticola gen. nov., sp. nov. Int. J. Syst. Evol. Microbiol. 50,
1265–1277.
[53] Nubel, U., Garcıa-Pichel, F. and Muyzer, G. (1997) PCR primers
to amplify 16S rRNA genes from cyanobacteria. Appl. Environ.
Microbiol. 63, 3327–3332.
[54] Karsten, U. (1996) Growth and organic osmolytes of geograph-
ically different isolates of Microcoleus chthonoplastes (cyanobac-
teria). from benthic microbial mats: Response to salinity change.
J. Phycol. 32, 501–506.
[55] Guerrero, R., Urmeneta, J. and Rampone, G. (1993) Distribution
of types of microbial mats at the Ebro Delta, Spain. Biosystems
31, 135–144.
[56] Jonkers, H.M., Ludwig, R., DeWit, R., Pringault, O., Muyzer,
G., Niemann, H., Finke, N. and De Beer, D. (2003) Structural
and functional analysis of a microbial mat ecosystem from a
unique permanent hypersaline inland lake: �La Salada de Chipr-
ana� (NE Spain). FEMS Microbiol. Ecol. 44, 175–189.
[57] Navarrete, A., Urmeneta, J. and Guerrero, R. (2001) Physiolog-
ical status and community composition of microbial mats by
signature lipid biomarkers. pp. 111–116.
[58] Cypionka, H. (2000) Oxygen respiration by Desulfovibrio species.
Ann. Rev. Microbiol. 54, 827–848.
[59] Cypionka, H., Widdel, F. and Pfennig, N. (1985) Survival of
sulfate-reducing bacteria after oxygen stress, and growth in sulfate-
free oxygen-sulfide gradients. FEMSMicrobiol. Lett. 31, 39–45.
[60] Minz, D., Fishbain, S., Green, S.J., Muyzer, G., Cohen, Y.,
Rittmann, B.E. and Stahl, D.A. (1999) Unexpected population
distribution in a microbial mat community: sulfate-reducing
bacteria localized to the highly oxic chemocline in contrast to a
eukaryotic preference for anoxia. Appl. Environ. Microbiol. 65,
4659–4665.
[61] Minz, D., Flax, J.L., Green, S.J., Muyzer, G., Cohen, Y., Wagner,
M., Rittmann, B.E. and Stahl, D.A. (1999) Diversity of sulfate-
reducing bacteria in oxic and anoxic regions of a microbial mat
characterized by comparative analysis of dissimilatory sulfite
reductase genes. Appl. Environ. Microbiol. 65, 4666–4671.
[62] Wieland, A., Zopfi, J., Benthien, M. and Kuhl, M. (2004)
Biogeochemistry of an iron-rich hypersaline microbial mat
(Camargue, France). Microbial Ecology, in press.
[63] Pierson, B.K. and Parenteau, M.N. (2000) Phototrophs in high
iron microbial mats: microstructure of mats in iron-depositing hot
springs. FEMS Microbiol. Ecol. 32, 181–196.
[64] Volkman, J.K., Guillan, F.T., Johns, R.B. and Eglinton, G.
(1981) Sources of neutral lipids in a temperate intertidal sediment.
Geochim. Cosmochim. Acta 45, 1817–1828.
[65] Marlowe, I.T., Brassell, S.C., Eglinton, G. and Green, J.C. (1984)
Long chain unsaturated ketones and esters in living algae and
marine sediments. Org. Geochem. 6, 135–141.
[66] Eglinton, G. and Hamilton, R.J. (1967) Leaf epicuticular waxes.
Science 156, 1322.
[67] Barbe, A., Grimalt, J.O., Pueyo, J.J. and Albaiges, J. (1990)
Characterization of model evaporitic environments through the
study of lipid components. Org. Geochem. 16, 815–828.
[68] Schouten, S., Hartgers, W.A., Lopez, J.F., Grimalt, J.O. and
SinningheDamste, J.S. (2001) A molecular isotopic study of 13C-
enriched organic matter in evaporitic deposits: recognition of
CO2-limited ecosystems. Org. Geochem. 32, 277–286.
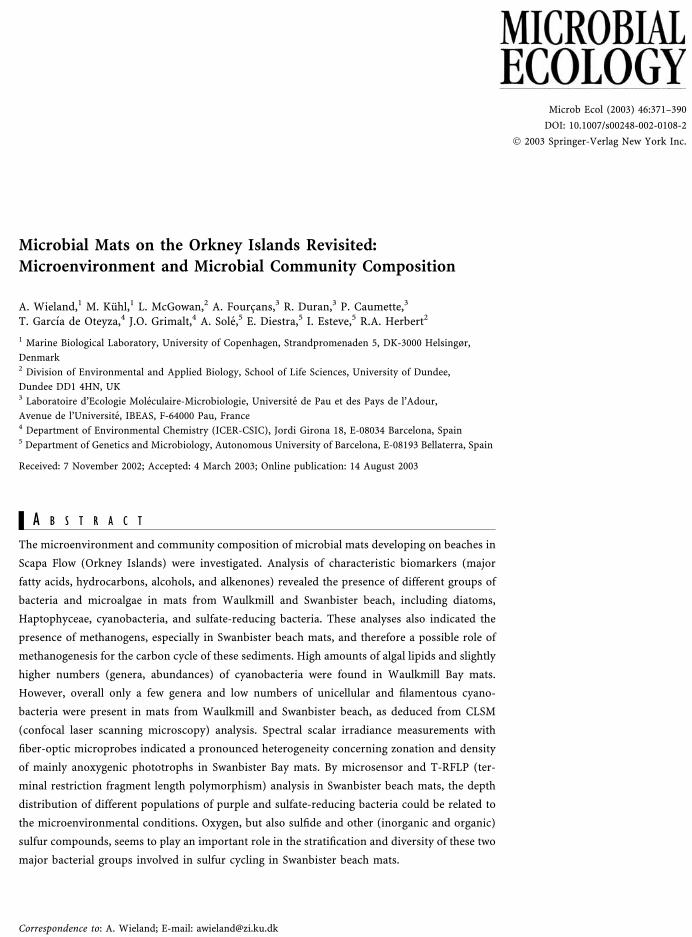
Microbial Mats on the Orkney Islands Revisited:Microenvironment and Microbial Community Composition
A. Wieland,1 M. Kuhl,1 L. McGowan,2 A. Fourcans,3 R. Duran,3 P. Caumette,3
T. Garcıa de Oteyza,4 J.O. Grimalt,4 A. Sole,5 E. Diestra,5 I. Esteve,5 R.A. Herbert2
1 Marine Biological Laboratory, University of Copenhagen, Strandpromenaden 5, DK-3000 Helsingør,
Denmark2 Division of Environmental and Applied Biology, School of Life Sciences, University of Dundee,
Dundee DD1 4HN, UK3 Laboratoire d’Ecologie Moleculaire-Microbiologie, Universite de Pau et des Pays de l’Adour,
Avenue de l’Universite, IBEAS, F-64000 Pau, France4 Department of Environmental Chemistry (ICER-CSIC), Jordi Girona 18, E-08034 Barcelona, Spain5 Department of Genetics and Microbiology, Autonomous University of Barcelona, E-08193 Bellaterra, Spain
Received: 7 November 2002; Accepted: 4 March 2003; Online publication: 14 August 2003
A B S T R A C T
The microenvironment and community composition of microbial mats developing on beaches in
Scapa Flow (Orkney Islands) were investigated. Analysis of characteristic biomarkers (major
fatty acids, hydrocarbons, alcohols, and alkenones) revealed the presence of different groups of
bacteria and microalgae in mats from Waulkmill and Swanbister beach, including diatoms,
Haptophyceae, cyanobacteria, and sulfate-reducing bacteria. These analyses also indicated the
presence of methanogens, especially in Swanbister beach mats, and therefore a possible role of
methanogenesis for the carbon cycle of these sediments. High amounts of algal lipids and slightly
higher numbers (genera, abundances) of cyanobacteria were found in Waulkmill Bay mats.
However, overall only a few genera and low numbers of unicellular and filamentous cyano-
bacteria were present in mats from Waulkmill and Swanbister beach, as deduced from CLSM
(confocal laser scanning microscopy) analysis. Spectral scalar irradiance measurements with
fiber-optic microprobes indicated a pronounced heterogeneity concerning zonation and density
of mainly anoxygenic phototrophs in Swanbister Bay mats. By microsensor and T-RFLP (ter-
minal restriction fragment length polymorphism) analysis in Swanbister beach mats, the depth
distribution of different populations of purple and sulfate-reducing bacteria could be related to
the microenvironmental conditions. Oxygen, but also sulfide and other (inorganic and organic)
sulfur compounds, seems to play an important role in the stratification and diversity of these two
major bacterial groups involved in sulfur cycling in Swanbister beach mats.
Correspondence to: A. Wieland; E-mail: [email protected]
Microb Ecol (2003) 46:371–390
DOI: 10.1007/s00248-002-0108-2
� 2003 Springer-Verlag New York Inc.

Introduction
Laminated microbial communities frequently develop in
the upper intertidal zone of sandy beaches and tidal flats
(e.g., [79, 16, 87, 49]). After initial colonization and suc-
cession of cyanobacteria [79], the mature states of these
stratified phototrophic communities develop into micro-
bial mats, consisting of a thin top layer of sand and/or
diatoms covering a dense layer of filamentous cyanobac-
teria. Below the cyanobacteria, a distinct layer of purple
sulfur bacteria is often present with a reduced black layer
of precipitated iron sulfides underneath due to intensive
sulfate reduction [84]. Sulfate-reducing bacteria are also
present at high numbers in the upper millimeters of the
mats [88, 98]. Because of the macroscopically visible
lamination such coastal microbial mats were named co-
lored sands or ‘‘Farbstreifensandwatt’’ [33]. Both cyano-
bacteria and anoxygenic phototrophs contribute to
sediment binding and stabilization of the sediment [28].
The dominant cyanobacterium is generally Microcoleus
chthonoplastes [79, 16, 84, 89], whereas the immotile
Thiocapsa roseopersicina is often the dominant purple
sulfur bacterium [16, 87, 84].
Mass blooms of purple sulfur bacteria, mainly T. rose-
opersicina, have been observed during summer in the in-
tertidal zone of sheltered sandy beaches in Scapa Flow on
the Orkney Islands [31, 85, 86]. Three different laminated
microbial mats were described [86], distinguished by the
position of the cyanobacterial layer above or beneath the
purple sulfur bacterial layer, or by its complete absence
and therefore exclusive development of purple sulfur
bacteria in the top layer of the sediment. Mats with a
typical lamination pattern (see above) were most common
[86]. However, cyanobacteria were only present at rela-
tively low population densities, and M. chthonoplastes was
absent in all investigated mats [86].
The beaches of Scapa Flow are locally enriched in ni-
trogen-containing organic matter due to decomposition of
accumulated macroalgal debris [31, 86]. In Scapa Bay,
additional organic matter was supplied by discharges from
local whiskey distilleries [86]. The high organic carbon
content of the sediments leads to availability of low mo-
lecular weight organic substrates for sulfate-reducing
bacteria, and the produced sulfide serves as an electron
donor for anoxygenic photosynthesis by purple sulfur
bacteria [31]. Distinct microcolonies formed by the purple
sulfur bacteria (mainly T. roseopersicina) can effectively
bind sediment grains. This aggregation leads to a reduc-
tion of erosion and, therefore, to a stabilization of the
sediment [85]. Although these aggregates may not be as
effective as the cohesive structures of cyanobacterial mats
in stabilizing sandy sediments and preventing erosion,
purple sulfur bacteria and mainly T. roseopersicina were
capable of rapidly recolonizing eroded sites on beaches in
Scapa Flow [85].
Further characteristics of these sediment ecosystems
dominated by purple sulfur bacteria are the absence of
chemolithotrophic sulfur bacteria, normally present in
marine microbial mats [88], and the almost permanent
exposure of purple sulfur bacteria to O2 at the sediment
surface [85, 86].
In this study, the composition of the microbial com-
munity and the microenvironmental conditions in
microbial mats from Orkney Islands beaches was investi-
gated. This included determination of phototrophic pop-
ulations with confocal laser scanning microscopy (CLSM)
and fiber-optic microprobe-based spectrometry in mi-
crobial mats from Waulkmill and Swanbister beaches.
Dominant groups of mat-inhabiting microorganisms were
determined by their characteristic biomarkers. Further-
more, the stratification of major bacterial groups in rela-
tion to microenvironmental gradients was investigated in
Swanbister beach mats. For this, O2 and sulfur cycling was
quantified by controlled microsensor experiments in the
laboratory and by sulfate reduction rate measurements.
The depth-zonation and diversity of the entire microbial
community and of the major bacterial groups involved in
sulfur cycling in Swanbister beach mats were analyzed
with terminal restriction fragment length polymorphism
(T-RFLP).
Materials and Methods
Sampling
Sediment samples were taken in July 2000 at low tide with
Plexiglas core tubes (53 mm i.d.) on beaches of Waulkmill and
Swanbister Bay located in Scapa Flow, Orkney Islands (a map
with locations can be found in [86]). In situ temperature and
salinity of remaining stagnant seawater were 12–13�C and 40& at
the time of sampling. Downwelling irradiance around noon on
clear and sunny days was >1100 lmol photons m)2s)1. Sampled
sediment cores were transported to the laboratory of the Orkney
County Council Marine Unit on Orkney Island (Mainland),
where microsensor measurements were performed under con-
trolled conditions.
372 A. Wieland et al.

Microsensor Measurements
Clark-type O2 [72] and H2S [36, 50] microsensors connected to a
picoammeter (Unisense A/S, Denmark), and glass pH micro-
electrodes [74] connected to a high-impedance mV-meter (WPI
Inc., USA) were used for fine-scale measurements of O2 and
sulfide distribution in Swanbister beach mats. Oxygenic gross
photosynthesis was quantified with the light–dark shift method
[73]. The O2 microsensor had a tip diameter of 10 lm, a stirring
sensitivity of �1%, and a response time, t90, of �0.4 s. The H2S
microsensor had a tip diameter of 40 lm and was coated with a
black enamel paint to avoid light interference [50]. The length
and the tip diameter of the pH-sensitive glass of the pH micro-
electrode were 250 and 10 lm, respectively.
The O2 microsensor was linearly calibrated in the experi-
mental setup (see below) by a two-point calibration using read-
ings of microsensor current in the air saturated overlying water
(100% air saturation) and in the anoxic part of the mats (0% O2).
Dissolved O2 concentrations of air saturated seawater at experi-
mental temperatures and salinities were calculated according to
Garcıa and Gordon [27]. The pH microelectrode was calibrated
in standard buffer solutions (Radiometer, Denmark). The pH of
the overlying water in the experimental setup was determined
with a commercial pH meter calibrated in standard buffer solu-
tions (Radiometer, Denmark). The readings of the pH micro-
electrode in the overlying water were adjusted to the measured
pH of the seawater. The H2S microsensor was calibrated in an-
oxic buffer solutions (0.2 M phosphate buffer, pH 7.5) of in-
creasing sulfide concentrations. A sample of each sulfide buffer
solution was fixed in zinc acetate (5% w/v) for subsequent
spectrophotometric analysis of sulfide concentration after Fon-
selius [23] with modifications, i.e., acidification of the samples to
pH <1 with 6 M HCl and determination of the absorption of the
formed complex at the second peak (750 nm) in the spectrum (C.
Steuckart, unpublished). Calculation of H2S and total sulfide
(Stot) concentration profiles from H2S and pH microsensor data
was as described in Wieland and Kuhl [97], using pK1 values
calculated from experimental temperatures according to Hershey
et al. [32].
Experimental Microsensor Setup
Sediment cores were mounted in a flow chamber modified for
insertion of whole sediment cores [21]. A constant flow over
the mat surface of aerated seawater from the sampling site
was generated with a submersible water pump (Aqua Clear,
Germany) connected to the flow chamber. Measurements were
performed at room temperature (21�C ± 1�C). The mat was
illuminated with a fiber-optic halogen light source (KL 2500,
Schott, Germany) and the downwelling irradiance at the mat
surface was quantified with an underwater quantum irradiance
meter (QSL-101, Biospherical Instruments, USA). The micro-
sensors were fixed together with the measuring tips in the same
horizontal plane within an area of ca. 0.5–1 cm2 of the mat
surface in a motor-driven micromanipulator (Marzhauser,
Germany; Oriel, USA) mounted on a heavy solid stand. Micro-
sensor signals were recorded with strip chart recorders (Servo-
gor, UK; Kipp & Zonen, The Netherlands) and with a computer
data acquisition system (LabView, National Instruments, USA)
that also controlled the micromanipulator. Gross photosynthesis
measurements in steps of 100- or 200-lm vertical depth intervals
were performed as described in Wieland and Kuhl [97].
Spectral Scalar Irradiance Measurements with Fiber-Optic
Microprobes
A fiber-optic scalar irradiance microprobe [52] was connected to
a sensitive fiber-optic diode array spectrometer with a spectral
range of 250–950 nm (PMA-11, Hamamatsu Photonics, Japan).
Profiles of spectral scalar irradiance in the mats were measured
by stepwise inserting the microprobe with a motor-driven
micromanipulator (Marzhauser, Germany; MICOS GmbH, Ger-
many; Jenny Electronics AG, Switzerland) at a zenith angle of
135� relative to the incident light beam. The mats were illumi-
nated vertically with a fiber-optic halogen light source (KL 2500,
Schott, Germany). Measurements were performed at vertical
depth intervals of 200 lm. The downwelling spectral scalar ir-
radiance at the mat surface was measured by positioning the
scalar irradiance microprobe over a black light trap at the same
position relative to the light field as the mat surface. Scalar ir-
radiance spectra at various depths in the mats were normalized
to the downwelling scalar irradiance at the mat surface. Atten-
uation spectra of scalar irradiance were calculated over discrete
depth intervals from the depth profiles of spectral scalar irradi-
ance by
K0 ¼ lnðE1=E2Þ=ðz2 � z1Þ ð1Þ
where K0 is the vertical spectral attenuation coefficient for scalar
irradiance, and E1 and E2 are the spectral scalar irradiance
measured at depths z1 and z2 in the mat, where z2 > z1 [48].
Calculations
Diffusive O2 fluxes across the mat-water interface were calculated
from O2 profiles using Fick’s first law of diffusion as described in
Wieland and Kuhl [96]. Areal rates of O2 consumption in the
aphotic zone, Raphot, were calculated as the downward O2 flux, Js,
at the lower boundary of the photic zone:
Js ¼ �/Ds dC=dz ð2Þ
where dC/dz is the linear concentration gradient, / is the sedi-
ment porosity, and Ds is the sediment diffusion coefficient, which
was calculated from the porosity and D0 according to Ullman and
Aller [83]. The D0 of O2 was taken from Broecker and Peng [8]
and corrected for experimental temperatures and salinities [53].
Fluxes of H2S were calculated according to Eq. 2 from the linear
part of the profiles. The diffusion coefficient of H2S was estimated
as D0(H2S)=0.7573 D0(O2) (Tables for seawater and gases, Uni-
sense A/S, Denmark).
Microbial Mats on the Orkney Islands 373

Determination of Sediment Porosity
Sediment porosity (mL water cm)3) was determined (n = 5) on
samples collected from Swanbister Bay in July 2001 using a 2.5-
cm diameter stainless steel corer. The cores were sectioned using
a sediment slicer to give the following four consecutive depth
horizons: 0–5 mm, 5–10 mm, 10–20 mm, and 20–30 mm. Po-
rosity was measured as weight loss after drying at 110�C for 24 h.
Determination of Sulfate Reduction Rates
Triplicate sediment cores (13 mm i.d.) were collected from
Swanbister Bay in truncated 5-mL disposable syringes and sealed
with Suba seals (W. Freeman Ltd., UK). Carrier-free 35SO42) (10
lL; Amersham Pharmacia Biotech, UK) was injected through the
Suba seal using a microliter syringe into each sediment core,
giving an average activity of 50 kBq cm)3. To ensure even dis-
tribution of the isotope throughout the cores the isotope was
added progressively as the syringe needle was withdrawn. At the
end of the 12-h incubation period at ambient temperature (16�C)
in the dark, the cores were sectioned to give the following depth
horizons: 0–10 mm, 10–20 mm, and 20–30 mm. Each sediment
section was transferred to plastic bottles containing 5 mL of a
20% w/v zinc acetate solution to stop biological activity and
preserve sulfide. The samples were then frozen and stored until
they were required for analysis. Production of H235S was deter-
mined using the one-step distillation method of Fossing and
Jørgensen [24]. Sulfate reduction rates were calculated according
to the method of Isaksen and Finster [35]. Porewater sulfate was
determined according to the method of Tabatabai [80].
Confocal Laser Scanning Microscopy
Sediment cores (18 mm i.d.) were taken from Waulkmill and
Swanbister Bay using truncated 20-mL disposable syringes. The
samples were transferred into small plastic containers containing
2.5% glutaraldehyde in a phosphate buffer (0.2 M) adjusted to the
appropriate salinity with NaCl. The samples were fixed for 3 h
and then washed 2–3 times with phosphate buffer. The samples
were stored at 4�C until further analysis.
The samples were investigated with a compound microscope
(Olympus BH2, Japan) and a laser confocal microscope (Leica
TCS 4d, Germany) equipped with an argon–krypton laser. For
confocal analysis, subsamples (slices) of defined dimension were
placed in cavity slides, covered and sealed with coverslips, and
observed under an excitation beam of 568 nm. Pigment fluo-
rescence emission was detected with a 590 nm long-pass filter.
Optical sections (every focal plane), optical series (all focal planes
from each imaged area), summa images (all optical series pro-
jected to one image), and stereoscopic images (one image in
three dimensions from every optical series) were obtained from
these analyses. A volume data set was generated by combining all
optical sections.
After screening of the different cyanobacteria present in all
images from each sampling site, each type of cyanobacterium was
identified after morphological criteria according to Castenholz
[10].
Analysis of Fatty Acids, Hydrocarbons, Alcohols, and Alkenones
Sediment cores (26 mm i.d.) were collected on Waulkmill and
Swanbister beach and stored frozen until further analysis. The
upper 4 cm of the mat samples (approximately 10 g) were ho-
mogenized with a mortar and extracted three times with meth-
anol, dichloromethane, and n-hexane. Extracts were saponified
with 30 mL of KOH (6% w/v) in methanol and the neutral
components were recovered by extraction with 3 · 30 mL of n-
hexane. The alkaline mixture was then acidified to pH 2 with 5
mL of HCl, and the acidic compounds were recovered by ex-
traction with 3 · 30 mL of n-hexane. The neutral compounds
were fractionated in a column filled with silica (8 g, bottom) and
alumina (8 g, top). These packings were prepared previously by
heating at 120�C and 350�C for 12 h, respectively. Milli-Q water
was added to both adsorbents for deactivation (5%). Six fractions
were obtained by successive elution with 20 mL of n-hexane, 20
mL of n-hexane/dichloromethane (9:1), 40 mL of n-hexane/di-
chloromethane (8:2), 40 mL of n-hexane/dichloromethane 75%
(1:3), 20 mL of dichloromethane/methanol (95:5), and 40 mL of
dichloromethane/methanol (9:1). The two most polar fractions
were silylated after redissolution in 100 lL of dichloromethane
and addition of 100 lL bis(trimethylsilyl)trifluoroacetamide
(heating 1 h at 60�C). The fatty acid fractions were methylated
before instrumental analysis using diazomethane, which was
synthesized as described elsewhere [91]. These fractions were
dissolved in 100 lL of n-hexane and diazomethane was added
until the yellowish color remained.
Samples were analyzed by gas chromatography and flame
ionization detection in a Varian Star 3400 (Varian Inc., USA). A
30 m capillary column (0.25 mm i.d.) coated with DB-5 (25 lm
film thickness) was used with hydrogen as carrier gas. The oven
was kept at 70�C for 1 min, heated to 140�C at 10�C/min, then to
310�C at 4�C/min, and finally held at 310�C for 30 min. The
temperature of the detector was 330�C. Analyses by gas chro-
matography and mass spectrometric detection were performed
with a Fisons MD-800 quadrupole mass analyzer (Thermo In-
struments, UK). Samples were injected in splitless mode at 300�Cinto a 30 m capillary column (0.25 mm i.d.) coated with DB-5 (25
lm film thickness). Helium was used as carrier gas and the
temperature program was as described above. Mass spectra were
recorded in electron impact mode at 70 eV by scanning between
m/z 50–650 every second. Ion source and transfer line were kept
at 300�C.
T-RFLP Analysis
Sediment cores (35 mm i.d.) were taken with Falcon tubes from
Swanbister Bay. The upper 10 mm of the sediment core was
sliced off aseptically, transferred to sterile petri dishes, frozen in
liquid nitrogen, transported on dry ice, and finally stored at
)80�C until further analysis. The upper 2 mm of the mat cores
374 A. Wieland et al.

was sliced with a cryomicrotome (MICROM GmbH, Germany) at
around 200 lm, and the third millimeter at around 500 lm
vertical depth resolution. From these mat slices, DNA was ex-
tracted with the UltraClean Soil DNA Isolation Kit using the
alternative lysis method (MoBio Laboratories Inc., USA). All
extracted genomic DNA samples were stored at )20�C until
further processing.
The different primers used for T-RFLP analysis to assess the
bacterial community structure are listed in Table 1. For T-RFLP
analysis, forward (f) and reverse (r) primers were fluorescently
labeled with TET and HEX (E.S.G.S. Cybergene group, France),
respectively. The PCR amplification mixture contained 12.5 lL
hot start Taq polymerase mix (Qiagen, Netherlands), 0.5 lL of
each primer (20 lM), and 1 lL of DNA template. A final volume
of 50 lL was adjusted with distilled water. Reactions were cycled
in a PTC200 thermocycler (MJ Research, USA) at 94�C for 15
min, followed by 35 cycles of 94�C for 1 min; Tm for 1.5 min, with
Tm denoting the corresponding melting temperature for hy-
bridization between primers and template DNA; and 72�C for 1
min, with a final extension step at 72�C for 10 min. The amount
of PCR product was determined by comparison to known con-
centrations of standards (Smartlader, Eurogentec, Belgium). PCR
products were purified with the GFX PCR DNA purification kit
(Amersham, UK).
Purified PCR products (600 to 700 ng) were digested with 12
units of enzyme HaeIII or Hin6I (New England Biolabs, USA).
The precise length of T-RFs from the digested PCR products was
determined by capillary electrophoresis (ABI prism 310, Applied
Biosystems, USA). About 50 ng of the digested DNA from each
sample was mixed with 10 lL of deionized formamide and 0.25
lL of TAMRA size standard and then denatured at 94�C for 2
min and immediately chilled on ice prior to electrophoresis.
After an injection step of 10 s, electrophoresis was carried out for
up to 30 min applying a voltage of 15 kV. T-RFLP profiles were
performed using GeneScan software (ABI).
Dominant T-RFs were selected by comparison of numerical
values and electropherograms. The clustering values were ana-
lyzed with the T-RFLP similarity matrix on the RDP (Ribosomal
Database Project) Web site (http://rdp.cme.msu.edu/) [56]. The
obtained distance matrix was used to construct a dendrogram
with MEGA version 2.1 [51] using the UPGMA method (Un-
weighted Pair Group Method with Arithmetic Mean).
T-RFLP profiles were also compared by Canonical Corre-
spondence Analysis (CCA) according to Fromin et al. [25]. This
test is based on the linear correlation between community data
(abundance of each T-RF) and environmental parameters in the
mat at light conditions (scalar irradiance at wavelengths of Chl a
[676 nm] and BChla [845 nm] absorption, depth, and O2 con-
centration). The CCA were realized with MVSP v3.13d software
(Rockware Inc., UK).
Results
Biomarkers in Waulkmill and Swanbister Bay Mats
The major lipid compounds in both Waulkmill and
Swanbister beach mats were fatty acids, encompassing
essentially C14–C22 homologues dominated by n-hexadec-
9(Z)-enoic and n-hexadecanoic acids (Fig. 1A, B). Other
major compounds were n-octadec-9(Z)-enoic, n-eicosa-
pentenoic, n-tetradecanoic, and n-pentadecanoic acids,
which are generally representative of algal and microbial
contributions. N-Octadec-9(Z)-enoic acid is abundant in
photosynthetic algae and cyanobacteria [11]. N-Eicosa-
pentenoic acid and other polyunsaturated n-eicosane and
n-docosane acids are specific of inputs from diatom spe-
cies [93]. Iso- and anteiso-pentadecanoic acids were the
two main branched fatty acids present in significant pro-
portions. These compounds are abundant in sulfate-
reducing bacteria and sulfur-oxidizing bacteria such as
Thiomicrospira [29].
The aliphatic hydrocarbon phyt-1-ene together with
other phytene homologues occurred in both mats, but
their presence was more pronounced in the Swanbister
mat (Fig. 1C, D). These hydrocarbons are characteristic for
methanogens [82] and may also be produced during the
decomposition of phytol [18]. The presence of an iso-
prenoid compound specific of methanogenic origin,
2,6,10,15,19-pentamethylicosane [34, 75], in the Swanbis-
ter mat (Fig. 1C) suggests that at least in this mat the
occurrence of the phytanes is due to inputs from these
microorganisms. N-Heptadecane and n-heptadecenes were
major compounds in both mats and especially abundant
in the Waulkmill mat (Fig. 1D). These compounds are
Table 1. Phylogenetic and photosynthetic primers used in T-RFLP analysisa
Primer Sequence (5¢ fi 3¢) Target gene Target group Reference
8F AGA GTT TGA TCC TGG CTC AG ssu 16S rDNA Eubacteria [54]926R CCG TTC AAT TCC TTT RAG TTT ssu 16S rDNA Eubacteria [54]BSR 385R CGG CGT CGC TGC GTC AGG ssu 16S rDNA SRB [2]PB 557F CGCACCTGGACTGGAC PufM PAB [1]PB 750R CCCATGGTCCAGCGCCAGAA PufM PAB [1]
a Amplimer sizes for the different primer sets: 16S rDNA eubacteria, 918 bp; 16S rDNA sulfate-reducing bacteria, 377 bp; pufM, 229 bp. All 16S rDNA
primer names are based on E. coli numbering. SRB denotes sulfate-reducing bacteria and PAB purple anoxygenic bacteria
Microbial Mats on the Orkney Islands 375
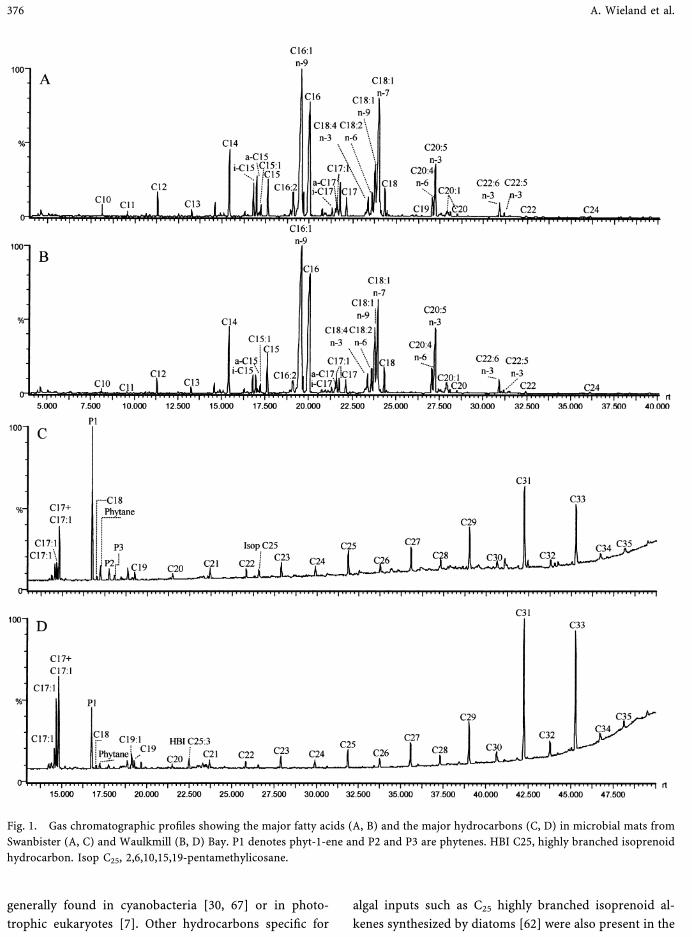
generally found in cyanobacteria [30, 67] or in photo-
trophic eukaryotes [7]. Other hydrocarbons specific for
algal inputs such as C25 highly branched isoprenoid al-
kenes synthesized by diatoms [62] were also present in the
Fig. 1. Gas chromatographic profiles showing the major fatty acids (A, B) and the major hydrocarbons (C, D) in microbial mats from
Swanbister (A, C) and Waulkmill (B, D) Bay. P1 denotes phyt-1-ene and P2 and P3 are phytenes. HBI C25, highly branched isoprenoid
hydrocarbon. Isop C25, 2,6,10,15,19-pentamethylicosane.
376 A. Wieland et al.
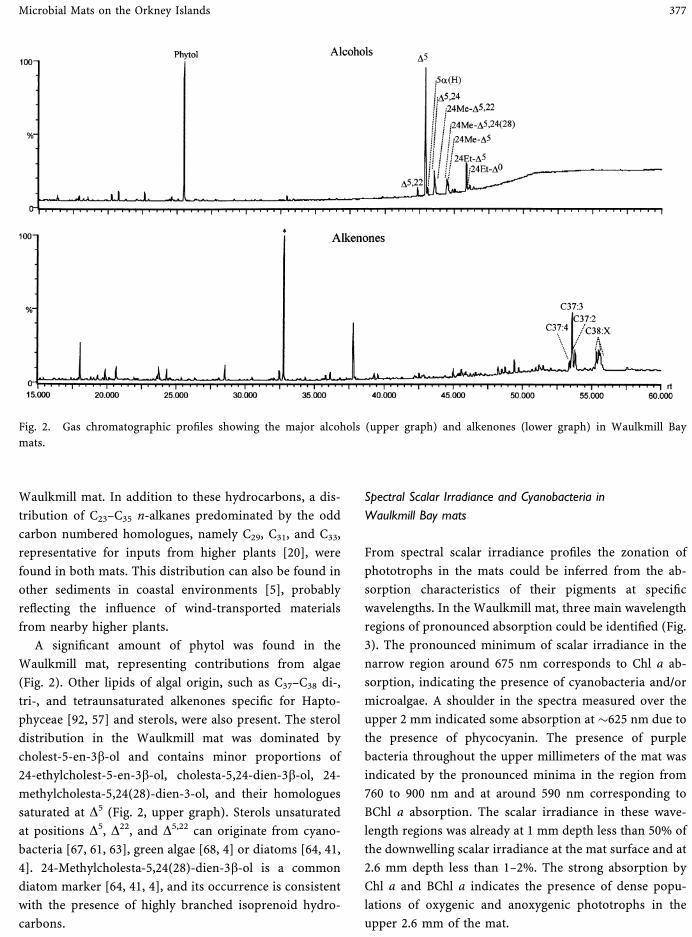
Waulkmill mat. In addition to these hydrocarbons, a dis-
tribution of C23–C35 n-alkanes predominated by the odd
carbon numbered homologues, namely C29, C31, and C33,
representative for inputs from higher plants [20], were
found in both mats. This distribution can also be found in
other sediments in coastal environments [5], probably
reflecting the influence of wind-transported materials
from nearby higher plants.
A significant amount of phytol was found in the
Waulkmill mat, representing contributions from algae
(Fig. 2). Other lipids of algal origin, such as C37–C38 di-,
tri-, and tetraunsaturated alkenones specific for Hapto-
phyceae [92, 57] and sterols, were also present. The sterol
distribution in the Waulkmill mat was dominated by
cholest-5-en-3b-ol and contains minor proportions of
24-ethylcholest-5-en-3b-ol, cholesta-5,24-dien-3b-ol, 24-
methylcholesta-5,24(28)-dien-3-ol, and their homologues
saturated at D5 (Fig. 2, upper graph). Sterols unsaturated
at positions D5, D22, and D5,22 can originate from cyano-
bacteria [67, 61, 63], green algae [68, 4] or diatoms [64, 41,
4]. 24-Methylcholesta-5,24(28)-dien-3b-ol is a common
diatom marker [64, 41, 4], and its occurrence is consistent
with the presence of highly branched isoprenoid hydro-
carbons.
Spectral Scalar Irradiance and Cyanobacteria in
Waulkmill Bay mats
From spectral scalar irradiance profiles the zonation of
phototrophs in the mats could be inferred from the ab-
sorption characteristics of their pigments at specific
wavelengths. In the Waulkmill mat, three main wavelength
regions of pronounced absorption could be identified (Fig.
3). The pronounced minimum of scalar irradiance in the
narrow region around 675 nm corresponds to Chl a ab-
sorption, indicating the presence of cyanobacteria and/or
microalgae. A shoulder in the spectra measured over the
upper 2 mm indicated some absorption at �625 nm due to
the presence of phycocyanin. The presence of purple
bacteria throughout the upper millimeters of the mat was
indicated by the pronounced minima in the region from
760 to 900 nm and at around 590 nm corresponding to
BChl a absorption. The scalar irradiance in these wave-
length regions was already at 1 mm depth less than 50% of
the downwelling scalar irradiance at the mat surface and at
2.6 mm depth less than 1–2%. The strong absorption by
Chl a and BChl a indicates the presence of dense popu-
lations of oxygenic and anoxygenic phototrophs in the
upper 2.6 mm of the mat.
Fig. 2. Gas chromatographic profiles showing the major alcohols (upper graph) and alkenones (lower graph) in Waulkmill Bay
mats.
Microbial Mats on the Orkney Islands 377

Several different genera of filamentous and unicellular
cyanobacteria were identified (Table 2), with cyanobacte-
ria of the genera Lyngbya and Oscillatoria and of the
Pleurocapsa and Gloeocapsa groups being the most
abundant in the Waulkmill Bay mat as observed with
CLSM and light microscopy. Some cyanobacteria occurred
only at certain depths of the mat, whereas others were
found in several or all mat slices investigated.
Spectral Scalar Irradiance and Cyanobacteria in
Swanbister Bay Mats
In a Swanbister Bay mat, spectral scalar irradiance minima
at characteristic Chl a and BChl a absorption wavelengths
were found (Fig. 4). Pronounced light scattering was de-
tected at the mat surface and in the uppermost mat layers.
Wavelengths corresponding to Chl a absorption were
more strongly attenuated in the Swanbister mat than
wavelengths corresponding to BChl a absorption (Fig. 4),
whereas in the Waulkmill mat both wavelength regions
were almost equally attenuated throughout the mat (Fig. 3).
Spectral scalar irradiance profiles in another mat sample
from Swanbister Bay, which was densely covered by purple
bacteria and characterized by a pink-colored surface,
showed a much more pronounced BChl a absorption
(Fig. 5, upper graph). The spectral irradiance in the wave-
length regions of Chl a and BChl a absorption was already
at a depth of 0.8 mm <10% of the downwelling spectral
scalar irradiance. From these profiles, the average
attenuation spectrum of scalar irradiance over the depth
interval of 0–0.8 mm was calculated (Fig. 5, lower graph).
The vertical spectral attenuation coefficient (K0) was
highest in the wavelength region between 400 and 550 nm,
the region of carotenoid and Chl a absorption. The atten-
uation coefficient of BChl a absorption wavelengths was
higher than the attenuation coefficient of Chl a absorption,
indicating higher densities of purple bacteria in this mat.
Thus, mats from Swanbister Bay were very heterogeneous
and patchy concerning zonation and population densities
of oxygenic and especially anoxygenic phototrophs.
In Swanbister Bay mats covered by purple bacteria (pink
surface), only a few genera of cyanobacteria, i.e., mainly
unicellular morphotypes of the Pleurocapsa group and one
filamentous type, were found in low numbers (Table 3).
Microbial Community Structure of Swanbister Bay Mats
To assess the microbial community structure of a
Swanbister Bay mat, the universal primer pair 8f-926r
targeting a partial sequence of the 16S rDNA gene of eu-
bacteria was applied. After digestion with two different
restriction enzymes (HaeIII, Hin6I), the diversity of the
amplified 16S fragments was analyzed by T-RFLP. The
structure of the T-RFLP profiles, as characterized by the
number and distribution of major bands (peaks of highest
relative fluorescence intensity), varied from top to bottom
of the mat (data not shown). Depending on the restriction
enzyme used, different dominant T-RFs were observed.
Degrees of similarity among the microbial communities of
the different mat layers were quantified with the T-RFLP
profile matrix program (RDP). The resulting similarity
dendrogram (not shown) did not reveal any specific dis-
tribution of microbial communities in the analyzed mat
layers, probably because several bacterial species may
have terminal fragments of identical size.
Fig. 3. Depth profile of spectral scalar irradiance in a Waulkmill
Bay mat normalized to the downwelling spectral scalar irradiance
at the mat surface. Numbers on curves indicate depth (mm).
Depth 0 indicates the mat surface and increasing positive num-
bers indicate increasing depths in the mat.
378 A. Wieland et al.
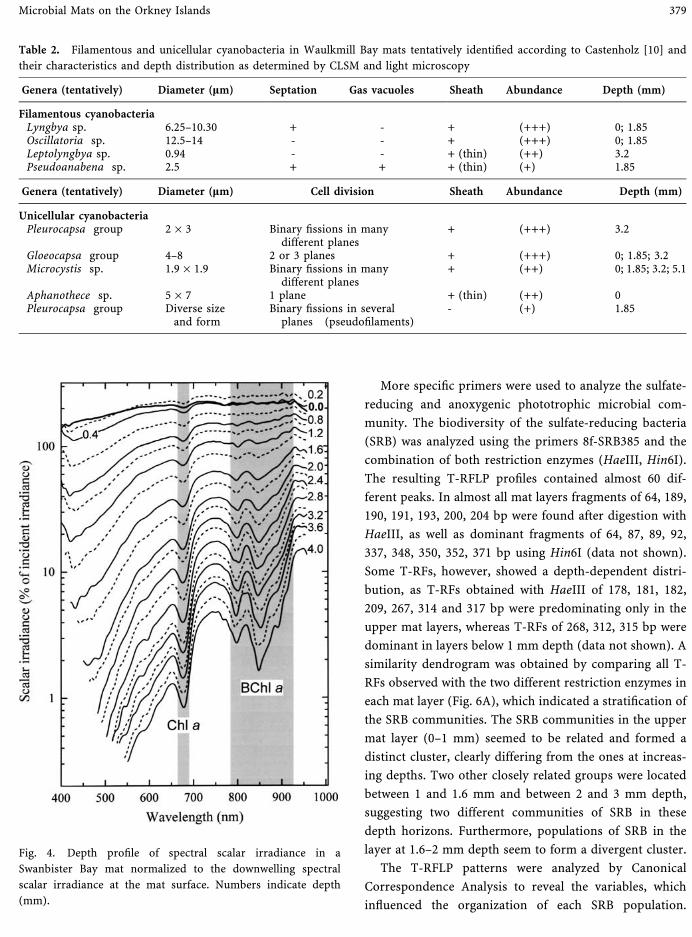
More specific primers were used to analyze the sulfate-
reducing and anoxygenic phototrophic microbial com-
munity. The biodiversity of the sulfate-reducing bacteria
(SRB) was analyzed using the primers 8f-SRB385 and the
combination of both restriction enzymes (HaeIII, Hin6I).
The resulting T-RFLP profiles contained almost 60 dif-
ferent peaks. In almost all mat layers fragments of 64, 189,
190, 191, 193, 200, 204 bp were found after digestion with
HaeIII, as well as dominant fragments of 64, 87, 89, 92,
337, 348, 350, 352, 371 bp using Hin6I (data not shown).
Some T-RFs, however, showed a depth-dependent distri-
bution, as T-RFs obtained with HaeIII of 178, 181, 182,
209, 267, 314 and 317 bp were predominating only in the
upper mat layers, whereas T-RFs of 268, 312, 315 bp were
dominant in layers below 1 mm depth (data not shown). A
similarity dendrogram was obtained by comparing all T-
RFs observed with the two different restriction enzymes in
each mat layer (Fig. 6A), which indicated a stratification of
the SRB communities. The SRB communities in the upper
mat layer (0–1 mm) seemed to be related and formed a
distinct cluster, clearly differing from the ones at increas-
ing depths. Two other closely related groups were located
between 1 and 1.6 mm and between 2 and 3 mm depth,
suggesting two different communities of SRB in these
depth horizons. Furthermore, populations of SRB in the
layer at 1.6–2 mm depth seem to form a divergent cluster.
The T-RFLP patterns were analyzed by Canonical
Correspondence Analysis to reveal the variables, which
influenced the organization of each SRB population.
Table 2. Filamentous and unicellular cyanobacteria in Waulkmill Bay mats tentatively identified according to Castenholz [10] and
their characteristics and depth distribution as determined by CLSM and light microscopy
Genera (tentatively) Diameter (lm) Septation Gas vacuoles Sheath Abundance Depth (mm)
Filamentous cyanobacteriaLyngbya sp. 6.25–10.30 + - + (+++) 0; 1.85Oscillatoria sp. 12.5–14 - - + (+++) 0; 1.85Leptolyngbya sp. 0.94 - - + (thin) (++) 3.2Pseudoanabena sp. 2.5 + + + (thin) (+) 1.85
Genera (tentatively) Diameter (lm) Cell division Sheath Abundance Depth (mm)
Unicellular cyanobacteriaPleurocapsa group 2 · 3 Binary fissions in many
different planes+ (+++) 3.2
Gloeocapsa group 4–8 2 or 3 planes + (+++) 0; 1.85; 3.2Microcystis sp. 1.9 · 1.9 Binary fissions in many
different planes+ (++) 0; 1.85; 3.2; 5.1
Aphanothece sp. 5 · 7 1 plane + (thin) (++) 0Pleurocapsa group Diverse size
and formBinary fissions in several
planes (pseudofilaments)- (+) 1.85
Fig. 4. Depth profile of spectral scalar irradiance in a
Swanbister Bay mat normalized to the downwelling spectral
scalar irradiance at the mat surface. Numbers indicate depth
(mm).
Microbial Mats on the Orkney Islands 379
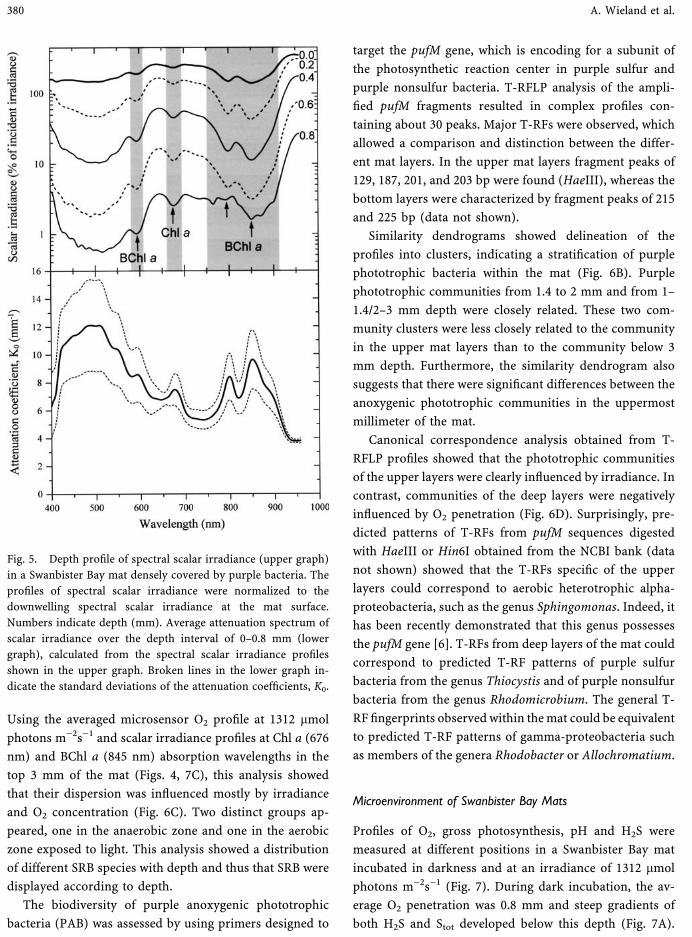
Using the averaged microsensor O2 profile at 1312 lmol
photons m)2s)1 and scalar irradiance profiles at Chl a (676
nm) and BChl a (845 nm) absorption wavelengths in the
top 3 mm of the mat (Figs. 4, 7C), this analysis showed
that their dispersion was influenced mostly by irradiance
and O2 concentration (Fig. 6C). Two distinct groups ap-
peared, one in the anaerobic zone and one in the aerobic
zone exposed to light. This analysis showed a distribution
of different SRB species with depth and thus that SRB were
displayed according to depth.
The biodiversity of purple anoxygenic phototrophic
bacteria (PAB) was assessed by using primers designed to
target the pufM gene, which is encoding for a subunit of
the photosynthetic reaction center in purple sulfur and
purple nonsulfur bacteria. T-RFLP analysis of the ampli-
fied pufM fragments resulted in complex profiles con-
taining about 30 peaks. Major T-RFs were observed, which
allowed a comparison and distinction between the differ-
ent mat layers. In the upper mat layers fragment peaks of
129, 187, 201, and 203 bp were found (HaeIII), whereas the
bottom layers were characterized by fragment peaks of 215
and 225 bp (data not shown).
Similarity dendrograms showed delineation of the
profiles into clusters, indicating a stratification of purple
phototrophic bacteria within the mat (Fig. 6B). Purple
phototrophic communities from 1.4 to 2 mm and from 1–
1.4/2–3 mm depth were closely related. These two com-
munity clusters were less closely related to the community
in the upper mat layers than to the community below 3
mm depth. Furthermore, the similarity dendrogram also
suggests that there were significant differences between the
anoxygenic phototrophic communities in the uppermost
millimeter of the mat.
Canonical correspondence analysis obtained from T-
RFLP profiles showed that the phototrophic communities
of the upper layers were clearly influenced by irradiance. In
contrast, communities of the deep layers were negatively
influenced by O2 penetration (Fig. 6D). Surprisingly, pre-
dicted patterns of T-RFs from pufM sequences digested
with HaeIII or Hin6I obtained from the NCBI bank (data
not shown) showed that the T-RFs specific of the upper
layers could correspond to aerobic heterotrophic alpha-
proteobacteria, such as the genus Sphingomonas. Indeed, it
has been recently demonstrated that this genus possesses
the pufM gene [6]. T-RFs from deep layers of the mat could
correspond to predicted T-RF patterns of purple sulfur
bacteria from the genus Thiocystis and of purple nonsulfur
bacteria from the genus Rhodomicrobium. The general T-
RF fingerprints observed within the mat could be equivalent
to predicted T-RF patterns of gamma-proteobacteria such
as members of the genera Rhodobacter or Allochromatium.
Microenvironment of Swanbister Bay Mats
Profiles of O2, gross photosynthesis, pH and H2S were
measured at different positions in a Swanbister Bay mat
incubated in darkness and at an irradiance of 1312 lmol
photons m)2s)1 (Fig. 7). During dark incubation, the av-
erage O2 penetration was 0.8 mm and steep gradients of
both H2S and Stot developed below this depth (Fig. 7A).
Fig. 5. Depth profile of spectral scalar irradiance (upper graph)
in a Swanbister Bay mat densely covered by purple bacteria. The
profiles of spectral scalar irradiance were normalized to the
downwelling spectral scalar irradiance at the mat surface.
Numbers indicate depth (mm). Average attenuation spectrum of
scalar irradiance over the depth interval of 0–0.8 mm (lower
graph), calculated from the spectral scalar irradiance profiles
shown in the upper graph. Broken lines in the lower graph in-
dicate the standard deviations of the attenuation coefficients, K0.
380 A. Wieland et al.

A gradual decrease of pH was found in the dark incubated
mat, accounting for a decrease of approximately 1 pH unit
between the water and the mat at around 4 mm depth (Fig.
7B). Sulfate reduction rates were lowest in the upper
centimeter of dark incubated Swanbister Bay mats and
highest in the 1–2 cm depth interval (Table 4).
At an irradiance of 1312 lmol photons m)2s)1, gross
oxygenic photosynthesis occurred in the upper 2.8 mm of
the mat, leading to an increased O2 penetration of 4 mm
and a peak of O2 concentration at 1.6 mm depth (Fig. 7C).
As calculated from the profiles of spectral scalar irradiance
measured in the same mat sample (Fig. 4), this O2 maxi-
mum occurred in the depth layer of highest Chl a ab-
sorption, as indicated by the depth profile of the vertical
attenuation coefficient, K0, at 676 nm. Below that zone,
both O2 concentration and K0 (676 nm) decreased, whereas
the attenuation coefficient at 845 nm, indicative for BChl a
absorption, increased. This indicates an increasing popu-
lation density of BChl a–containing anoxygenic photo-
trophic bacteria in the anoxic mat layer. The presence of a
population of anoxygenic phototrophs in the zone of
highest O2 concentration and Chl a absorption was indi-
cated by a peak of K0 (845 nm) in that zone, which was,
however, less pronounced than the peak of K0 (676 nm).
In the upper 5 mm of the light incubated mat, H2S was
undetectable; only in one position were very low con-
centrations of H2S and sulfide detected below 3 mm
depth (data not shown). Photosynthetic CO2 fixation led to
an increase of pH in the upper 2 mm of the mat by more
than 0.5 pH unit, with the peak of pH located approxi-
mately in the layer of maximal O2 concentration and K0
(676 nm). At increasing depths the pH decreased to pH 7.5
(Fig. 7D).
Oxygen and Sulfide Cycling as a Function of Irradiance in
Swanbister Bay Mats
In the same sediment core, O2, gross photosynthesis, H2S
and pH profiles were measured at a fixed position at in-
creasing downwelling irradiances (Fig. 8). Oxygen pene-
tration increased in the mat with increasing irradiance
from 0.8 mm during darkness to 1.4, 1.6, 2.2, and 2.6 mm
at 43, 96, 183, and 349 lmol photons m)2s)1, respectively.
At an irradiance of 96 lmol photons m)2s)1, a net pro-
duction of O2 was detected. The thickness of the photic
zone increased gradually from 0.5 mm at 43 lmol photons
m)2s)1 to 1.8 mm at 349 lmol photons m)2s)1 (Fig. 8,
upper panel). The increase of gross oxygenic photosyn-
thesis and of the photic zone thickness with irradiance led
to a gradual increase of pH in the upper mat layers (Fig. 8,
lower panel). The pronounced pH maximum in the upper
mat layer at irradiances >43 lmol photons m)2s)1 affected
the corresponding Stot profiles (Fig. 8, upper panel). Pro-
files of Stot were calculated from measured H2S and pH
profiles. The Stot profiles at these irradiances showed a
pronounced shoulder of Stot concentration, which was not
present in the corresponding H2S profiles and was prob-
ably caused by the curvature of the pH profiles. Since H2S
and pH profiles could not be measured at exactly the same
position, the unusual shape of the Stot profiles was most
probably caused by a pronounced microheterogeneity of
the mat. These shoulders in the Stot profiles thus represent
overestimations of sulfide concentration and will not be
discussed further. Compared to the H2S profile in the dark
incubated mat, the upper H2S boundary moved downward
in the mat at irradiances >96 lmol photons m)2s)1 (Fig. 8,
upper panel).
Table 3. Filamentous and unicellular cyanobacteria in Swanbister Bay mats tentatively identified according to Castenholz [10] and
their characteristics and depth distribution as determined by CLSM and light microscopy
Genera (tentatively) Diameter (lm) Septation Gas vacuoles Sheath Abundance Depth (mm)
Filamentous cyanobacteriaBorzia sp. 1.88
(short filaments)+ - + (thin) (+) 1.55
Genera (tentatively) Diameter (lm) Cell division Sheath Abundance Depth (mm)
Unicellular cyanobacteriaPleurocapsa group(Microcystis sp.)
1.9 · 1.9 Binary fissions in many differentplanes
+ (+++) 0; 1.55; 3.35
Pleurocapsa group Diverse sizeand form
Binary fissions in several planes(pseudofilaments)
- (+++) 0; 1.55; 3.35
Pleurocapsa group(Stanieria sp.)
2 · 3 Multiple fissions or in combinationwith limited (1–3) binaryfissions
- (+) 3.35
Microbial Mats on the Orkney Islands 381
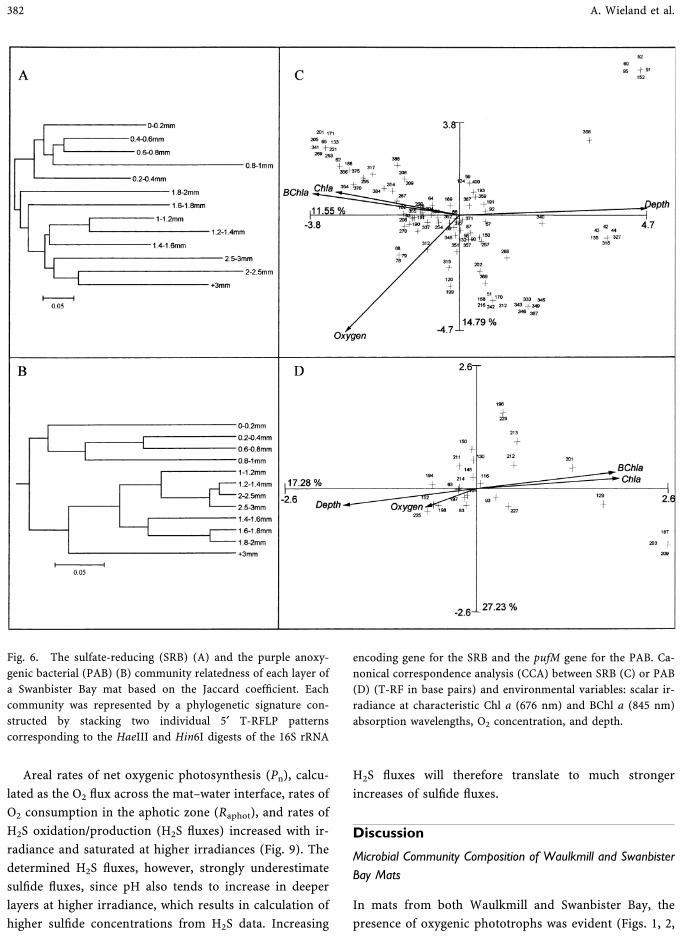
Areal rates of net oxygenic photosynthesis (Pn), calcu-
lated as the O2 flux across the mat–water interface, rates of
O2 consumption in the aphotic zone (Raphot), and rates of
H2S oxidation/production (H2S fluxes) increased with ir-
radiance and saturated at higher irradiances (Fig. 9). The
determined H2S fluxes, however, strongly underestimate
sulfide fluxes, since pH also tends to increase in deeper
layers at higher irradiance, which results in calculation of
higher sulfide concentrations from H2S data. Increasing
H2S fluxes will therefore translate to much stronger
increases of sulfide fluxes.
Discussion
Microbial Community Composition of Waulkmill and Swanbister
Bay Mats
In mats from both Waulkmill and Swanbister Bay, the
presence of oxygenic phototrophs was evident (Figs. 1, 2,
Fig. 6. The sulfate-reducing (SRB) (A) and the purple anoxy-
genic bacterial (PAB) (B) community relatedness of each layer of
a Swanbister Bay mat based on the Jaccard coefficient. Each
community was represented by a phylogenetic signature con-
structed by stacking two individual 5¢ T-RFLP patterns
corresponding to the HaeIII and Hin6I digests of the 16S rRNA
encoding gene for the SRB and the pufM gene for the PAB. Ca-
nonical correspondence analysis (CCA) between SRB (C) or PAB
(D) (T-RF in base pairs) and environmental variables: scalar ir-
radiance at characteristic Chl a (676 nm) and BChl a (845 nm)
absorption wavelengths, O2 concentration, and depth.
382 A. Wieland et al.
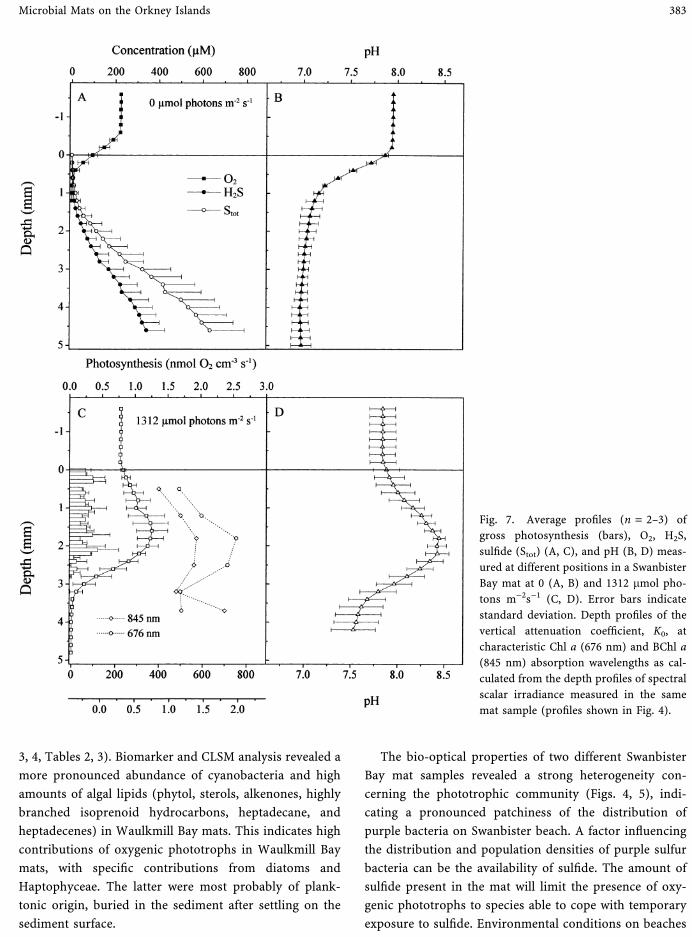
3, 4, Tables 2, 3). Biomarker and CLSM analysis revealed a
more pronounced abundance of cyanobacteria and high
amounts of algal lipids (phytol, sterols, alkenones, highly
branched isoprenoid hydrocarbons, heptadecane, and
heptadecenes) in Waulkmill Bay mats. This indicates high
contributions of oxygenic phototrophs in Waulkmill Bay
mats, with specific contributions from diatoms and
Haptophyceae. The latter were most probably of plank-
tonic origin, buried in the sediment after settling on the
sediment surface.
The bio-optical properties of two different Swanbister
Bay mat samples revealed a strong heterogeneity con-
cerning the phototrophic community (Figs. 4, 5), indi-
cating a pronounced patchiness of the distribution of
purple bacteria on Swanbister beach. A factor influencing
the distribution and population densities of purple sulfur
bacteria can be the availability of sulfide. The amount of
sulfide present in the mat will limit the presence of oxy-
genic phototrophs to species able to cope with temporary
exposure to sulfide. Environmental conditions on beaches
Fig. 7. Average profiles (n = 2–3) of
gross photosynthesis (bars), O2, H2S,
sulfide (Stot) (A, C), and pH (B, D) meas-
ured at different positions in a Swanbister
Bay mat at 0 (A, B) and 1312 lmol pho-
tons m)2s)1 (C, D). Error bars indicate
standard deviation. Depth profiles of the
vertical attenuation coefficient, K0, at
characteristic Chl a (676 nm) and BChl a
(845 nm) absorption wavelengths as cal-
culated from the depth profiles of spectral
scalar irradiance measured in the same
mat sample (profiles shown in Fig. 4).
Microbial Mats on the Orkney Islands 383

in Scapa Flow are restrictive for the development of cy-
anobacteria, as indicated by the low abundances and few
genera found (Tables 2, 3). The production of sulfide by
sulfate-reducing bacteria is, among other environmental
parameters, controlled by the amount and quality of or-
ganic matter in the sediment (e.g., [78]). The main sources
of organic matter are decomposing macroalgae buried in
the sediment [31], resulting in a heterogeneous distribu-
tion of low molecular weight organic substrates for sulfate-
reducing bacterial activity.
A pronounced microheterogeneity of sulfate reduction
and sulfide distribution was found in Swanbister beach
mats, as indicated by the standard deviations of measured
sulfate reduction rates and sulfide microprofiles (Table 4,
Fig. 7A). Thus, a heterogeneous distribution of sulfide
could affect the distribution of the different phototrophs.
A patchy distribution of sites virtually covered by purple
bacteria (pink surface) was observed on Swanbister beach
during sampling in July 2000, as well as a patchy distri-
bution of macroalgae growing on the beach or deposited
on the sediment surface. Additional to organic matter
supply after decomposition, organic sulfur compounds
such as dimethylsulfide (DMS) and dimethylsulfonio-
propionate (DMSP) might be released from degrading
macroalgae. Both compounds are potential substrates for
purple bacteria [39], including Thiocapsa roseopersicina
[90, 37, 38]. By providing such organic sulfur substrates,
degrading macroalgae could also directly enhance growth
of purple sulfur bacteria in their nearby surroundings,
further contributing to their patchy distribution on these
beaches.
Biomarker analysis showed that lipids reflecting the
presence of methanogens (phytenes and 2,6,10,15,19-
Fig. 8. Average profiles (n = 1–3) of gross photosynthesis (bars), O2, H2S, sulfide (Stot) (upper panel) and pH (lower panel) meas-
ured at a fixed position in the same mat from Swanbister Bay at increasing downwelling irradiances. Error bars indicate standard
deviation.
Table 4. Depth distribution of average sulfate reduction rates
(n = 2–3) in Swanbister Bay mats
Depth (cm) Sulfate reduction rate (nmol cm)3d)1)
0–1 234 ± 581–2 297 ± 332–3 245 ± 56
384 A. Wieland et al.

pentamethylicosane), as well as fatty acids characteristic of
sulfate-reducing bacteria (iso- and anteiso-pentadecanoic
acids) were abundant especially in Swanbister Bay mats
(Fig. 1). With our data we can, however, only speculate on
the biogeochemical importance of methanogens in the
mat. As has been shown in salt marsh sediments (e.g., [66,
76]), methane production in marine sediments is most
probably due to utilization of noncompetitive substrates
such as methylamines and DMS [43, 65]. Glycine betaine,
one of the most widespread compatible solutes [94], and
the osmoregulatory compound of marine algae, DMSP
[42], present at high concentrations in microbial mats [39,
89], are precursors of trimethylamine and DMS [65]. Thus,
these compounds could potentially play a role as sub-
strates for methanogenesis in these mats.
Oxygen and Sulfur Cycling in Swanbister Bay Mats
Microsensor data showed a gradual increase of both O2
concentration and penetration with irradiance due to in-
creasing oxygenic photosynthesis by cyanobacteria and
microalgae in Swanbister Bay mats (Figs. 8, 9). Further-
more, H2S fluxes tended to increase with irradiance (Fig.
9), indicating higher sulfide turnover rates in light con-
ditions. These include both higher production rates by
sulfate reduction and higher sulfide consumption rates.
Although (aerobic) chemolithotrophic sulfide oxidation by
T. roseopersicina may occur in light conditions [70, 71],
phototrophic oxidation (in the presence of O2) seem to be
preferred because of higher energetic yields by phototro-
phy than by chemotrophy [17, 84, 85]. The light depend-
ency of the H2S fluxes (Fig. 9) further suggests that
anoxygenic photosynthesis by purple sulfur bacteria
strongly affected net H2S consumption in light-incubated
Swanbister beach mats.
Microsensor data on sulfide cycling underestimate
sulfur cycling in microbial mats, since fluxes calculated
from microprofiles represent only net rates of sulfide
turnover. As has been shown in light-incubated cyano-
bacterial mats [9, 88, 77], sulfate reduction can occur in
the highly oxygenated surface layer. This activity, how-
ever, is not detectable with H2S microsensors because of
immediate reoxidation of the produced sulfide. Further-
more, other reduced sulfur compounds, such as polysul-
fides, elemental sulfur, and thiosulfate, which are present
in Swanbister mats [86], may play a significant role in the
sulfur cycle of these mats. The dominant purple sulfur
bacterium in these mats, T. roseopersicina, is characterized
by a high metabolic versatility [69, 84] and can use poly-
sulfide [87], thiosulfate [17], and intracellular elemental
sulfur [70, 71].
Oxygen consumption rates in the aphotic zone (Raphot)
increased with irradiance (Fig. 9). Although H2S fluxes
underestimate sulfide fluxes especially in light conditions
(see Results), aerobic/oxic sulfide oxidation seemed not to
have significantly contributed to Raphot at higher irradi-
ances. This points to a more important role of other O2-
consuming processes, such as aerobic respiration. T-RFLP
analysis together with predicted patterns of T-RFs sup-
plied from the NCBI Bank indicated the presence of aer-
obic, heterotrophic alpha-proteobacteria in the upper
layers of the mat, which could have contributed to O2
consumption in that zone. As mentioned by Nagashima et
al. [60], the detection of these nonphototrophic bacteria
with the primer set targeting specifically the pufM gene
conserved among purple phototrophic bacteria could be
due to horizontal gene transfer. T-RFLP analysis also re-
vealed the presence of different communities of SRB in the
uppermost layers of Swanbister Bay mats (Fig. 6A). Sul-
Fig. 9. Areal rates of net photosynthesis (Pn), O2 consumption
in the aphotic zone (Raphot) and of net H2S production/con-
sumption (H2S flux) vs irradiance in the Swanbister Bay mat.
Microbial Mats on the Orkney Islands 385
fate-reducing bacteria are also characterized by their ca-
pacity for aerobic respiration [47, 81] and could have di-
rectly contributed to O2 consumption in these mat layers.
Communities of Sulfate-Reducing and Purple Bacteria in
Swanbister Bay Mats
The populations of purple bacteria within the upper
millimeters of the Swanbister mat (Figs. 4, 6B, 7C) expe-
rienced pronounced variations of microenvironmental
conditions between dark–light transitions (Fig. 8). A mi-
nor population in the surface layer experienced highly oxic
conditions during light periods and micro-oxic conditions
during the night, with sulfide being available only during
the night at low concentrations (Figs. 7A, 8). Populations
in the depth interval between the surface layer and the
permanently anoxic zone (Figs. 7C, 8) were only exposed
to sulfide during darkness. In light, these populations
experience, at least temporarily, simultaneously low O2
and sulfide concentrations, since the depth of the oxygen–
sulfide interface increased with increasing irradiance (Fig.
8). This condition is subsequently followed by exposure to
either solely O2 or sulfide at further increasing or de-
creasing irradiances. Populations present below this
transition zone always experienced sulfide, but may have
been light limited (Fig. 4). Thus, the full spectrum of
metabolic versatility may be used by different populations
of T. roseopersicina zonated in the mats. This includes
chemolithotrophy during darkness using O2 and sulfide as
substrates, degradation of storage carbohydrates (glyco-
gen) under anoxic dark conditions, photolithotrophy in
the light in the presence of only sulflde, of both sulfide and
O2, or of only O2 using intracellular elemental sulfur or
other external reduced sulfur compounds [69, 84].
A pronounced diversity and a depth-dependent distri-
bution of purple bacteria was found by T-RFLP analysis
(Fig. 6B). From pufM T-RFLP profiles, a T-RF of 93 bp
(restriction enzyme HaeIII) was detected in all mat layers
within the top 3 mm of the mat. The sequences of the pufL
and pufM genes of T. roseopersicina strain T. ork were
recently determined (A. Fourcans, R. Duran, P. Caumette,
unpublished; accession number AJ544223), and a predic-
tive T-RF of 92 bp was found for the pufM gene of T.
roseopersicina digested with this restriction enzyme. So,
the observed T-RF could correspond to the predominant
purple sulfur bacterium T. roseopersicina.
The results also show that in Swanbister mats different
communities of anoxygenic phototrophs are zonated
within the mat in response to the microenvironmental
conditions (Fig. 6D). The predominant T-RF of 214 bp
obtained with restriction enzyme Hin6I represents the
dominating anoxygenic phototrophic community in
Swanbister beach mats, as deduced from the sequences
and T-RFs of purple bacteria presently available. Although
predictive digestions made in silico on the RDP Web site
(TAP: T-RFLP Analysis Program) cannot be used for
phylogenetic identification of communities based on their
T-RFs [58], this T-RF could be related to the species Al-
lochromatium vinosum. The presence of this major species
seemed to be independent of depth, O2 and irradiance
(Fig. 6D) and was distributed all over the mat (data not
shown). This species was also found by van Gemerden et
al. [86]. Further determination of pufM gene sequences
from isolated purple bacteria will be useful to obtain more
information about the dominant members.
Two closely related community clusters of purple bac-
teria were found in the depth layer from 1 to 3 mm (Fig. 6B),
i.e., in the transition layer of the mat. Communities present
in this layer experienced pronounced variations, ranging
from highly oxic during high light conditions to sulfidic
conditions during darkness. These pronounced varia-
tions seem to select for versatile species of purple bacteria
(also others than T. roseopersicina) able to thrive under
these conditions. As indicated by T-RFLP analysis, these
could include species of the genus Allochromatium, which
are characterized by a pronounced metabolic versatility
[40, 69].
Since microsensor and T-RFLP analyses were not per-
formed in exactly the same Swanbister mat sample, some
deviations concerning the localization of this transition
layer might have occurred between both samples. Fur-
thermore, the O2 and sulfide microgradients measured in a
laboratory under controlled conditions similar to the
conditions during immersion periods might change dur-
ing emersion periods as occurring in situ during low tide.
However, our laboratory microsensor data compare rela-
tively well to microsensor profiles measured in situ at low
tide by van Gemerden et al. [86]. Furthermore, the fact
that these two community clusters were less related to
the community in the upper mat layers than to the com-
munity below 3 mm depth points to an O2-dependent
distribution of purple bacteria in Swanbister Bay mats.
This is consistent with the CCA showing that O2 is the
most important variable influencing the distribution of
purple bacteria. Thus, despite the predominance of
T. roseopersicina in these mats, a variety of different
386 A. Wieland et al.

purple bacteria may have stratified in response to O2 and
sulfide gradients.
Also, the distribution and diversity of sulfate-reducing
bacteria seemed to be partly influenced by O2. A distinct
and related SRB community cluster was found in the up-
permost mat layer, clearly differing from the communities
found at increasing depths (Fig. 6A). Thus, the almost
permanent oxic conditions in the uppermost mat layer
(Figs. 7, 8) may select for especially O2-tolerant SRB spe-
cies. Communities of SRB below this layer are exposed to
anaerobic conditions at least during low light and dark
periods (Figs. 7, 8). Several SRB, e.g., Desulfovibrio species
and Desulfonema-related bacteria, possess adaptive strat-
egies for survival under oxic conditions, enabling them to
thrive in microbial mats. These strategies include aggre-
gation, migration, aerotaxis, and O2 respiration [46, 47, 81,
22, 59, 77, 14].
The CCA demonstrated that factors other than the
presence of O2 also influenced the depth distribution and
diversity of SRB. The influence of irradiance at Chl a and
BChl a absorption wavelengths (Fig. 6C) could be the re-
sult of interactions between phototrophs and SRB and
might be considered as an indirect irradiance effect. The
finding of some groups at different depths was not directly
correlated with O2 or sulfide gradients. Sulfate-reducing
bacteria are characterized by a pronounced metabolic
versatility and are apparently able to catalyze all reactions
of a complete sulfur cycle [13, 14]. This includes the use of
a variety of electron acceptors such as sulfite, sulfur,
thiosulfate, nitrate, nitrite, O2, and Fe(III), as well as their
ability to perform disproportionation and oxidation of
diverse sulfur compounds (sulfur, thiosulfate, sulfite), and
aerobic respiration [3, 44, 19, 15, 12, 55, 45, 26, 95]. Thus,
not only the presence of O2 and the availability of organic
substrates, but also the distribution of sulfur compounds
like thiosulfate, sulfur, and sulfite could influence the
distribution of SRB in this mat.
Microbial communities of coastal microbial mats on the
Orkney Islands are apparently more diverse than previ-
ously described. Furthermore, although mats on Swanb-
ister beach could be distinguished concerning population
density and localization of the purple layer on or below the
mat surface (Figs. 4, 5), a clear differentiation between
different microbial mats as found and described earlier
[86] was not possible in July 2000. In particular, sediments
populated only by purple bacteria and characterized by an
absence of Chl a–containing oxygenic phototrophs could
not be found. This type of mat was previously described as
one of the three types of mat systems developing especially
on Swanbister beach [86]. The enforcement of strict waste
discharge regulations has led to improved wastewater
treatment in the area over the past decade, which has
significantly reduced the amount of organic matter dis-
charged onto the beaches. These changes have created
environmental conditions less favorable for the exclusive
development of purple sulfur bacteria, which would also
account for the increased microbial diversity in these mat
sediments.
Acknowledgements
We acknowledge the financial support by the EC (MAT-
BIOPOL project, grant EVK3-CT-1999-00010) and the
Danish Natural Science Research Council (M.K., contract
no. 9700549). The staff and especially Alex Simpson, Di-
rector of the Orkney County Council Marine Unit labo-
ratory, are gratefully acknowledged for providing excellent
laboratory facilities. Anni Glud is acknowledged for the
construction of the microsensors.
References
1. Achenbach LA, Carey J, Madigan MT (2001) Photosynthetic
and phylogenetic primers for detection of anoxygenic pho-
totrophs in natural environments. Appl Environ Microbiol
67:2922–2926
2. Amann RI, Binder BJ, Olson RJ, Chisholm SW, Devereux R,
Stahl DA (1990) Combination of 16S rRNA-targeted oligo-
nucleotide probes with flow cytometry for analyzing mixed
microbial populations. Appl Environ Microbiol 56:1919–
1925
3. Bak F, Cypionka H (1987) A novel type of energy metabo-
lism involving fermentation of inorganic sulphur com-
pounds. Nature 326:891–892
4. Ballantine JA, Lavis A, Morris RJ (1979) Sterols of the
phytoplankton—effects of illumination and growth stage.
Phytochemistry 18:1459–1466
5. Barbe A, Grimalt JO, Pueyo JJ, Albaiges J (1990) Charac-
terization of model evaporitic environments through the
study of lipid components. Org Geochem 16:815–828
6. Beja O, Suzuki MT, Heidelberg JF, Nelson WC, Preston CM,
Hamada T, Eisen JA, Fraser CM, DeLong EF (2002) Unsus-
pected diversity among marine aerobic anoxygenic photo-
trophs. Nature 415:630–633
7. Blumer M, Guillard RRL, Chase T (1971) Hydrocarbons of
marine phytoplankton. Mar Biol 8:183–189
8. Broecker WS, Peng T-H (1974) Gas exchange rates between
air and sea. Tellus 26:21–35
Microbial Mats on the Orkney Islands 387

9. Canfield DE, Des Marais DJ (1991) Aerobic sulfate reduction
in microbial mats. Science 251:1471–1473
10. Castenholz RW (2001) Phylum BX. Cyanobacteria. Oxygenic
photosynthetic bacteria. In: Boone DR, Castenholz RW
(Eds.) Bergey’s Manual of Systematic Bacteriology. The Ar-
chea and the Deeply Branching and Phototrophic Bacteria,
vol 1. Springer, Berlin, pp 473–599
11. Chuecas L, Riley JP (1969) Component fatty acids of the total
lipids of some marine phytoplankton. J Mar Biol Assoc UK
49:97–116
12. Coleman ML, Hedrick DB, Lovley DR, White DC, Pye K
(1993) Reduction of Fe(III) in sediments by sulphate-
reducing bacteria. Nature 361:436–438
13. Cypionka H (1994) Novel metabolic capacities of sulfate-
reducing bacteria, and their activities in microbial mats. In:
Stal LJ, Caumette P (Eds.) Microbial Mats: Structure,
Development and Environmental Significance, NATO ASI
Series G, vol 35. Springer, Berlin, pp 367–376
14. Cypionka H (2000) Oxygen respiration by Desulfovibrio
species. Ann Rev Microbiol 54:827–848
15. Dannenberg S, Kroder M, Dilling W, Cypionka H (1992)
Oxidation of H2, organic compounds and inorganic sulfur
compounds coupled to reduction of O2 or nitrate by sulfate-
reducing bacteria. Arch Microbiol 158:93–99
16. de Wit R, Jonkers HM, van den Ende FP, van Gemerden H
(1989) In situ fluctuations of oxygen and sulphide in ma-
rine microbial sediment ecosystems. Neth J Sea Res 23:271–
281
17. de Wit R, van Gemerden H (1987) Chemolithotrophic
growth of the phototrophic sulfur bacterium Thiocapsa
roseopersicina. FEMS Microbiol Ecol 45:117–126
18. Didyk BM, Simoneit BRT, Brassell SC, Eglinton G (1978)
Organic geochemical indicators of palaeoenvironmental
conditions of sedimentation. Nature 272:216–222
19. Dilling W, Cypionka H (1990) Aerobic respiration in sulfate-
reducing bacteria. FEMS Microbiol Lett 71:123–128
20. Eglinton G, Hamilton RJ (1967) Leaf epicuticular waxes.
Science 156:1322
21. Epping EHG, Khalili A, Thar R (1999) Photosynthesis and
the dynamics of oxygen consumption in a microbial mat as
calculated from transient oxygen microprofiles. Limnol
Oceanogr 44:1936–1948
22. Eschemann A, Kuhl M, Cypionka H (1999) Aerotaxis in
Desulfovibrio. Environ Microbiol 1:489–495
23. Fonselius SH (1983) Determination of hydrogen sulphide.
In: Grasshoff K, Ehrhardt M, Kremling K (Eds.) Methods
of Seawater Analysis. Verlag Chemie, Weinheim, pp 73–80
24. Fossing H, Jørgensen BB (1989) Measurement of bacterial
sulfate reduction in sediments: evaluation of a single-step
chromium reduction method. Biogeochemistry 8:205–222
25. Fromin N, Hamelin J, Tarnawski S, Roesti D, Jourdain-
Miserez K, Forestier N, Teyssier-Cuvelle S, Gillet F, Aragno
M, Rossi P (2002) Statistical analysis of denaturing gel
electrophoresis (DGE) fingerprinting patterns. Environ
Microbiol 4:634–643
26. Fuseler K, Krekeler D, Sydow U, Cypionka H (1996) A
common pathway of sulfide oxidation by sulfate-reducing
bacteria. FEMS Microbiol Lett 144:129–134
27. Garcıa HE, Gordon LI (1992) Oxygen solubility in sea-
water: Better fitting equations. Limnol Oceanogr 37:1307–
1312
28. Grant J, Gust G (1987) Prediction of coastal sediment sta-
bility from photopigment content of mats of purple sulphur
bacteria. Nature 330:244–246
29. Grimalt JO, de Wit R, Teixidor P, Albaiges J (1992) Lipid
biogeochemistry of Phormidium and Microcoleus mats. Org
Geochem 19:509–530
30. Han J, McCarthy ED, Calvin M, Benn MH (1968) Hydro-
carbon constituents of the blue-green algae Nostoc musco-
rum, Anacystis nidulans, Phormidium luridum and
Chlorogloea fritschii. J Chem Soc C:2785–2791
31. Herbert RA (1985) Development of mass blooms of photo-
synthetic bacteria on sheltered beaches in Scapa Flow,
Orkney Islands. Proc Roy Soc Edinburgh 87B:15–25
32. Hershey JP, Plese T, Millero FJ (1988) The pK1* for the
dissociation of H2S in various ionic media. Geochim Cos-
mochim Acta 52:2047–2051
33. Hoffmann C (1942) Beitrage zur Vegetation des Farbstrei-
fen-Sandwattes. Kieler Meeresforschungen Sonderheft 4:85–
108
34. Holzer G, Oro J, Tornabene TG (1979) Gas chromato-
graphic–mass spectrometric analysis of neutral lipids from
methanogenic and thermoacidophilic bacteria. J Chroma-
togr 186:795–809
35. Isaksen M, Finster K (1996) Sulfate reduction in the root
zone of the sea grass Zostera noltii on the intertidal flats of a
coastal lagoon (Arcachon, France). Mar Ecol Prog Ser
137:187–194
36. Jeroschewski P, Steuckart C, Kuhl M (1996) An ampero-
metric microsensor for the determination of H2S in aquatic
environments. Anal Chem 68:4351–4357
37. Jonkers HM, de Bruin S, van Gemerden H (1998) Turnover
of dimethylsulfoniopropionate (DMSP) by the purple sulfur
bacterium Thiocapsa roseopersicina M11: ecological impli-
cations. FEMS Microbiol Ecol 27:281–290
38. Jonkers HM, Jansen M, Van der Maarel MJEC, van Gemer-
den H (1999) Aerobic turnover of dimethyl sulfide by the
anoxygenic phototrophic bacterium Thiocapsa roseopersi-
cina. Arch Microbiol 172:150–156
39. Jonkers HM, Koopmans GF, van Gemerden H (1998) Dy-
namics of dimethyl sulfide in a marine microbial mat.
Microb Ecol 36:93–100
40. Kampf C, Pfennig N (1980) Capacity of Chromatiaceae for
chemotrophic growth. Specific respiration rates of Thiocystis
violacea and Chromatium vinosum. Arch Microbiol
127:125–135
41. Kates M, Tremblay P, Anderson R, Volcani BE (1978)
Identification of the free and conjugated sterol in a non-
photosynthetic diatom, Nitzschia alba, as 24-methylene
cholesterol. Lipids 13:34–41
388 A. Wieland et al.
42. Kelly DP, Smith NA (1990) Organic sulfur compounds in the
environment. Adv Microb Ecol 11:345–385
43. King GM (1984) Utilisation of hydrogen, acetate and ‘‘non-
competitive’’ substrates by methanogenic bacteria in marine
sediments. Geomicrobiol J 3:275–306
44. Kramer M, Cypionka H (1989) Sulfate formation via ATP
sulfurylase in thiosulfate- and sulfite-disproportionating
bacteria. Arch Microbiol 151:232–237
45. Krekeler D, Cypionka H (1995) The preferred electron ac-
ceptor of Desulfovibrio desulfuricans CSN. FEMS Microbiol
Ecol 17:271–278
46. Krekeler D, Sigalevich P, Teske A, Cypionka H, Cohen Y
(1997) A sulfate-reducing bacterium from the oxic layer of a
microbial mat from Solar Lake (Sinai), Desulfovibrio oxycl-
inae sp. nov. Arch Microbiol 167:369–375
47. Krekeler D, Teske A, Cypionka H (1998) Strategies of sul-
fate-reducing bacteria to escape oxygen stress in a cyano-
bacterial mat. FEMS Microbiol Ecol 25:89–96
48. Kuhl M, Fenchel T (2000) Bio-optical characteristics and the
vertical distribution of photosynthetic pigments and pho-
tosynthesis in an artificial cyanobacterial mat. Microb Ecol
40:85–93
49. Kuhl M, Jørgensen BB (1992) Spectral light measurements in
microbenthic phototrophic communities with a fiber-optic
microprobe coupled to a sensitive diode array detector.
Limnol Oceanogr 37:1813–1823
50. Kuhl M, Steuckart C, Eickert G, Jeroschewski P (1998) A H2S
microsensor for profiling biofilms and sediments: applica-
tion in an acidic lake sediment. Aquat Microb Ecol 15:201–
209
51. Kumar S, Tamura K, Jakobsen IB, Nei M (2001) MEGA2:
Molecular evolutionary genetics analysis software, Bioin-
formatics
52. Lassen C, Ploug H, Jørgensen BB (1992) A fibre-optic scalar
irradiance microsensor: Application for spectral light
measurements in sediments. FEMS Microbiol Ecol 86:247–
254
53. Li Y-H, Gregory S (1974) Diffusion of ions in sea water and
in deep-sea sediments. Geochim Cosmochim Acta 38:703–
714
54. Liu WT, Marsh TL, Cheng H, Forney LJ (1997) Char-
acterization of microbial diversity by determining ter-
minal restriction fragment length polymorphisms of
genes encoding 16S rRNA. Appl Environ Microbiol 63:4516–
4522
55. Lovley DR, Phillips EJP (1994) Novel processes for anaerobic
sulfate production from elemental sulfur by sulfate-reducing
bacteria. Appl Environ Microbiol 60:2394–2399
56. Maidak BL, Cole JR, Lilburn TG, Parker CTJ, Saxman PR,
Farris RJ, Garrity GM, Olsen GJ, Schmidt TM, Tiedje JM
(2001) The RDP-II (Ribosomal Database Project). Nucleic
Acids Res 29:173–174
57. Marlowe IT, Brassell SC, Eglinton G, Green JC (1984) Long
chain unsaturated ketones and esters in living algae and
marine sediments. Org Geochem 6:135–141
58. Marsh TL, Saxman P, Cole J, Tiedje J (2000) Terminal re-
striction fragment length polymorphism analysis program, a
web-based research tool for microbial community analysis.
Appl Environ Microbiol 66:3616–3620
59. Minz D, Flax JL, Green SJ, Muyzer G, Cohen Y, Wagner M,
Rittmann BE, Stahl DA (1999) Diversity of sulfate-reducing
bacteria in oxic and anoxic regions of a microbial mat
characterized by comparative analysis of dissimilatory
sulfite reductase genes. Appl Environ Microbiol 65:4666–
4671
60. Nagashima KVP, Hiraishi A, Shimada K, Matsuura K (1997)
Horizontal transfer of genes coding for the photosynthetic
reaction centers of purple bacteria. J Mol Evol 45:131–136
61. Nes WR, McKean ML (1977) Biogeochemistry of Steroids
and Other Isoprenoids. University Park Press, Baltimore
62. Nichols PD, Volkman JK, Palmisano AC, Smith GA, White
DC (1988) Occurrence of an isoprenoid C25 diunsaturated
alkene and high neutral lipid content in Antarctic sea-ice
diatom communities. J Phycol 24:90–96
63. Nishimura M, Koyama T (1977) The occurrence of stanols in
various living organisms and the behaviour of sterols
in contemporary sediments. Geochim Cosmochim Acta
41:379–385
64. Orcutt DM, Paterson GW (1975) Sterol, fatty acid and ele-
mental composition of diatoms grown in chemically defined
media. Comp Biochem Physiol 506:579–583
65. Oremland RS, King GM (1989) Methanogenesis in hyper-
saline environments. In: Cohen Y, Rosenberg E (Eds.) Mi-
crobial Mats: Physiological Ecology of Benthic Microbial
Communities. American Society for Microbiology, Wash-
ington DC, pp 180–190
66. Oremland RS, Marsh LM, Polcin S (1982) Methane pro-
duction and simultaneous sulfate reduction in anoxic, salt
marsh sediments. Nature 296:143–145
67. Paoletti C, Pushparaj B, Florenzano G, Capella P, Lercker G
(1976) Unsaponifiable matter of green and blue-green algal
lipids as a factor of biochemical differentiation of their
biomass: II. Terpenic alcohol and sterol fractions. Lipids
11:266–271
68. Patterson GW (1974) Sterols of some green algae. Comp
Biochem Physiol 47B:453–457
69. Pfennig N, Truper HG (1992) The family Chromatiaceae. In:
Balows A, Truper HG, Dworkin M, Harder W, Schleifer K-H
(Eds.) The Prokaryotes. Springer, Berlin, pp 3200–3221
70. Pringault O, de Wit R, Caumette P (1996) A benthic gradient
chamber for culturing phototrophic sulfur bacteria on re-
constituted sediments. FEMS Microbiol Ecol 20:237–250
71. Pringault O, de Wit R, Kuhl M (1999) A microsensor study
of the interaction between purple sulfur and green sulfur
bacteria in experimental benthic gradients. Microb Ecol
37:173–184
72. Revsbech NP (1989) An oxygen microelectrode with a guard
cathode. Limnol Oceanogr 34:474–478
73. Revsbech NP, Jørgensen BB (1983) Photosynthesis of bent-
hic microflora measured with high spatial resolution by the
Microbial Mats on the Orkney Islands 389

oxygen microprofile method: Capabilities and limitations of
the method. Limnol Oceanogr 28:749–756
74. Revsbech NP, Jørgensen BB (1986) Microelectrodes: Their
use in microbial ecology. Adv Microb Ecol 9:293–352
75. Schouten S, van der Maarel MEJ, Huber R, Sinninghe
Damste JS (1997) 2,6,10,15,19-Pentamethylicosenes in
Methanolobus bombayensis, a marine methanogenic arch-
aeon and Methanosarcina mazei. Org Geochem 26:409–414
76. Senior E, Lindstrom EB, Banat I, Nedwell DB (1982) Sulfate
reduction and methanogenesis in the sediment of a salt-
marsh on the east coast of the United Kingdom. Appl En-
viron Microbiol 43:987–996
77. Sigalevich P, Meshorer E, Helman Y, Cohen Y (2000)
Transition from anaerobic to aerobic growth conditions for
the sulfate-reducing bacterium Desulfovibrio oxyclinae re-
sults in flocculation. Appl Environ Microbiol 66:5005–5012
78. Skyring GW (1987) Sulfate reduction in coastal ecosystems.
Geomicrobiol J 5:295–374
79. Stal LJ, van Gemerden H, Krumbein WE (1985) Structure
and development of a benthic marine microbial mat. FEMS
Microbiol Ecol 31:111–125
80. Tabatabai MA (1974) Determination of sulfate in water
samples. Sulfur Inst J 10:11–14
81. Teske A, Ramsing NB, Habicht K, Fukui M, Kuver J,
Jørgensen BB, Cohen Y (1998) Sulfate-reducing bacteria and
their activities in cyanobacterial mats of Solar Lake (Sinai,
Egypt). Appl Environ Microbiol 64:2943–2951
82. Tornabene TG, Langworthy TA, Holzer G, Oro J (1979)
Squalenes, phytanes and other isoprenoids as major neutral
lipids of methanogenic and thermoacidophilic ‘‘archaebac-
teria.’’ J Mol Evol 13:73–83
83. Ullman WJ, Aller RC (1982) Diffusion coefficients in near-
shore marine sediments. Limnol Oceanogr 27:552–556
84. van Gemerden H (1993) Microbial mats: a joint venture. Mar
Geol 113:3–25
85. van Gemerden H, de Wit R, Tughan CS, Herbert RA (1989a)
Development of mass blooms of Thiocapsa roseopersicina on
sheltered beaches on the Orkney Islands. FEMS Microbiol
Ecol 62:111–118
86. van Gemerden H, Tughan CS, de Wit R, Herbert RA (1989b)
Laminated microbial ecosystems on sheltered beaches in
Scapa Flow, Orkney Islands. FEMS Microbiol Ecol 62:87–102
87. Visscher PT, Nijburg JW, van Gemerden H (1990) Polysul-
fide utilization by Thiocapsa roseopersicina. Arch Microbiol
155:75–81
88. Visscher PT, Prins RA, van Gemerden H (1992) Rates of
sulfate reduction and thiosulfate consumption in a marine
microbial mat. FEMS Microbiol Ecol 86:283–294
89. Visscher PT, Quist P, van Gemerden H (1991) Methylated
sulfur compounds in microbial mats: in situ concentrations
and metabolism by a colorless sulfur bacterium. Appl En-
viron Microbiol 57(6):1758–1763
90. Visscher PT, van Gemerden H (1991) Photo-autotrophic
growth of Thiocapsa roseopersicina on dimethyl sulfide.
FEMS Microbiol Lett 81:247–250
91. Vogel AI (1978) Textbook of Practical Organic Chemistry.
Longman, New York
92. Volkman JK, Eglinton G, Corner EDS, Sargent JR (1980)
Novel unsaturated straight-chain C37–C39 methyl and ethyl
ketones in marine sediments and a coccolithophore Emili-
ania huxleyi. Adv Org Geochem 1979:219–227
93. Volkman JK, Jeffrey SW, Nichols PD, Rogers GI, Garland CD
(1989) Fatty acids and lipid composition of 10 species of
microalgae used in mariculture. J Exp Mar Biol Ecol
128:219–240
94. Welsh DT (2000) Ecological significance of compatible sol-
ute accumulation by microorganisms: from single cells to
global climate. FEMS Microbiol Rev 24:263–290
95. Widdel F (1988) Microbiology and ecology of sulfate- and
sulfur-reducing bacteria. In: Zehnder AJB (Eds.) Biology of
Anaerobic Microorganisms. John Wiley, New York, pp 469–
585
96. Wieland A, Kuhl M (2000) Irradiance and temperature
regulation of oxygenic photosynthesis and O2 consumption
in a hypersaline cyanobacterial mat (Solar Lake, Egypt). Mar
Biol 137:71–85
97. Wieland A, Kuhl M (2000) Short-term temperature effects
on oxygen and sulfide cycling in a hypersaline cyano-
bacterial mat (Solar Lake, Egypt). Mar Ecol Prog Ser 196:87–
102
98. Wieringa EBA, Overmann J, Cypionka H (2000) Detection of
abundant sulphate-reducing bacteria in marine oxic sedi-
ment layers by a combined cultivation and molecular ap-
proach. Environ Microbiol 2:417–427
390 A. Wieland et al.
SCANNING VOL. 27, 176–180 (2005) Received: December 1, 2004© FAMS, Inc. Accepted with revision: May 6, 2005
Characterization of an Oil-Degrading Microcoleus Consortium by Meansof Confocal Scanning Microscopy, Scanning Electron Microscopy andTransmission Electron Microscopy
ELIA DIESTRA, ANTONIO SOLÉ, MERCEDES MARTÍ,* TIRSO GARCIA DE OTEYZA,† JOAN O. GRIMALT,† ISABEL ESTEVE
Department of Genetics and Microbiology, Autonomous University of Barcelona, and *Microscopy Service, AutonomousUniversity of Barcelona, Bellatera; †Department of Environmental Chemistry (IIQAB-CSIC), Barcelona, Spain
Summary: A consortium of microorganisms with the ca-pacity to degrade crude oil has been characterized by meansof confocal laser scanning microscopy (CLSM), trans-mission electron microscopy (TEM), and scanning electronmicroscopy (SEM). The analysis using CLSM shows thatMicrocoleus chthonoplastes is the dominant organism inthe consortium. This cyanobacterium forms long filamentsthat group together in bundles inside a mucopolysaccha-ride sheath. Scanning electron microscopy and transmis-sion electron microscopy have allowed us to demonstratethat this cyanobacterium forms a consortium primarilywith three morphotypes of the heterotrophic microorgan-isms found in the Microcoleus chthonoplastes sheath. Theoptimal growth of Microcoleus consortium was obtainedin presence of light and crude oil, and under anaerobic con-ditions. When grown in agar plate, only one type of colony(green and filamentous) was observed.
Key words: Microcoleus consortium, confocal laser scan-ning microscopy, transmission electron microscopy, scan-ning electron microscopy, crude oil
PACS: 07.78.+s, 0.7.79.-v, 61.16.Bg, 61.16. Ch, 87.64.Dz
IntroductionMicrobial mats are benthic stratified microbial com-
munities in which different microorganisms are closelypacked in a very thin layer (15 mm) which covers the sed-iment. These mats are found throughout the world and areformed primarily by cyanobacteria (oxygenic phototrophicmicroorganisms), which are responsible for the primary
production of these ecosystems (Stal 1995). Confocal laserscanning microscopy (CLSM), scanning electron mi-croscopy (SEM), and transmission electron microscopy(TEM) have been used repeatedly to characterize the form-ing of these communities.
Confocal laser scanning microscopy has been used suc-cessfully for identifying filamentous cyanobacteria. Two-dimensional (2-D) and three-dimensional (3-D) imageshave been used for visualizing cyanobacetria filaments atdepth. Cyanobacteria emit natural autofluorescence whichmakes it possible to examine the cells in situ, minimizingthe samples treatment (Fourçans et al. 2004, Solé et al.2001, Wieland et al. 2003).
Due to their high-resolution capabilities, SEM and TEMhave often been used for characterizing the overall biodi-versity of natural microbial communities (Esteve et al.1994, Mir and Esteve 1992, Stolz 1994).
Although molecular techniques are also regularly ap-plied to study biodiversity in microbial mats, these tech-niques may give rise to difficulties in the case of cyanobac-teria with thick polysaccharide sheaths (López-Cortés et al.2001). Cyanobacteria in natural environments usually forma consortium with different populations of microorganisms.Consortium interactions mediate mutually beneficial cy-cling of potentially limiting nutrients. The mutual benefitsare also evident in culture experiments, in which cyanobac-terial hosts and bacterial epiphytes promote each other’sgrowth (Paerl et al. 1994) and could potentially improvedegradation of complex environmental contaminants suchas a crude oil.
Previous studies carried out by Al-Hasan et al. (1994,1998) indicate that cyanobacterial microbial mats developextensively after oil spills as seen in Kuwait following thefirst Gulf war.
In the wake of these studies, our group started a projectto determine the role of cyanobacterial mats on oil degra-dation in natural environments. During this study, we es-tablished several microcosms in which the effect of oil pol-lution on the structure of the cyanobacterial communitieswas thoroughly studied. From these microcosms a con-sortium of microorganisms was isolated capable of de-grading crude oil (Garcia de Oteyza et al. 2004).
This research was supported by Spanish grant DGICYT BOS2001-2033.
Address for reprints:
Elia DiestraDepartment of Genetics and MicrobiologyAutonomous University of Barcelona08193 Bellaterra, Spaine-mail: [email protected]
E. Diestra et al.: CLSM, SEM, and TEM used to characterize Microcoleus 177
In the present study, we applied CLSM, SEM, and TEMto characterize the microorganisms that form the above-mentioned consortium.
Materials and Methods
Sample Treatment and Growth Conditions
Artificial microcosms, which simulate marine microbialmats, were prepared in polypropylene boxes according tothe method described by Llirós et al. 2003. Some of thesemicrocosms were polluted with crude oil after inoculationwith samples of microbial mat obtained from the Ebrodelta. After 2 months, samples were taken from these mi-crocosms to obtain cyanobacteria cultures with the capac-ity to degrade crude oil.
Cyanobacteria enrichment cultures were obtained byintroducing a portion of the microbial mat into mineralPfenning medium (van Gemerden and Beeftink 1993) andcontaining 3% (v/v) of Maya crude oil. Cultures weregrown in anoxic conditions and incubated in the light at 15µEm–2s–1 and 27ºC. Microcoleus consortium cultures wereobtained in liquid medium from the enrichment cultures,using the procedure described above. This consortium wasalso grown in a solid medium covered with 150 µl of crudeoil. The plates were incubated in anaerobic jars under theconditions already mentioned.
To illustrate the role of the consortium in oil degradation,different experiments were carried out. Culture aliquotsfrom the previously described consortium were growingboth in presence and absence of light, carbonates, and crudeoil. Aerobic and anaerobic conditions were also tested.
Colonies of the consortium obtained on agar plates aswell as growth liquid medium were characterized by meansof CLSM, SEM, and TEM.
Confocal Laser Scanning Microscopy
Samples were taken from liquid cultures and agar platesand analyzed by CLSM in accordance with the method de-scribed by Solé et al. (1998). Samples were viewed in aLeica true confocal scanner TCS 4d (Leica Laser-TechnikGmbH, Heidelberg, Germany).These were excited with a568 nm line from a laser argon krypton. The fluorescencewas captured with a long-pass 590 filter. Twenty focalplanes were obtained from 20 µm thickness. Later, apply-ing the confocal software summa, projections and stereo-scopic images were obtained (with 2-D and 3-D informa-tion, respectively). The 2-D and 3-D images were used tofollow the filaments of Microcoleus chthonoplastes indepth.
Scanning Electron Microscopy
For SEM, samples were fixed in 2.5% glutaraldehydeand washed in buffer phosphate according to Miloning
(1961). They were then centrifuged and dehydrated insuccessively increasing concentrations of acetone (30, 50,70, and 100%). Subsequently, the samples were processedaccording to the method described by Nogués et al. (1994)(this method describes the use of specific capsules inwhich the sample is placed and then dehydrated withoutloss or alteration) and dried by critical-point drying. Fi-nally, all samples were mounted on metal stubs, coated(thus avoiding charging the samples and ensuring goodimage quality) with a 96 nm layer of gold (this ensures bet-ter secondary-electron emission and, therefore, betterimage quality). The images were viewed with a Hitachi S-570 scanning electron microscope (Hitachi Ltd., Tokyo,Japan).
Transmission Electron Microscopy
For thin sectioning, samples from liquid and solid mediawere suspended in 2.5% glutaraldehyde sodium cacodylatebuffer (0.1M; pH 7.4) for 2 h, according to Esteve et al.(1990). The samples were washed in the same buffer, post-fixed with 1% OsO4 (at 4ºC for 2 h) and washed three timesin the same buffer. Samples were centrifuged at 5,000 xg for10 min and the pellet obtained was mixed with an equal vol-ume of 2% pure agar. The agar was cut into small cubes, de-hydrated in a graded series (30, 50, 70, 100%) of acetone,and then rinsed twice in 100% propylene oxide. Finally, sam-ples were embedded in Spurr resin. An LKB ultramicrotomewas used for sectioning (LKG, Bromma, Sweden). Ultrathinsections were mounted on carbon-coated grids, stained withsaturated uranyl acetate and Reynolds lead citrate (Reynolds1963) and viewed in a Hitachi H-7000 transmission electronmicroscope (Hitachi Ltd).
For size determination of heterotrophic bacteria, a totalof 300 measurements were made, taken directly from theprinted images at a final enlargement of ×4600.
Results and Discussion
Cultures of the consortium were obtained from samplestaken from microcosms polluted with Maya crude oil, asdescribed in Materials and Methods.
In Figure 1a, dense masses of the consortium can be seenfixed to the oil by means of a matrix of polysaccharides.In the same way, colonies of this consortium (irregular inshape and greenish in color) (Fig. 1b) and cell lawns(Fig.1c) were obtained by growing them in a solid mediumpolluted with oil.
Confocal laser scanning microscopy was used to char-acterize the cyanobacterium forming the consortium. Longtrichomes can be observed between the droplets of oil(Fig. 1d). The trichomes can be seen to be made up of cellsthat are greater in length than width (3 µm in diameter),with visible constrictions at the cross walls; the mature endcells are conical. According to Castenholz (2001), thiscyanobacterium has been identified as Microcoleus
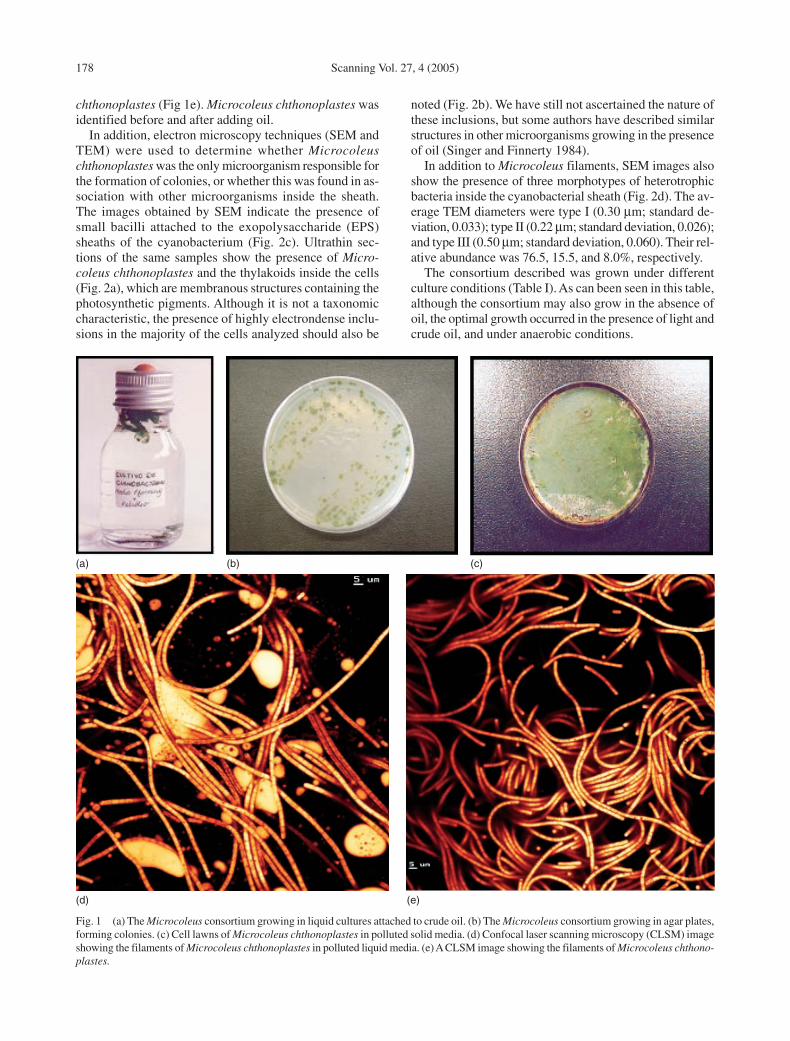
178 Scanning Vol. 27, 4 (2005)
chthonoplastes (Fig 1e). Microcoleus chthonoplastes wasidentified before and after adding oil.
In addition, electron microscopy techniques (SEM andTEM) were used to determine whether Microcoleuschthonoplastes was the only microorganism responsible forthe formation of colonies, or whether this was found in as-sociation with other microorganisms inside the sheath.The images obtained by SEM indicate the presence ofsmall bacilli attached to the exopolysaccharide (EPS)sheaths of the cyanobacterium (Fig. 2c). Ultrathin sec-tions of the same samples show the presence of Micro-coleus chthonoplastes and the thylakoids inside the cells(Fig. 2a), which are membranous structures containing thephotosynthetic pigments. Although it is not a taxonomiccharacteristic, the presence of highly electrondense inclu-sions in the majority of the cells analyzed should also be
noted (Fig. 2b). We have still not ascertained the nature ofthese inclusions, but some authors have described similarstructures in other microorganisms growing in the presenceof oil (Singer and Finnerty 1984).
In addition to Microcoleus filaments, SEM images alsoshow the presence of three morphotypes of heterotrophicbacteria inside the cyanobacterial sheath (Fig. 2d). The av-erage TEM diameters were type I (0.30 µm; standard de-viation, 0.033); type II (0.22 µm; standard deviation, 0.026);and type III (0.50 µm; standard deviation, 0.060). Their rel-ative abundance was 76.5, 15.5, and 8.0%, respectively.
The consortium described was grown under differentculture conditions (Table I). As can been seen in this table,although the consortium may also grow in the absence ofoil, the optimal growth occurred in the presence of light andcrude oil, and under anaerobic conditions.
Fig. 1 (a) The Microcoleus consortium growing in liquid cultures attached to crude oil. (b) The Microcoleus consortium growing in agar plates,forming colonies. (c) Cell lawns of Microcoleus chthonoplastes in polluted solid media. (d) Confocal laser scanning microscopy (CLSM) imageshowing the filaments of Microcoleus chthonoplastes in polluted liquid media. (e) A CLSM image showing the filaments of Microcoleus chthono-plastes.
(a) (b) (c)
(d) (e)

E. Diestra et al.: CLSM, SEM, and TEM used to characterize Microcoleus 179
The consortium grew in the presence of light, which itmeans that the consortium’s heterotrophic depended on thegrowth of Microcoleus chthonoplastes for its own growth.Furthermore, no growth whatsoever is detected in the ab-sence of light.
Table I, also shows that the consortium can grow bothaerobically and anaerobically. Similar studies into thegrowth of Microcoleus chthonoplastes in natural environ-ments demonstrated that this cyanobacterium can carryout oxygenic and anoxygenic photosynthesis (Solé et al.2003).
Concerning the carbon source, the consortium grew inthe presence of carbonates as well as of crude oil; never-theless, the oil provided the optimum growth for the con-
Fig. 2 (a) Ultrathin sections of Microcoleus chthonoplastes; the thylakoids are indicated by arrows. Scale bar = 1 µm. (b) Ultrathin sectionsof Microcoleus chthonoplastes from polluted liquid media. The electrondense inclusions organules inside the cell are indicated by arrows. Scalebar = 500 nm. (c) Scanning electron microscopy micrography of Microcoleus chthonoplastes surrounded by heterotrophic microorganisms (aand b). Scale bar = 1µm. (d) Ultrathin sections of Microcoleus chthonoplastes with the majority of heterotrophic bacteria surrounded by ex-opolysaccharide (indicated by arrow). Scale bar = 1µm.
TABLE 1 Cultures of Microcoleus consortium under differentgrowth conditions
Carbon source
Light O2 CO3 Crude oil Growth
+ – – + +++++ + – + +++ – – + ++ + + – +– – – + –– + + – –– – + – –– + – + –
(a)
(b)
(c)
(d)

180 Scanning Vol. 27, 4 (2005)
sortium. We recently demonstrated that the consortium isessentially involved in degradation of aliphatic hetero-cyclic organo-sulphur compounds, such as alkylthiolanesand alkylthianes. Other groups of compounds, such as thealkylated monocyclic and polycyclic aromatic hydrocar-bons carbazoles, benzothiophenes and dibenzothiophenes,also underwent some degree of transformation, involvingonly the more volatile and less alkylated homologues (Gar-cia de Oteyza et al. 2004).
The use of different high-resolution microscopy tech-niques allowed us not only to characterize the microor-ganisms that form the consortium but also to determine theirposition (inside the mucilages surrounding Microcoleuschthonoplastes), morphology, and relative abundance.
Confocal laser scanning microscopy has been ac-knowledged as especially suited to characterizing cyano-bacteria, both in cultures and natural environments (Dies-tra et al. 2004, Solé et al. 2003), as the samples do notrequire any manipulation. On the other hand, SEM andTEM (most particularly the latter) allowed us to deter-mine the relative abundance of each of the microorganismsin the consortium. The microorganisms were identified asheterotrophs through their morphometrical characteristicsand through the absence of the intra-cytoplasmatic mem-branes that characterize phototrophic microorganisms.
This consortium has the added interest of being capableof degrading Maya crude oil, rich in sulphur and aromaticcompounds, which is potentially more harmful to marineecosystems than other oils (Garcia de Oteyza et al. 2004).
Acknowledgments
The authors express their thanks to the staff of the Serveide Microscòpia at the Autonomous University of Barcelonafor technical assistance with the electron microscopy. Theyalso thank J. Mas for his help in discussing this work.
References
Al-Hasan RH, Sorkhoh NA, Al-Bader D, Radwan, SS: Utilization ofhydrocarbons by cyanobacteria from microbial mats on oilycoasts of the Gulf. Appl Microbiol Biotechnol 41, 615–619(1994)
Al-Hasan RH, Al-Bader D, Sorkhoh NA, Radwan S: Evidence for n-alkane consumption and oxidation by filamentous cyanobacte-ria from oil-contaminated coasts of the Arabian Gulf. Mar Biol130, 521–527 (1998)
Castenholz RW: Phylum BX Cyanobacteria. Oxygenic Photosyn-thetic Bacteria. In: Bergey’s Manual Systematic Bacteriology.Vol 1. The Archea and Deeply Branching and PhototrophicBacteria, 2nd ed. (Eds. Boone DR, Castenholz RW, GarrityGM). Springer-Verlag, New York 1, (2001) 473–599
Diestra E, Solé A, Esteve I: A comparative study of cyanobacterialdiversity in polluted microbial mats by means CLSM. Ophelia58, 3, 151–156 (2004)
Esteve I, Montesinos E, Mitchell JG, Guerrero R: A quantitative ul-trastructural study of Chromatium minus in the bacterial layerof Lake Cisó (Spain). Arch Microbiol 153, 316–323 (1990)
Esteve I, Ceballos D, Martínez-Alonso M, Gaju N, Guerrero R: De-velopment of versicolored microbial mats: Succession envi-ronmental significance. In Microbial Mats: Structure, Devel-opment and Environmental Significance. NATO ASI Series G:Ecological Sciences (Eds. Stal L, Caumette P). Springer-Verlag,Heidelberg 35, (1994) 4165–4420
Fourçans A, Garcia de Oteyza T, Wieland A, Solé A, Diestra E, vanBleijswijk J, Grimalt JO, Kühl M, Esteve I, Muyzer G, CaumetteP, Durán R: Characterization of functional bacterial groups in ahypersaline microbial mat community (Saline-de-Giraud, Ca-margue, France). FEMS Microbial Ecol 51/1, 55–70 (2004)
Garcia de Oteyza T, Grimalt JO, Diestra E, Solé A, Esteve, I: Changesin the composition of polar and apolar crude oil fractions underthe action of Microcoleus consortium. Appl Microbiol Biotech-nol 66, 226–232 (2004)
Llirós M, Munill X, Solé A, Martínez-Alonso M, Diestra E, EsteveI: Analysis of cyanobacteria biodiversity in pristine and non pol-luted microbial mats in microcosms by confocal laser scanningmicroscopy (CLSM). In Science, Technology and Education ofMicroscopy: An Overview (Ed. Mendez-Vilas A). FORMA-TEX Microscopy Book Series. Vol 1. (2003) 483–489
López-Cortés A, Garcia-Pichel F, Nübel U, and Vázquez-Juárez R:Cyanobacterial diversity in extremal environments in Baja Cal-ifornia, México: a polyphasic study. Int Microbiol 4, 227–236(2001)
Miloning G: Advantages of a phosphate buffer OsO4 solutions in fix-ation. J Appl Phys 32, 1637 (1961)
Mir J, Esteve I: The SEM in microbial ecology. Microsc Anal (Eu-rope Ed) 29, 31–33 (1992)
Nogués C, Martí M, Boada M, Ponsà M: A simple method for pro-cessing individual oocytes and embryos for electron microscopy.J Microsc 174, 51–54 (1994)
Paerl HW, Bebout BM, Currin CA, Fitzpatrick MW, Pinckney JL: Ni-trogen fixation dynamics in microbial mats. In Microbial mats:Structure, development and environmental significance (Eds.Stal L, Caumette P). NATO ASI Series G: Ecological Sciences,Springer-Verlag, Heidelberg 35, (1994) 325–337
Reynolds ES: The use of lead citrate at high pH as an electron-opaque stain in electron microscopy. J Cell Biol 17, 208–212(1963)
Singer ME, Finnerty NR: Microbial metabolism of straight-chain andbranched alkanes. In Petroleum Microbiology. (Ed. Atlas RM).MacMillan Publishing Co., New York 1, (1984) 1–53
Solé A, Gaju N, Guerrero R, Esteve I: Confocal laser scanning mi-croscopy of Ebro delta microbial mats. Microsc Anal 29, 13–15(1998)
Solé A, Gaju N, Méndez-Alvarez S, Esteve I: Confocal laser scan-ning microcopy as a tool to determine cyanobacteria biomass inmicrobial mats. J Microsc 204, 3, 258–262 (2001)
Solé A, Gaju N, Esteve I: The biomass dynamics of cyanobacteria inan annual cycle determined by confocal laser scanning mi-croscopy. Scanning 25, 1–7 (2003)
Stal LJ: Physiological ecology of cyanobacteria in microbial mats andother communities. New Phytol 131, 1–32 (1995)
Stolz JF: Light and electron microscopy in microbial mat research:An overview. In Microbial Mats: Structure, Development andEnvironmental Significance (Eds. Stal L, Caumette P). NATOASI Series G: Ecological Sciences, Springer-Verlag, Heidelberg35, (1994) 173–182
van Gemerden H, Beeftink HH: Ecology of phototrophic bacteria, InStudies in Microbiology. (Ed. Ormerod JG) Blackwell ScientificPublications, Oxford (1983) 146–185
Wieland A, Kühl M, McGowan L, Fourçans A, Duran R, CaumetteP, Garcia de Oteyza T, Grimalt JO, Solé A, Diestra E, Esteve I,Herbert R A: Microbial Mats on the Orkney Islands Revisited:Microenvironment and Microbial Community Composition.Microbial Ecol 46, 371–390 (2003)

For Peer Reviewhttp://mc.manuscriptcentral.com/fems
Vertical migrations of phototrophic bacterial populations in a hypersaline microbial mat from Salins-de-Giraud (Camargue, France)
Journal: FEMS Microbiology Ecology
Manuscript ID: FEMSEC-05-08-0289
Manuscript Type: Research Paper
Date Submitted by the Author:
12-Aug-2005
Complete List of Authors: Fourçans, Aude; Univesrité de Pau, laboratoire Ecologie MoleculaireSolé, Antoni; Autonomous University of Barcelona, Department of Genetics and Microbiology Diestra, Elia; Autonomous University of Barcelona, Department of Genetics and Microbiology Ranchou-Peyruse, Anthony; Université de Pau, Laboratoire ecologie moleculaire Esteve, Isabel; Autonomous University of Barcelona, Department of Genetics and Microbiology Duran, Robert; Université de Pau, Laboratoire ecologie moleculaire Caumette, Pierre; Université de Pau, Laboratoire ecologie moleculaire
Keywords:hypersaline mat, phototrophs , diel cycle , T-RFLP, CLSM, stratification
ScholarOne Support 1-434/817-2040 ext 167
FEMS Microbiology Ecology
For Peer Review
1
Vertical migrations of phototrophic bacterial populations in a 1
hypersaline microbial mat from Salins-de-Giraud (Camargue, France) 2
Fourçans, A.1, Solé, A.2, Diestra, E.2, Ranchou-Peyruse, A.1, Esteve, I.2, Caumette, P.1 and 3
Duran, R1,*4
5
6
Running title: Vertical migration of phototrophs in microbial mat 7
8
9
1 Laboratoire d’Ecologie Moléculaire EA 3525, Université de Pau et des Pays de l’Adour, 10
avenue de l’Université, BP 1155, F-64013 Pau Cedex, France 11
2 Department of Genetics and Microbiology, Autonomous University of Barcelona, E-08193 12
Bellaterra, Spain 13
14
15
16
17
18
* Corresponding author: Prof Robert DURAN - email: [email protected]
Phone: +33 5 59 40 74 80 - Fax: +33 5 59 40 74 94 20
21
22
23
Keywords : hypersaline mat, phototrophs, diel cycle, T-RFLP, CLSM, stratification. 24
25
Page 1 of 27
ScholarOne Support 1-434/817-2040 ext 167
FEMS Microbiology Ecology
123456789101112131415161718192021222324252627282930313233343536373839404142434445464748495051525354555657585960
For Peer Review
2
Abstract 25
The spatio-temporal distribution of phototrophic communities of the hypersaline 26
photosynthetic Camargue microbial mat (Salins-de-Giraud, France) was investigated during a 27
diel cycle by combining microscopic and molecular approaches. Microcoleus chthonoplastes,28
the dominant cyanobacterium of the oxyphototrophic community, was followed with 29
Confocal Laser Scanning Microscopy. Its vertical distribution varied from a homogenous 30
distribution during the night, when the oxic zone is restricted to the upper 0.5 mm, to a 31
specific localization to the upper oxic zone of 1.5 mm during daytime. It is likely that thanks 32
to a set of adaptative responses that include migration and metabolism shifts, Microcoleus 33
chthonoplastes benefit from the diel fluctuation of environmental parameters. Terminal 34
Restriction Fragment Length Polymorphism of PCR-amplified pufM gene fragments revealed 35
three groups of anoxyphototrophic populations. The first group of at least fourteen 36
populations specific for each period, the second group of at least four populations 37
homogenously distributed whatever the period and the third group of at least six populations 38
located at different horizons in function of the period considered. Thus, vertical migration, 39
aggregate formation and metabolic switches were the most evident defense of the 40
photosynthetic populations against adverse effects of sulfide and oxygen fluxes during a diel 41
cycle. 42
43
Page 2 of 27
ScholarOne Support 1-434/817-2040 ext 167
FEMS Microbiology Ecology
123456789101112131415161718192021222324252627282930313233343536373839404142434445464748495051525354555657585960

For Peer Review
3
1. Introduction 43
Microbial mats are cohesive microbial communities growing at solid-aqueous interfaces, in 44
environments as diverse as intertidal coastal sediments [1-3], hypersaline ponds [4-6] , or 45
thermal springs [7]. Oxygenic and anoxygenic phototrophic microorganisms play a dominant 46
role in these structures. Cyanobacteria, located at the surface, have been described as the chief 47
primary producers. They constitute the basic matrix and stabilize the microbial mat by 48
forming an intertwined filamentous complex network [8]. The gliding cyanobacterium 49
Microcoleus chthonoplastes was described as dominant in hypersaline environments [9, 10] , 50
marine intertidal microbial mats [11] and in hot deserts [12]. In the deeper anoxic layers of 51
the mat, phototrophic sulfur bacteria take part in the energy flow because they perform 52
simultaneously detoxification of H2S and photoassimilation of CO2 [13]. During the diel 53
cycle, the chemical gradients change dramatically exposing bacteria to variable environmental 54
conditions [14, 15]. By migration, bacteria escape from extreme conditions and therefore can 55
benefit from optimal habitats for their development [16, 17]. Although vertical migrations 56
have been previously reported for bacteria inhabiting microbial mats such as sulfur-oxidizing 57
bacteria [18-20], sulfate-reducing bacteria [21, 22] and cyanobacteria [18, 20, 22-27], it is still 58
difficult to evaluate which depth-dependent parameters (light intensity and spectral 59
composition, temperature, pH, electron donors and acceptors, carbon sources, etc.) control the 60
vertical distribution. Recently, we reported a general description of bacterial communities 61
from Camargue microbial mats [5] showing a correlation between the bacterial organization 62
and the environmental parameters at micro-scale level. Further observations of phototrophic 63
community migration are needed to fully understand the behavior of these populations in 64
response to changing environmental conditions. 65
We report here on the spatio-temporal distribution of anoxygenic and oxygenic 66
phototrophic populations in the Camargue microbial mat from Salins-de-Giraud during a diel 67
Page 3 of 27
ScholarOne Support 1-434/817-2040 ext 167
FEMS Microbiology Ecology
123456789101112131415161718192021222324252627282930313233343536373839404142434445464748495051525354555657585960
For Peer Review
4
cycle. Because of the complex structure of microbial mats, we applied molecular and 68
microscopic techniques to assess the phototrophic bacterial groups selectively at a micro-scale 69
level. The complex structure of filamentous cyanobacteria with abundant mucilage makes 70
DNA extraction difficult resulting in an underestimation of this population [28]. Making use 71
of their pigment content, we identified and quantified the cyanobacteria by analysis of optical 72
sections at high-resolution employing Confocal Laser Scanning Microscopy (CLSM), which 73
is more precise than chemical techniques of pigment quantification. To specifically target 74
anoxyphototrophs, Terminal Restriction Fragment Length Polymorphism (T-RFLP) analysis 75
of PCR amplified pufM gene was performed. Because this technique is more sensitive than 76
techniques involving measurement of extracted pigments, it made possible a resolution of 77
bacterial diversity at the genus level. We thus determined the in situ distribution of the 78
phototrophic community in a mat and correlated its migration with environmental parameters 79
as determined by use of microsensors. 80
81
2. Materials and methods 82
83
2.1 General information 84
A microbial mat in the Salins-de-Giraud saltern was analyzed in parallel with in situ,85
microsensor measurements (O2, H2S, pH) during a diel cycle in June 2001 [29]. The mat 86
existed at a salinity range between 70 and 110 ‰ (w/v) [5]. 87
88
2.2 Sampling procedure 89
We sampled microbial mats in a large shallow pond in the saltern of Salins-de-Giraud, 90
close to the sand barrier and seacoast (43°27’35’’ N, 04°41’28’’ E, Camargue, France). 91
Several samples were collected at different times (9:40h, 15:00h, 18:00h, 22:00h, 4:00h and 92
7:30h) during a diel cycle from 11 to 12 June 2001 using falcon tubes as coring devices. 93
Page 4 of 27
ScholarOne Support 1-434/817-2040 ext 167
FEMS Microbiology Ecology
123456789101112131415161718192021222324252627282930313233343536373839404142434445464748495051525354555657585960
For Peer Review
5
For T-RFLP, triplicate samples of mat cores (35 mm i.d.) were collected, at 15:00h and 94
4:00h. The upper 10 mm of the mat core was sliced off aseptically, transferred into sterile 95
Petri dishes, frozen in liquid nitrogen, transported on dry ice and finally stored at –80°C until 96
further analysis. These frozen samples were then sliced with a cryomicrotome (MICROM 97
Gmbh, Walldorf, Germany). Slices of approximately 100 µm thickness for the two first 98
millimeters, and 200 µm thickness for the next two millimeters were generated. Based on 99
prior results from microsensor measurements [29], 11 horizons within the top fourth 100
millimeters from the surface were chosen. Three replicates from each horizon were analyzed 101
to characterize bacterial communities. Genomic DNA was extracted from these different 102
slices and vertical distribution of microbial communities for each depth was determined by T-103
RFLP. 104
For CLSM analysis, sampled cores (18 mm in length) at each sampling time were placed in 105
a small plastic tube containing 2,5 % (v/v) glutaraldehyde in a phosphate buffer (0,2 M, 106
containing 90 ‰ NaCl), and stored at 4ºC until further processing. The different mat samples 107
were analyzed by means of a Leica True Confocal Scanner TCS 4d (Leica Laser-Technik 108
GmbH, Heidelberg, Germany) equipped with an argon-krypton laser. The use of this 109
microscope facilitates the characterization and identification of cyanobacteria in microbial 110
mats [30]. Subsamples were cut in vertical slices of defined dimensions taking into account 111
the need to preserve the vertical stratification of the mat. Confocal images from three 112
replicates, optical series and summa projections, were taken at every 250 µm depth in each 113
vertical slice. 114
115
2.3 Cyanobacteria characterization 116
Characterization of the cyanobacterial diversity in every mat subsample by CLSM was 117
performed directly on-screen in continuous mode and from the confocal images obtained. 118
Page 5 of 27
ScholarOne Support 1-434/817-2040 ext 167
FEMS Microbiology Ecology
123456789101112131415161718192021222324252627282930313233343536373839404142434445464748495051525354555657585960

For Peer Review
6
Cyanobacteria were identified as previously described [5]. After cyanobacteria identification, 119
the profiles of abundance for each of them were determined. 120
121
2.4 Biomass estimation of Microcoleus chthonoplastes 122
CLSM suma projection images corresponding to the different time profiles (three 123
replicates at each 250 µm depth) were transformed to binary images (black/white) using 124
Adobe Photoshop 6.0 for Windows. In these images, black contours of M. chthonoplastes 125
were selected from among all other cyanobacteria contours, which were erased from them. 126
The intercrossed black contours usually involve white areas. In the new image, a black, one-127
pixel wide line was also erased to avoid that these white areas were also count as M. 128
chthonoplastes. Morphological data of the perimeter and area for every M. chthonoplastes 129
outline were obtained through the UTHSCSA Image Tool 3.0, an image processing and 130
analysis program, and exported to a Microsoft Excel 97 book. Values for length, width and 131
biovolume were calculated in accordance with the expressions described in [31]. The quotient 132
between the biovolume of M. chthonoplastes and the volume of sediment analyzed was 133
multiplied by a factor of 310 fg C/µm3 to convert these data to biomass. Averages of biomass 134
data from three replicates and for each subsample studied were calculated. Results were 135
expressed in mg C/cm3 sediment. Finally, we determined the spatio-temporal biomass 136
variations of M. chthonoplastes.137
138
2.5 T-RFLP (Terminal Restriction Fragment Length Polymorphism) 139
From each selected horizon of the mat, genomic DNA was extracted with the UltraClean 140
Soil DNA Isolation Kit (MoBio Laboratories, Carlsbad, USA), according to the 141
recommendations of the supplier; except in the first step in which EDTA was added at a final 142
concentration of 10mM, to avoid degradation of genomic DNA. All extracted genomic DNA 143
Page 6 of 27
ScholarOne Support 1-434/817-2040 ext 167
FEMS Microbiology Ecology
123456789101112131415161718192021222324252627282930313233343536373839404142434445464748495051525354555657585960
For Peer Review
7
samples were stored at -20°C until further processing. For T-RFLP analysis, we specifically 144
targeted the purple anoxygenic phototrophs with the primers set pb557f-pb750r, which 145
amplifies a pufM DNA gene fragment [32]. For T-RFLP analysis, forward (f) and reverse (r) 146
primers were fluorescently labeled with TET and HEX respectively. The restriction enzyme 147
used in T-RFLP analysis was HaeIII (New England Biolabs, Beverly UK). Fragment analysis 148
was performed with an ABI Prism 310 (Applied Biosystems, Foster city, USA). Triplicates 149
for each layer were analyzed to avoid analytical artifacts and assure the reproducibility of the 150
method. Dominant terminal restriction fragments (T-RFs) greater than 100 fluorescent units in 151
intensity and present in each replicate were selected. Predictive digestions were performed on 152
all PufM sequences known in order to assign the different T-RFs to a certain genus or species. 153
T-RFLP profiles were normalized by calculating relative abundances from fluorescence 154
intensity of each T-RFs. Normalized T-RFLP profiles were compared by correspondence 155
factorial analysis (CFA). 156
157
2.6 Statistical analysis 158
All depth T-RFLP profiles were compared by Correspondence Factorial Analysis (CFA). 159
We assessed the extend of correlation of diversity, with biomass of Microcoleus 160
chthonoplastes estimated by CLSM, and with environmental parameters (oxygen, pH, H2S, 161
Stot) determined in a previous study during the same diel cycle [29] by the use of Canonical 162
Correspondence Analysis (CCA). These multivariable statistical analyses are ordination 163
methods by similarity matrix that reduces in two or three dimensions the dispersion diagram 164
of samples compared [5, 33]. Relatives T-RF values were calculated from each T-RFLP 165
profile and listed in a table for statistical analysis. CFA and CCA were performed with MVSP 166
v3.12d software (Kovach Computing Service, Anglesey, Wales) [34]. 167
Page 7 of 27
ScholarOne Support 1-434/817-2040 ext 167
FEMS Microbiology Ecology
123456789101112131415161718192021222324252627282930313233343536373839404142434445464748495051525354555657585960
For Peer Review
8
3. Results 168
3.1 Vertical distribution of oxygenic phototrophic bacteria in Camargue mat 169
Four major types of filamentous cyanobacteria were observed using CLSM. Microcoleus 170
chthonoplastes and Halomicronema excentricum were the most abundant. The third type was 171
an unidentified picocyanobacterium forming filaments of approximately 0.96 µm diameter. 172
The fourth type was Pseudanabaena sp., which was the less abundant. In addition, some 173
unicellular cyanobacteria were identified, which were members of the Gloeocapsa and 174
Pleurocapsa groups. The relative abundances of these cyanobacteria at different depths of the 175
mat were determined during a diel cycle (Fig. 1). M. chthonoplastes was distributed 176
throughout the mat, more abundant near the surface during daytime. Halomicronema 177
excentricum, typical of high salinity environments, was distributed throughout the mat during 178
the day while it was mainly located between 0 and 1.5 mm depth during the night. The 179
maximum abundance of the picocyanobacterium was observed in the deeper zone (between 2 180
and 4 mm). Pseudanabaena sp. was found at depth 3.25 mm only in the morning (9:40 h). 181
Cyanobacteria of the Gloeocapsa-group were found at different depth, 0.5 and 2 mm (15:00 182
h), 0.25 mm (22:00 h) and 0.75 mm (4:00 h) whereas those of the Pleurocapsa-group were 183
found at various depths at 4:00 h. Fig. 1 also reveals that Microcoleus chthonoplastes, the 184
most widely distributed cyanobacterium, showed important temporal changes. Therefore, its 185
migration within the mat during a diel cycle was followed by biomass analysis. Microcoleus 186
chthonoplastes is characterized by typical bundles with several trichomes oriented in parallel 187
with cells longer than wide and with visible constrictions at the cross-walls (Fig. 2). Its spatio-188
temporal distribution is presented in Fig. 3. At 9:40h, M. chthonoplastes was present in the 189
entire mat showing its maximum biomass (39.7 mgC/cm3 sediment) at 1 mm depth and at two 190
other zones, 1.75 mm (24.27 mgC/cm3 sediment) and 2.5 mm depth (29.53 mgC/cm3191
sediment). At 15:00h, the filaments were principally distributed in the surface part with a 192
Page 8 of 27
ScholarOne Support 1-434/817-2040 ext 167
FEMS Microbiology Ecology
123456789101112131415161718192021222324252627282930313233343536373839404142434445464748495051525354555657585960

For Peer Review
9
concentration of 31.22 mgC/cm3 sediment and at 1.75 mm depth (28.91 mgC/cm3 sediment). 193
At 18:00h, M. chthonoplastes reached the mat surface (0.5 mm) with a maximum 194
concentration (52.80 mgC/cm3 sediment), while its concentration was low at the deepest zone 195
(3 mm). During the night (22:00h), after sunset M. chthonoplastes filaments were mainly 196
localized at depths between 0 and 1.5 mm, and decreased to undetectable levels below 2.25 197
mm. At 4:00h, M. chthonoplastes filaments were homogeneously distributed throughout the 3 198
mm of the microbial mat. Finally at 7:30h, the distribution of M. chthonoplastes was similar 199
to that at 9:40h, with a maximum biomass of 35.25 mg C/cm3 sediment at depths between 200
0.75 mm and 1 mm, a 25.88 mg C/cm3 sediment at depth of 1.75 mm, and 10.49 mg C/cm3201
sediment at a depth of 2.5 mm. 202
203
3.2 Vertical distribution of anoxygenic phototrophic bacteria in the Camargue mat 204
The distribution of the phototrophic anoxygenic bacteria (PAB) within the mat was 205
analyzed during a diel cycle by T-RFLP targeting the functional pufM gene that encodes for a 206
subunit of the photosynthetic center of purple bacteria. The study was performed at two 207
contrasted hours (15:00h and 4:00h) showing opposite oxygen/sulfide gradients [29]. 208
T-RFLP profiles revealed an important diversity of the PAB communities within the mat, 209
with 24 different OTUs (Operational Taxonomic Unit) detected by digestion with HaeIII. The 210
overall organization of anoxyphototroph populations changed between daylight (15:00h) and 211
early morning (4:00h) (Fig. 4). When the distributions of the OTUs were compared between 212
day and night, the OTUs were dispatched in three groups. The first group formed by OTUs 213
specific for each period (15:00h: OTUs 93, 119, 167, 202, 225 bp; 4:00h: OTUs 36; 46, 90, 214
125, 132, 156, 177, 197, 212 bp). The second group constituted by OTUs that had developed 215
homogeneously within the 4 mm, independent of the diel cycle (OTUs 117, 129, 199, and 228 216
bp). HaeIII predictive digestion of all pufM sequences available correlated the OTU of 129 bp 217
Page 9 of 27
ScholarOne Support 1-434/817-2040 ext 167
FEMS Microbiology Ecology
123456789101112131415161718192021222324252627282930313233343536373839404142434445464748495051525354555657585960

For Peer Review
10
with the chemotrophic bacteria Erythrobacter litoralis. The third group constituted by OTUs 218
present at both hours, but located in different horizons. Some of them showed important 219
differences in their distribution. OTU of 104 bp was limited to the oxic zone (0-0.4 mm) at 220
15:00h, but at 4:00h it was also found in anoxic zones (1.2-1.3 mm and 3.8-4 mm) even 221
though still abundant in the 0-0.4 mm layer. Interestingly, at 22:00h its zonation was in an 222
intermediate horizon at 0 to 1.6 mm (data not shown). The OTU of 137 bp may be related to 223
the purple non sulfur bacteria Roseospira marina, present in the whole 4 mm of the mat in 224
daytime, was observed in the mid anoxic layer (1.2-1.3 mm) at 4:00h. OTU of 192 bp was 225
present in an oxic zonation between 0.9-1.6 mm at 15:00h whereas it was just confined in the 226
anoxic layer (1.5-1.6 mm) at 4:00h. Whereas OTUs of 114, 148, 187 bp were detected only in 227
anoxic zones during the day, they were also found at the surface or spread throughout the mat 228
at night. 229
Correspondence Factorial Analysis (CFA) obtained from T-RFLP data supported the 230
observation that the distribution of the PAB populations in the mat depended on the diel 231
period (Fig. 5), emphasizing three distinct clusters. Communities from each layer of the 4:00h 232
situation were grouped together, except those from the two layers 0.3-0.4 mm and 1.2-1.3 233
mm. In contrast these PAB communities were close to a second cluster formed by most 234
communities from the mat layers at 15:00h situation. The communities of the deep layer (3.4-235
3.6 mm) of the mat during the day appeared to be independent from the other two groups, 236
mainly influenced by axis 2 showing a variance of 11.82 %. Among the OTUs corresponding 237
to axis 2, the OTU of 199 bp (HaeIII) may be related to the purple sulfur bacteria 238
Halochromatium salexigens and to a purple non sulfur bacteria recently isolated from this 239
marsh (data not shown). 240
The mat of 4:00h is characterized by the presence of OTUs of 114, 129 and 132 bp, part of 241
axis 1, and OTU 148 bp, part of axis 2. The mat of 15:00h is influenced by others OTUs 242
Page 10 of 27
ScholarOne Support 1-434/817-2040 ext 167
FEMS Microbiology Ecology
123456789101112131415161718192021222324252627282930313233343536373839404142434445464748495051525354555657585960
For Peer Review
11
corresponding to the T-RFs of 129, 137, 202, 228 bp and, 117, 199 bp composing axis 1 and 2 243
respectively. These OTUs could not be correlated to known PAB species. 244
245
4. Discussion 246
4.1. Diel migration of Microcoleus chthonoplastes 247
M. chthonoplastes, a typical inhabitant of hypersaline environments [4, 35], was the most 248
abundant cyanobacterium showing large temporal changes. Its vertical distribution varied 249
from a homogenous distribution (at 4:00h and at 7:30h) after a period of darkness (6-9 h) to a 250
specific localization near the surface (at 18:00h) after an approximately 12 h illumination 251
period (Fig. 3). These observations, consistent with the fact that M. chtonoplastes is a gliding 252
bacterium, suggest that M. chtonoplastes has vertical migratory movements during a diel 253
cycle. During the night, M. chthonoplastes was able to maintain its position in the mat 254
probably by its capacity to carry out alternative metabolisms such as fermentation in the dark, 255
or sulfur respiration [36]. During the day (from 9:40h to 18:00h), it was located in different 256
zones indicating probably that this bacterium has a versatile metabolism that is consistent 257
with previous studies [30, 37, 38]. It was not surprising to detect M. chthonoplastes in oxic 258
and anoxic zones since this bacterium is able to perform both oxygenic and anoxygenic 259
photosynthesis and to grow at sulfide concentrations lower than 974 µM [37] never reached in 260
the Camargue mat [29]. This observation could also suggest that two distinct subpopulations 261
with different metabolisms may coexist in an intermediate situation to take advantage of a 262
large range of energy sources. 263
264
4.2. Diel migration of Anoxyphototrophs communities 265
Wieland and co-workers [29] have characterized the biogeochemistry of the Camargue mat 266
during a diel cycle, describing two opposite periods. First, in the afternoon a clearly defined 267
Page 11 of 27
ScholarOne Support 1-434/817-2040 ext 167
FEMS Microbiology Ecology
123456789101112131415161718192021222324252627282930313233343536373839404142434445464748495051525354555657585960

For Peer Review
12
upper oxic zone of 1.5 mm occurred above an anoxic region down to a depth of 4 mm. 268
Second, in the night the oxic zone restricted to the upper 0.5 mm of the mat was penetrated 269
with sulfide while below the mat (0.5 mm-4 mm) became completely anoxic. Changes in the 270
Phototrophic Anoxygenic Bacteria (PAB) communities observed during the diel cycle can be 271
explained by the variation of the physico-chemical gradients. The predominance of specific 272
OTUs at each hour suggested that the type of bacterial metabolism operating may be 273
specifically adapted to the prevailing environmental conditions. It is likely that some of these 274
OTUs correspond to bacterial types with an ability to escape adverse conditions. To further 275
understand their role in the general functioning of the mat it is of great interest to follow 276
specifically their migration. Bacterial migration was also observed with OTUs found in both 277
periods but localized in different horizons (OTUs 104, 114, 137, 148, 187, 192 bp). By 278
vertical migration they reach optimal or tolerable conditions of growth. The migration 279
probably results in a cluster formation in a specific zone of the mat when conditions are 280
adverse as opposed to dispersion when conditions are favorable. 281
282
4.3. Dynamics of the microbial mat during a diel cycle 283
4.3.1. Parameters influencing the PAB distribution 284
A Canonical Correspondence Analysis (CCA; Fig. 6) correlated the data obtained in this 285
study to biogeochemical data measured in parallel by Wieland et al. [29]. CCA revealed the 286
influence of main parameters on the PAB community structure. In the afternoon (15:00h), it 287
was mainly influenced at depth but not at the surface by sulfide. Indeed, in contrast to the 288
early morning (4:00h), oxygen and sulfide gradients were well defined in the afternoon 289
showing a well established oxygen-sulfide interface. Oxygen, pH, and biomass of M.290
chthonoplastes were defined as negative factors in the development of the PAB. M.291
chthonoplastes and other cyanobacteria may influence the PAB distribution both directly by 292
Page 12 of 27
ScholarOne Support 1-434/817-2040 ext 167
FEMS Microbiology Ecology
123456789101112131415161718192021222324252627282930313233343536373839404142434445464748495051525354555657585960

For Peer Review
13
their presence as competitor and indirectly via their metabolic activities. Oxygenic 293
photosynthesis in mat surface at day produces oxygen with a concomitant increase of pH up 294
to 9.4 in the first 1.5 mm [29] producing adverse conditions for PAB. The decrease in oxygen 295
and in pH to 6.8 during night, both of which result from the cessation of photosynthetic 296
activity, favor maintenance of cell integrity of PAB as described for Chromatium sp. [39]. 297
298
4.3.2. Behavior of photosynthetic communities 299
The diel fluctuations of the gradients of electron donors and acceptors at microscale 300
across this microbial mat induces an important change on the distribution of photosynthetic 301
communities. Few reports have described the behaviors of diverse phototrophic bacteria, 302
oxygenic and anoxygenic, in response to changing environmental conditions [18, 30, 40-42,]. 303
Bacteria are able to escape adverse conditions through mobility controlled by chemotatic 304
mechanisms. Although phototaxis is the main mechanism controlling the position of 305
cyanobacteria [18, 30], the overall cyanobacterial distribution across the mat may also depend 306
on others taxis mechanisms such as oxygen or sulfide taxis. Sulfide may strongly influence 307
the distribution of cyanobacteria since it is an inhibitor of oxygenic photosynthesis [41, 42] 308
notwithstanding that cyanobacteria may vary in sulfide tolerance [43]. The Camargue mat is 309
dominated by M. chthonoplastes, a versatile bacterium that is probably divided in two 310
subpopulations. A subpopulation highly sensitive to sulfide was located in a mat area without 311
sulfide and a second subpopulation tolerant to high sulfide concentration (around 200 µM) 312
was observed at two-millimeter depth. 313
The changes of the PAB distribution revealed different behaviors of anoxyphototrophs in 314
response to environmental changes during the diel cycle. First, several migration movements 315
of PAB were observed resulting mainly in aggregate formation, probably in response to 316
adverse conditions. Some OTUs formed aggregates at night (OTUs 137 and 192 bp) 317
Page 13 of 27
ScholarOne Support 1-434/817-2040 ext 167
FEMS Microbiology Ecology
123456789101112131415161718192021222324252627282930313233343536373839404142434445464748495051525354555657585960

For Peer Review
14
migrating from oxic to a strongly anoxic zone of the mat. Recently we described the marine 318
purple non sulfur bacteria Roseospira marina which may be related to OTU of 137 bp as 319
highly motile and unable to respire or ferment in the dark under anaerobic conditions [44]. 320
Thus, the aggregation by this bacterium may be a means by which it maintains its cell 321
integrity. Other OTUs aggregate at daytime (OTUs 114, 148 and 187 bp) but they were 322
always located in the anoxic zone of the mat whatever the time of day. Since oxygen is toxic 323
for obligate anoxyphototrophic bacteria, they control their position by aero-taxis [40]. 324
Therefore, the bacteria corresponding to these OTUs may react by a negative chemotactic 325
response. In contrast, OTU of 104 bp, migrating from a sulfidic anoxic zone to a strongly oxic 326
and non sulfidic zone during the day, exhibited a positive chemotactic response to oxygen. 327
This OTU may correspond to aerobic heterotrophic bacteria containing a non active pufM 328
gene such as Sphingomonas or Erythrobacter genus [45]. Secondly, OTUs were present in the 329
whole mat at any time in a diel cycle (OTUs of 117, 129, 199, and 228 bp), suggesting that 330
these bacteria may have a versatile metabolism capable of adapting to changes in 331
environmental conditions. Located close to the oxygen-sulfide interface, they may be related 332
to microorganisms capable of chemotrophy, or fermentation in dark oxic or microoxic 333
conditions, like some purple non sulfur bacteria, small-sized Chromatiaceae,334
Ectothiorhodospiraceae, or aerobic anoxygenic phototrophic bacteria [46, 47]. 335
336
5. Conclusions 337
Where Camargue microbial mat develops, environmental conditions can change 338
dramatically on a short term [29]. The results presented here demonstrated that the fluctuation 339
of environmental parameters during a diel cycle influenced the vertical stratification of 340
phototrophic communities throughout the microbial mat. Thanks to a set of adaptative 341
responses that include migration and metabolism shifts, Microcoleus chthonoplastes benefit 342
Page 14 of 27
ScholarOne Support 1-434/817-2040 ext 167
FEMS Microbiology Ecology
123456789101112131415161718192021222324252627282930313233343536373839404142434445464748495051525354555657585960

For Peer Review
15
from the diel fluctuation of environmental parameters and therefore was the dominant 343
cyanobacterium of the oxyphototrophic mat community. The distribution of the 344
anoxyphototrophic community, was influenced directly by competition with the high 345
abundance of Microcoleus chthonoplastes and indirectly by the metabolism of M. 346
chthonoplastes. Vertical diel migration of the anoxyphototrophic community in response to 347
variations in sulfide and oxygen concentrations was detectable at a fine depth scaling. Our 348
observation of such migration indicated that aero- and energy taxis were the main 349
mechanisms controlling the bacterial positioning in the mat. Aggregate formation and 350
metabolic switches were the most evident defense of the photosynthetic populations against 351
adverse effects of sulfide and oxygen fluxes during a diel cycle. 352
353
Acknowledgments 354
We acknowledge the financial support by the EC (MATBIOPOL project, grant EVK3-CT-355
1999-00010) and the “Conseil Régional d’Aquitaine”. The authors are grateful to the 356
Company of Salins-du-midi at Salins-de-Giraud for facilitating access to the salterns, 357
sampling and field experiments. AF is partly supported by a doctoral grant from the “Conseil 358
General des Pyrénées Atlantiques”. 359
360
References 361
[1] Esteve, I., Martínez M., Mir J., and Guerrero R. (1992) Typology and structure of 362
microbial mats communities in Spain: A preliminary study. Limnetica 8, 185-195. 363
[2] Guerrero, R., Urmeneta J., and Rampone G. (1993) Distribution of types of microbial mats 364
at the Ebro Delta, Spain. Biosystems 31, 135-144. 365
[3] Wieland, A., Kühl M., Mcgowan L., Fourçans A., Duran R., Caumette P., Solé A., Diestra 366
E., Esteve I., García De Oteyza T., Grimalt J.O., and Herbert R.A. (2003) Microbial mats 367
Page 15 of 27
ScholarOne Support 1-434/817-2040 ext 167
FEMS Microbiology Ecology
123456789101112131415161718192021222324252627282930313233343536373839404142434445464748495051525354555657585960
For Peer Review
16
on the Orkney islands revisited: microenvironment and microbial community composition. 368
Microb. Ecol. 46, 371-390. 369
[4] Caumette, P., Matheron R., Raymond N., and Relexans J.C. (1994) Microbial mats in the 370
hypersaline ponds of Mediterranean salterns (Salins-de-Giraud, France). FEMS Microbiol. 371
Ecol. 13, 273-286. 372
[5] Fourçans, A., García de Oteyza T., Wieland A., Solé A., Diestra E., van Bleijswijk J., 373
Grimalt J.O., Kühl M., Esteve I., Muyzer G., Caumette P., and Duran R. (2004) 374
Characterization of functional bacterial groups in a hypersaline microbial mat community 375
(Salins-de-Giraud, Camargue, France). FEMS Microbiol. Ecol. 51, 55-70. 376
[6] Giani, D., Seeler J., Giani L., and Krumbein W.E. (1989) Microbial mats and 377
physicochemistry in a saltern in the Bretagne (France) and in a laboratory scale saltern 378
model. FEMS Microbiol. Ecol. 62, 151-162. 379
[7] Ferris, M.J., Muyzer G., and Ward D.M. (1996) Denaturing gradient gel electrophoresis 380
profiles of 16S rRNA-defined populations inhabiting a hot spring microbial mat 381
community. Appl. Environ. Microbiol. 62, 340-346. 382
[8] D'Amelio, E.D., Cohen Y., and Des Marais D.J. (1987) Association of a new type of 383
gliding, filamentous, purple phototrophic bacterium inside bundles of Microcoleus 384
chthonoplastes in hypersaline cyanobacterial mats. Arch. Microbiol. 147, 213-220. 385
[9] Stal, L.J. (1994) Microbial mats in coastal environments, p. 21-32. In L. J. Stal, and P. 386
Caumette (eds), Microbial Mats. ed. Berlin Heidelberg: Springer-Verlag. 387
[10] Stal, L.J., and Krumbein W.E. (1985) Isolation and characterization of cyanobacteria 388
from a marine microbial mat. Bot. Mar. 28, 351-365. 389
[11] García-Pichel, F., Prufert-Bebout L., and Muyzer G. (1996) Phenotypic and phylogenetic 390
analysis show Microcoleus chthonoplastes to be a cosmopolitan cyanobacterium. Appl. 391
Environ. Microbiol. 62, 3284-3291. 392
Page 16 of 27
ScholarOne Support 1-434/817-2040 ext 167
FEMS Microbiology Ecology
123456789101112131415161718192021222324252627282930313233343536373839404142434445464748495051525354555657585960
For Peer Review
17
[12] Campbell, S.E. (1979) Soil stabilization by a prokaryotic desert crust: implications for 393
Precambrian land biota. Orig. Life 9, 335-348. 394
[13] Pfennig, N. (1975) The phototrophic bacteria and their role in the sulfur cycle. Plant and 395
Soil 43, 1-16. 396
[14] Revsbech, N.P., Jørgensen B.B., Blackburn T.H., and Cohen Y. (1983) Microelectrode 397
studies of the photosynthesis and O2, H2S and pH profiles of a microbial mat. Limnol. 398
Oceanogr. 28, 1062-1074. 399
[15] van Gemerden, H. (1993) Microbial mats: A joint venture. Mar. Geol. 113, 3-25. 400
[16] Alexandre, G., Greer-Phillips S., and Zhulin I.B. (2004) Ecological role of energy taxis 401
in microorganisms. FEMS Microbiol. Rev. 28, 113-126. 402
[17] Taylor, B.L., Zhulin I.B., and Johnson M.S. (1999) Aerotaxis and other energy-sensing 403
behavior in bacteria. Annu. Rev. Microbiol. 53, 103-128. 404
[18] García-Pichel, F., Mechling M., and Castenholz R.W. (1994) Diel migrations of 405
microorganisms within a benthic, hypersaline mat community. Appl. Environ. Microbiol. 406
60, 1500-1511. 407
[19] Nelson, D.C., Jørgensen B.B., and Revsbech N.P. (1986) Growth pattern and yield of a 408
chemoautotrophic Beggiatoa sp. in oxygen-sulfide microgradients. Appl. Environ. 409
Microbiol. 52, 225-233. 410
[20] Thar, R., and Kühl M. (2001) Motility of Marichromatium gracile in response to light, 411
oxygen, and sulfide. Appl. Environ. Microbiol. 67, 5410-5419. 412
[21] Krekeler, D., Teske A., and Cypionka H. (1998) Strategies of sulfate-reducing bacteria to 413
escape oxygen stress in a cyanobacterial mat. FEMS Microbiol. Ecol. 25, 89-96. 414
[22] Teske, A., Ramsing N.B., Habicht K., Fukui M., Kuver J., Jørgensen B.B., and Cohen Y. 415
(1998) Sulfate-reducing bacteria and their activities in cyanobacterial mats of solar lake 416
(Sinai, Egypt). Appl. Environ. Microbiol. 64, 2943-2951. 417
Page 17 of 27
ScholarOne Support 1-434/817-2040 ext 167
FEMS Microbiology Ecology
123456789101112131415161718192021222324252627282930313233343536373839404142434445464748495051525354555657585960

For Peer Review
18
[23] Bebout, B., and Garcia-Pichel F. (1995) UV B-induced vertical migrations of 418
cyanobacteria in a microbial mat. Appl. Environ. Microbiol. 61, 4215-4222. 419
[24] Nelson, D.C., Revsbech N.P., and Jørgensen B.B. (1986) Microoxic-anoxic niche of 420
Beggiatoa spp.: microelectrode survey of marine and freshwater strains. Appl. Environ. 421
Microbiol. 52, 161-168. 422
[25] Richardson, L.L. (1996) Horizontal and vertical migration patterns of Phormidium 423
corallyticum and Beggiatoa spp. associated with black-band disease of corals. Microb. 424
Ecol. 32, 323-335. 425
[26] Richardson, L.L., and Castenholz R.W. (1987) Diel vertical movements of the 426
cyanobacterium Oscillatoria terebriformis in a sulfide-rich microbial mat. Appl. Environ. 427
Microbiol. 53, 2142-2150. 428
[27] Whale, G.F., and Walsby A.E. (1984) Motility of the cyanobacterium Microcoleus 429
chthonoplastes in mud. Phycol. J. 19, 117-123. 430
[28] López-Cortés, A., García-Pichel F., Nübel U., and Vázquez-Juárez R. (2001) 431
Cyanobacterial diversity in extrem environments in Baja California, Mexico: a polyphasic 432
study. Int. Microbiol. 4, 227-236. 433
[29] Wieland, A., Zopfi J., Benthien M., and Kühl M. (2005) Biogeochemistry of an iron-rich 434
hypersaline microbial mat (Camargue, France). Microb. Ecol. 49, 34-49. 435
[30] Solé, A., Gaju N., and Esteve I. (2003) The biomass dynamics of cyanobacteria in an 436
annual cycle determined by confocal laser scanning microscopy. Scanning 25, 1-7. 437
[31] Solé, A., Gaju N., Mendez-Alvarez S., and Esteve I. (2001) Confocal laser scanning 438
microscopy as a tool to determine cyanobacteria biomass in microbial mats. J. Microscopy 439
204, 258-261. 440
Page 18 of 27
ScholarOne Support 1-434/817-2040 ext 167
FEMS Microbiology Ecology
123456789101112131415161718192021222324252627282930313233343536373839404142434445464748495051525354555657585960

For Peer Review
19
[32] Achenbach, L.A., Carey J., and Madigan M.T. (2001) Photosynthetic and phylogenetic 441
primers for detection of anoxygenic phototrophs in natural environments. Appl. Environ. 442
Microbiol. 67, 2922-2926. 443
[33] Gauch, J.H.G. (1982) Multivariate Analysis in Community Ecology, New York, p. 298. 444
[34] Kovach, W. L. (1999) MVSP - a Multivariate Statistical Package for Windows. In. 445
Wales U.K.: Kovack Computing Services. 446
[35] Abed, R.M., Garcia-Pichel F., and Hernández-Mariné M. (2002) Polyphasic 447
characterization of benthic, moderately halophilic, moderately thermophilic cyanobacteria 448
with very thin trichomes and the proposal of Halomicronema excentricum gen. nov., sp. 449
nov. Arch. Microbiol. 177, 361-370. 450
[36] Moezelaar, R., Bijvank S.M., and Stal L. (1996) Fermentation and sulfur reduction in the 451
mat-building cyanobacterium Microcoleus chthonoplastes. Appl. Environ. Microbiol. 62, 452
1752-1758. 453
[37] De Wit, R., and Van Gemerden H. (1987) Oxidation of sulfide to thiosulfate by 454
Microcoleus chthonoplastes. FEMS Microbiol. Lett. 45, 7-13. 455
[38] Decho, A.W. (1990) Microbial exopolymer secretions in ocean environments: their 456
role(s) in food webs and marine process. Oceanogr. Mar. Biol. Ann. Rev. 28, 73-153. 457
[39]van Gemerden, H., and Beeftink H.H. (1981) Coexistence of Chlorobium and 458
Chromatium in a sulfide-limited continuous culture. Arch. Microbiol. 129, 32-34. 459
[40] Armitage, J.P., Keighley P., and Evans M.C.W. (1979) Chemotaxis in photosynthetic 460
bacteria. FEMS Microbiol. Lett. 6, 99-102. 461
[41] Miller, S.R., and Bebout B.M. (2004) Variation in sulfide tolerance of photosystem II in 462
phylogenetically diverse cyanobacteria from sulfidic abitats. Appl. Environ. Microbiol. 70, 463
736-744. 464
Page 19 of 27
ScholarOne Support 1-434/817-2040 ext 167
FEMS Microbiology Ecology
123456789101112131415161718192021222324252627282930313233343536373839404142434445464748495051525354555657585960

For Peer Review
20
[42] Oren, A., Padan E., and Malkin S. (1979) Sulfide inhibition of Photosystem II in 465
cyanobacteria (blue-green algae) and tobacco chloroplasts. Biochimica et Biophysica Acta 466
(BBA) - Bioenergetics 546, 270-279. 467
[43] Cohen, Y., Jørgensen B.B., Padan E., and Shilo M. (1986) Adaptation to hydrogen 468
sulfide of oxygenic and anoxygenic photosynthesis among cyanobacteria. Appl. Environ. 469
Microbiol. 51, 398-407. 470
[44] Guyoneaud, R., Moune S., Eatock C., Bothorel V., Hirschler-Rea A., Willison J., Duran 471
R., Liesack W., Herbert R., Matheron R., and Caumette P. (2002) Characterization of three 472
spiral-shaped purple nonsulfur bacteria isolated from coastal lagoon sediments, saline 473
sulfur springs, and microbial mats: emended description of the genus Roseospira and 474
description of Roseospira marina sp. nov., Roseospira navarrensis sp. nov., and 475
Roseospira thiosulfatophila sp. nov. Arch. Microbiol. 178, 315-324. 476
[45] Béjà, O., Suzuki M.T., Heidelberg J.F., Nelson W.C., Preston C.M., Hamada T., Eisen 477
J.A., Fraser C.M., and DeLong E. F. (2002) Unsuspected diversity among marine aerobic 478
anoxygenic phototrophs. Nature 415, 630–633. 479
[46] Pfennig, N., and Truper H.G. (1983) Taxonomy of phototrophic green and purple 480
bacteria: a review. Ann Microbiol (Paris) 134B, 9-20. 481
[47] Yurkov, V.V., and Beatty J.T. (1998) Aerobic anoxygenic phototrophic bacteria. 482
Microbiol. Mol. Biol. Rev. 62, 695-724. 483
484
Page 20 of 27
ScholarOne Support 1-434/817-2040 ext 167
FEMS Microbiology Ecology
123456789101112131415161718192021222324252627282930313233343536373839404142434445464748495051525354555657585960

For Peer Review
21
Figures 484
Fig. 1. Relative Abundance in depth of the different cyanobacteria characterized by CLSM 485
during the diel cycle in Camargue mat. The relative abundance is expressed in %. 486
487
Fig. 2. Confocal image of Microcoleus chthonoplastes forming bundles of filaments. Scale 488
bar = 5 µm. 489
490
Fig. 3. Biomass profiles of Microcoleus chthonoplastes during the diel cycle. The biomass is 491
expressed in mgC/cm3 sediment. 492
493
Fig. 4. Relative abundance of T-RF for each horizon of the mat at 4:00h and 15:00h. Data 494
were obtained from 5’ end T-RFLP profiles by HaeIII digestion of pufM amplified fragments. 495
496
Fig. 5. Correspondence Factorial Analysis (CFA) of the purple anoxygenic bacterial 497
communities (PAB) of each layer of the mat at 15:00h (closed symbol) and 4:00h (open 498
symbol). Each community was represented by a 5’end T-RFLP pattern corresponding to the 499
HaeIII digest of the pufM encoding gene. 500
501
Fig. 6. Canonical Correspondence Analysis (CCA) between the PAB communities of each 502
layer of the mat at 15:00h (closed symbol) and 4:00h (open symbol), and environmental 503
variables measured at these two hours: biomass of Microcoleus chthonoplastes (Biomass), 504
pH, and concentration of O2, H2S and Stot (sulfide total).505
Page 21 of 27
ScholarOne Support 1-434/817-2040 ext 167
FEMS Microbiology Ecology
123456789101112131415161718192021222324252627282930313233343536373839404142434445464748495051525354555657585960

For Peer Review
22
22:00 h (11/6/01)0
0.250.5
0.751
1.251.5
1.752
2.252.5
2.753
3.253.5
3.754
0 20 40 60 80 100
00.250.5
0.751
1.251.5
1.752
2.252.5
2.753
3.253.5
3.754
0 20 40 60 80 100
00.250.5
0.751
1.251.5
1.752
2.252.5
2.753
3.253.5
3.754
Microcoleus chthonoplastesHalomicronema excentricumpicocyanobacterium
Gloeocapsa-groupPleurocapsa-groupPseudanabaena sp.
Relative Abundance (%)
9:40 h (11/6/01)
7:30 h (12/6/01)4:00 h (12/6/01)
18:00 h (11/6/01)
15:00 h (11/6/01)D
epth
(mm
)
506 507
508
509
510
511
512
513
514
515
Fig. 1 516
517
Page 22 of 27
ScholarOne Support 1-434/817-2040 ext 167
FEMS Microbiology Ecology
123456789101112131415161718192021222324252627282930313233343536373839404142434445464748495051525354555657585960
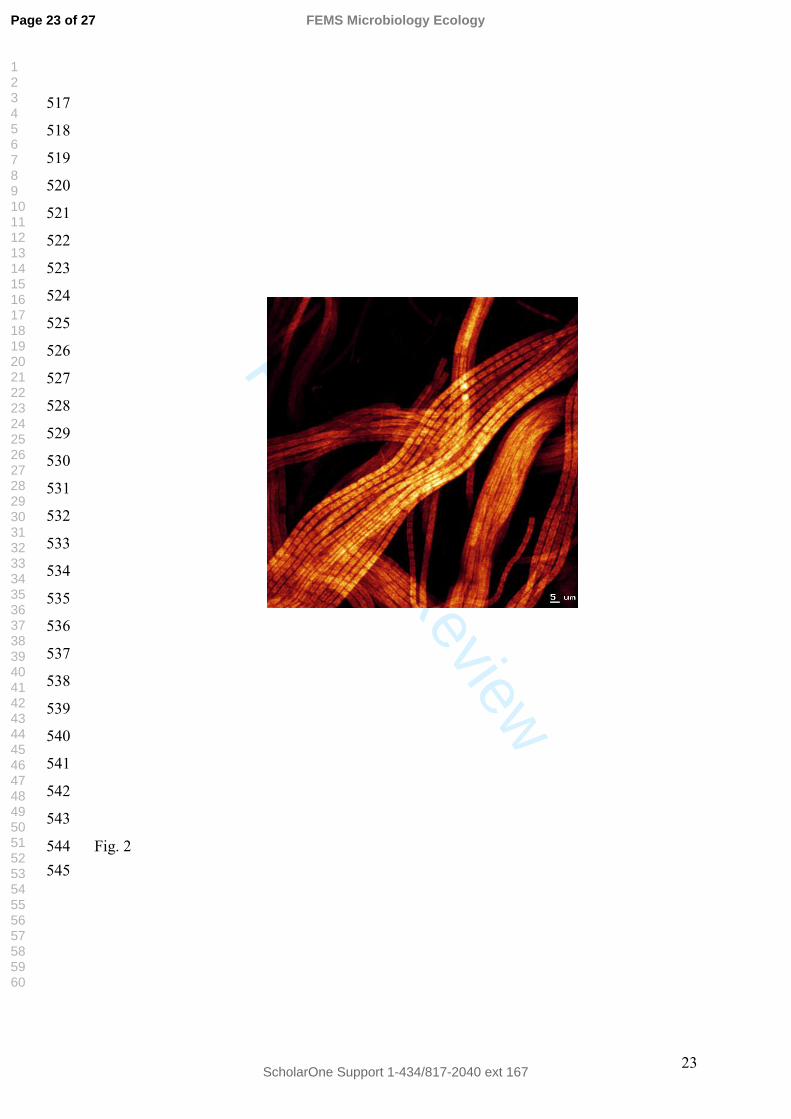
For Peer Review
23
517
518
519
520
521
522
523
524
525
526
527
528
529
530
531
532
533
534
535
536
537
538
539
540
541
542
543
Fig. 2 544545
Page 23 of 27
ScholarOne Support 1-434/817-2040 ext 167
FEMS Microbiology Ecology
123456789101112131415161718192021222324252627282930313233343536373839404142434445464748495051525354555657585960
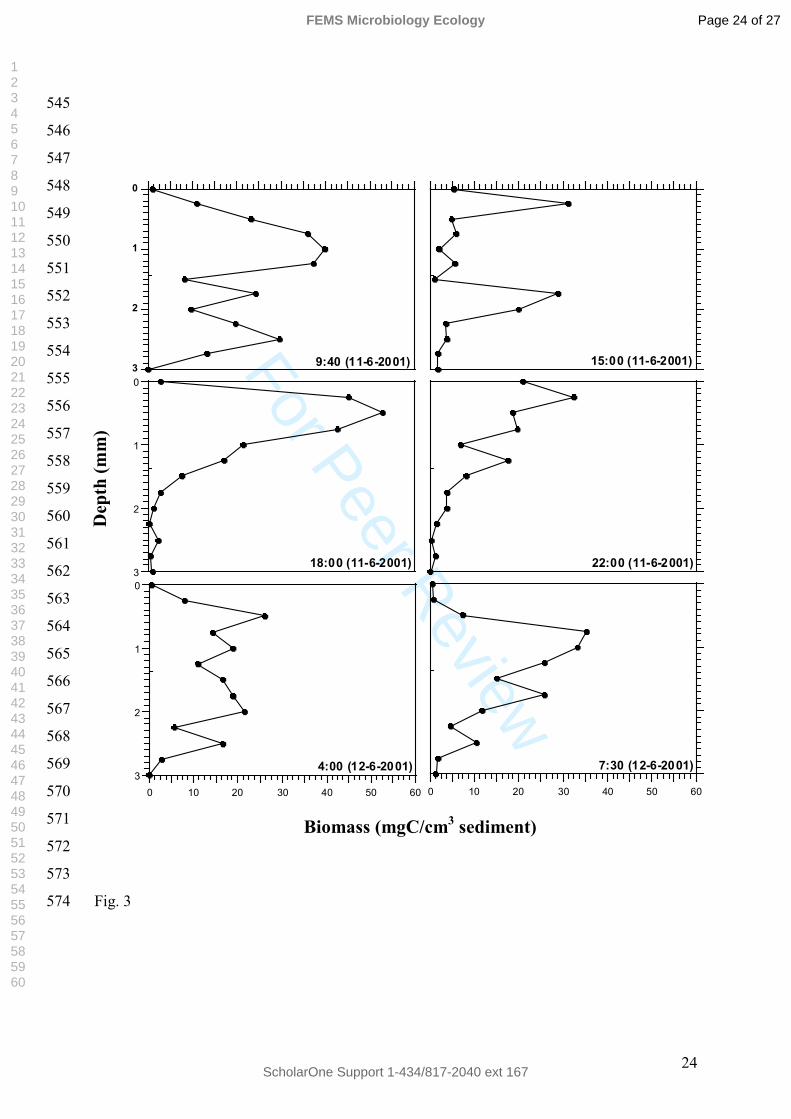
For Peer Review
24
545
546
547
548
549
550
551
552
553
554
555
556
557
558
559
560
561
562
563
564
565
566
567
568
569
570
571
572
573
Fig. 3 574
0
1
2
3 9:40 (11-6-2001) 15:00 (11-6-2001)0
1
2
318:00 (11-6-2001) 22:00 (11-6-2001)
0 10 20 30 40 50 60
0
1
2
34:00 (12-6-2001)
0 10 20 30 40 50 60
7:30 (12-6-2001)
Dep
th(m
m)
Biomass (mgC/cm3 sediment)
Page 24 of 27
ScholarOne Support 1-434/817-2040 ext 167
FEMS Microbiology Ecology
123456789101112131415161718192021222324252627282930313233343536373839404142434445464748495051525354555657585960

For Peer ReviewFig. 4
36 46 90 93 104
114
117
119
125
129
132
137
148
156
167
177
187
192
197
199
202
212
225
228
15 H
0 – 0.10.3 – 0.40.6 – 0.7
0.9 – 11.2 – 1.31.5 – 1.61.8 – 1.9
2 – 2.22.6 – 2.83.4 – 3.6
3.8 – 4
Dep
th (m
m)
4 H
Dep
th (m
m)
0.6 – 0.70.9 – 1
1.2 – 1.31.5 – 1.61.8 – 1.9
2 – 2.22.6 – 2.83.4 – 3.6
3.8 – 4
0 – 0.1
0.3 – 0.4
< 5%
5 – 10 %
10 – 20 %
20 – 30 %
30 – 40 %
40 – 50 %
50 – 60 %
60 – 70 %
> 70 %
T-RF (bp)
Relativeabundances
Page 25 of 27
ScholarOne Support 1-434/817-2040 ext 167
FEMS Microbiology Ecology
123456789101112131415161718192021222324252627282930313233343536373839404142434445464748495051525354555657585960
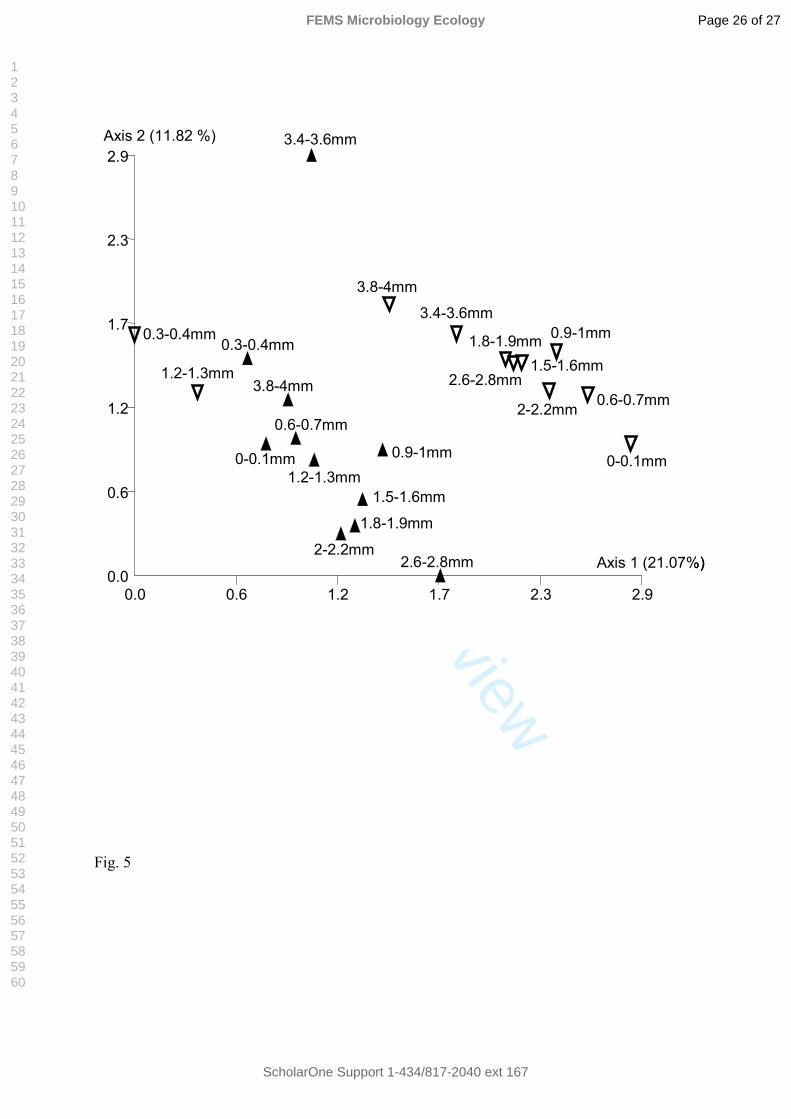
For Peer Review
Axis 2 (11.82 %)
Axis 1 (21.07%)
0-0.1mm
0.3-0.4mm
0.6-0.7mm
0.9-1mm1.2-1.3mm
1.5-1.6mm
1.8-1.9mm
2-2.2mm2.6-2.8mm
3.4-3.6mm
3.8-4mm
0-0.1mm
0.3-0.4mm
0.6-0.7mm
0.9-1mm
1.2-1.3mm 1.5-1.6mm1.8-1.9mm
2-2.2mm
2.6-2.8mm
3.4-3.6mm
3.8-4mm
0.0
0.6
1.2
1.7
2.3
2.9
0.0 0.6 1.2 1.7 2.3 2.9
Axis 2 (11.82 %)
Axis 1 (21.07%)
0-0.1mm
0.3-0.4mm
0.6-0.7mm
0.9-1mm1.2-1.3mm
1.5-1.6mm
1.8-1.9mm
2-2.2mm2.6-2.8mm
3.4-3.6mm
3.8-4mm
0-0.1mm
0.3-0.4mm
0.6-0.7mm
0.9-1mm
1.2-1.3mm 1.5-1.6mm1.8-1.9mm
2-2.2mm
2.6-2.8mm
3.4-3.6mm
3.8-4mm
0.0
0.6
1.2
1.7
2.3
2.9
0.0 0.6 1.2 1.7 2.3 2.9
Fig. 5
Page 26 of 27
ScholarOne Support 1-434/817-2040 ext 167
FEMS Microbiology Ecology
123456789101112131415161718192021222324252627282930313233343536373839404142434445464748495051525354555657585960

For Peer Review
15H4H
Axis 2 (6.72 %)
Axis 1 (18.22 %)
0
0.25
0.75 1
1.25
1.5
1.752
2.25
2.75
0
0.25
0.751
1.251.5
1.752
-0.4
-0.8
-1.2
-1.6
-1.9
0.4
0.8
1.2
1.9
-0.4-0.8-1.2-1.6-1.9 0.4 0.8 1.2 1.6 1.9
O2
H2SStot
pH
Biomass
Vector scaling: 4.65
15H4H
Axis 2 (6.72 %)
Axis 1 (18.22 %)
0-0.1 mm
0.3-0.4 mm
0.6-0.7 mm 0.9-1 mm
1.2-1.3 mm
1.5-1.6 mm
1.8-1.9 mm2-2.2 mm
2.6-2.8 mm
3.4-3.6 mm
0-O.1 mm
0.3-0.4 mm
0.6-0.7 mm
0.9-1 mm
1.2-1.3 mm1.5-1.6 mm
1.8-1.9 mm
2-2.2 mm
-0.4
-0.8
-1.2
-1.6
-1.9
0.4
0.8
1.2
1.9
-0.4-0.8-1.2-1.6-1.9 0.4 0.8 1.2 1.6 1.9
O2
H2SStot
pH
Biomass
Vector scaling: 4.65
Fig. 6
Page 27 of 27
ScholarOne Support 1-434/817-2040 ext 167
FEMS Microbiology Ecology
123456789101112131415161718192021222324252627282930313233343536373839404142434445464748495051525354555657585960