INMUNOTERAPIA: NUEVO PARADIGMA EN LOS TUMORES DE CABEZA Y...
28
INMUNOTERAPIA: NUEVO PARADIGMA EN LOS TUMORES DE CABEZA Y CUELLO Dra. Lara Iglesias H.U.12 Octubre
Transcript of INMUNOTERAPIA: NUEVO PARADIGMA EN LOS TUMORES DE CABEZA Y...
INMUNOTERAPIA: NUEVO PARADIGMA EN LOS
TUMORES DE CABEZA Y CUELLO Dra. Lara Iglesias H.U.12 Octubre
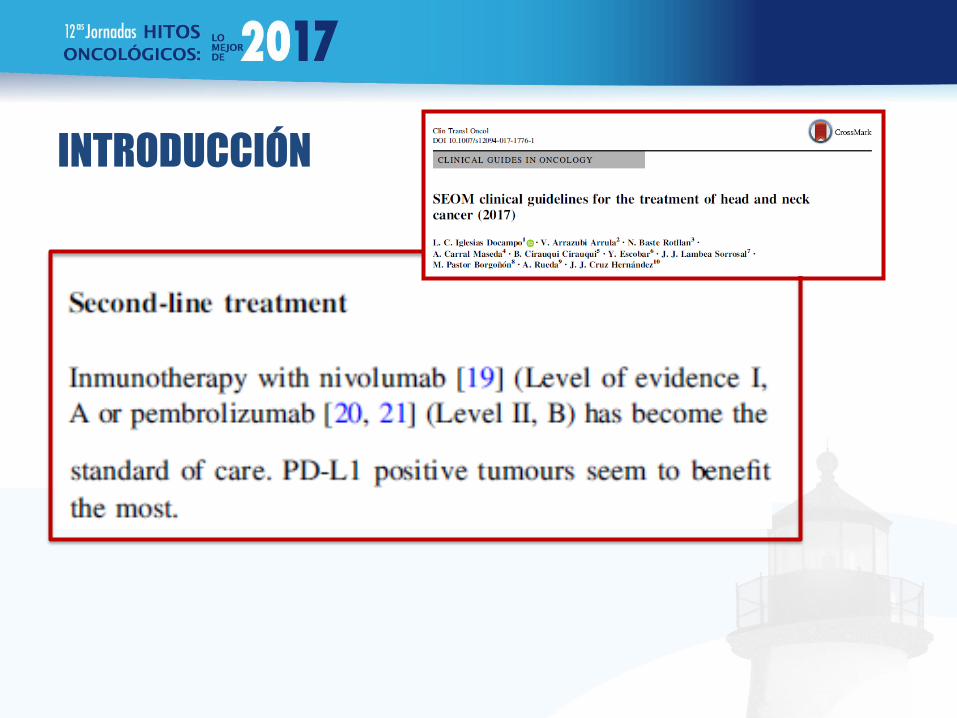
INTRODUCCIÓN
INFORME SEOM DE EVALUACIÓN DE FÁRMACOS: NIVOLUMAB EN CÁNCER EPIDERMOIDE DE CABEZA Y CUELLO
INTRODUCCIÓN

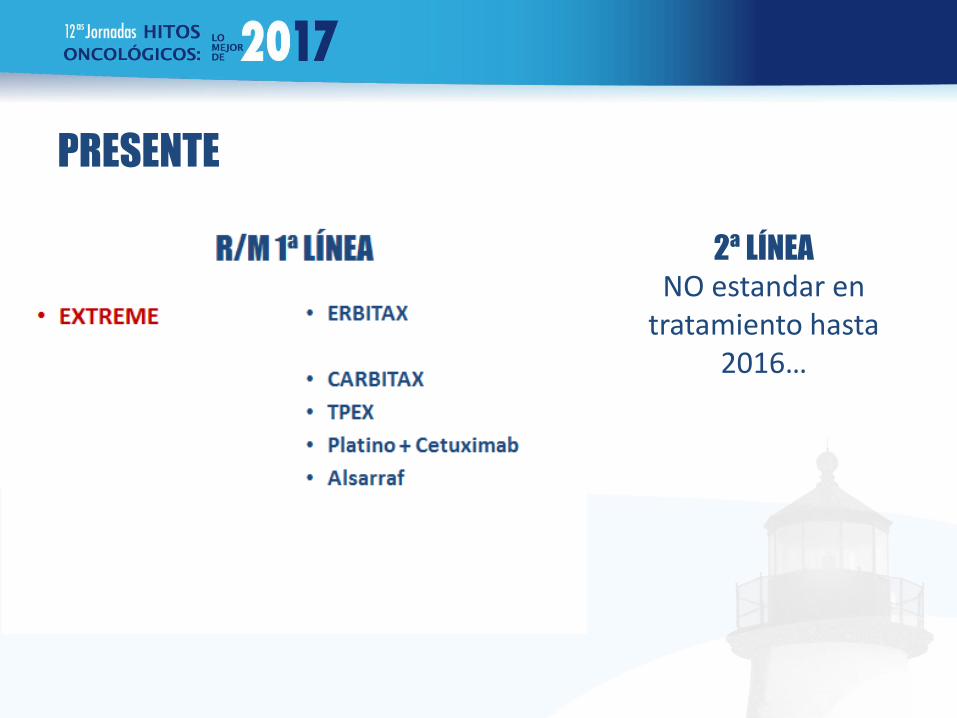
PRESENTE
PRESENTE
2ª LÍNEA
NO estandar en tratamiento hasta
2016…
PRESENTE
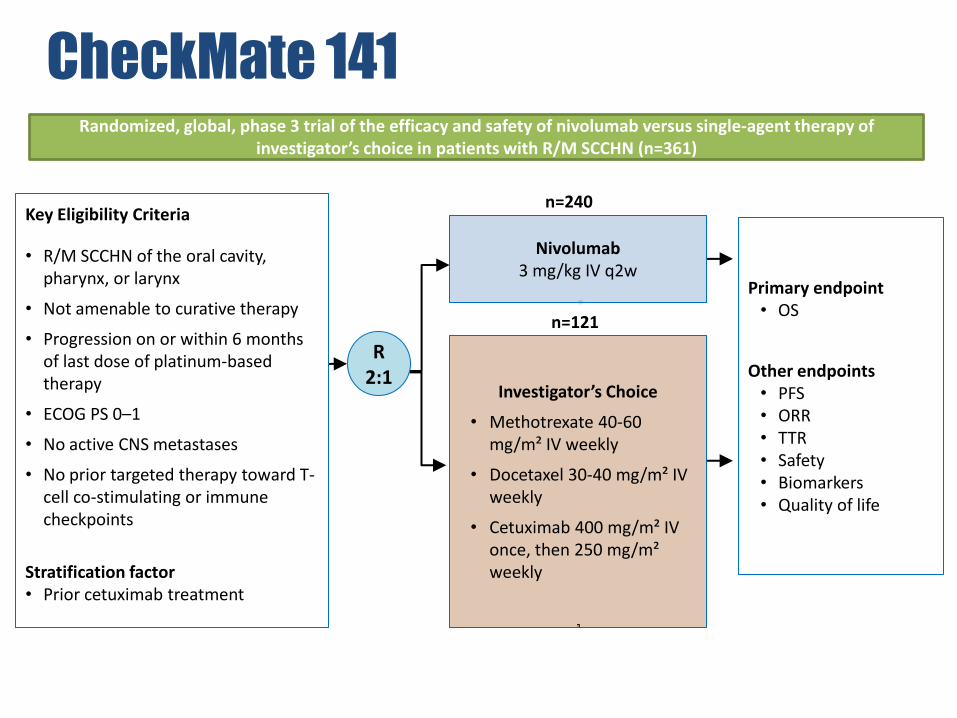
CheckMate 141
R 2:1
Nivolumab 3 mg/kg IV q2w
Investigator’s Choice
• Methotrexate 40-60 mg/m² IV weekly
• Docetaxel 30-40 mg/m² IV weekly
• Cetuximab 400 mg/m² IV once, then 250 mg/m² weekly
Key Eligibility Criteria
• R/M SCCHN of the oral cavity, pharynx, or larynx
• Not amenable to curative therapy
• Progression on or within 6 months of last dose of platinum-based therapy
• ECOG PS 0–1
• No active CNS metastases
• No prior targeted therapy toward T-cell co-stimulating or immune checkpoints
Stratification factor • Prior cetuximab treatment
Primary endpoint • OS
Other endpoints • PFS • ORR • TTR • Safety • Biomarkers • Quality of life
n=240
n=121
Randomized, global, phase 3 trial of the efficacy and safety of nivolumab versus single-agent therapy of investigator’s choice in patients with R/M SCCHN (n=361)
See notes for footnotes and abbreviations
PRESENTE
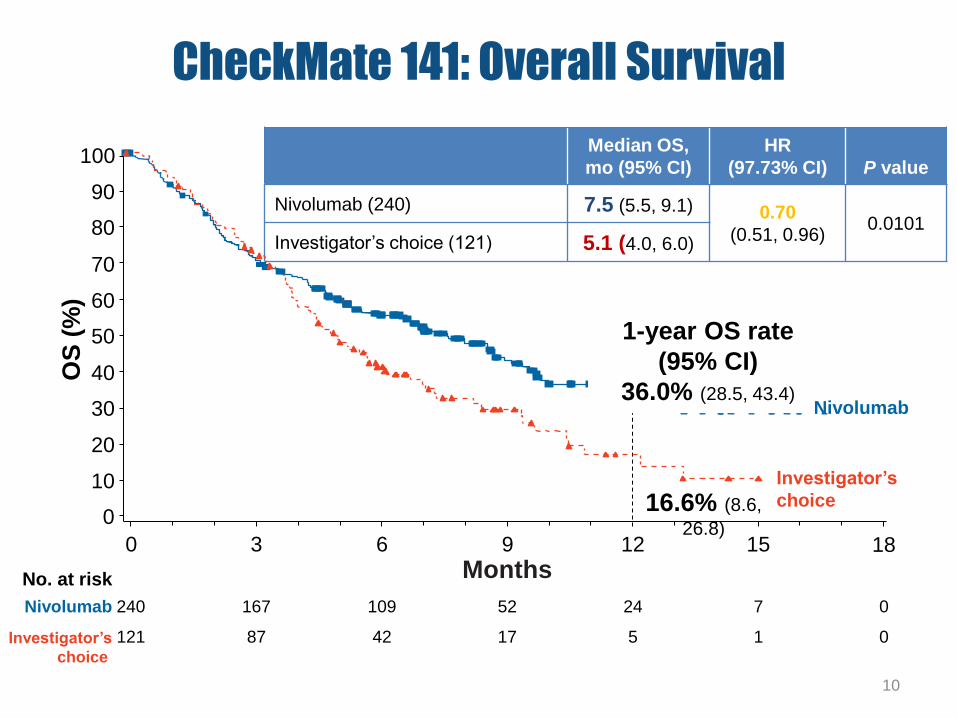
CheckMate 141: Overall Survival
10
Median OS,
mo (95% CI)
HR
(97.73% CI)
P value
Nivolumab (240) 7.5 (5.5, 9.1) 0.70
(0.51, 0.96) 0.0101
Investigator’s choice (121) 5.1 (4.0, 6.0)
0 3 6 9 12 15 18
Months
Nivolumab 240 167 109 52 24 7 0
Investigator’s
choice
121 87 42 17 5 1
No. at risk
0
0
10
20
30
40
50
60
70
80
90
100
OS
(%
)
1-year OS rate
(95% CI)
36.0% (28.5, 43.4)
16.6% (8.6,
26.8)
Nivolumab
Investigator’s
choice
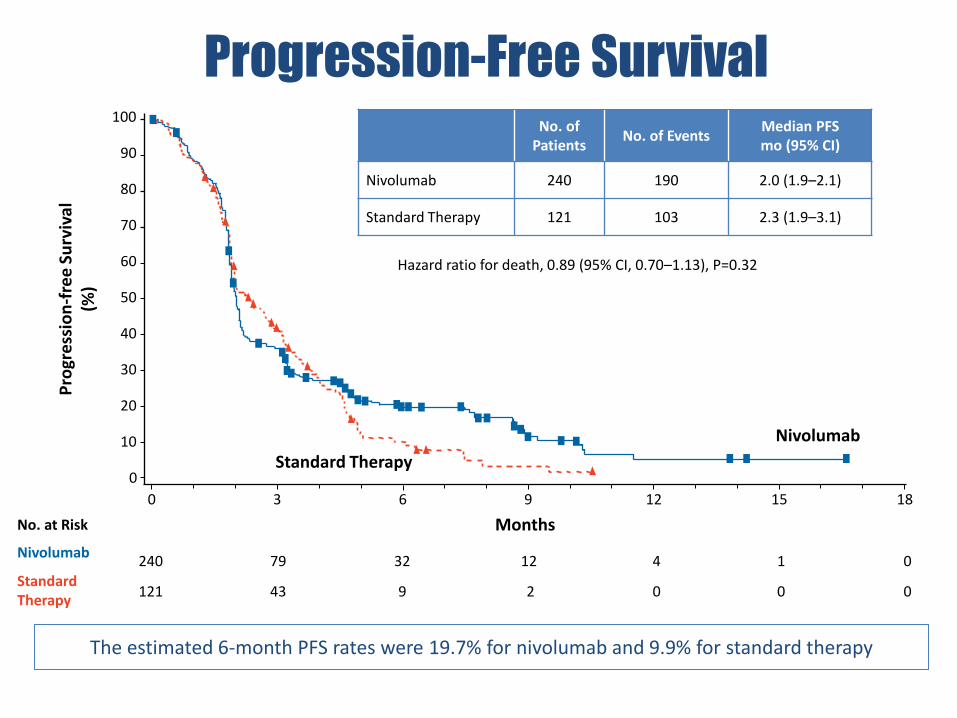
The estimated 6-month PFS rates were 19.7% for nivolumab and 9.9% for standard therapy
Progression-Free Survival
0 3 6 9 12 15 18
Months
Nivolumab 240 79 32 12 4 1 0
Standard Therapy
121 43 9 2 0 0
No. at Risk
0
0
10
20
30
40
50
60
70
80
90
100
Pro
gre
ssio
n-f
ree
Su
rviv
al
(%)
No. of Patients
No. of Events Median PFS mo (95% CI)
Nivolumab 240 190 2.0 (1.9–2.1)
Standard Therapy 121 103 2.3 (1.9–3.1)
Hazard ratio for death, 0.89 (95% CI, 0.70–1.13), P=0.32
Nivolumab
Standard Therapy
See notes for abbreviations
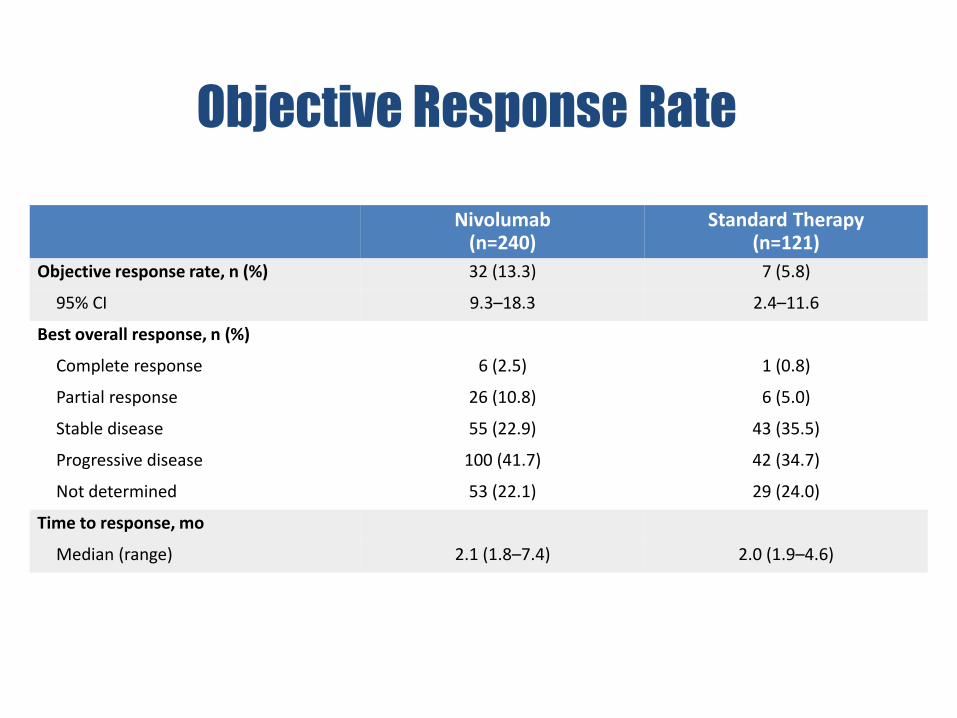
Objective Response Rate
Nivolumab (n=240)
Standard Therapy (n=121)
Objective response rate, n (%) 32 (13.3) 7 (5.8)
95% CI 9.3–18.3 2.4–11.6
Best overall response, n (%)
Complete response 6 (2.5) 1 (0.8)
Partial response 26 (10.8) 6 (5.0)
Stable disease 55 (22.9) 43 (35.5)
Progressive disease 100 (41.7) 42 (34.7)
Not determined 53 (22.1) 29 (24.0)
Time to response, mo
Median (range) 2.1 (1.8–7.4) 2.0 (1.9–4.6)
See notes for reference and abbreviations
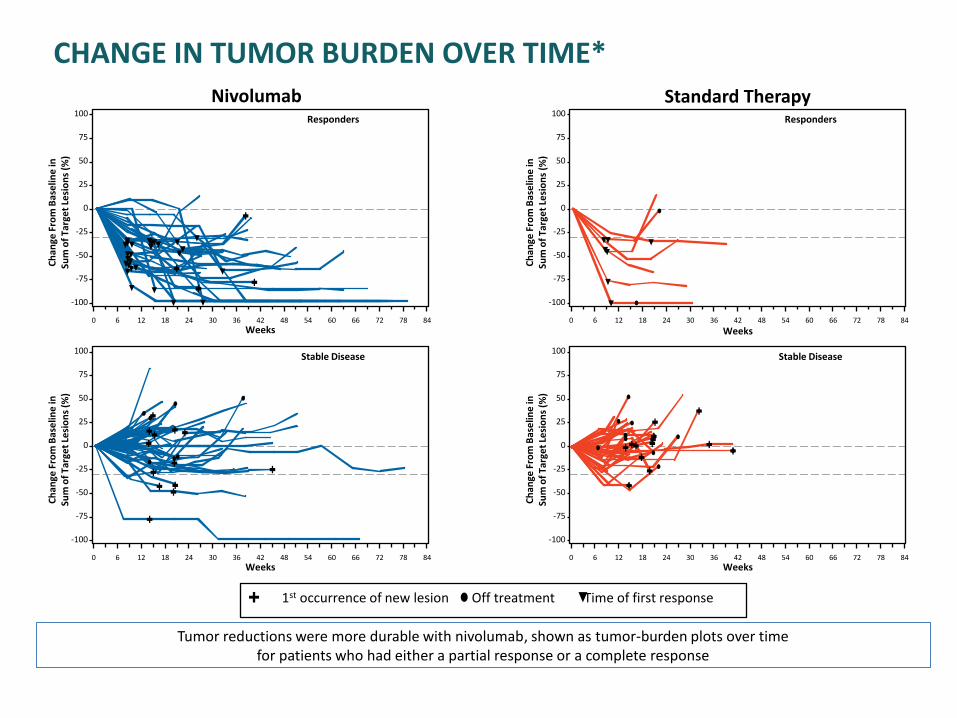
CHANGE IN TUMOR BURDEN OVER TIME*
100
Ch
ange
Fro
m B
ase
line
in
Sum
of
Targ
et
Lesi
on
s (%
)
75
50
25
0
-25
-50
-75
-100
Weeks
Responders
0 6 12 18 24 30 36 42 48 54 60 66 72 78 84
100
Ch
ange
Fro
m B
ase
line
in
Sum
of
Targ
et
Lesi
on
s (%
)
75
50
25
0
-25
-50
-75
-100
Weeks
Stable Disease
0 6 12 18 24 30 36 42 48 54 60 66 72 78 84
100
Ch
ange
Fro
m B
ase
line
in
Sum
of
Targ
et
Lesi
on
s (%
)
75
50
25
0
-25
-50
-75
-100
Weeks
Responders
0 6 12 18 24 30 36 42 48 54 60 66 72 78 84
100
Ch
ange
Fro
m B
ase
line
in
Sum
of
Targ
et
Lesi
on
s (%
)
75
50
25
0
-25
-50
-75
-100
Weeks
Stable Disease
0 6 12 18 24 30 36 42 48 54 60 66 72 78 84
Nivolumab Standard Therapy
1st occurrence of new lesion Off treatment Time of first response
Tumor reductions were more durable with nivolumab, shown as tumor-burden plots over time for patients who had either a partial response or a complete response
See notes for footnotes
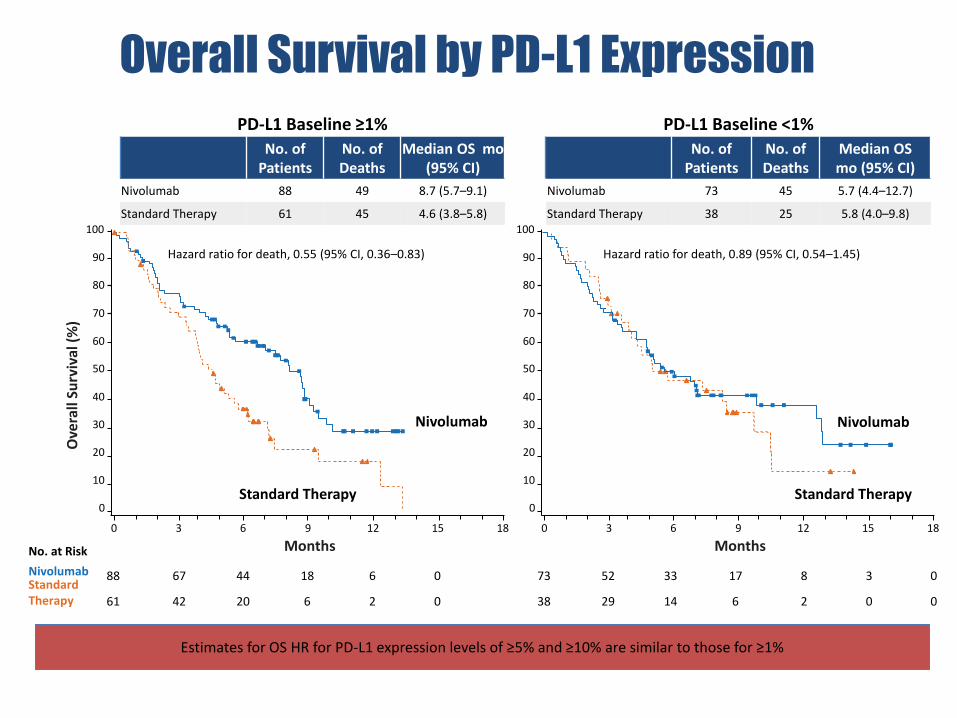
PD-L1 Baseline ≥1%
No. of Patients
No. of Deaths
Median OS mo (95% CI)
Nivolumab 88 49 8.7 (5.7–9.1)
Standard Therapy 61 45 4.6 (3.8–5.8)
88 67 44 18 6 0
61 42 20 6 2 0
73 52 33 17 8 3 0
38 29 14 6 2 0 0
Nivolumab
Standard Therapy
Nivolumab Standard Therapy
No. at Risk
Ove
rall
Surv
ival
(%
)
Nivolumab
Standard Therapy
Months 0 3 6 9 12 15 18
0
10
20
30
40
50
60
70
80
90
100
Months 0 3 6 9 12 15 18
0
10
20
30
40
50
60
70
80
90
100
Overall Survival by PD-L1 Expression
Estimates for OS HR for PD-L1 expression levels of ≥5% and ≥10% are similar to those for ≥1%
PD-L1 Baseline <1%
No. of Patients
No. of Deaths
Median OS mo (95% CI)
Nivolumab 73 45 5.7 (4.4–12.7)
Standard Therapy 38 25 5.8 (4.0–9.8)
Hazard ratio for death, 0.55 (95% CI, 0.36–0.83) Hazard ratio for death, 0.89 (95% CI, 0.54–1.45)
See notes for abbreviations
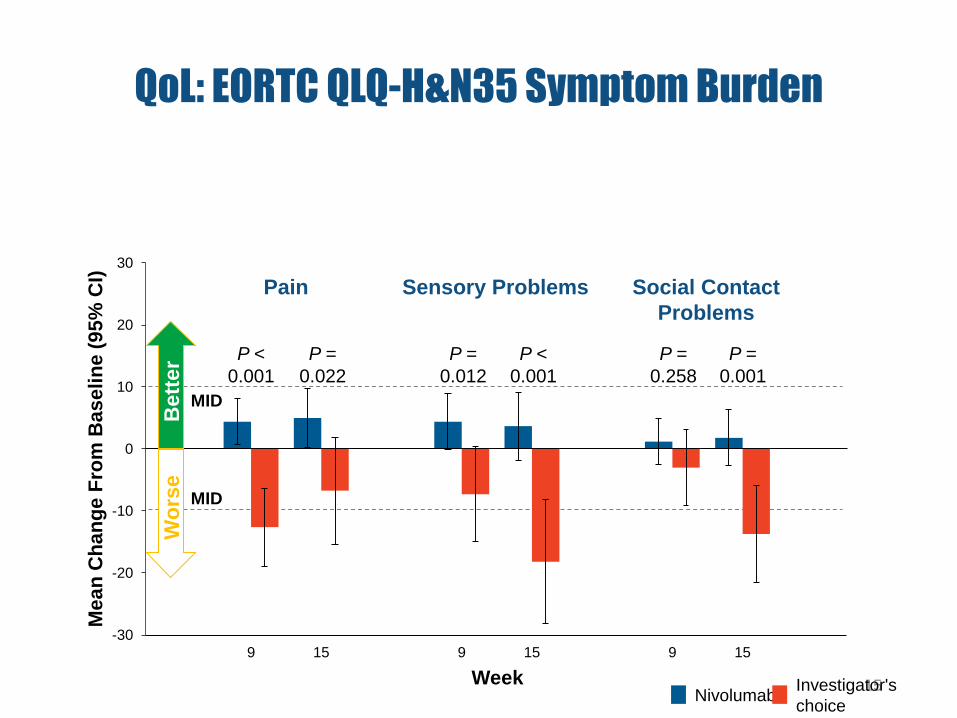
-30
-20
-10
0
10
20
30
9 15 9 15 9 15
MID
MID
Social Contact
Problems
Sensory Problems Pain
Week
P =
0.001
P =
0.258
P =
0.012
P <
0.001
P <
0.001
P =
0.022
Bett
er
Wo
rse
Me
an
Ch
an
ge
Fro
m B
as
eli
ne
(9
5%
CI)
QoL: EORTC QLQ-H&N35 Symptom Burden
15
Nivolumab Investigator's
choice
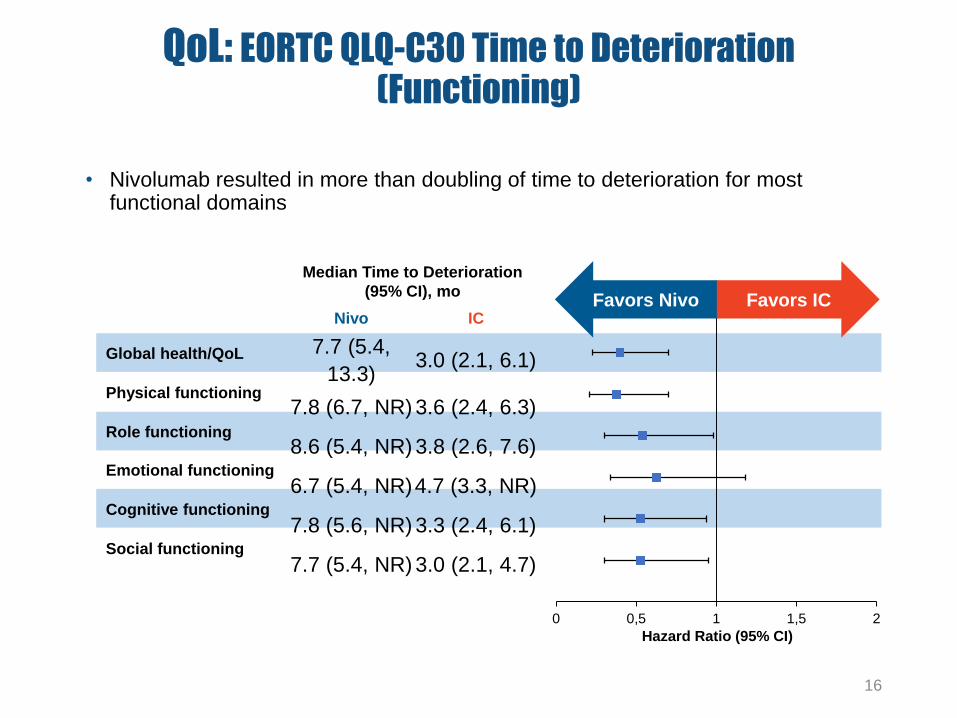
QoL: EORTC QLQ-C30 Time to Deterioration (Functioning)
• Nivolumab resulted in more than doubling of time to deterioration for most functional domains
16
Global health/QoL
Physical functioning
Role functioning
Emotional functioning
Social functioning
Cognitive functioning
0 0,5 1 1,5 2
Hazard Ratio (95% CI)
7.7 (5.4,
13.3) 3.0 (2.1, 6.1)
7.8 (6.7, NR) 3.6 (2.4, 6.3)
8.6 (5.4, NR) 3.8 (2.6, 7.6)
6.7 (5.4, NR) 4.7 (3.3, NR)
7.8 (5.6, NR) 3.3 (2.4, 6.1)
7.7 (5.4, NR) 3.0 (2.1, 4.7)
Median Time to Deterioration
(95% CI), mo
Nivo IC Favors Nivo Favors IC
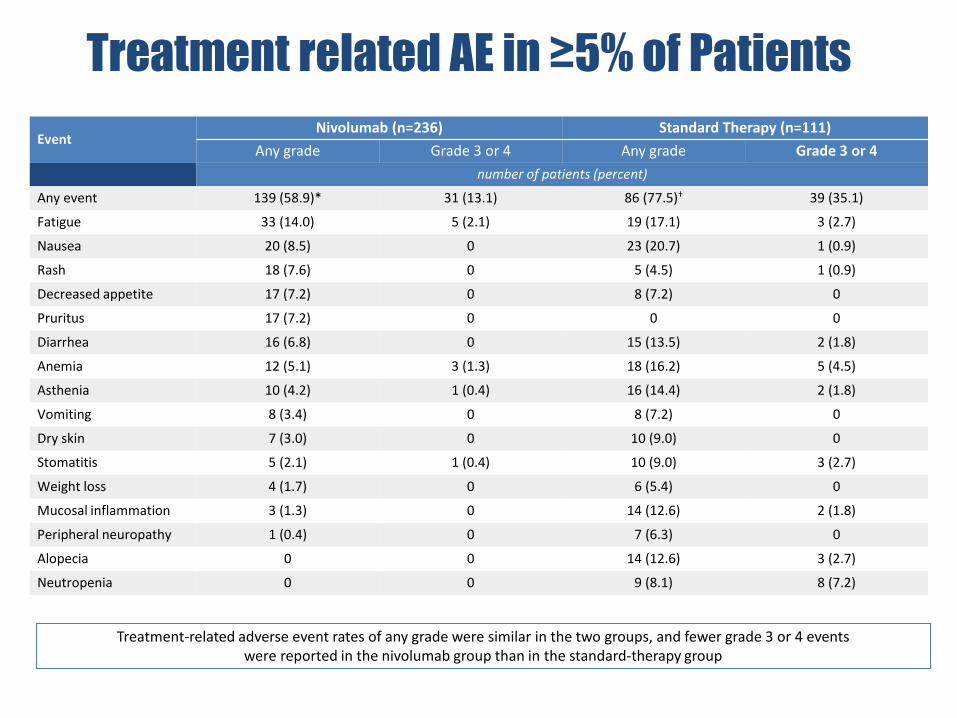
Treatment related AE in ≥5% of Patients
Treatment-related adverse event rates of any grade were similar in the two groups, and fewer grade 3 or 4 events were reported in the nivolumab group than in the standard-therapy group
Event Nivolumab (n=236) Standard Therapy (n=111)
Any grade Grade 3 or 4 Any grade Grade 3 or 4
number of patients (percent)
Any event 139 (58.9)* 31 (13.1) 86 (77.5)† 39 (35.1)
Fatigue 33 (14.0) 5 (2.1) 19 (17.1) 3 (2.7)
Nausea 20 (8.5) 0 23 (20.7) 1 (0.9)
Rash 18 (7.6) 0 5 (4.5) 1 (0.9)
Decreased appetite 17 (7.2) 0 8 (7.2) 0
Pruritus 17 (7.2) 0 0 0
Diarrhea 16 (6.8) 0 15 (13.5) 2 (1.8)
Anemia 12 (5.1) 3 (1.3) 18 (16.2) 5 (4.5)
Asthenia 10 (4.2) 1 (0.4) 16 (14.4) 2 (1.8)
Vomiting 8 (3.4) 0 8 (7.2) 0
Dry skin 7 (3.0) 0 10 (9.0) 0
Stomatitis 5 (2.1) 1 (0.4) 10 (9.0) 3 (2.7)
Weight loss 4 (1.7) 0 6 (5.4) 0
Mucosal inflammation 3 (1.3) 0 14 (12.6) 2 (1.8)
Peripheral neuropathy 1 (0.4) 0 7 (6.3) 0
Alopecia 0 0 14 (12.6) 3 (2.7)
Neutropenia 0 0 9 (8.1) 8 (7.2)
See notes for footnotes

FUTURO
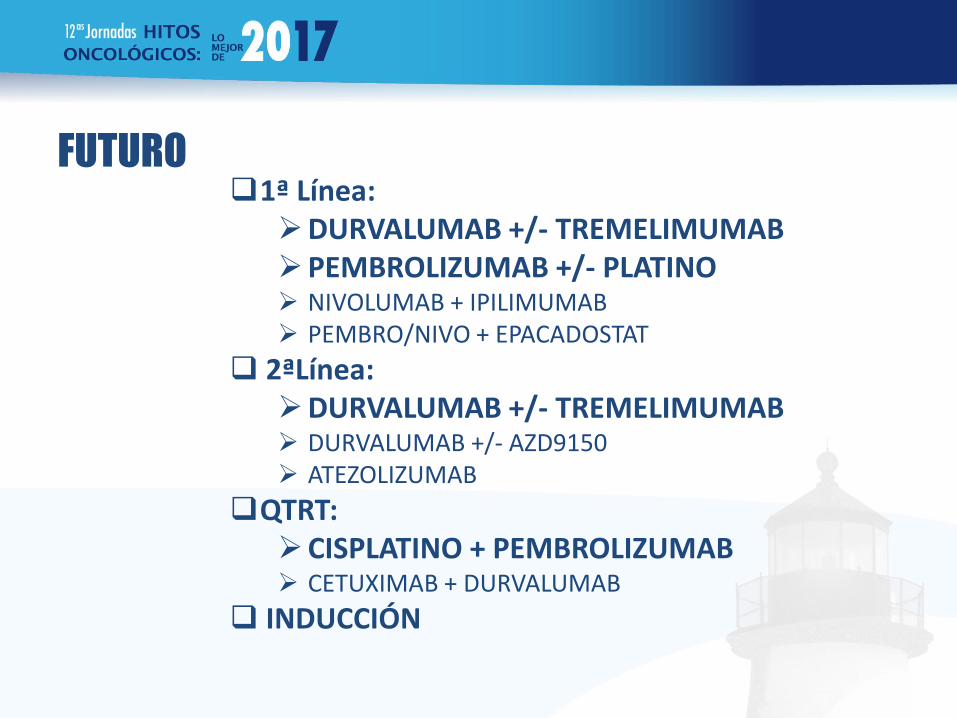
FUTURO 1ª Línea:
DURVALUMAB +/- TREMELIMUMAB PEMBROLIZUMAB +/- PLATINO NIVOLUMAB + IPILIMUMAB PEMBRO/NIVO + EPACADOSTAT
2ªLínea: DURVALUMAB +/- TREMELIMUMAB DURVALUMAB +/- AZD9150 ATEZOLIZUMAB
QTRT: CISPLATINO + PEMBROLIZUMAB CETUXIMAB + DURVALUMAB
INDUCCIÓN
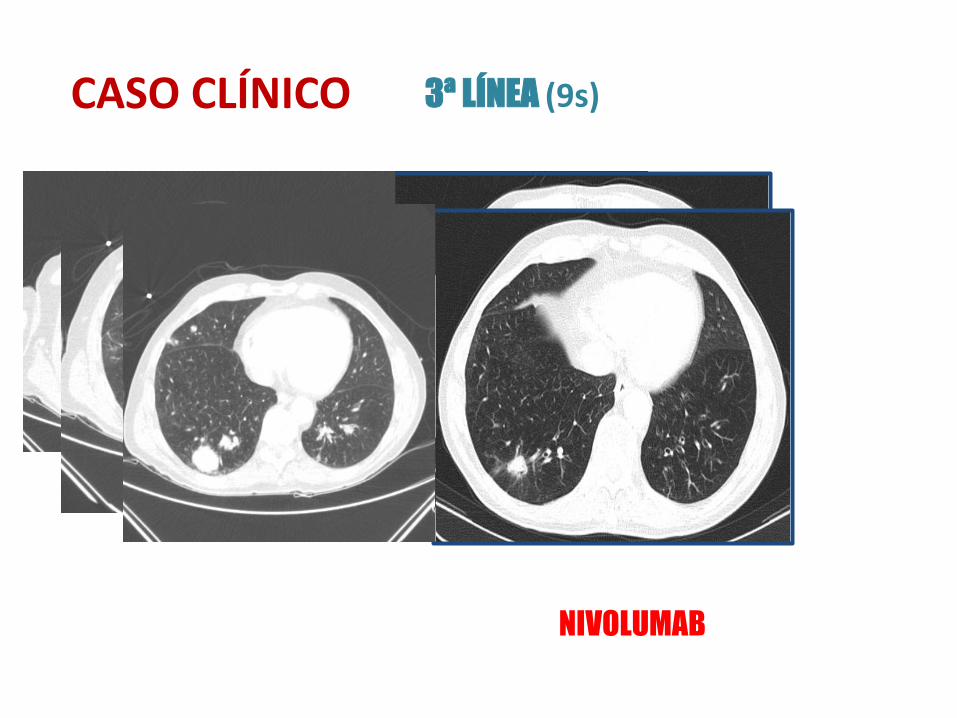
CASO CLÍNICO
NIVOLUMAB
3ª LÍNEA (9s)
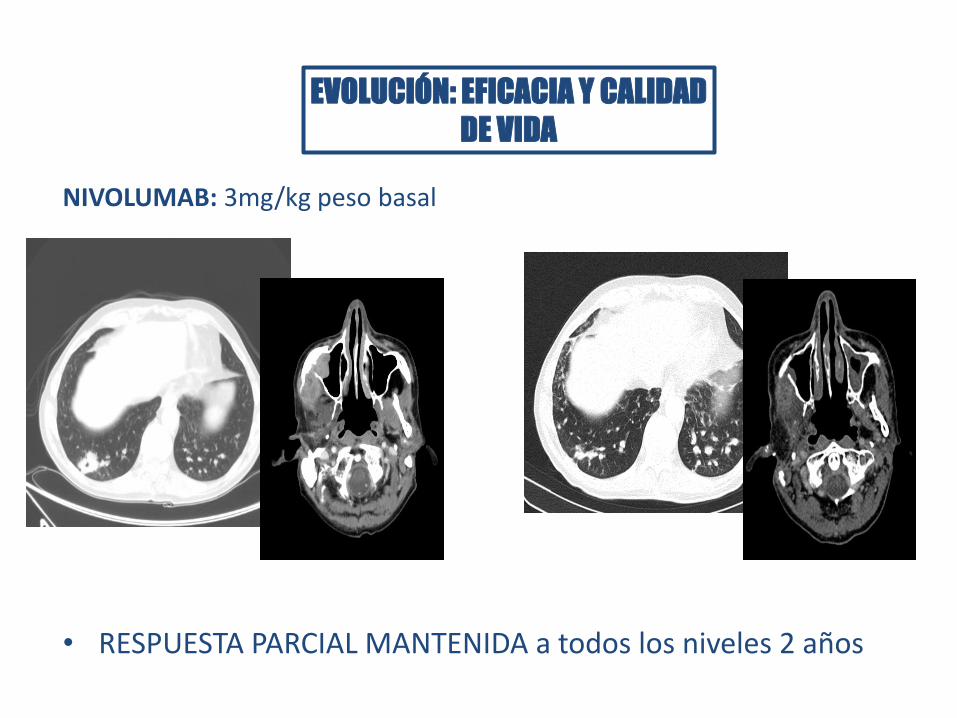
NIVOLUMAB: 3mg/kg peso basal
• RESPUESTA PARCIAL MANTENIDA a todos los niveles 2 años
EVOLUCIÓN: EFICACIA Y CALIDAD
DE VIDA
QUIMIOTERAPIA
- Platinos
- Antimetabolitos
- Taxanos
-
TERAPIAS DIRIGIDAS
- Cetuximab
- Afatinib ¿?
INMUNOTERAPIA
- Monoterapia ANTI-PD1
CONCLUSIONES
Aumentar la supervivencia de los pacientes con cáncer escamoso de cabeza y cuello
recurrente/metastásico