
Lean midland presentation-161013
50
Lean Midland Forum 16 October 2013 Education Centre, Good Hope Hospital For more information, please email [email protected] or telephone 0207 824 8448
-
Upload
kinetik-solutions-ltd -
Category
Business
-
view
139 -
download
0
Transcript of Lean midland presentation-161013
Lean Midland Forum
16 October 2013 Education Centre, Good Hope Hospital
For more information, please email [email protected] or telephone 0207 824 8448
- 2 -
Confidential not to be used without consent
We have some broad aims of the forum
• Create the environment where Lean Solutions in the NHS are shared, discussed and acted upon by practitioners in the health service
• Engage in a debate about strengths and weakness of lean/service improvement methods in the current NHS climate – The QIPP agenda in reducing costs across the health system
– Clinical Commissioning Groups that will redefine ‘end to end’ health systems processes
• To network with colleagues and friends

- 3 -
Confidential not to be used without consent
Agenda
• 1800 - 1810 Welcome and introductions
• 1810 - 1835 “Improvement; Infection; Impossible? – Dr Mathew Diggle (Consultant, Nottingham University Hospitals NHS Trust)
• 1835 - 1900 “How effective use of SPC in the NHS results in better decision making” – Mike Davidge (Director, NHS Elect)
• 1900 - 1930 Hot seat session
• 1930 - 2000 Networking and drinks

Where?
Clinical Microbiology Department No7ngham University Hospitals NHS Trust Queens Medical Centre Derby Road No7ngham UK NG7 2UH hFp://www.nuh.nhs.uk/microbiology/

The No7ngham Experience • DiagnosOc service: 24/7, 365 days per year • PopulaOon served: >2.5 million (> 5 million)
• Workload: 970,000 pa (> 1.8 Million)
• IsolaOon, idenOficaOon and detecOon of • medically important bacteria,
• viruses and parasites.

And now for something completely different...
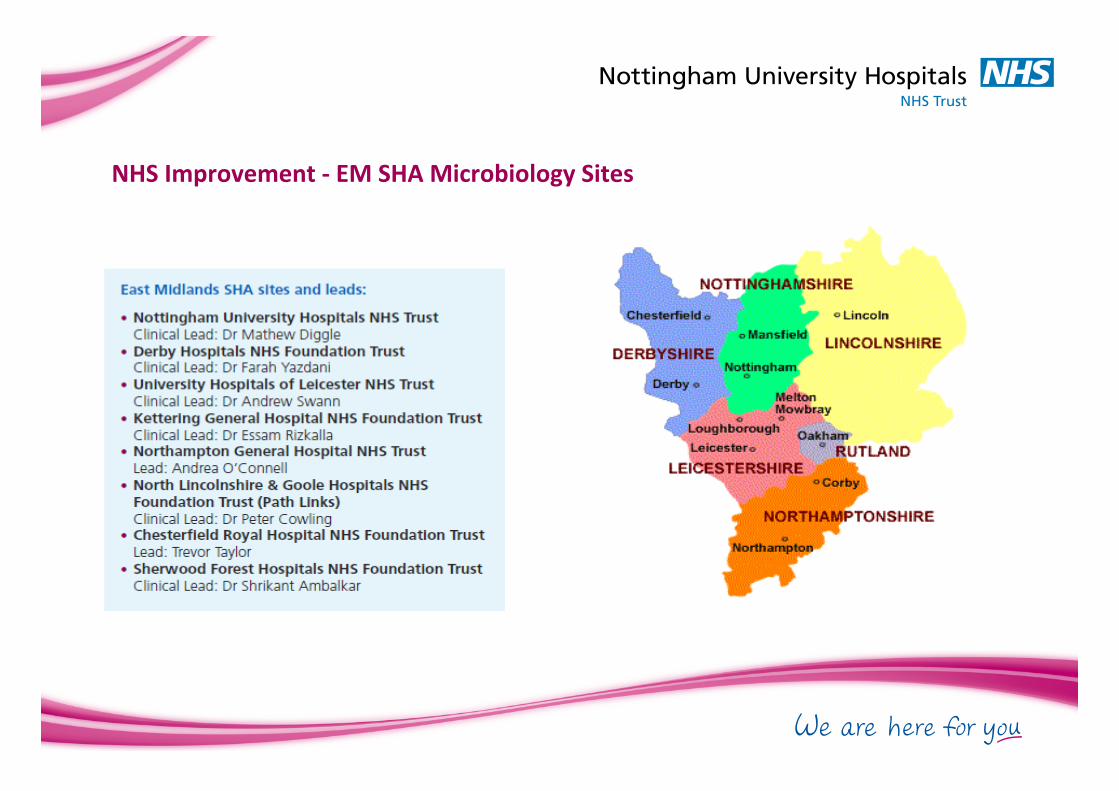
NHS Improvement -‐ EM SHA Microbiology Sites

LEAN?

LEAN
Microbiology

What the…………….

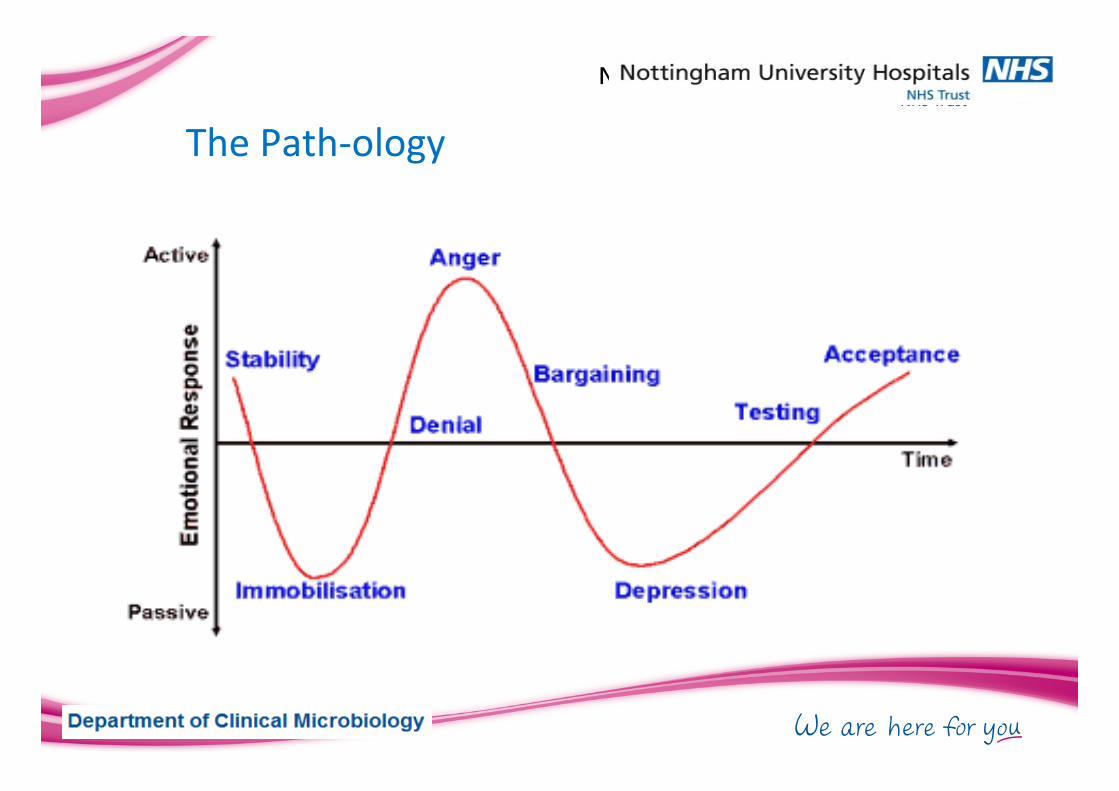
The Path-‐ology

The Project

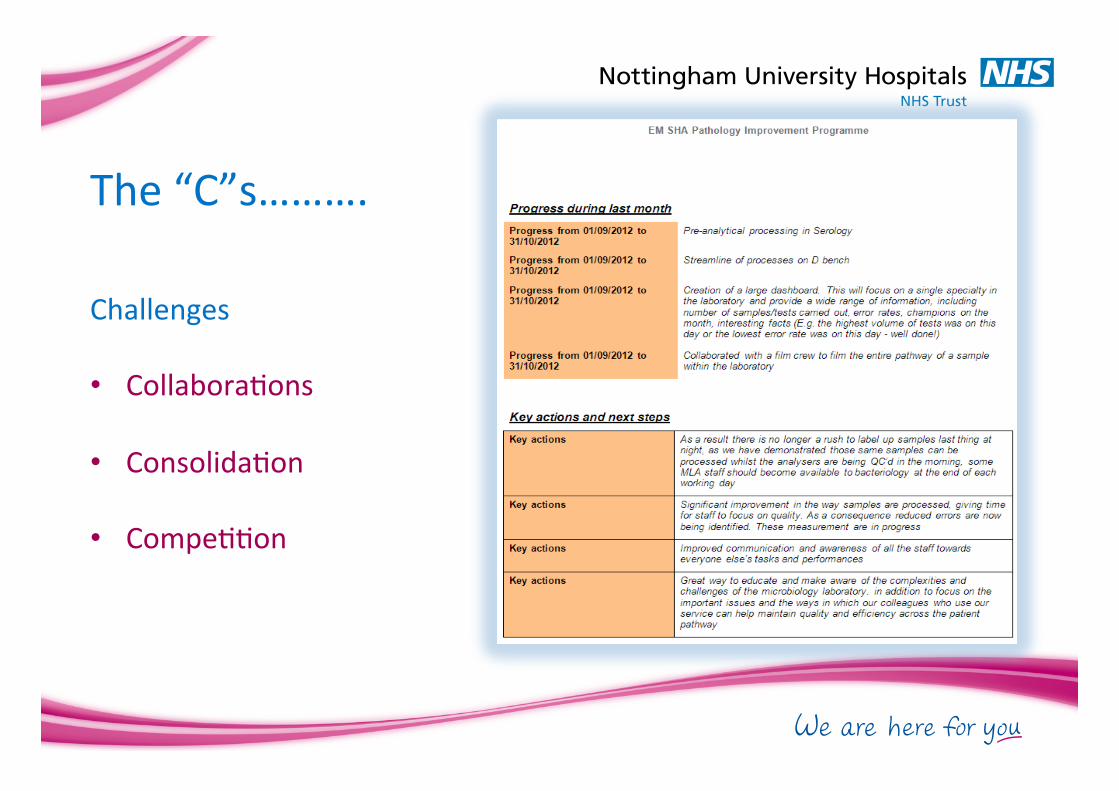
Challenges • CollaboraOons • ConsolidaOon • CompeOOon
The “C”s……….
The No7ngham Experience
Challenges • Developing a lean culture
• Find a champion • Engagement of your staff
• What is engagement? • CommunicaOon
• While under a seize mentality
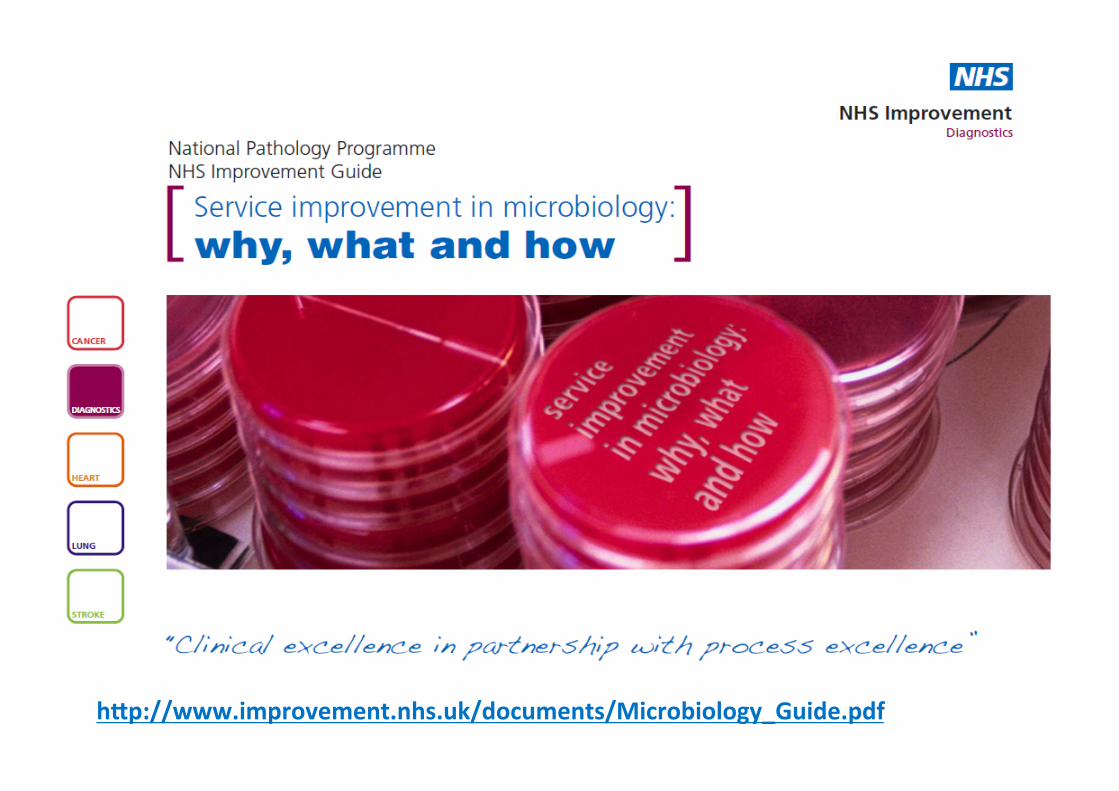
h:p://www.improvement.nhs.uk/documents/Microbiology_Guide.pdf


Thank you!
How effective use of SPC in the NHS results in better decision making
Mike Davidge

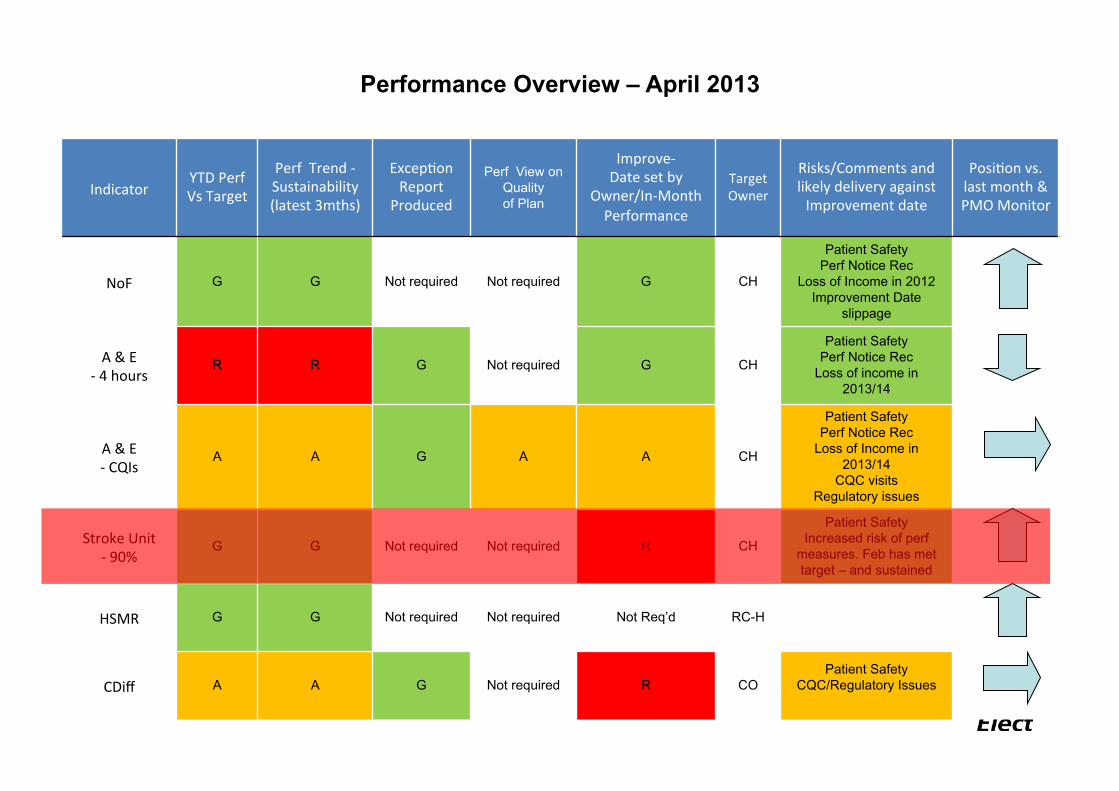
How we assess performance: RAG raGngs
Sep 11 Oct 11 Nov 11 Dec 11 Jan 12 Feb 12 Mar 12 Apr 12 May 12 Jun 12 Jul 12 Aug 1290 97 77 93 76 84 76 89 84 84 93 70
Why has performance deteriorated so badly in August 2012? What decision are you going to make?

Indicator YTD Perf Vs Target
Perf Trend -‐Sustainability (latest 3mths)
ExcepOon Report
Produced Perf View on
Quality of Plan
Improve-‐ Date set by
Owner/In-‐Month Performance
Target Owner
Risks/Comments and likely delivery against Improvement date
PosiOon vs. last month & PMO Monitor
NoF G G Not required Not required G CH
Patient Safety Perf Notice Rec
Loss of Income in 2012 Improvement Date
slippage
A & E -‐ 4 hours
R R G Not required G CH
Patient Safety Perf Notice Rec
Loss of income in 2013/14
A & E -‐ CQIs
A A G A A CH
Patient Safety Perf Notice Rec
Loss of Income in 2013/14
CQC visits Regulatory issues
Stroke Unit -‐ 90%
G G Not required Not required R CH
Patient Safety Increased risk of perf
measures. Feb has met target – and sustained
HSMR G G Not required Not required Not Req’d RC-H
CDiff A A G Not required R CO Patient Safety
CQC/Regulatory Issues
Performance Overview – April 2013
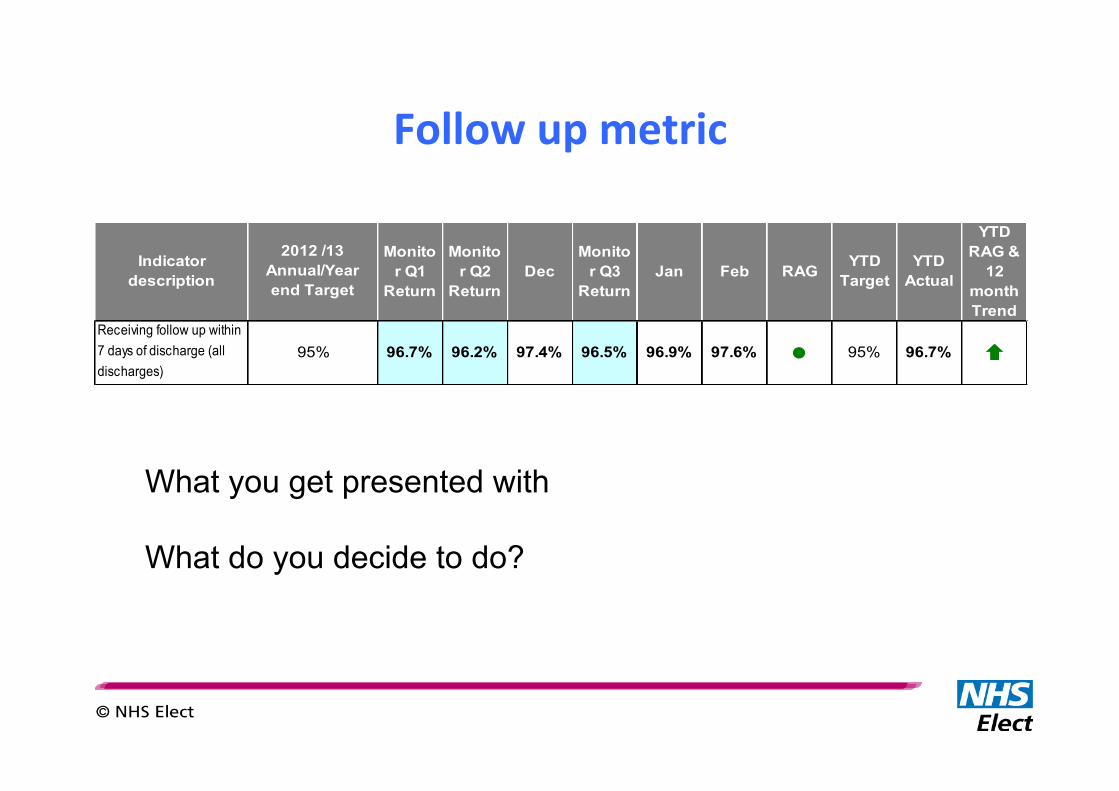
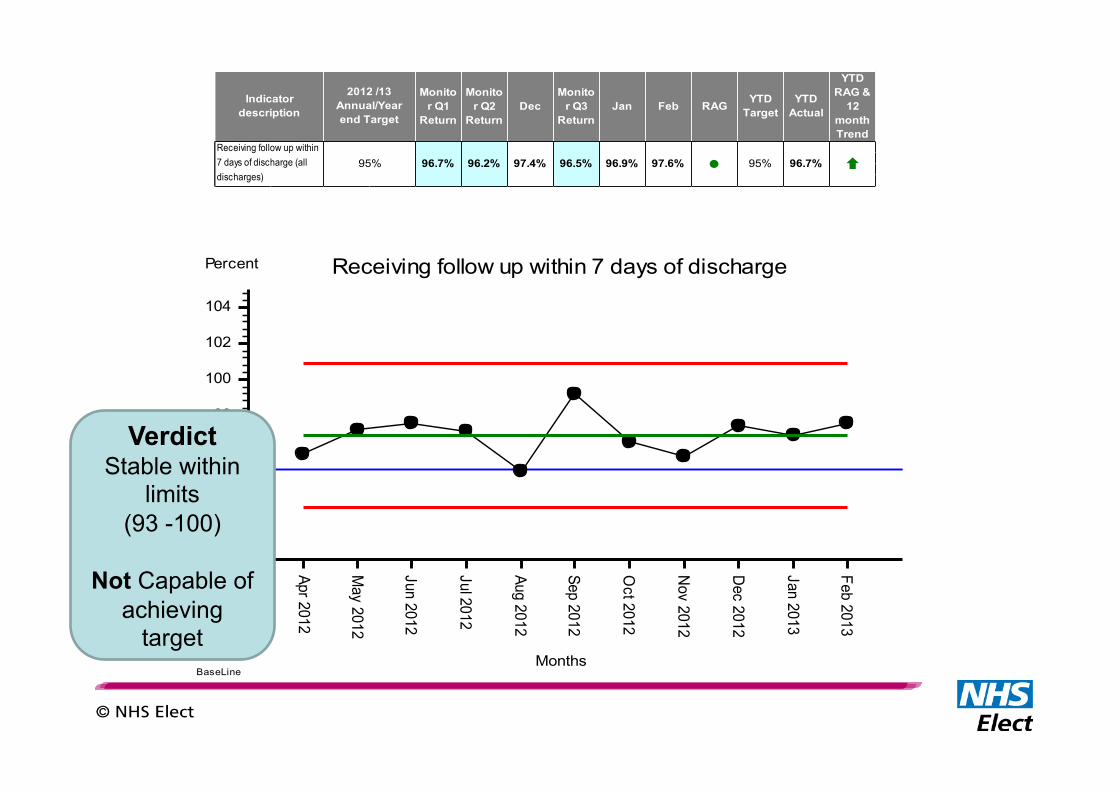
Follow up metric
Monitor Q1
Return
Monitor Q2
ReturnDec
Monitor Q3
ReturnJan Feb RAG YTD
TargetYTD
Actual
YTD RAG &
12 month Trend
l 95% 96.7% Ç96.7% 96.2% 97.4% 96.5% 96.9% 97.6%
Indicator description
2012 /13 Annual/Year end Target
Receiving follow up within 7 days of discharge (all discharges)
95%
What you get presented with What do you decide to do?
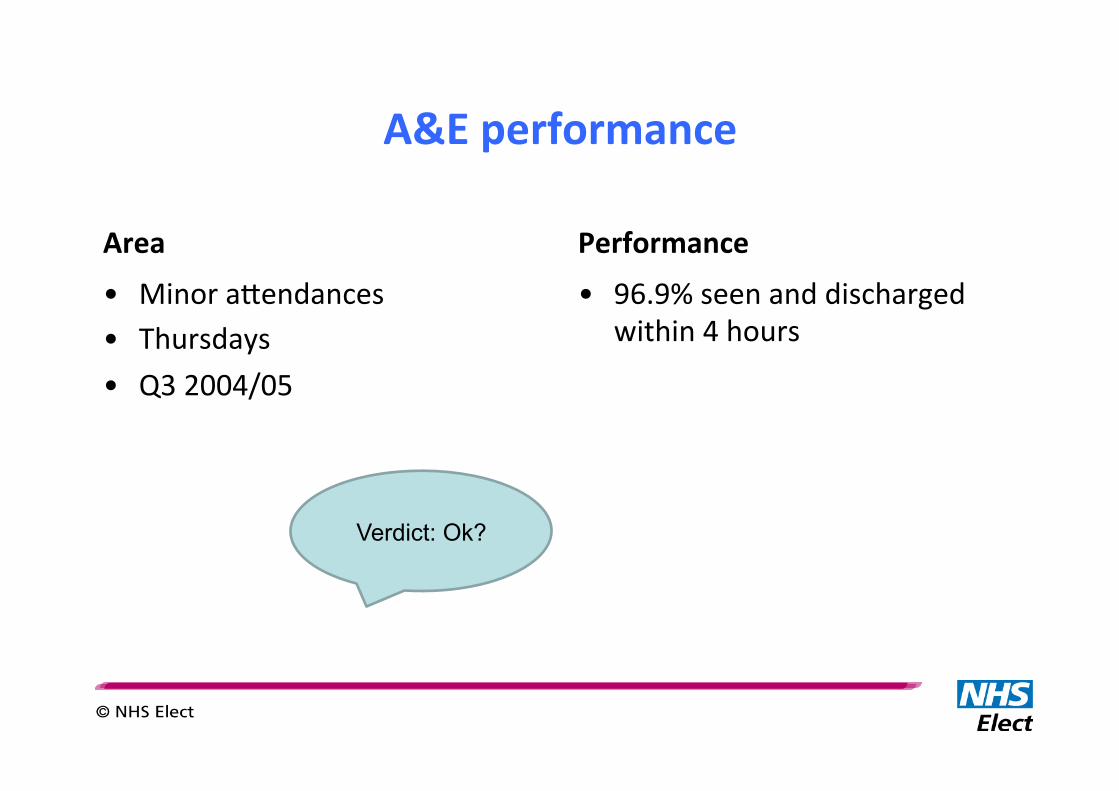
A&E performance
Area
• Minor aFendances • Thursdays • Q3 2004/05
Performance
• 96.9% seen and discharged within 4 hours
Verdict: Ok?

How long does it take
you to get to work? How many patients need a
home visit today?
How long does it take to take a patients
BP?
In the real world, everything varies....

What’s a person’s normal body temperature?

“Data contains both signal and noise. To be able to extract
information, one must separate the signal from the noise within
the data.”
Walter Shewhart

There are two types of variaGon
While every process displays variaOon: • some processes display controlled variaOon (common cause) – Stable pa)ern of varia0on = noise – constant causes/ “chance”
• while others display uncontrolled variaOon – pa)ern changes over 0me = signal – special cause varia0on/“assignable” cause eg infec0on or hypothermia
We should display data in a way that shows which is present

Control charts
• Plot data in time order • Calculate and display mean as a line and
control limits as lines • Analyse chart by studying how values fall
around mean and between control limits
Control charts
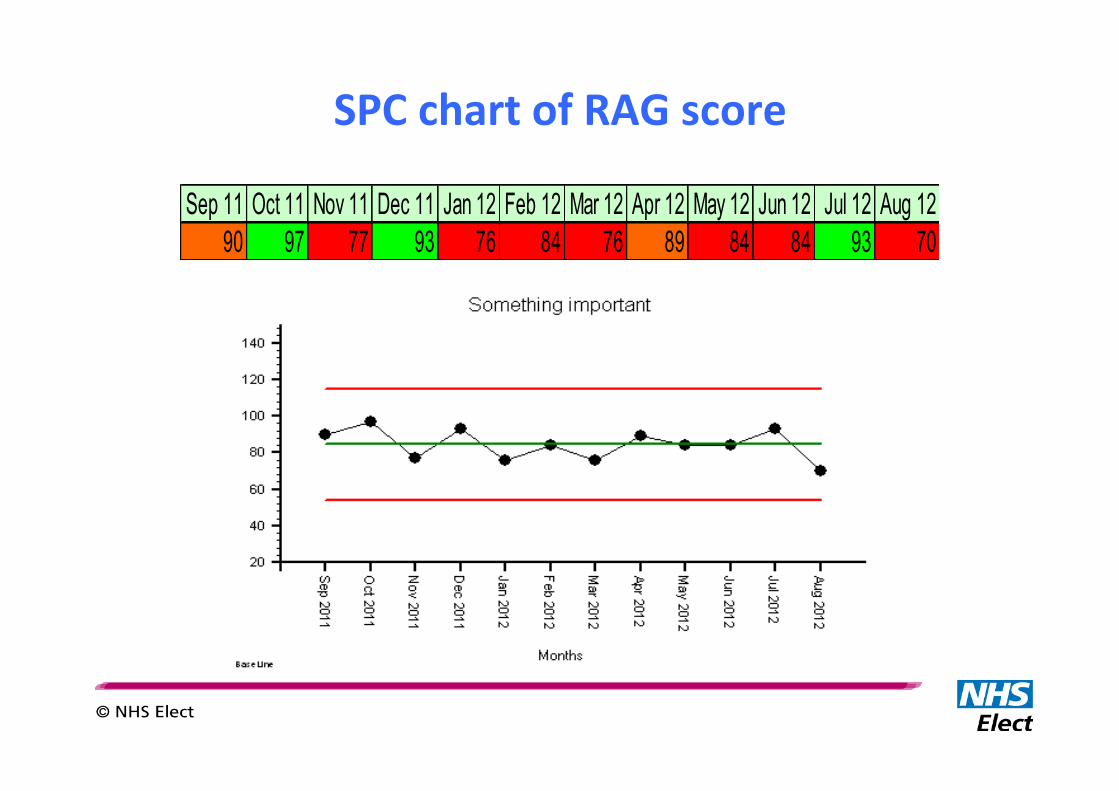
SPC chart of RAG score
Sep 11 Oct 11 Nov 11 Dec 11 Jan 12 Feb 12 Mar 12 Apr 12 May 12 Jun 12 Jul 12 Aug 1290 97 77 93 76 84 76 89 84 84 93 70
Indicator YTD Perf Vs Target
Perf Trend -‐Sustainability (latest 3mths)
ExcepOon Report
Produced Perf View on
Quality of Plan
Improve-‐ Date set by
Owner/In-‐Month Performance
Target Owner
Risks/Comments and likely delivery against Improvement date
PosiOon vs. last month & PMO Monitor
NoF G G Not required Not required G CH
Patient Safety Perf Notice Rec
Loss of Income in 2012 Improvement Date
slippage
A & E -‐ 4 hours
R R G Not required G CH
Patient Safety Perf Notice Rec
Loss of income in 2013/14
A & E -‐ CQIs
A A G A A CH
Patient Safety Perf Notice Rec
Loss of Income in 2013/14
CQC visits Regulatory issues
Stroke Unit -‐ 90%
G G Not required Not required R CH
Patient Safety Increased risk of perf
measures. Feb has met target – and sustained
HSMR G G Not required Not required Not Req’d RC-H
CDiff A A G Not required R CO Patient Safety
CQC/Regulatory Issues
Performance Overview – April 2013

Not so peachy
Apr 2012
May 2012
Jun 2012
Jul 2012
Aug 2012
Sep 2012
Oct 2012
Nov 2012
Dec 2012
Jan 2013
Feb 2013
Mar 2013
Apr 2013
Month
50
60
70
80
90
100
percentage % patients achieving 90% time in stroke unit
BaseLine
Verdict Stable within
limits (66 -100)
Not Capable of
achieving target
Apr 2012
May 2012
Jun 2012
Jul 2012
Aug 2012
Sep 2012
Oct 2012
Nov 2012
Dec 2012
Jan 2013
Feb 2013
Months
90
92
94
96
98
100
102
104
Percent Receiving follow up within 7 days of discharge
BaseLine
Verdict Stable within
limits (93 -100)
Not Capable of
achieving target
Monitor Q1
Return
Monitor Q2
ReturnDec
Monitor Q3
ReturnJan Feb RAG YTD
TargetYTD
Actual
YTD RAG &
12 month Trend
l 95% 96.7% Ç96.7% 96.2% 97.4% 96.5% 96.9% 97.6%
Indicator description
2012 /13 Annual/Year end Target
Receiving follow up within 7 days of discharge (all discharges)
95%

A&E – the real situaGon
0
200
400
600
800
1000
1200
06/01 00:12
06/01 12:12
06/01 18:36
13/01 10:18
13/01 15:51
13/01 23:02
20/01 11:10
20/01 16:47
27/01 00:02
27/01 12:22
27/01 18:44
03/02 09:11
03/02 15:30
03/02 22:48
10/02 11:46
10/02 17:20
17/02 03:08
17/02 13:46
17/02 18:31
24/02 04:37
24/02 14:08
24/02 21:29
03/03 12:17
03/03 19:26
10/03 09:33
10/03 16:01
10/03 22:39
17/03 11:15
17/03 16:33
17/03 21:31
24/03 12:09
24/03 18:43
31/03 07:57
31/03 15:00
Time in A&E department Jan-Mar 2005Infirmary : Minor attendance : Thursday
Time inDept
Average(01:50)
LCL(00:00)
UCL(05:05)
4 hr target

The two types of mistake
Mistake One • InterpreOng the rouOne variaOon of noise as if it amounted to a
signal of a change in the underlying process, thereby sounding a false alarm. [false posiOve]
Mistake Two • Thinking that a signal of a change in the underlying process is
merely the noise of rouOne variaOon, thereby missing a signal. [false negaOve]

SPC – do it right
• Use the correct way of determining the measure of variaOon
• Use the correct mulOple of variaOon to derive the control limits
• Don’t exclude data points just because they’re ‘odd’
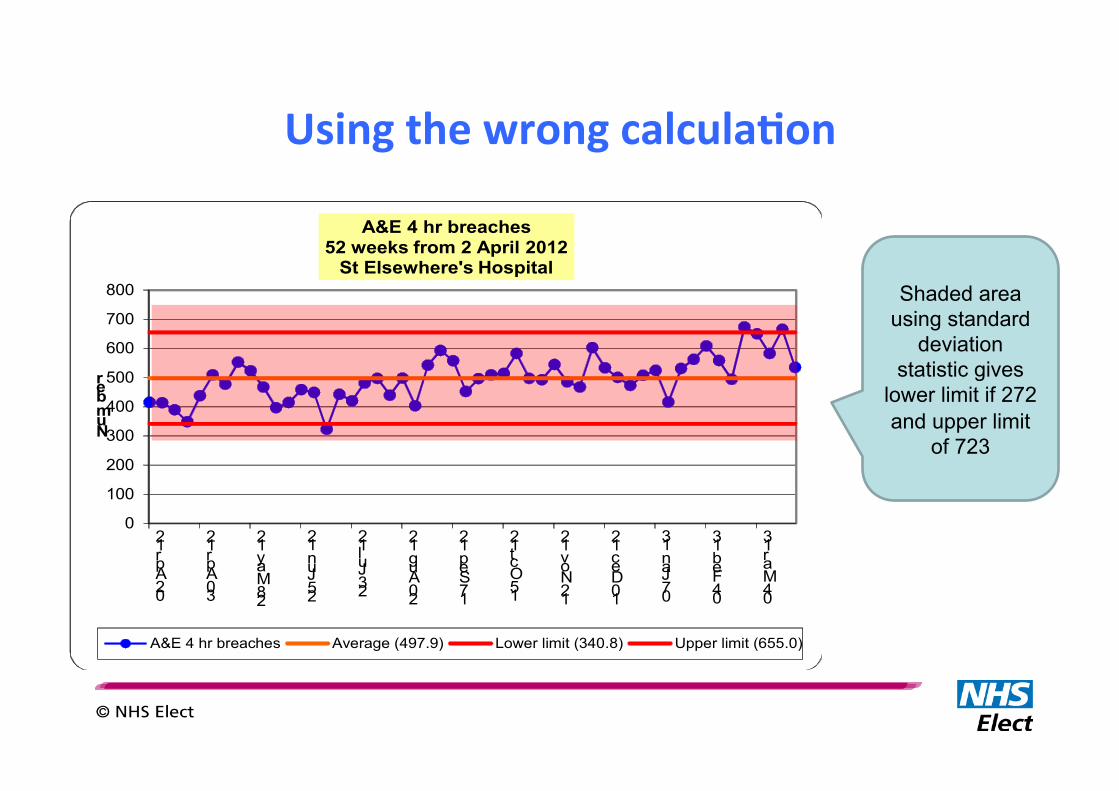
Using the wrong calculaGon
0
100
200
300
400
500
600
700
800
02 Apr 12
30 Apr 12
28 May 12
25 Jun 12
23 Jul 12
20 Aug 12
17 Sep 12
15 Oct 12
12 Nov 12
10 Dec 12
07 Jan 13
04 Feb 13
04 Mar 13
Number
A&E 4 hr breaches52 weeks from 2 April 2012
St Elsewhere's Hospital
A&E 4 hr breaches Average (497.9) Lower limit (340.8) Upper limit (655.0)
Shaded area using standard
deviation statistic gives
lower limit if 272 and upper limit
of 723
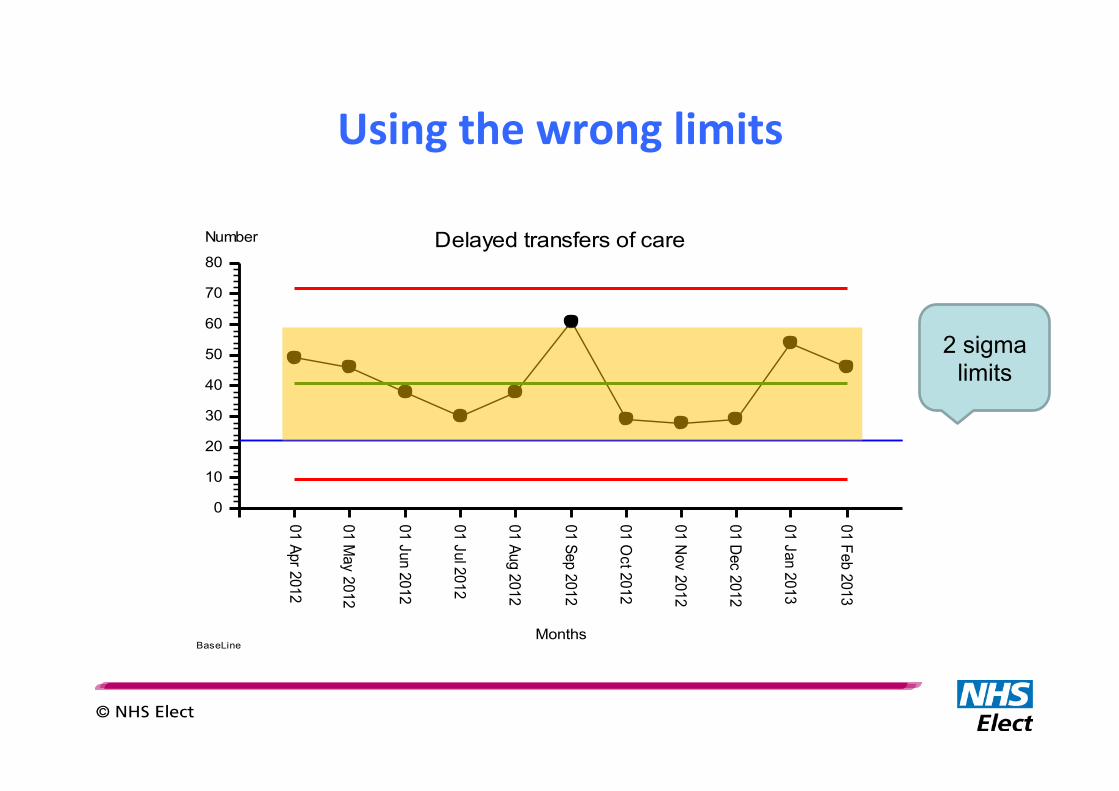
Using the wrong limits
01 Apr 2012
01 May 2012
01 Jun 2012
01 Jul 2012
01 Aug 2012
01 Sep 2012
01 Oct 2012
01 Nov 2012
01 Dec 2012
01 Jan 2013
01 Feb 2013
Months
0
10
20
30
40
50
60
70
80
Number Delayed transfers of care
BaseLine
2 sigma limits
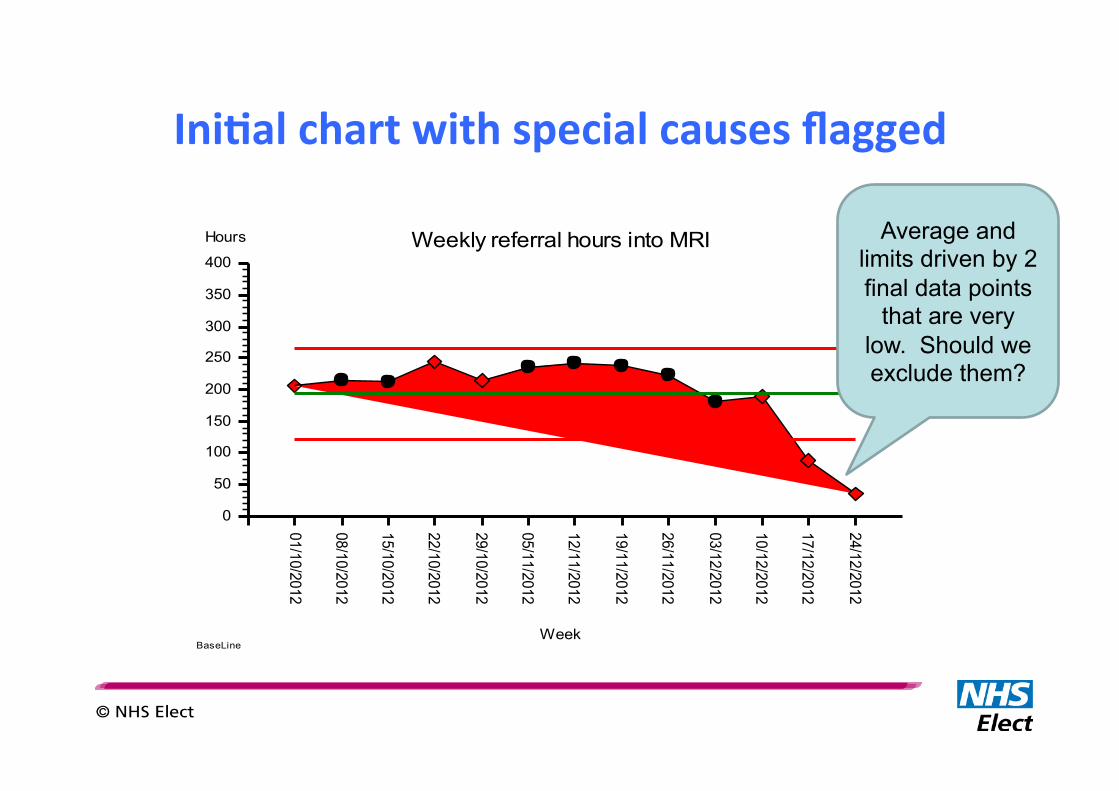
IniGal chart with special causes flagged
01/10/2012
08/10/2012
15/10/2012
22/10/2012
29/10/2012
05/11/2012
12/11/2012
19/11/2012
26/11/2012
03/12/2012
10/12/2012
17/12/2012
24/12/2012
Week
0
50
100
150
200
250
300
350
400
Hours Weekly referral hours into MRI
BaseLine
Average and limits driven by 2 final data points
that are very low. Should we exclude them?
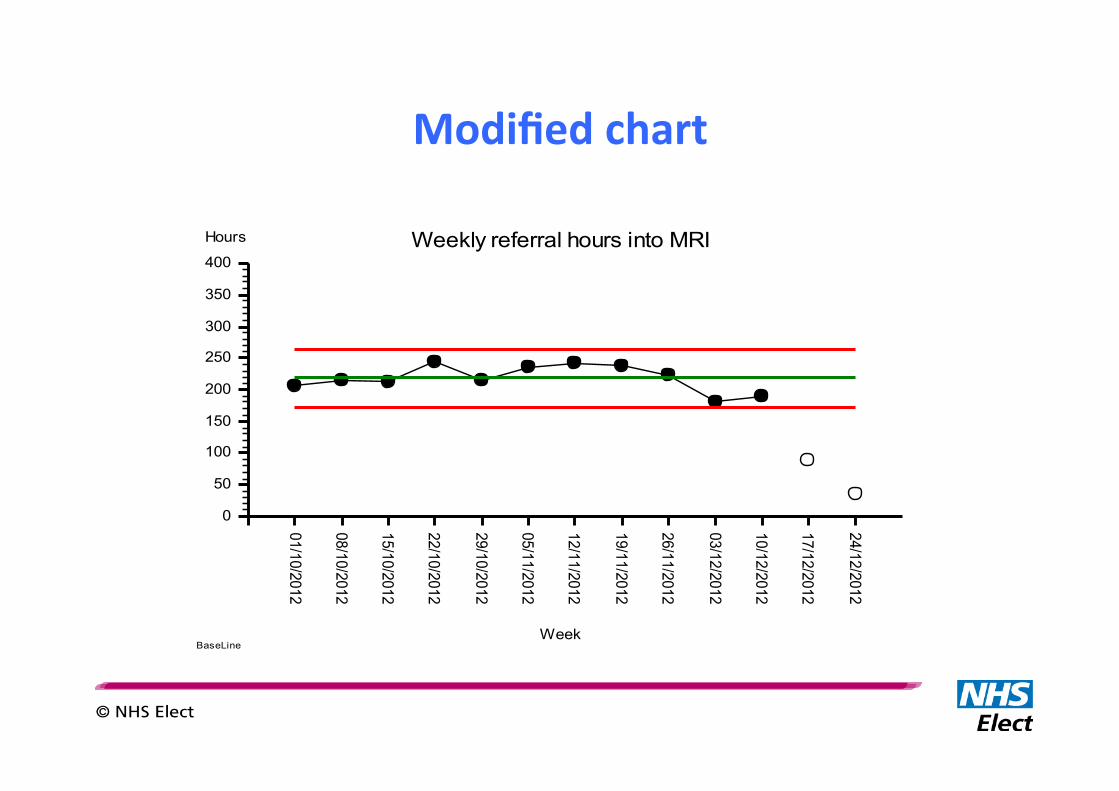
Modified chart
01/10/2012
08/10/2012
15/10/2012
22/10/2012
29/10/2012
05/11/2012
12/11/2012
19/11/2012
26/11/2012
03/12/2012
10/12/2012
17/12/2012
24/12/2012
Week
0
50
100
150
200
250
300
350
400
Hours Weekly referral hours into MRI
BaseLine

A proper RAG status
• Green = stable and capable i.e. no special causes and process limits within specificaOon limits – Ac0on: masterly inac0vity and catlike observa0on
• Amber = unstable i.e. special causes – Ac0on: inves0gate special causes, diagnose and treat with a countermeasure.
• Red = stable but incapable i.e. no special causes and process limits outside specificaOon limits – Ac0on: improve or redesign depending on level of experience/skill

My final slide: Shipman
Source: Malcolm Gall in The Times, 1 February 2000 Taken from “Bristol, Shipman and clinical governance: Shewhart’s forgotten lessons” Mohammed et all, The Lancet, volume 357, 2001

• Focus on Value from a Customer (Patient) point of view on every step of process
• Obsession on removing waste within the ‘whole system’ • Bottom up approach in identifying value and waste – assumption that
much of waste and value is hidden • A true lean system would “flow” and need little command and control
Recap – What is Lean?
- 45 -
Confidential not to be used without consent
What’s Next?
• Today’s presentation and feedback survey sent out by email within 72 hours
• The Next Lean Midland Forum will be held on 26 February 2014. – Register at www.leanmidland.org.uk
– We will send out reminders to all participants from today
– We have a Lean London Forum on 5 March 2014 taking place in London. Register at www.leanlondon.org.uk
– If you’d like to take up one of our presentation slots, please do let us know. We are keen to hear from Community Trust and GP Groups
• Find us on and - LeanNHS
- 46 -
Confidential not to be used without consent
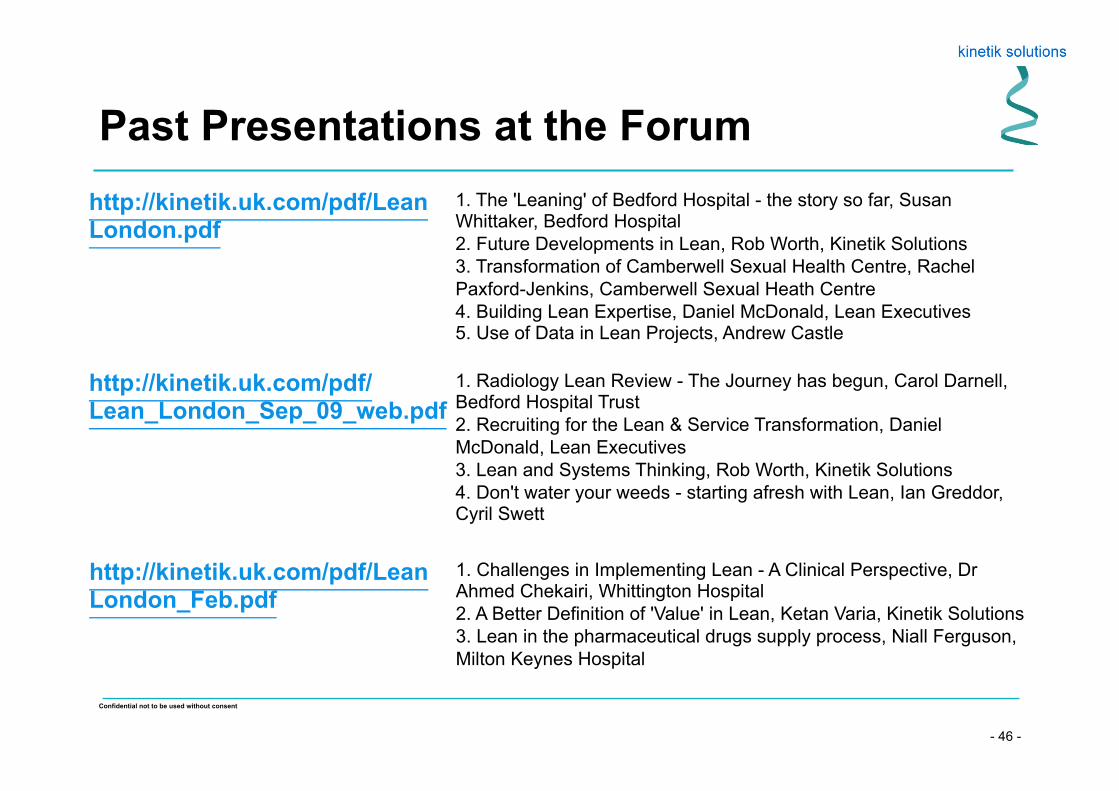
Past Presentations at the Forum http://kinetik.uk.com/pdf/Lean London.pdf
1. The 'Leaning' of Bedford Hospital - the story so far, Susan Whittaker, Bedford Hospital 2. Future Developments in Lean, Rob Worth, Kinetik Solutions 3. Transformation of Camberwell Sexual Health Centre, Rachel Paxford-Jenkins, Camberwell Sexual Heath Centre 4. Building Lean Expertise, Daniel McDonald, Lean Executives 5. Use of Data in Lean Projects, Andrew Castle
http://kinetik.uk.com/pdf/Lean_London_Sep_09_web.pdf
1. Radiology Lean Review - The Journey has begun, Carol Darnell, Bedford Hospital Trust 2. Recruiting for the Lean & Service Transformation, Daniel McDonald, Lean Executives 3. Lean and Systems Thinking, Rob Worth, Kinetik Solutions 4. Don't water your weeds - starting afresh with Lean, Ian Greddor, Cyril Swett
http://kinetik.uk.com/pdf/Lean London_Feb.pdf
1. Challenges in Implementing Lean - A Clinical Perspective, Dr Ahmed Chekairi, Whittington Hospital 2. A Better Definition of 'Value' in Lean, Ketan Varia, Kinetik Solutions 3. Lean in the pharmaceutical drugs supply process, Niall Ferguson, Milton Keynes Hospital

- 47 -
Confidential not to be used without consent
Past Presentations at the Forum http://kinetik.uk.com/pdf/leanlondon_sep11.pdf
1. Transforming Surgical Productivity, Christopher Kennedy, Guy's & St Thomas NHS Foundation Trust 2. Transforming Treatment Rooms, Dr Rebecca Hewitson, The Whittington Hospital NHS Trust
http://kinetik.uk.com/pdf/leanlondon_mar12_presentation.pdf
1. The Path-ology to Lean Thinking - Dr Mathew Diggle, Nottingham Hospital Trust & Suzanne Horobin, NHS Improvement - Diagnostics 2. Pre-Operative Health Evaluation - Engagement with Primary Care, Dr Ahmed Chekairi, Whittington Hospital
http://kinetik.uk.com/pdf/leanmidland0712.pdf
1. How many appointments do we need to make?, Kate Silvester, South Warwickshire NHS Trust 2. The Path-ology to Lean Thinking - Dr Mathew Diggle, Nottingham Hospital Trust
- 48 -
Confidential not to be used without consent
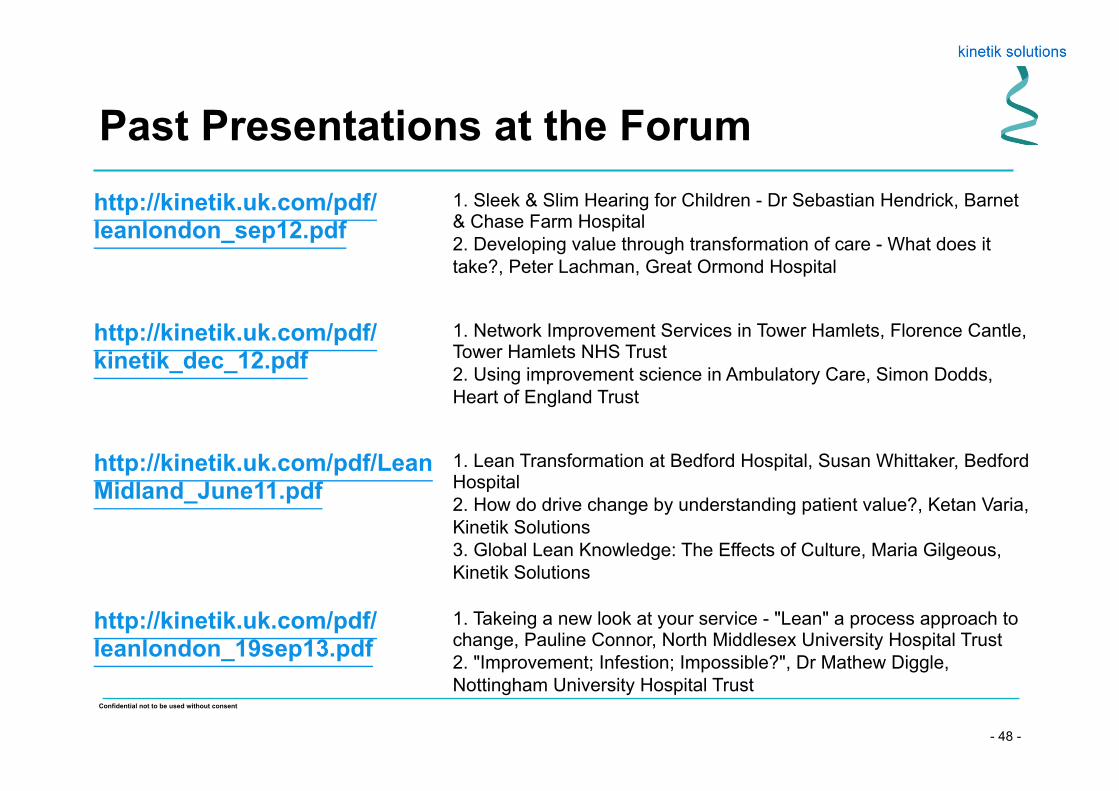
Past Presentations at the Forum http://kinetik.uk.com/pdf/leanlondon_sep12.pdf
1. Sleek & Slim Hearing for Children - Dr Sebastian Hendrick, Barnet & Chase Farm Hospital 2. Developing value through transformation of care - What does it take?, Peter Lachman, Great Ormond Hospital
http://kinetik.uk.com/pdf/kinetik_dec_12.pdf
1. Network Improvement Services in Tower Hamlets, Florence Cantle, Tower Hamlets NHS Trust 2. Using improvement science in Ambulatory Care, Simon Dodds, Heart of England Trust
http://kinetik.uk.com/pdf/Lean Midland_June11.pdf
1. Lean Transformation at Bedford Hospital, Susan Whittaker, Bedford Hospital 2. How do drive change by understanding patient value?, Ketan Varia, Kinetik Solutions 3. Global Lean Knowledge: The Effects of Culture, Maria Gilgeous, Kinetik Solutions
http://kinetik.uk.com/pdf/leanlondon_19sep13.pdf
1. Takeing a new look at your service - "Lean" a process approach to change, Pauline Connor, North Middlesex University Hospital Trust 2. "Improvement; Infestion; Impossible?", Dr Mathew Diggle, Nottingham University Hospital Trust

- 49 -
Confidential not to be used without consent
Big Thanks To Our Presenters
Dr Mathew Diggle
Mr Mike Davidge
..and to you all for attending

- 50 -
Confidential not to be used without consent
Thanks to Our Sponsors
Assisting with Lean Transformations in the health sector and beyond
www.kinetik.uk.com