PolyOne Investor Presentation 5.4.20 v8...Microsoft PowerPoint - PolyOne Investor Presentation...
34
Transcript of PolyOne Investor Presentation 5.4.20 v8...Microsoft PowerPoint - PolyOne Investor Presentation...


•
•
•
•
•
•
•
•
•
•
•
•
•
•
•
•
•
•
•
•
•
•
•

•
•
•
•
•
•
•
•
•
•
•
•
•
•
•
•
•
•
•
•
•
•
•
•
•
•
•
•
•
•
•
•
•
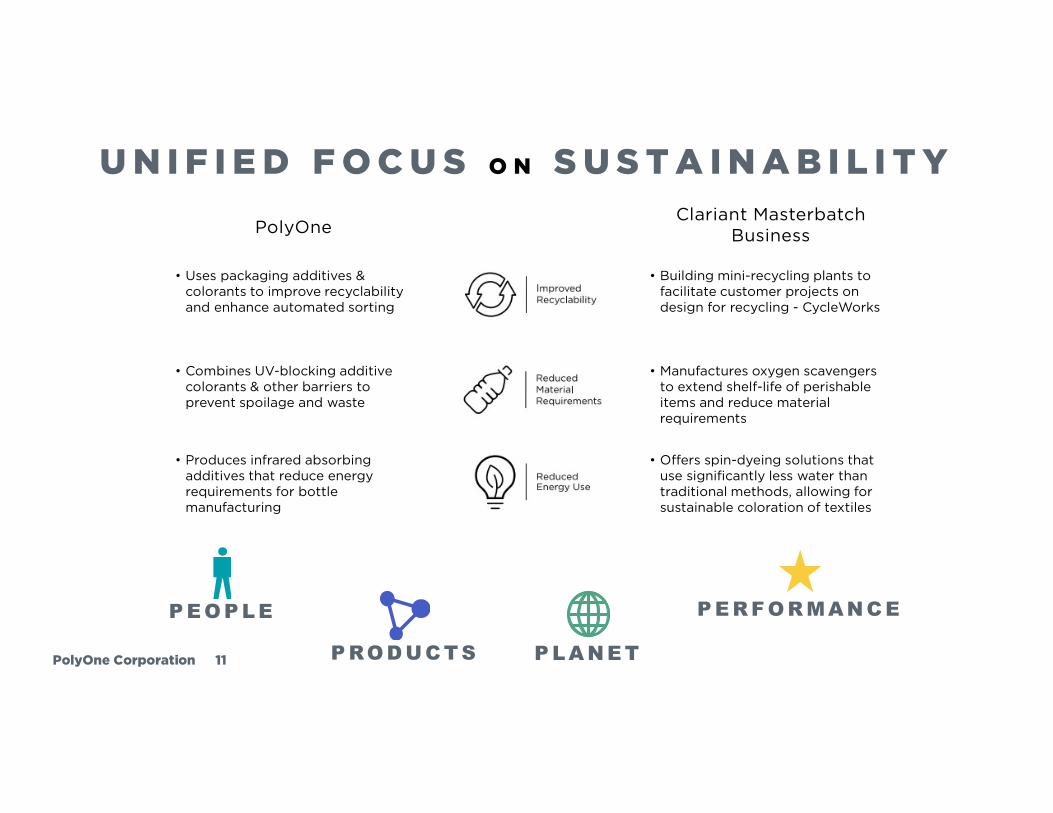
P E O P LE
P RO D U CT S P LA N E T
P E RF O R MAN C E
••
••
••
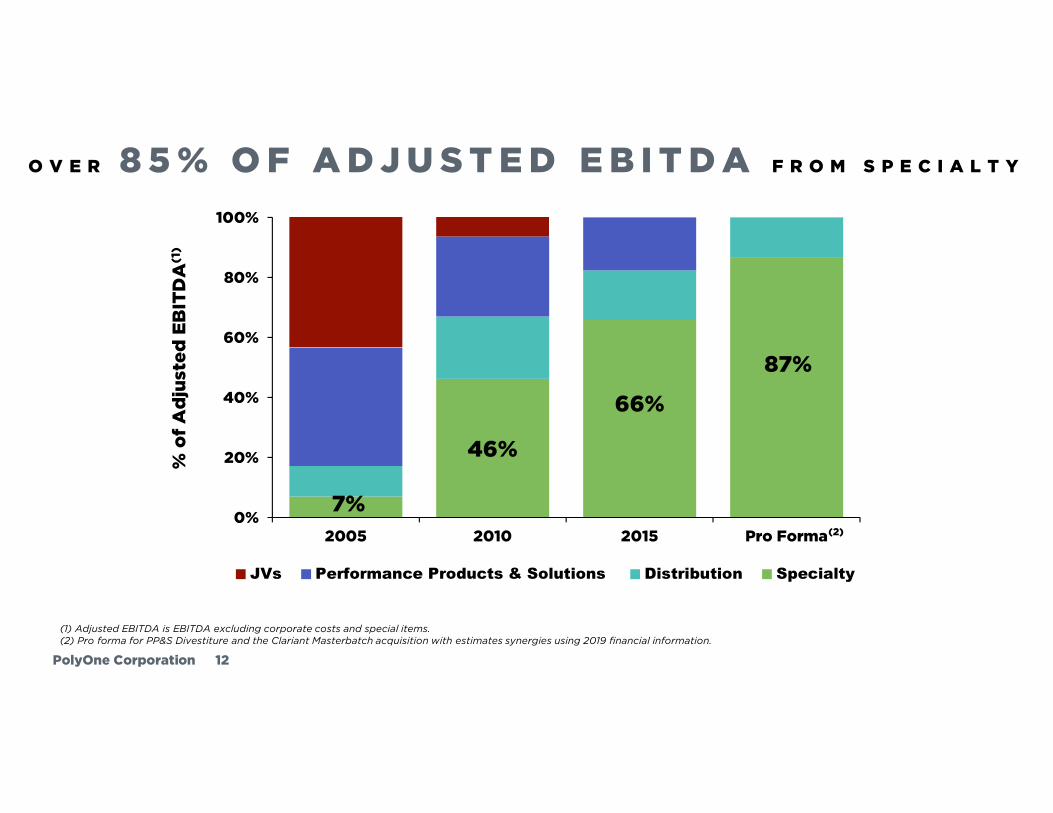
JVs Performance Products & Solutions Distribution Specialty


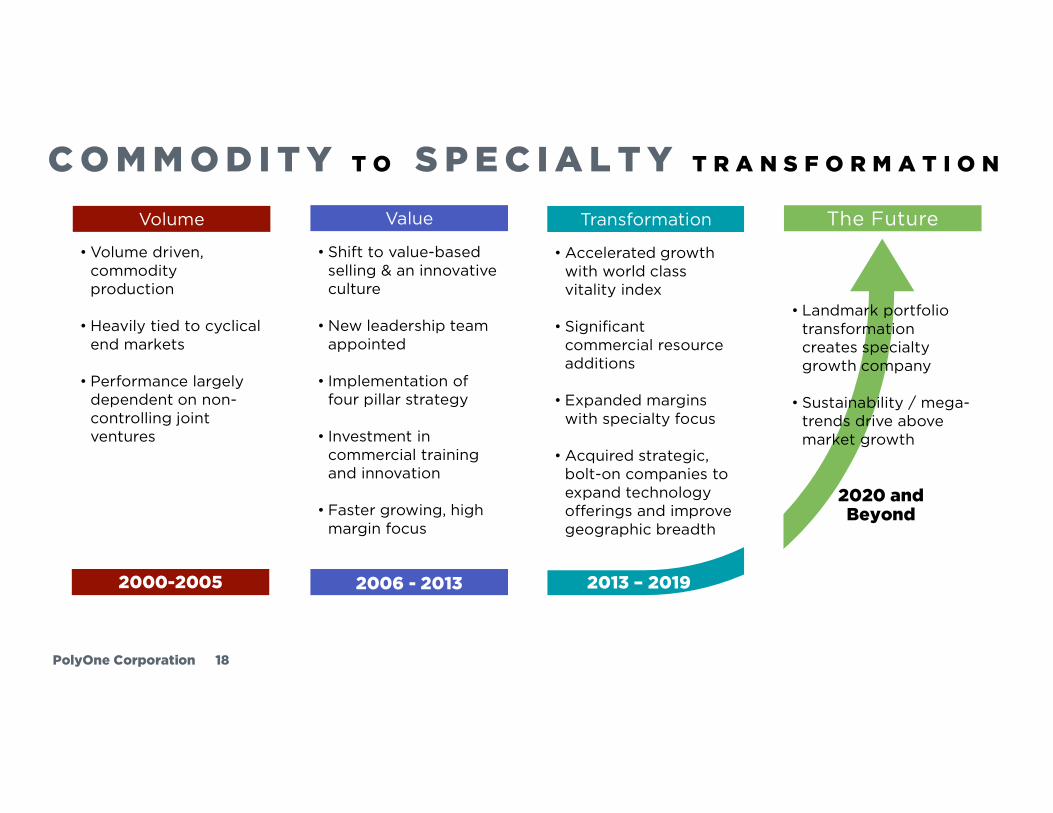
To be the world’s premier provider of specialized polymer
materials, services and solutions
To be the world’s premier provider of specialized polymer materials, services
and sustainable solutions

•
•
•
•
•
•
•
•
•
•
•
•
•
•
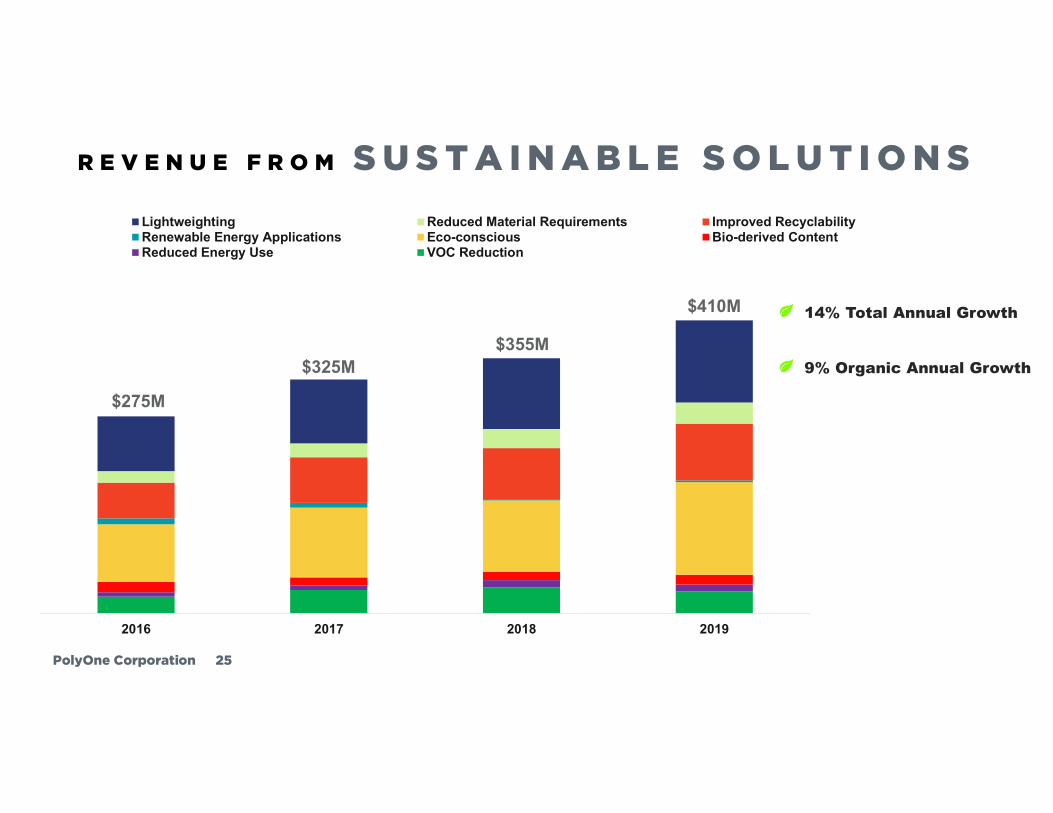
2016 2017 2018 2019
Lightweighting Reduced Material Requirements Improved RecyclabilityRenewable Energy Applications Eco-conscious Bio-derived ContentReduced Energy Use VOC Reduction
$275M
$325M$355M
$410M 14% Total Annual Growth
9% Organic Annual Growth


PolyOne Corporation 33
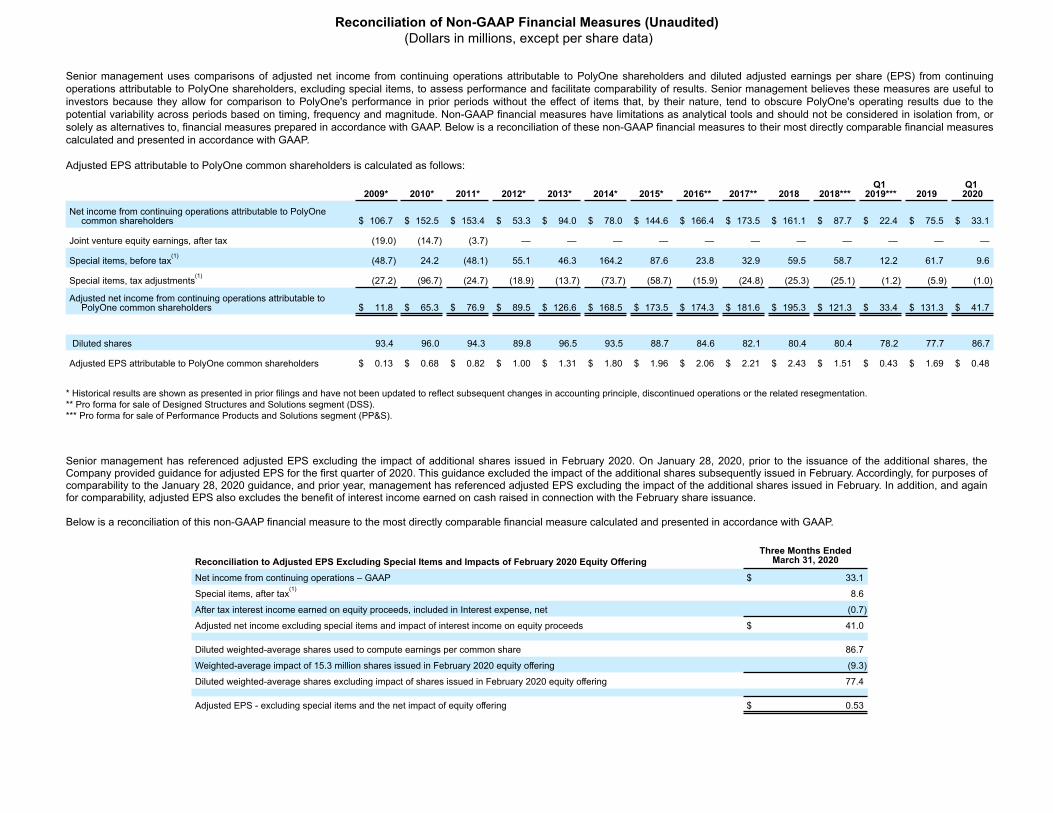
Senior management uses comparisons of adjusted net income from continuing operations attributable to PolyOne shareholders and diluted adjusted earnings per share (EPS) from continuingoperations attributable to PolyOne shareholders, excluding special items, to assess performance and facilitate comparability of results. Senior management believes these measures are useful toinvestors because they allow for comparison to PolyOne's performance in prior periods without the effect of items that, by their nature, tend to obscure PolyOne's operating results due to thepotential variability across periods based on timing, frequency and magnitude. Non-GAAP financial measures have limitations as analytical tools and should not be considered in isolation from, orsolely as alternatives to, financial measures prepared in accordance with GAAP. Below is a reconciliation of these non-GAAP financial measures to their most directly comparable financial measurescalculated and presented in accordance with GAAP.
Adjusted EPS attributable to PolyOne common shareholders is calculated as follows:
2009* 2010* 2011* 2012* 2013* 2014* 2015* 2016** 2017** 2018 2018***Q1
2019*** 2019Q1
2020
Net income from continuing operations attributable to PolyOne common shareholders $ 106.7 $ 152.5 $ 153.4 $ 53.3 $ 94.0 $ 78.0 $ 144.6 $ 166.4 $ 173.5 $ 161.1 $ 87.7 $ 22.4 $ 75.5 $ 33.1
Joint venture equity earnings, after tax (19.0) (14.7) (3.7) — — — — — — — — — — —
Special items, before tax(1) (48.7) 24.2 (48.1) 55.1 46.3 164.2 87.6 23.8 32.9 59.5 58.7 12.2 61.7 9.6
Special items, tax adjustments(1) (27.2) (96.7) (24.7) (18.9) (13.7) (73.7) (58.7) (15.9) (24.8) (25.3) (25.1) (1.2) (5.9) (1.0)
Adjusted net income from continuing operations attributable to PolyOne common shareholders $ 11.8 $ 65.3 $ 76.9 $ 89.5 $ 126.6 $ 168.5 $ 173.5 $ 174.3 $ 181.6 $ 195.3 $ 121.3 $ 33.4 $ 131.3 $ 41.7
Diluted shares 93.4 96.0 94.3 89.8 96.5 93.5 88.7 84.6 82.1 80.4 80.4 78.2 77.7 86.7
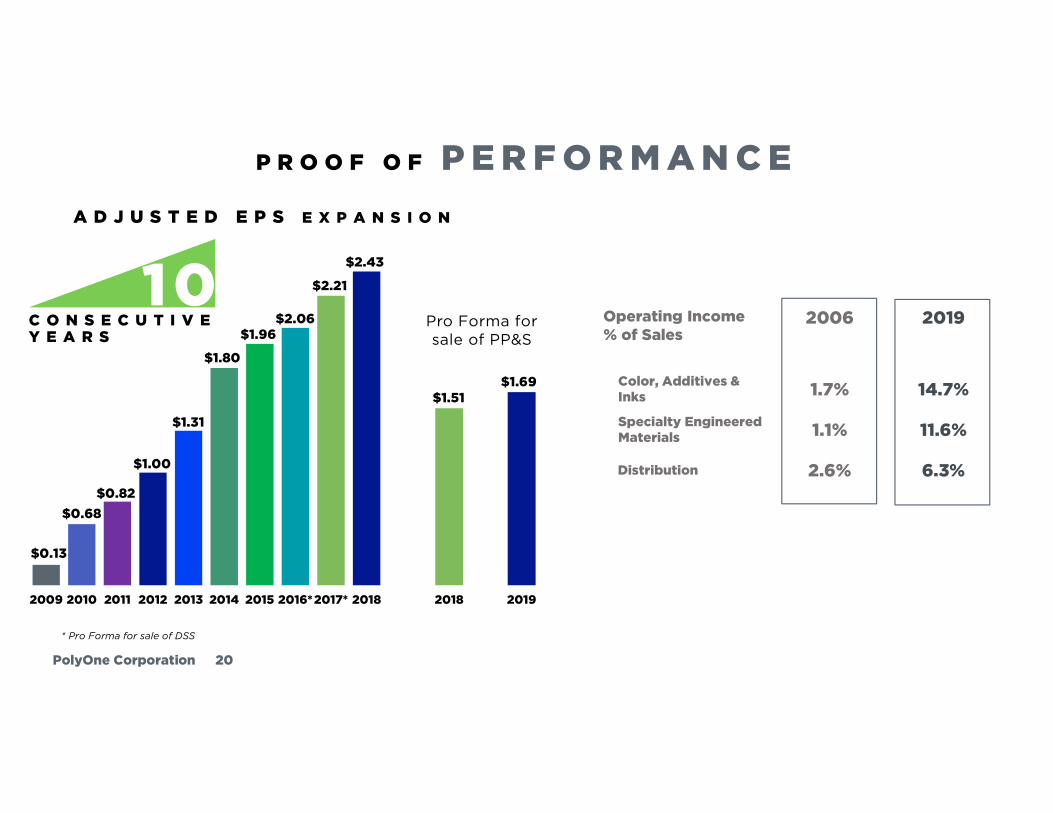
Adjusted EPS attributable to PolyOne common shareholders $ 0.13 $ 0.68 $ 0.82 $ 1.00 $ 1.31 $ 1.80 $ 1.96 $ 2.06 $ 2.21 $ 2.43 $ 1.51 $ 0.43 $ 1.69 $ 0.48
* Historical results are shown as presented in prior filings and have not been updated to reflect subsequent changes in accounting principle, discontinued operations or the related resegmentation.** Pro forma for sale of Designed Structures and Solutions segment (DSS).*** Pro forma for sale of Performance Products and Solutions segment (PP&S).
Senior management has referenced adjusted EPS excluding the impact of additional shares issued in February 2020. On January 28, 2020, prior to the issuance of the additional shares, theCompany provided guidance for adjusted EPS for the first quarter of 2020. This guidance excluded the impact of the additional shares subsequently issued in February. Accordingly, for purposes ofcomparability to the January 28, 2020 guidance, and prior year, management has referenced adjusted EPS excluding the impact of the additional shares issued in February. In addition, and againfor comparability, adjusted EPS also excludes the benefit of interest income earned on cash raised in connection with the February share issuance.
Below is a reconciliation of this non-GAAP financial measure to the most directly comparable financial measure calculated and presented in accordance with GAAP.
Reconciliation to Adjusted EPS Excluding Special Items and Impacts of February 2020 Equity OfferingThree Months Ended
March 31, 2020
Net income from continuing operations – GAAP $ 33.1
Special items, after tax(1) 8.6
After tax interest income earned on equity proceeds, included in Interest expense, net (0.7)
Adjusted net income excluding special items and impact of interest income on equity proceeds $ 41.0
Diluted weighted-average shares used to compute earnings per common share 86.7
Weighted-average impact of 15.3 million shares issued in February 2020 equity offering (9.3)
Diluted weighted-average shares excluding impact of shares issued in February 2020 equity offering 77.4
Adjusted EPS - excluding special items and the net impact of equity offering $ 0.53
Reconciliation of Non-GAAP Financial Measures (Unaudited) (Dollars in millions, except per share data)