Presentación Seilern IM: Funds Experience 2016
38
-
Upload
rankia -
Category
Economy & Finance
-
view
217 -
download
1
Transcript of Presentación Seilern IM: Funds Experience 2016
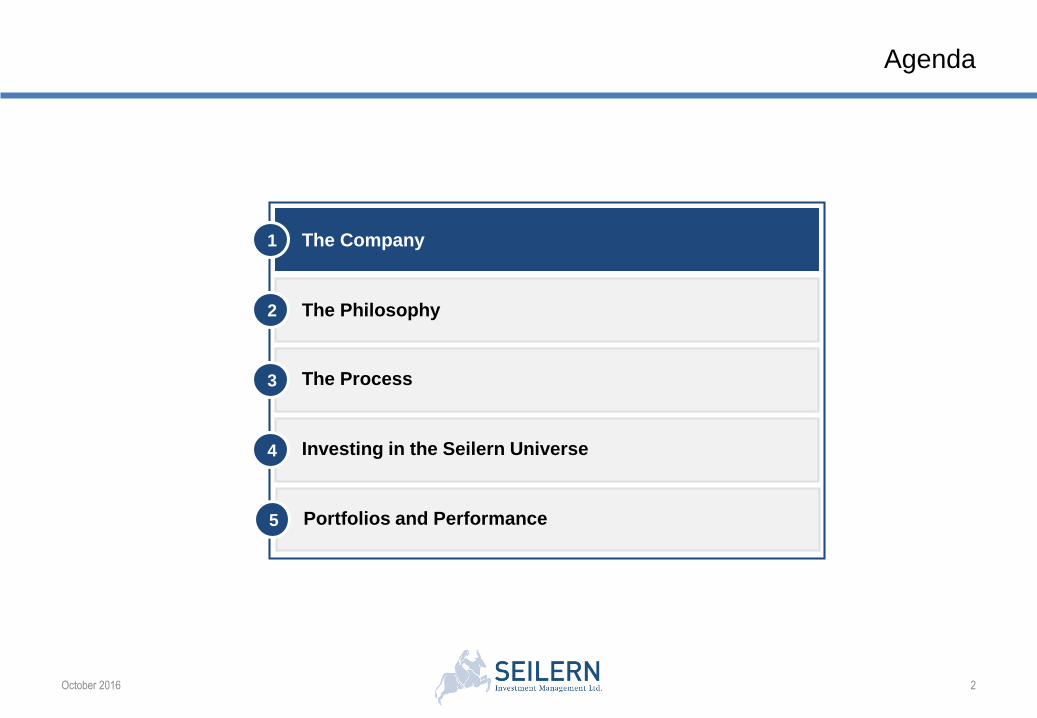
Agenda
October 2016 2
The Company1
The Process 3
The Philosophy2
4 Investing in the Seilern Universe
5 Portfolios and Performance
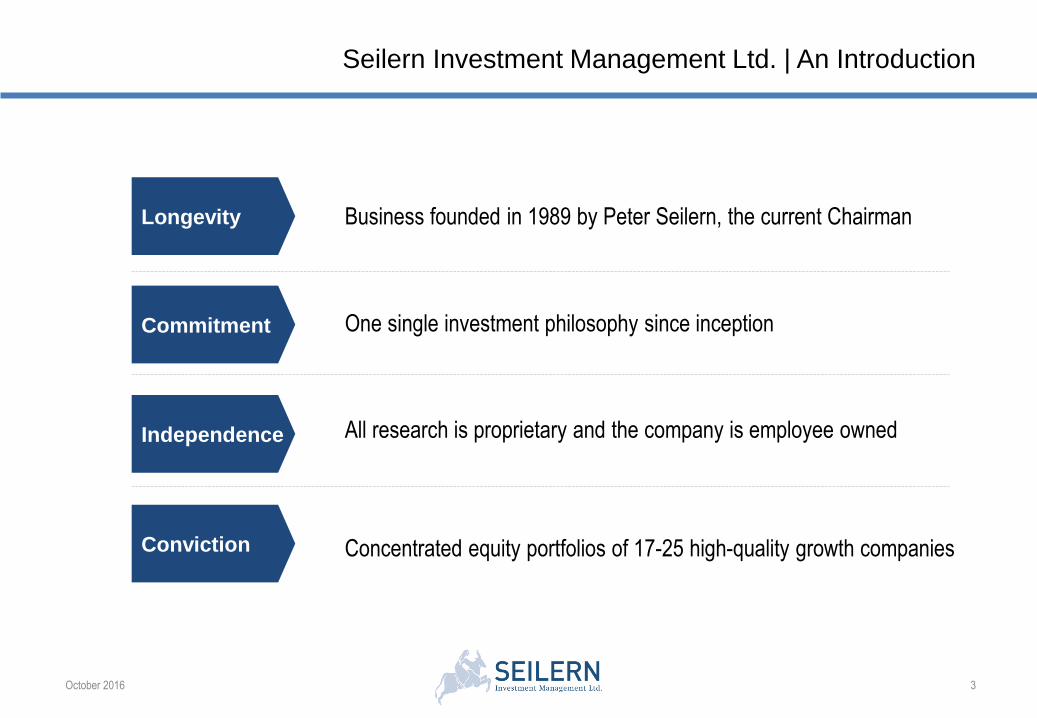
Seilern Investment Management Ltd. | An Introduction
October 2016 3
Conviction
Commitment
Independence
Longevity Business founded in 1989 by Peter Seilern, the current Chairman
One single investment philosophy since inception
Concentrated equity portfolios of 17-25 high-quality growth companies
All research is proprietary and the company is employee owned
October 2016 4
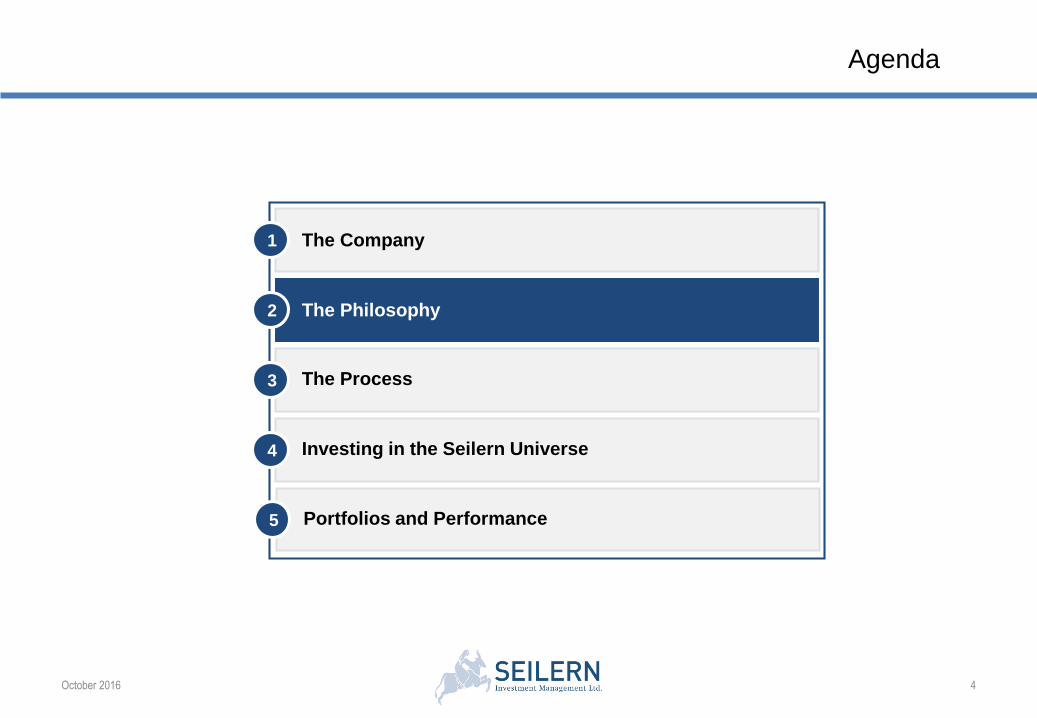
The Company1
The Process 3
The Philosophy2
4 Investing in the Seilern Universe
5 Portfolios and Performance
Agenda
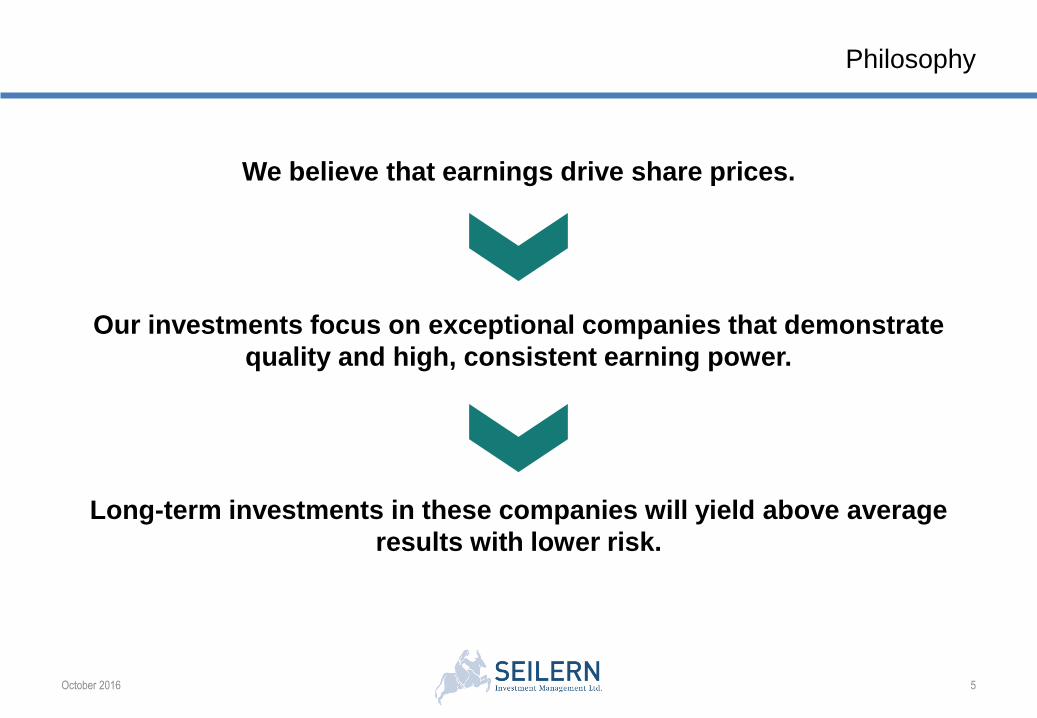
Philosophy
We believe that earnings drive share prices.
Our investments focus on exceptional companies that demonstrate
quality and high, consistent earning power.
Long-term investments in these companies will yield above average
results with lower risk.
October 2016 5
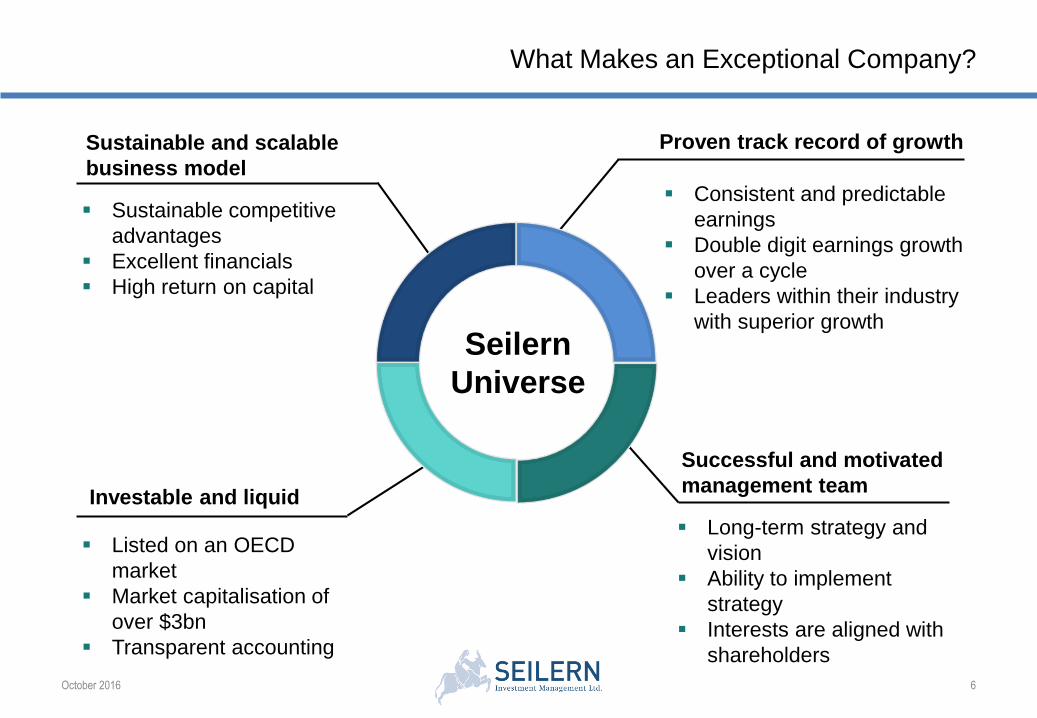
What Makes an Exceptional Company?
October 2016 6
Proven track record of growthSustainable and scalable
business model
Successful and motivated
management team Investable and liquid
Consistent and predictable
earnings
Double digit earnings growth
over a cycle
Leaders within their industry
with superior growth
Sustainable competitive
advantages
Excellent financials
High return on capital
Listed on an OECD
market
Market capitalisation of
over $3bn
Transparent accounting
Long-term strategy and
vision
Ability to implement
strategy
Interests are aligned with
shareholders
Seilern
Universe
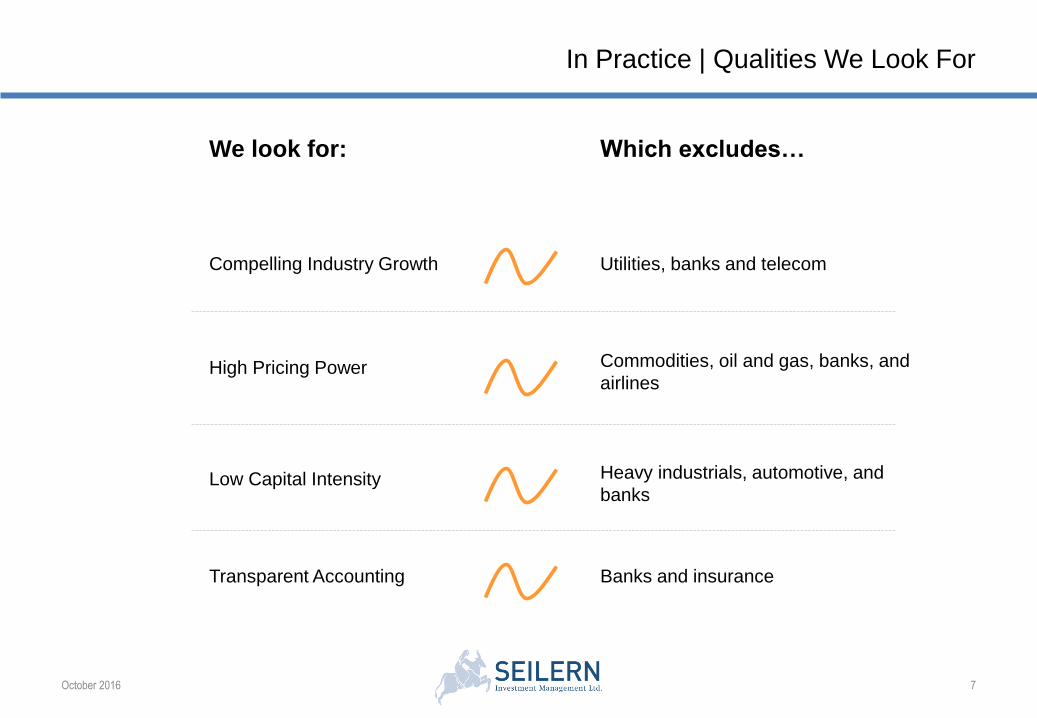
In Practice | Qualities We Look For
October 2016 7
Compelling Industry Growth Utilities, banks and telecom
High Pricing Power Commodities, oil and gas, banks, and
airlines
Low Capital Intensity Heavy industrials, automotive, and
banks
Transparent Accounting Banks and insurance
We look for: Which excludes…
October 2016 8
The Company1
The Process 3
The Philosophy2
4 Investing in the Seilern Universe
5 Portfolios and Performance
Agenda
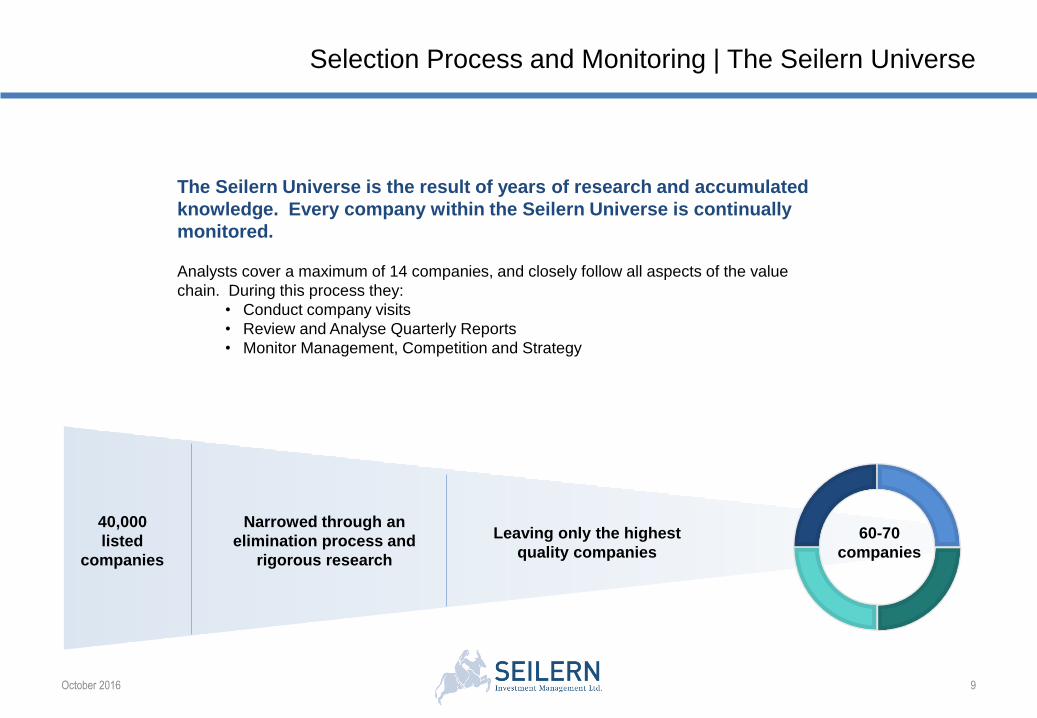
Selection Process and Monitoring | The Seilern Universe
October 2016 9
The Seilern Universe is the result of years of research and accumulated
knowledge. Every company within the Seilern Universe is continually
monitored.
Analysts cover a maximum of 14 companies, and closely follow all aspects of the value
chain. During this process they:
• Conduct company visits
• Review and Analyse Quarterly Reports
• Monitor Management, Competition and Strategy
60-70
companies
Narrowed through an
elimination process and
rigorous research
40,000
listed
companies
Leaving only the highest
quality companies
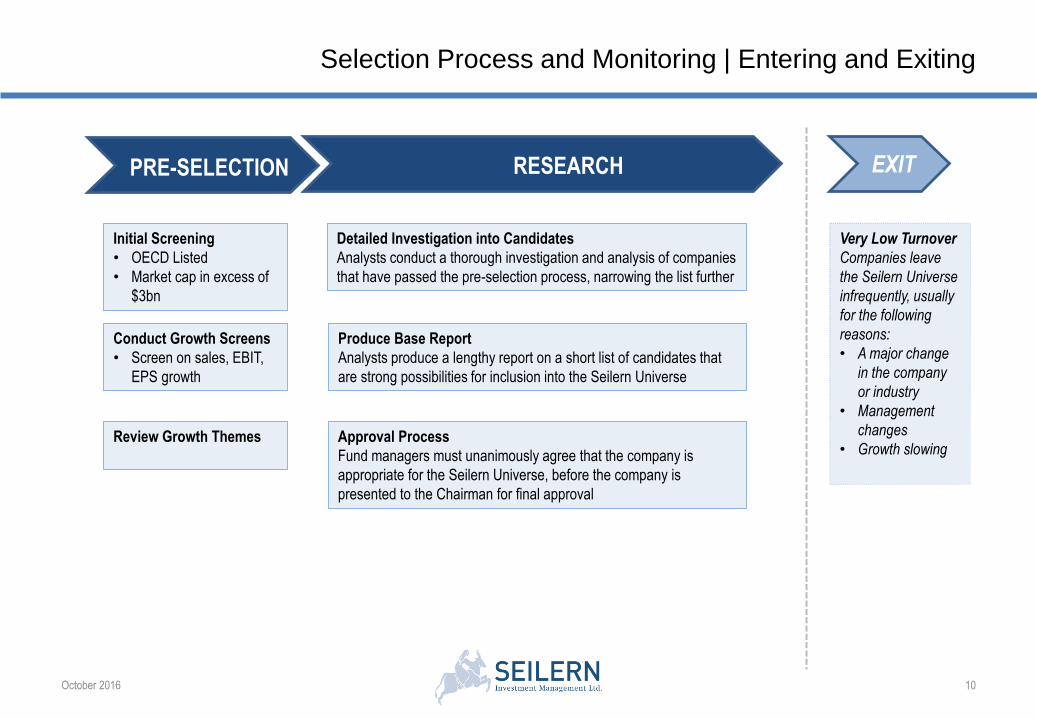
Selection Process and Monitoring | Entering and Exiting
October 2016 10
RESEARCH EXIT
Initial Screening
• OECD Listed
• Market cap in excess of
$3bn
Detailed Investigation into Candidates
Analysts conduct a thorough investigation and analysis of companies
that have passed the pre-selection process, narrowing the list further
Approval Process
Fund managers must unanimously agree that the company is
appropriate for the Seilern Universe, before the company is
presented to the Chairman for final approval
Conduct Growth Screens
• Screen on sales, EBIT,
EPS growth
Review Growth Themes
PRE-SELECTION
Very Low Turnover
Companies leave
the Seilern Universe
infrequently, usually
for the following
reasons:
• A major change
in the company
or industry
• Management
changes
• Growth slowing
Produce Base Report
Analysts produce a lengthy report on a short list of candidates that
are strong possibilities for inclusion into the Seilern Universe
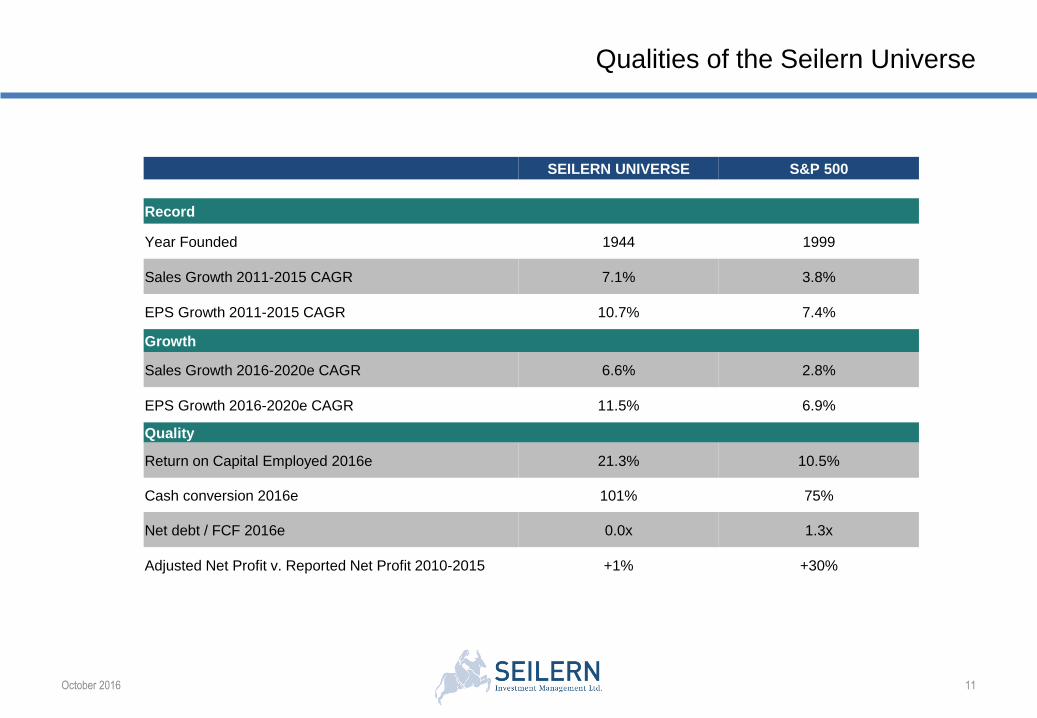
Qualities of the Seilern Universe
October 2016 11
SEILERN UNIVERSE S&P 500
Record
Year Founded 1944 1999
Sales Growth 2011-2015 CAGR 7.1% 3.8%
EPS Growth 2011-2015 CAGR 10.7% 7.4%
Growth
Sales Growth 2016-2020e CAGR 6.6% 2.8%
EPS Growth 2016-2020e CAGR 11.5% 6.9%
Quality
Return on Capital Employed 2016e 21.3% 10.5%
Cash conversion 2016e 101% 75%
Net debt / FCF 2016e 0.0x 1.3x
Adjusted Net Profit v. Reported Net Profit 2010-2015 +1% +30%
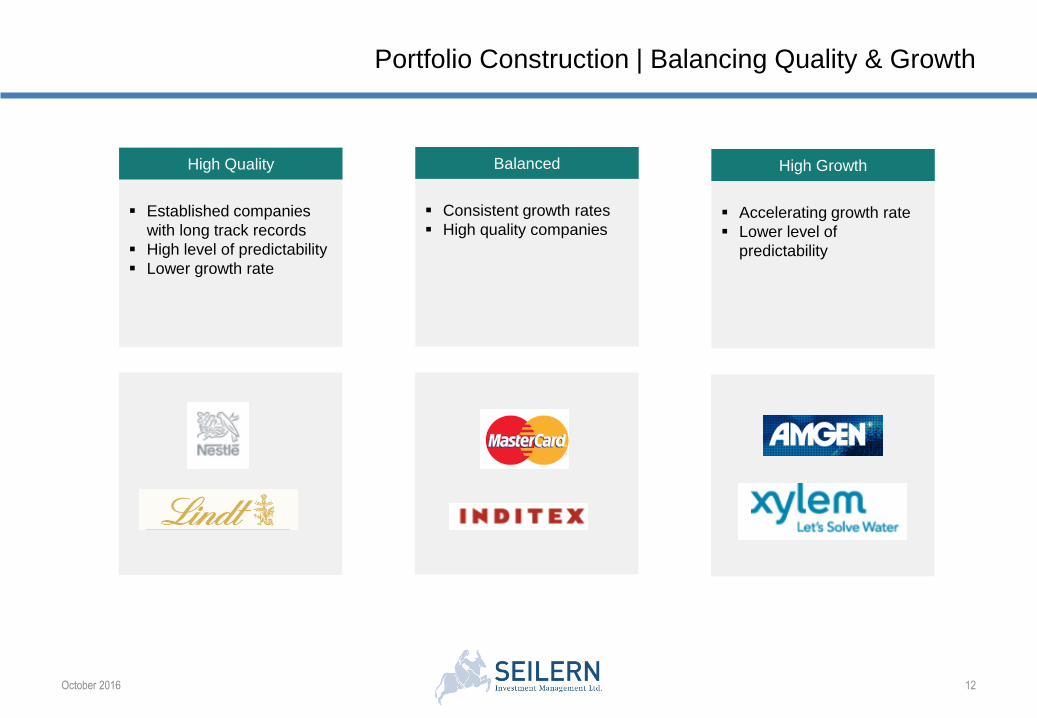
Portfolio Construction | Balancing Quality & Growth
October 2016 12
Accelerating growth rate
Lower level of
predictability
Established companies
with long track records
High level of predictability
Lower growth rate
Consistent growth rates
High quality companies
High Growth High Quality Balanced
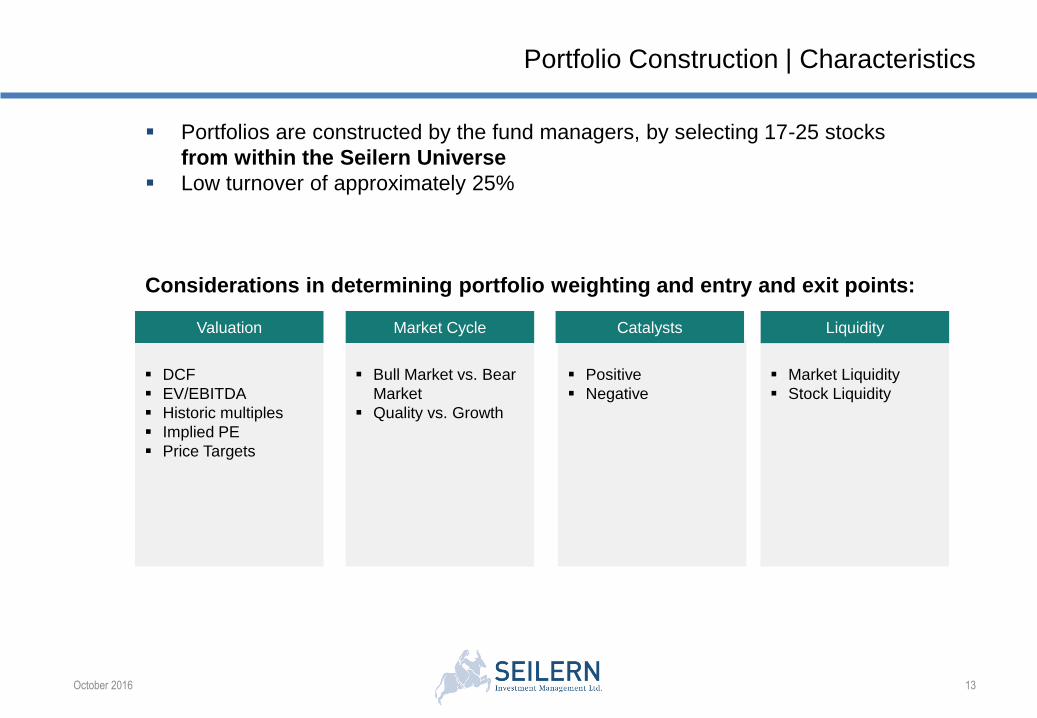
Portfolio Construction | Characteristics
October 2015
13
Portfolios are constructed by the fund managers, by selecting 17-25 stocks
from within the Seilern Universe
Low turnover of approximately 25%
Considerations in determining portfolio weighting and entry and exit points:
DCF
EV/EBITDA
Historic multiples
Implied PE
Price Targets
Positive
Negative
Bull Market vs. Bear
Market
Quality vs. Growth
Valuation CatalystsMarket Cycle
Market Liquidity
Stock Liquidity
Liquidity
October 2016
October 2016 14
The Company1
The Process 3
The Philosophy2
4 Investing in the Seilern Universe
5 Portfolios and Performance
Agenda
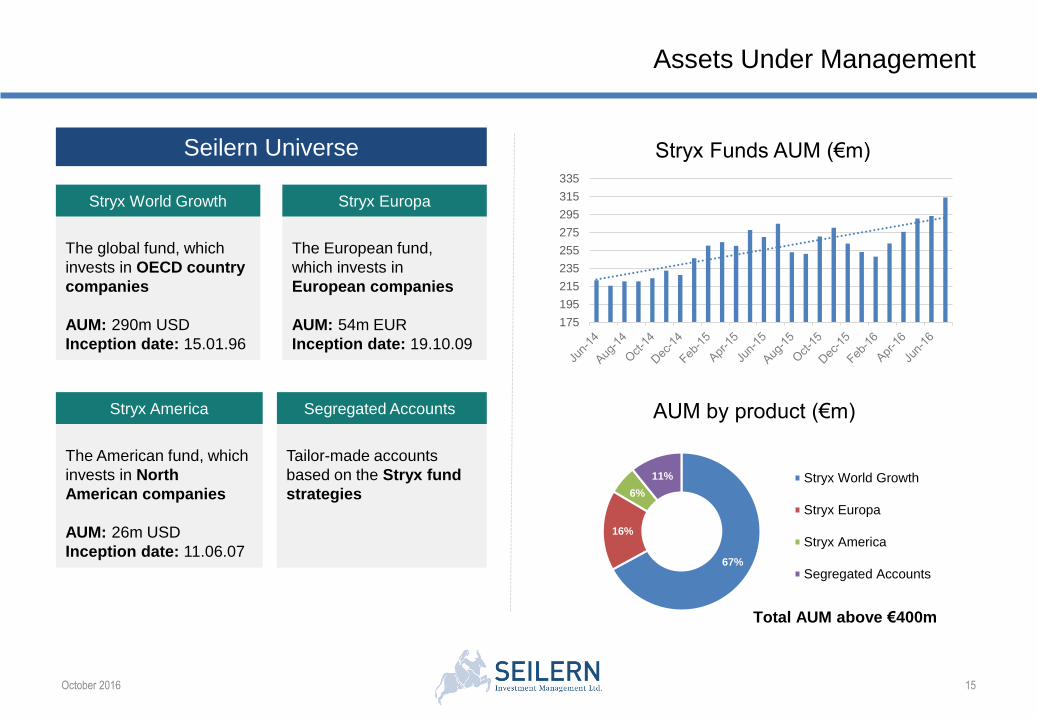
Assets Under Management
October 2016 15
The global fund, which
invests in OECD country
companies
AUM: 290m USD
Inception date: 15.01.96
The American fund, which
invests in North
American companies
AUM: 26m USD
Inception date: 11.06.07
The European fund,
which invests in
European companies
AUM: 54m EUR
Inception date: 19.10.09
Stryx World Growth
Stryx America
Stryx Europa
Tailor-made accounts
based on the Stryx fund
strategies
Segregated Accounts
67%
16%
6%
11%
AUM by product (€m)
Stryx World Growth
Stryx Europa
Stryx America
Segregated Accounts
Total AUM above €400m
175
195
215
235
255
275
295
315
335
Stryx Funds AUM (€m)Seilern Universe
October 2016 16
The Company1
The Process 3
The Philosophy2
4 Investing in the Seilern Universe
5 Portfolios and Performance
Agenda
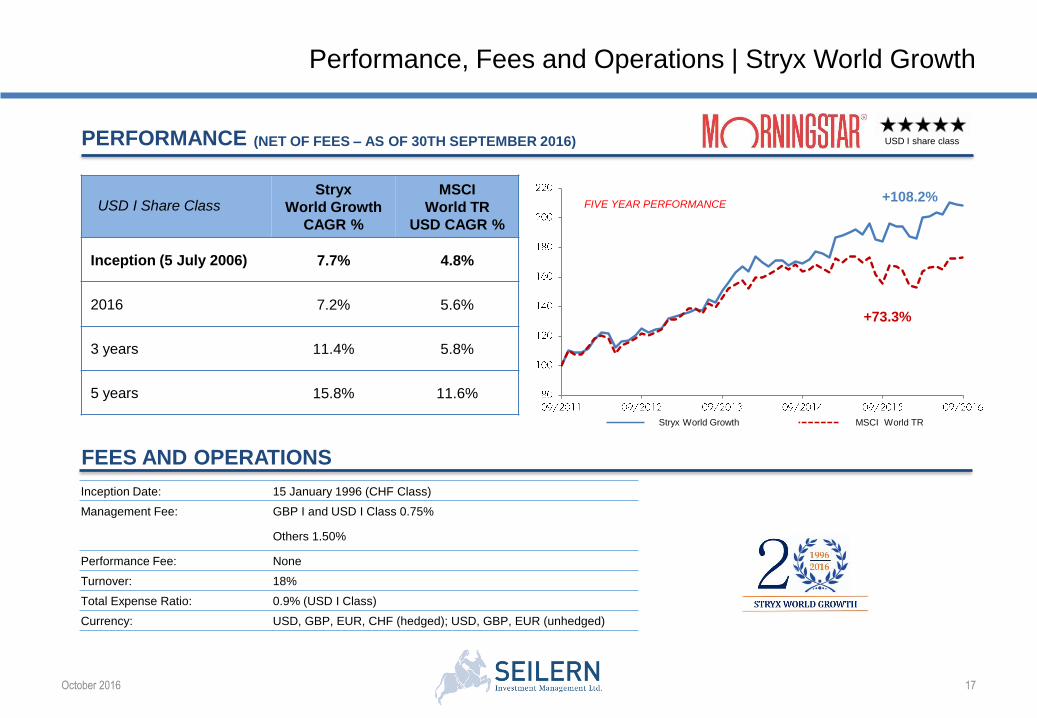
Performance, Fees and Operations | Stryx World Growth
October 2016
Stryx
World Growth
CAGR %
MSCI
World TR
USD CAGR %
Inception (5 July 2006) 7.7% 4.8%
2016 7.2% 5.6%
3 years 11.4% 5.8%
5 years 15.8% 11.6%
PERFORMANCE (NET OF FEES – AS OF 30TH SEPTEMBER 2016)
FEES AND OPERATIONS
USD I share class
Inception Date: 15 January 1996 (CHF Class)
Management Fee: GBP I and USD I Class 0.75%
Others 1.50%
Performance Fee: None
Turnover: 18%
Total Expense Ratio: 0.9% (USD I Class)
Currency: USD, GBP, EUR, CHF (hedged); USD, GBP, EUR (unhedged)
FIVE YEAR PERFORMANCEUSD I Share Class
Stryx World Growth MSCI World TR
+108.2%
+73.3%
17
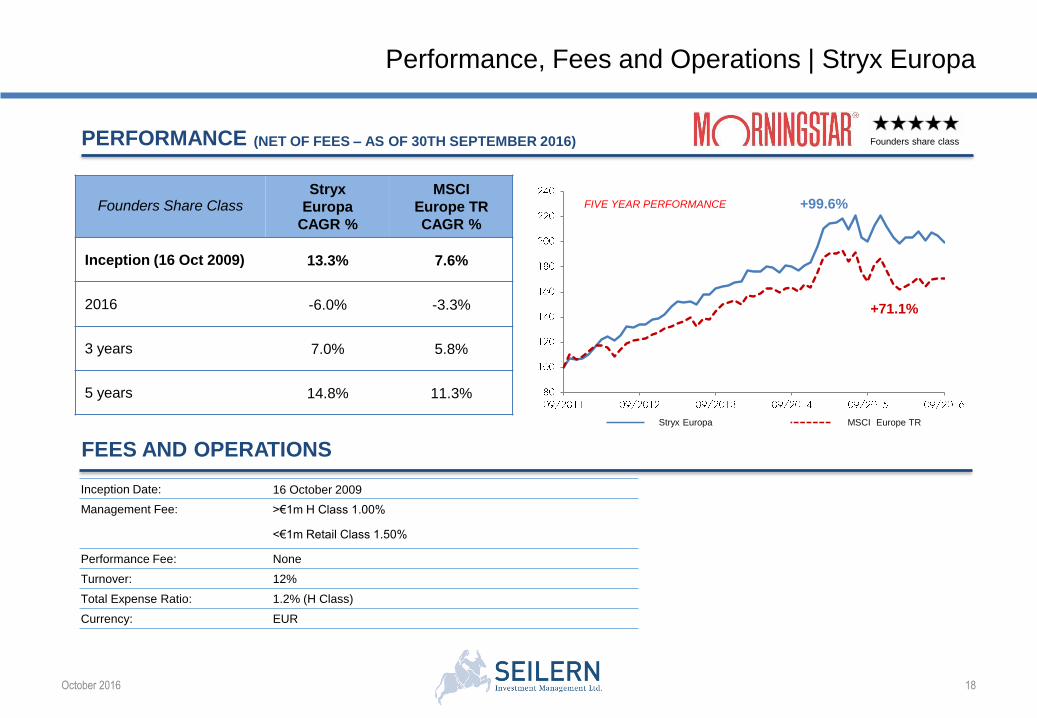
Performance, Fees and Operations | Stryx Europa
October 2016
Stryx
Europa
CAGR %
MSCI
Europe TR
CAGR %
Inception (16 Oct 2009) 13.3% 7.6%
2016 -6.0% -3.3%
3 years 7.0% 5.8%
5 years 14.8% 11.3%
PERFORMANCE (NET OF FEES – AS OF 30TH SEPTEMBER 2016)
FEES AND OPERATIONS
Inception Date: 16 October 2009
Management Fee: >€1m H Class 1.00%
<€1m Retail Class 1.50%
Performance Fee: None
Turnover: 12%
Total Expense Ratio: 1.2% (H Class)
Currency: EUR
FIVE YEAR PERFORMANCE
Founders share class
Founders Share Class
+71.1%
+99.6%
Stryx Europa MSCI Europe TR
18
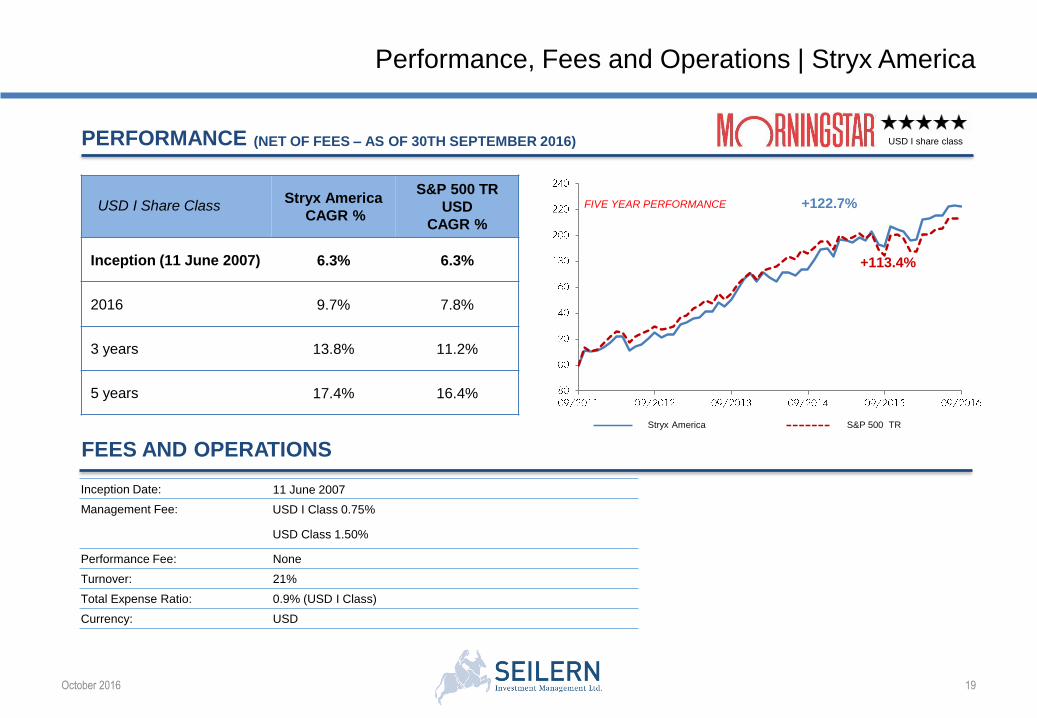
Performance, Fees and Operations | Stryx America
October 2016
Stryx America
CAGR %
S&P 500 TR
USD
CAGR %
Inception (11 June 2007) 6.3% 6.3%
2016 9.7% 7.8%
3 years 13.8% 11.2%
5 years 17.4% 16.4%
PERFORMANCE (NET OF FEES – AS OF 30TH SEPTEMBER 2016)
FEES AND OPERATIONS
Inception Date: 11 June 2007
Management Fee: USD I Class 0.75%
USD Class 1.50%
Performance Fee: None
Turnover: 21%
Total Expense Ratio: 0.9% (USD I Class)
Currency: USD
FIVE YEAR PERFORMANCEUSD I Share Class
USD I share class
Stryx America S&P 500 TR
+122.7%
+113.4%
19
In Summary
Our investment philosophy is
anchored in the belief that
earnings drive share prices.
October 2016
1 2
Through in-depth proprietary
research, we seek out
companies that demonstrate
both quality and growth.
We are extremely selective. We
choose 60-70 of the very best for
inclusion into our investment
universe – the Seilern Universe.
3 4
We are long-term investors.
Companies within the Seilern
Universe perform across market
cycles.
20
October 2016
Frequently Asked
Questions
21
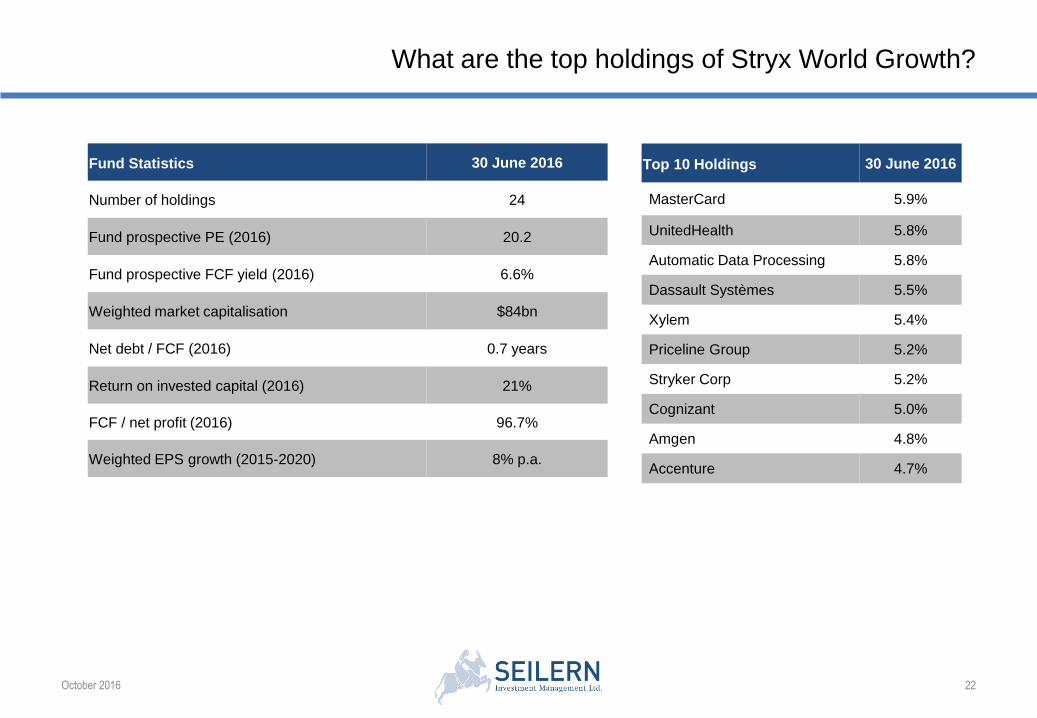
What are the top holdings of Stryx World Growth?
October 2016 22
Top 10 Holdings 30 June 2016
MasterCard 5.9%
UnitedHealth 5.8%
Automatic Data Processing 5.8%
Dassault Systèmes 5.5%
Xylem 5.4%
Priceline Group 5.2%
Stryker Corp 5.2%
Cognizant 5.0%
Amgen 4.8%
Accenture 4.7%
Fund Statistics 30 June 2016
Number of holdings 24
Fund prospective PE (2016) 20.2
Fund prospective FCF yield (2016) 6.6%
Weighted market capitalisation $84bn
Net debt / FCF (2016) 0.7 years
Return on invested capital (2016) 21%
FCF / net profit (2016) 96.7%
Weighted EPS growth (2015-2020) 8% p.a.
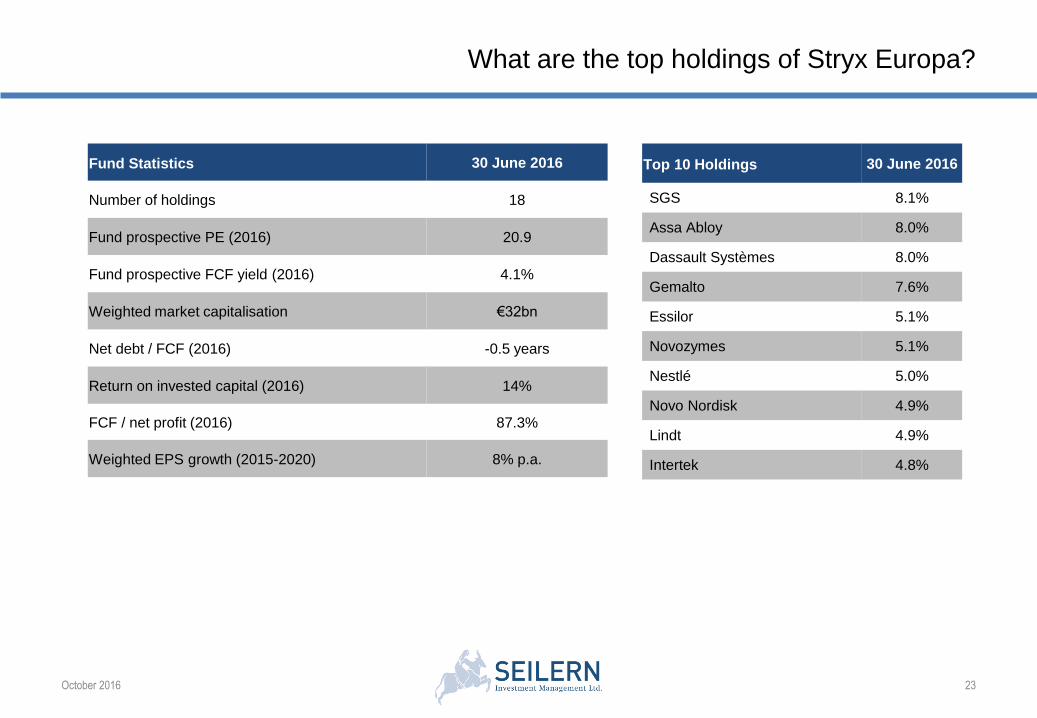
What are the top holdings of Stryx Europa?
October 2016 23
Top 10 Holdings 30 June 2016
SGS 8.1%
Assa Abloy 8.0%
Dassault Systèmes 8.0%
Gemalto 7.6%
Essilor 5.1%
Novozymes 5.1%
Nestlé 5.0%
Novo Nordisk 4.9%
Lindt 4.9%
Intertek 4.8%
Fund Statistics 30 June 2016
Number of holdings 18
Fund prospective PE (2016) 20.9
Fund prospective FCF yield (2016) 4.1%
Weighted market capitalisation €32bn
Net debt / FCF (2016) -0.5 years
Return on invested capital (2016) 14%
FCF / net profit (2016) 87.3%
Weighted EPS growth (2015-2020) 8% p.a.
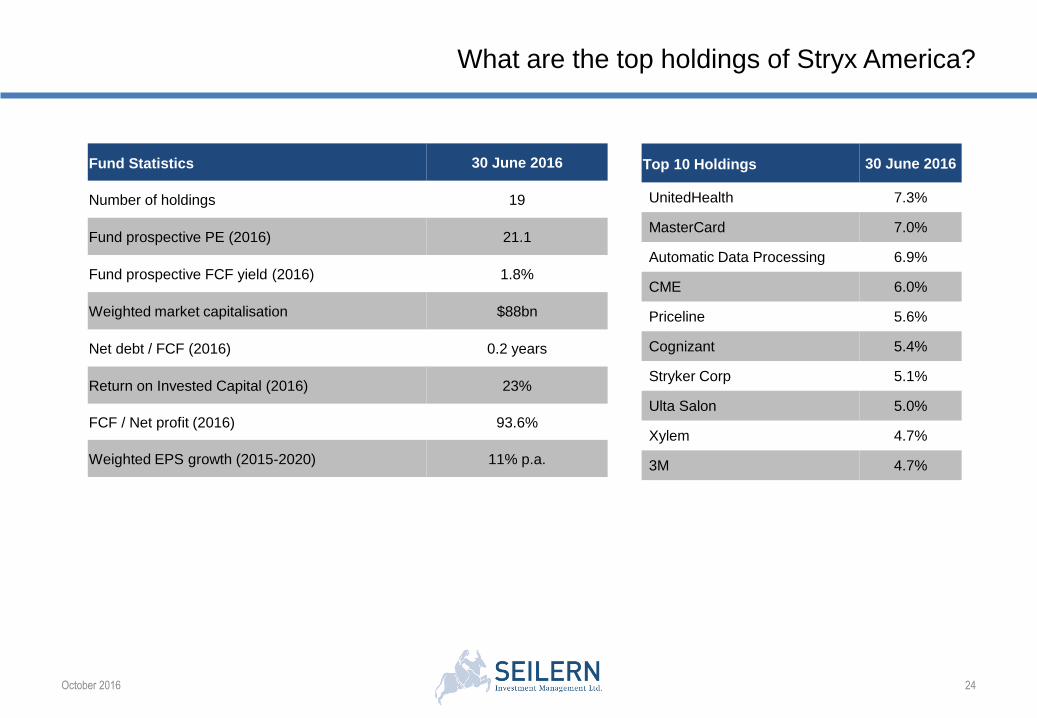
What are the top holdings of Stryx America?
October 2016 24
Top 10 Holdings 30 June 2016
UnitedHealth 7.3%
MasterCard 7.0%
Automatic Data Processing 6.9%
CME 6.0%
Priceline 5.6%
Cognizant 5.4%
Stryker Corp 5.1%
Ulta Salon 5.0%
Xylem 4.7%
3M 4.7%
Fund Statistics 30 June 2016
Number of holdings 19
Fund prospective PE (2016) 21.1
Fund prospective FCF yield (2016) 1.8%
Weighted market capitalisation $88bn
Net debt / FCF (2016) 0.2 years
Return on Invested Capital (2016) 23%
FCF / Net profit (2016) 93.6%
Weighted EPS growth (2015-2020) 11% p.a.
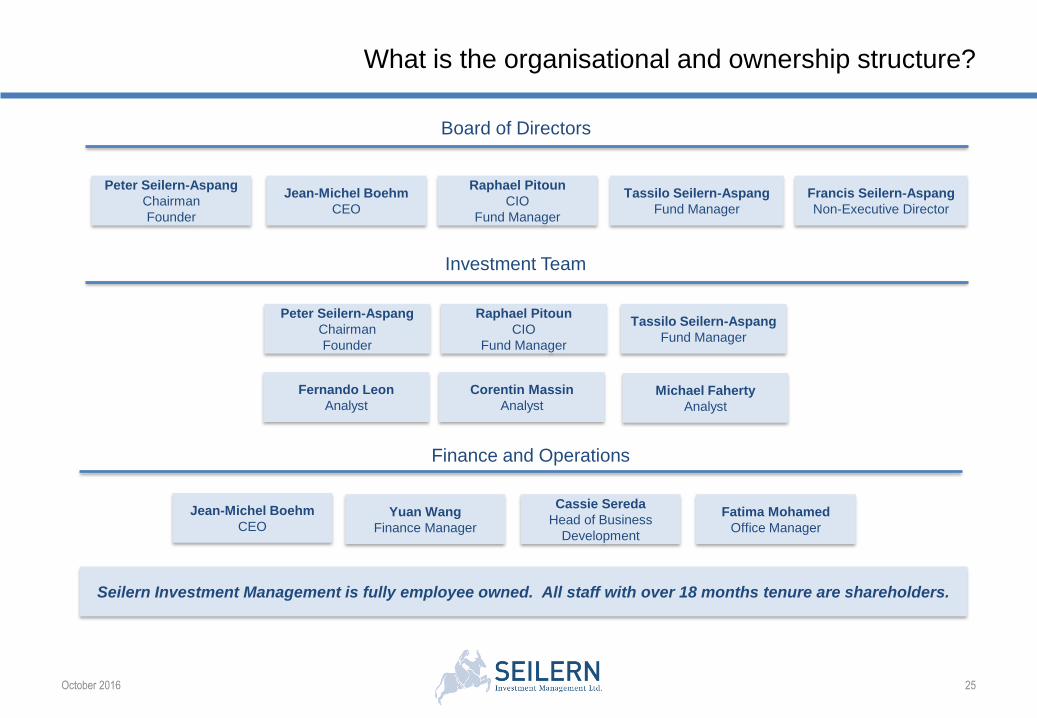
What is the organisational and ownership structure?
October 2016 25
Board of Directors
Investment Team
Finance and Operations
Peter Seilern-Aspang
Chairman
Founder
Francis Seilern-Aspang
Non-Executive Director
Jean-Michel Boehm
CEO
Tassilo Seilern-Aspang
Fund Manager
Raphael Pitoun
CIO
Fund Manager
Yuan Wang
Finance Manager
Cassie Sereda
Head of Business
Development
Fatima Mohamed
Office Manager
Raphael Pitoun
CIO
Fund Manager
Tassilo Seilern-Aspang
Fund Manager
Fernando Leon
Analyst
Corentin Massin
Analyst
Jean-Michel Boehm
CEO
Peter Seilern-Aspang
Chairman
Founder
Seilern Investment Management is fully employee owned. All staff with over 18 months tenure are shareholders.
Michael Faherty
Analyst
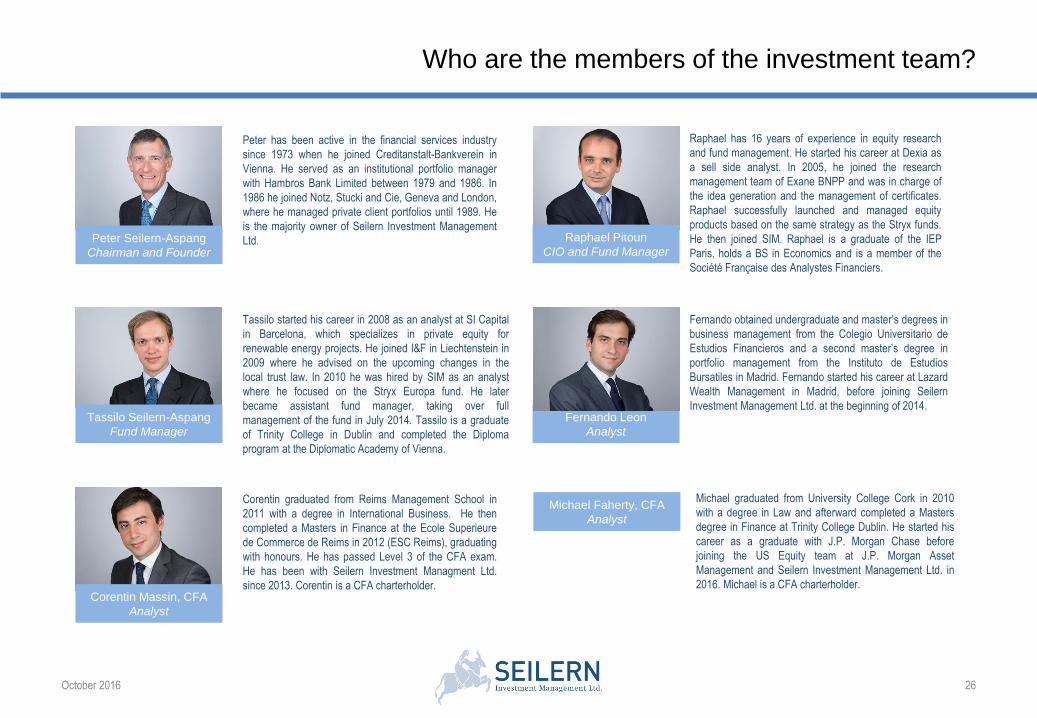
Who are the members of the investment team?
October 2016 26
Raphael Pitoun
CIO and Fund Manager
Tassilo Seilern-Aspang
Fund Manager
Fernando Leon
Analyst
Corentin Massin, CFA
Analyst
Peter Seilern-Aspang
Chairman and Founder
Peter has been active in the financial services industry
since 1973 when he joined Creditanstalt-Bankverein in
Vienna. He served as an institutional portfolio manager
with Hambros Bank Limited between 1979 and 1986. In
1986 he joined Notz, Stucki and Cie, Geneva and London,
where he managed private client portfolios until 1989. He
is the majority owner of Seilern Investment Management
Ltd.
Tassilo started his career in 2008 as an analyst at SI Capital
in Barcelona, which specializes in private equity for
renewable energy projects. He joined I&F in Liechtenstein in
2009 where he advised on the upcoming changes in the
local trust law. In 2010 he was hired by SIM as an analyst
where he focused on the Stryx Europa fund. He later
became assistant fund manager, taking over full
management of the fund in July 2014. Tassilo is a graduate
of Trinity College in Dublin and completed the Diploma
program at the Diplomatic Academy of Vienna.
Corentin graduated from Reims Management School in
2011 with a degree in International Business. He then
completed a Masters in Finance at the Ecole Superieure
de Commerce de Reims in 2012 (ESC Reims), graduating
with honours. He has passed Level 3 of the CFA exam.
He has been with Seilern Investment Managment Ltd.
since 2013. Corentin is a CFA charterholder.
Raphael has 16 years of experience in equity research
and fund management. He started his career at Dexia as
a sell side analyst. In 2005, he joined the research
management team of Exane BNPP and was in charge of
the idea generation and the management of certificates.
Raphael successfully launched and managed equity
products based on the same strategy as the Stryx funds.
He then joined SIM. Raphael is a graduate of the IEP
Paris, holds a BS in Economics and is a member of the
Société Française des Analystes Financiers.
Fernando obtained undergraduate and master’s degrees in
business management from the Colegio Universitario de
Estudios Financieros and a second master’s degree in
portfolio management from the Instituto de Estudios
Bursatiles in Madrid. Fernando started his career at Lazard
Wealth Management in Madrid, before joining Seilern
Investment Management Ltd. at the beginning of 2014.
Michael graduated from University College Cork in 2010
with a degree in Law and afterward completed a Masters
degree in Finance at Trinity College Dublin. He started his
career as a graduate with J.P. Morgan Chase before
joining the US Equity team at J.P. Morgan Asset
Management and Seilern Investment Management Ltd. in
2016. Michael is a CFA charterholder.
Michael Faherty, CFA
Analyst
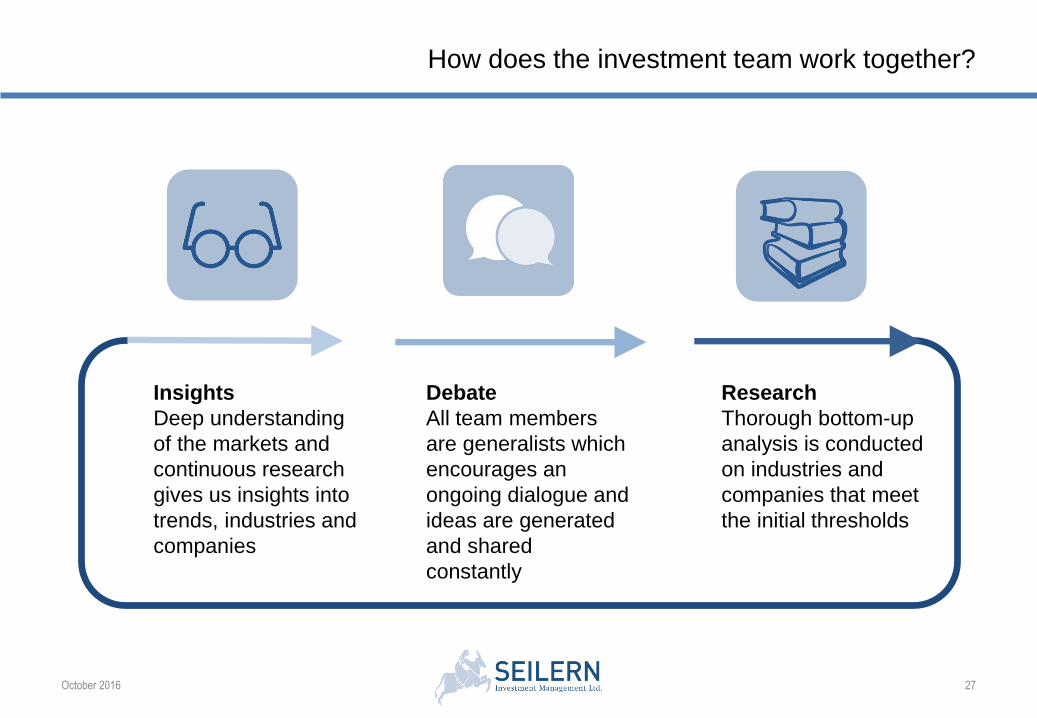
How does the investment team work together?
October 2016 27
Insights
Deep understanding
of the markets and
continuous research
gives us insights into
trends, industries and
companies
Debate
All team members
are generalists which
encourages an
ongoing dialogue and
ideas are generated
and shared
constantly
Research
Thorough bottom-up
analysis is conducted
on industries and
companies that meet
the initial thresholds
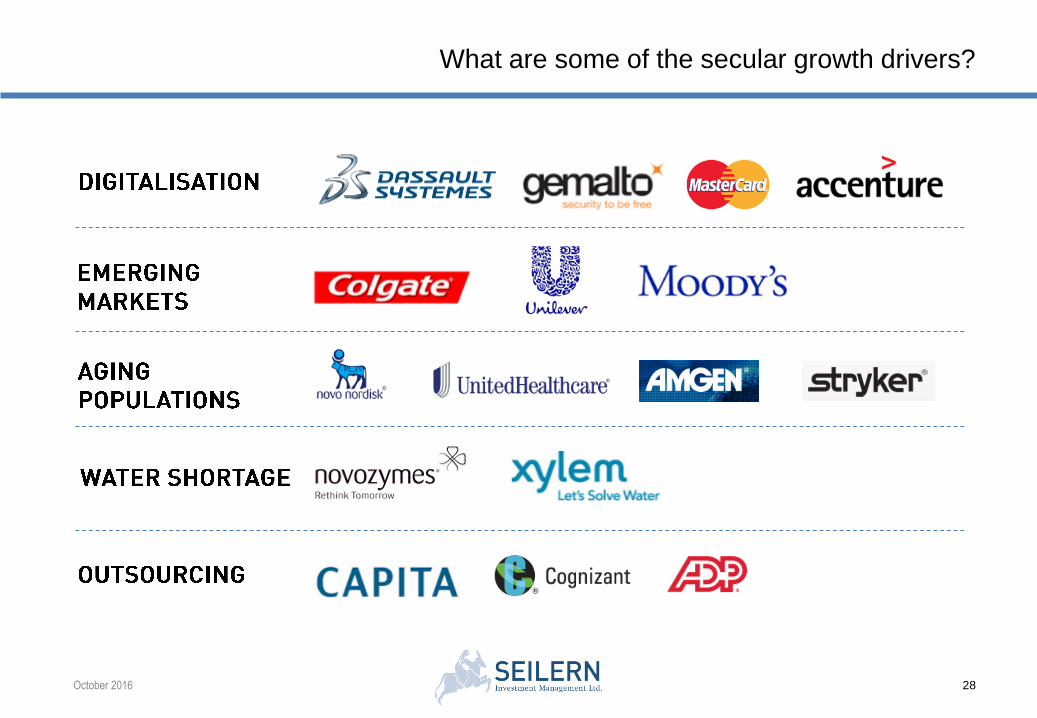
What are some of the secular growth drivers?
28October 2016
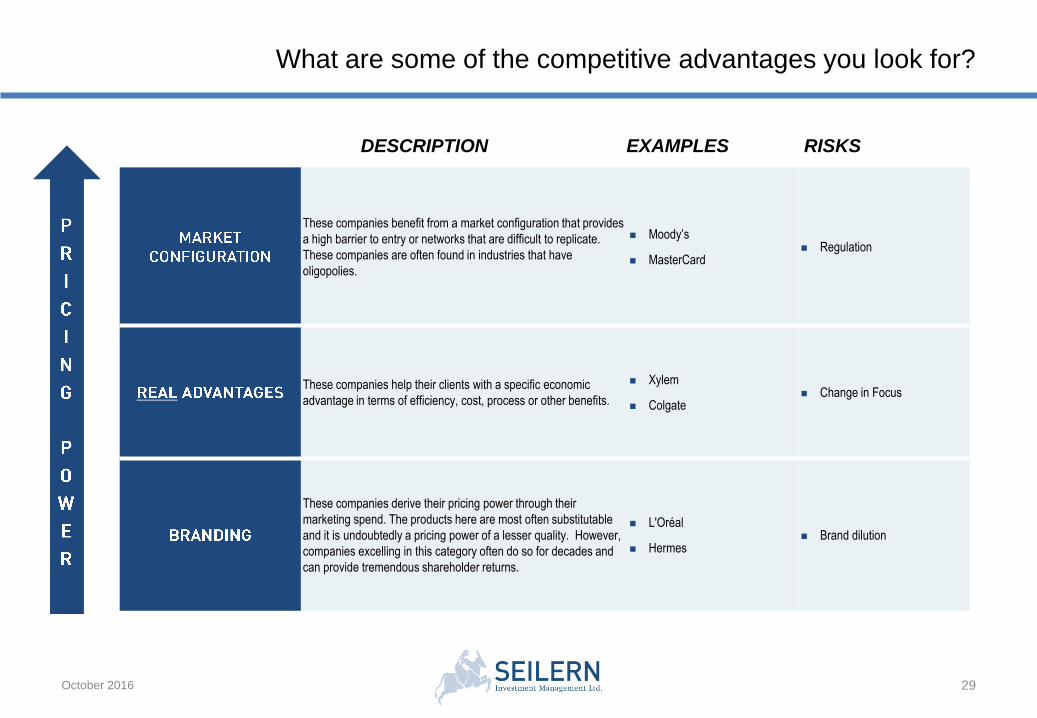
What are some of the competitive advantages you look for?
October 2016 29
These companies benefit from a market configuration that provides
a high barrier to entry or networks that are difficult to replicate.
These companies are often found in industries that have
oligopolies.
Moody’s
MasterCard Regulation
These companies help their clients with a specific economic
advantage in terms of efficiency, cost, process or other benefits.
Xylem
Colgate Change in Focus
These companies derive their pricing power through their
marketing spend. The products here are most often substitutable
and it is undoubtedly a pricing power of a lesser quality. However,
companies excelling in this category often do so for decades and
can provide tremendous shareholder returns.
L'Oréal
Hermes Brand dilution
DESCRIPTION EXAMPLES RISKS
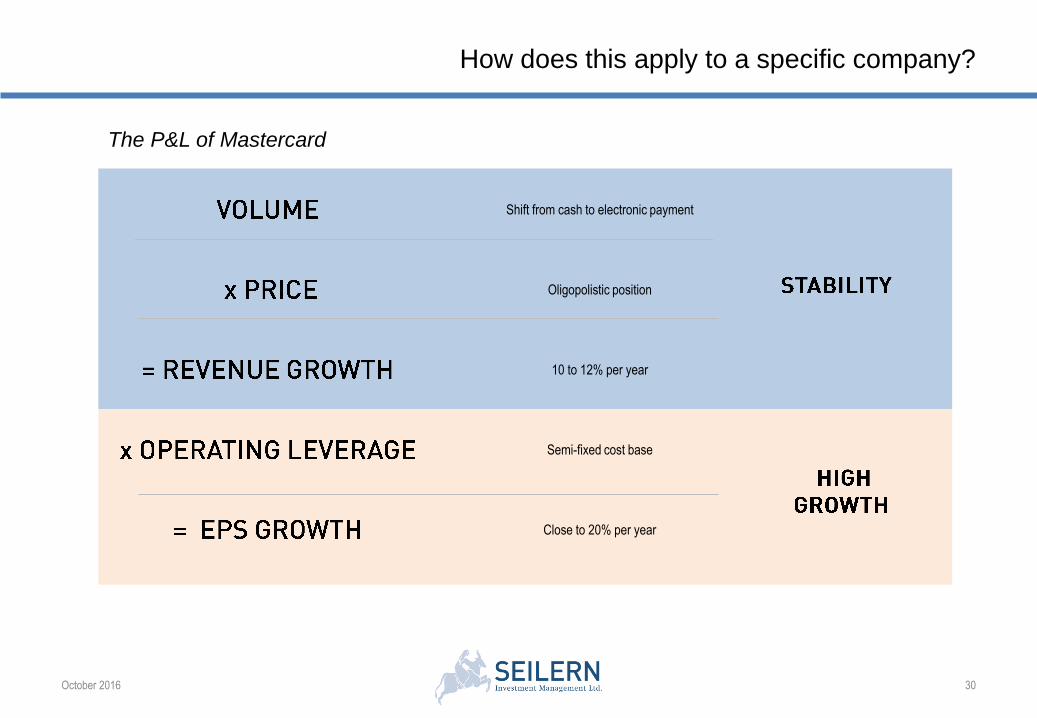
How does this apply to a specific company?
October 2016 30
Shift from cash to electronic payment
Oligopolistic position
10 to 12% per year
Semi-fixed cost base
Close to 20% per year
The P&L of Mastercard
×Market tends to focus on recovery
stocks with poor balance sheets
which will survive
(‘dash for trash’)
Market tends to focus on company-
quality, business positioning, balance
sheets, earnings power and
management superiority
Market tends to focus on superior
earnings-power associated with top
-line growth and
market share gains
Market tends to focus on company-
quality, business positioning, balance
sheets, cash flow, earnings power
and management superiority
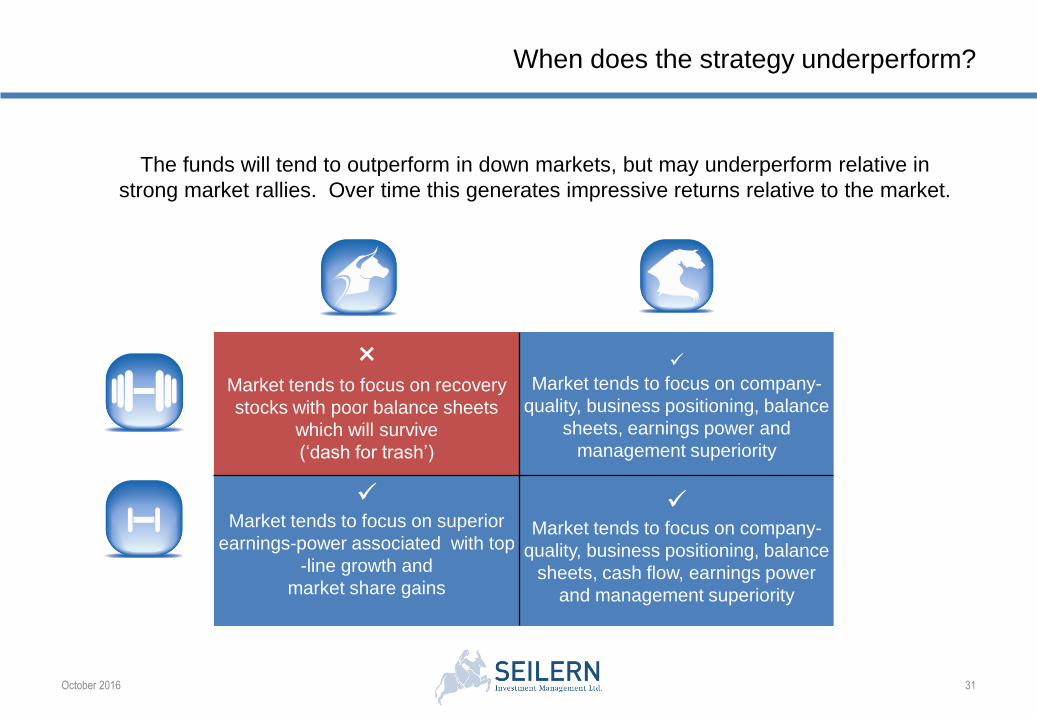
When does the strategy underperform?
October 2016 31
The funds will tend to outperform in down markets, but may underperform relative in
strong market rallies. Over time this generates impressive returns relative to the market.
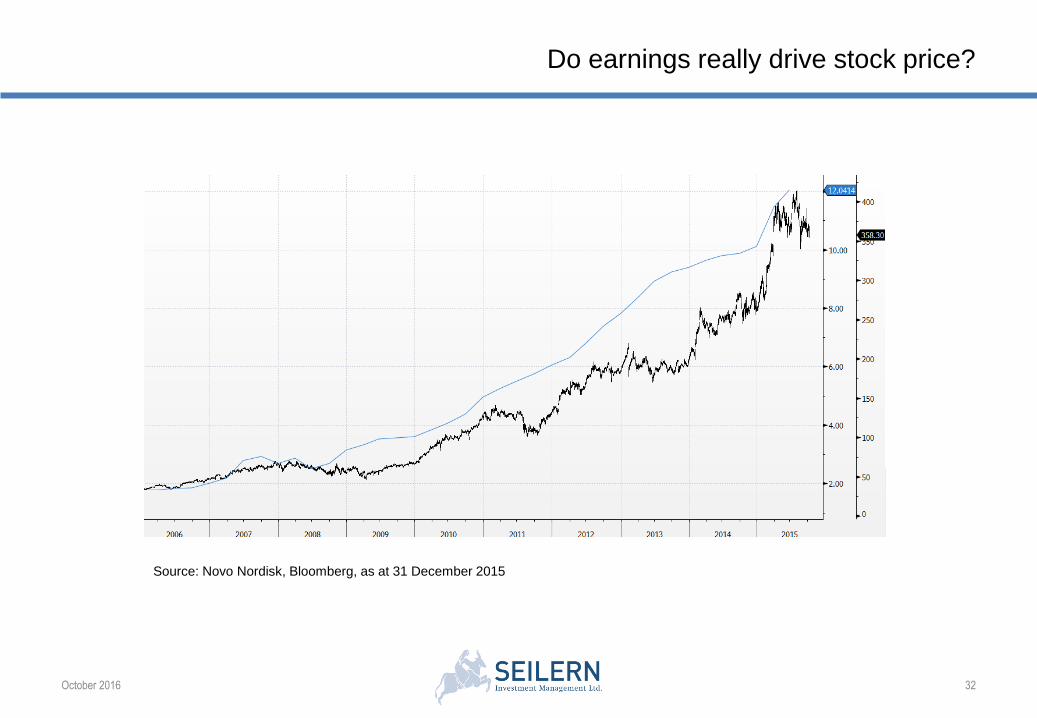
Do earnings really drive stock price?
October 2016 32
Source: Novo Nordisk, Bloomberg, as at 31 December 2015
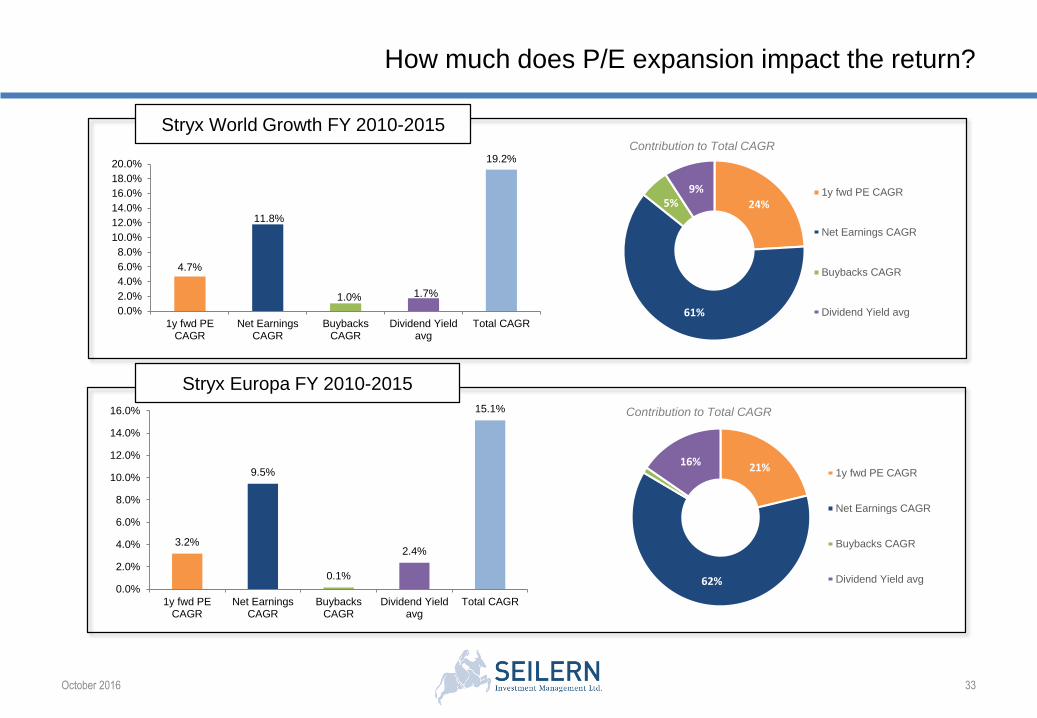
How much does P/E expansion impact the return?
October 2016 33
4.7%
11.8%
1.0% 1.7%
19.2%
0.0%
2.0%
4.0%
6.0%
8.0%
10.0%
12.0%
14.0%
16.0%
18.0%
20.0%
1y fwd PECAGR
Net EarningsCAGR
BuybacksCAGR
Dividend Yieldavg
Total CAGR
24%
61%
5%9%
Contribution to Total CAGR
1y fwd PE CAGR
Net Earnings CAGR
Buybacks CAGR
Dividend Yield avg
3.2%
9.5%
0.1%
2.4%
15.1%
0.0%
2.0%
4.0%
6.0%
8.0%
10.0%
12.0%
14.0%
16.0%
1y fwd PECAGR
Net EarningsCAGR
BuybacksCAGR
Dividend Yieldavg
Total CAGR
21%
62%
16%1y fwd PE CAGR
Net Earnings CAGR
Buybacks CAGR
Dividend Yield avg
Contribution to Total CAGR
Stryx Europa FY 2010-2015
Stryx World Growth FY 2010-2015
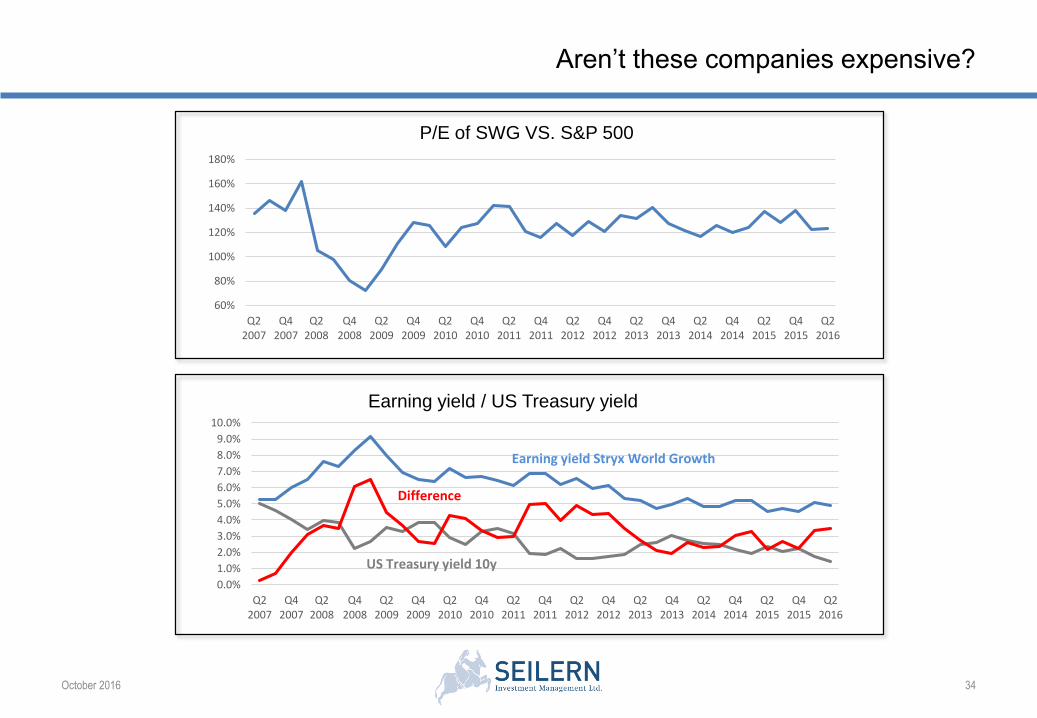
Aren’t these companies expensive?
October 2016 34
60%
80%
100%
120%
140%
160%
180%
Q22007
Q42007
Q22008
Q42008
Q22009
Q42009
Q22010
Q42010
Q22011
Q42011
Q22012
Q42012
Q22013
Q42013
Q22014
Q42014
Q22015
Q42015
Q22016
P/E of SWG VS. S&P 500
0.0%
1.0%
2.0%
3.0%
4.0%
5.0%
6.0%
7.0%
8.0%
9.0%
10.0%
Q22007
Q42007
Q22008
Q42008
Q22009
Q42009
Q22010
Q42010
Q22011
Q42011
Q22012
Q42012
Q22013
Q42013
Q22014
Q42014
Q22015
Q42015
Q22016
Earning yield / US Treasury yield
Earning yield Stryx World Growth
US Treasury yield 10y
Difference
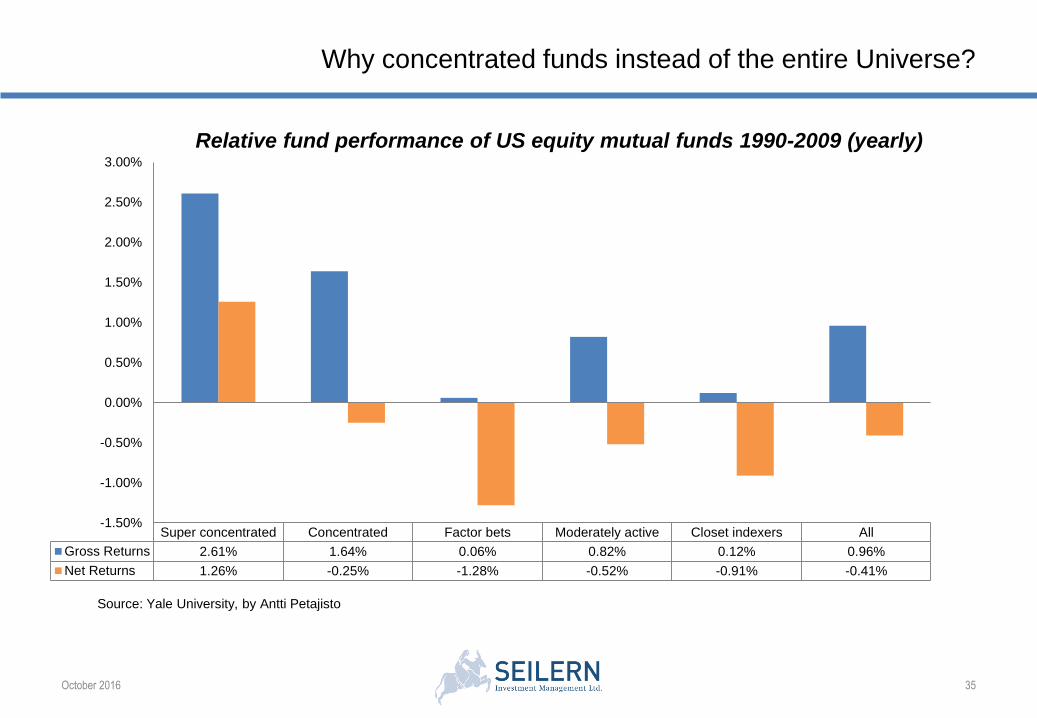
Why concentrated funds instead of the entire Universe?
October 2016 35
Source: Yale University, by Antti Petajisto
Relative fund performance of US equity mutual funds 1990-2009 (yearly)
Super concentrated Concentrated Factor bets Moderately active Closet indexers All
Gross Returns 2.61% 1.64% 0.06% 0.82% 0.12% 0.96%
Net Returns 1.26% -0.25% -1.28% -0.52% -0.91% -0.41%
-1.50%
-1.00%
-0.50%
0.00%
0.50%
1.00%
1.50%
2.00%
2.50%
3.00%
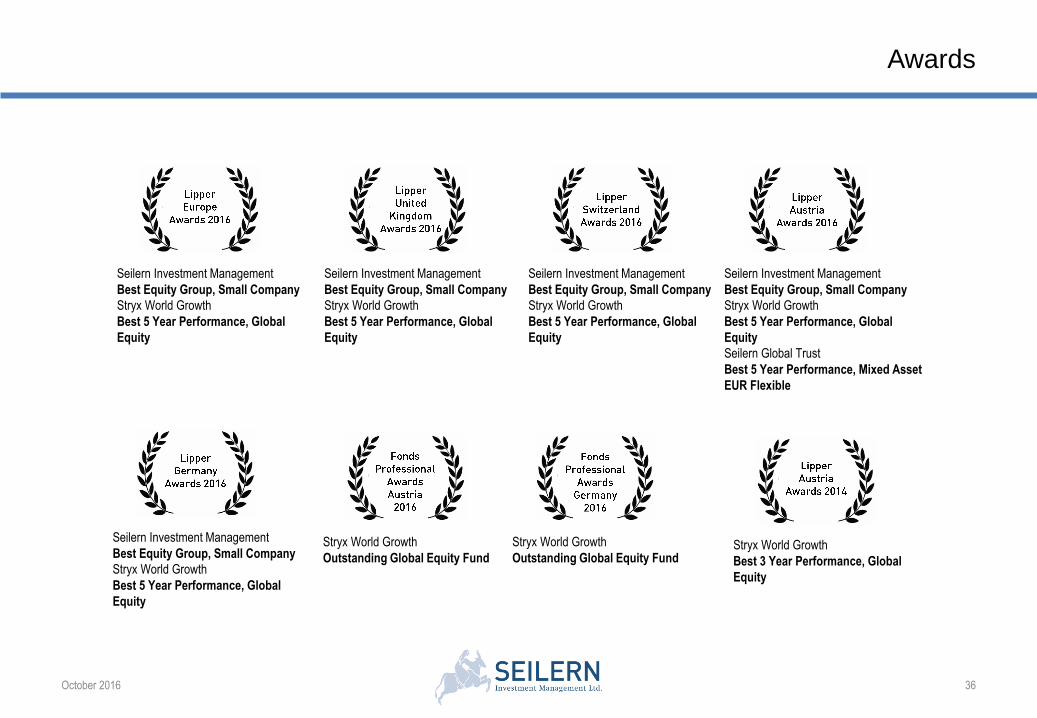
Awards
October 2016 36
Seilern Investment Management
Best Equity Group, Small Company
Stryx World Growth
Best 5 Year Performance, Global
Equity
Seilern Investment Management
Best Equity Group, Small Company
Stryx World Growth
Best 5 Year Performance, Global
Equity
Seilern Investment Management
Best Equity Group, Small Company
Stryx World Growth
Best 5 Year Performance, Global
Equity
Seilern Investment Management
Best Equity Group, Small Company
Stryx World Growth
Best 5 Year Performance, Global
Equity
Seilern Global Trust
Best 5 Year Performance, Mixed Asset
EUR Flexible
Seilern Investment Management
Best Equity Group, Small Company
Stryx World Growth
Best 5 Year Performance, Global
Equity
Stryx World Growth
Outstanding Global Equity Fund
Stryx World Growth
Outstanding Global Equity FundStryx World Growth
Best 3 Year Performance, Global
Equity
Disclaimer
October 2016 37
• Please note that the value of investments and the income derived from them may fluctuate and you may not
receive back the amount originally invested. Past performance is no guarantee of future performance. Currency
movements may also affect the value of investments. The investment services referred to in this presentation
may not be suitable for all investors. If you are unsure as to whether the investments described in this site are
suitable for you, we strongly recommend you seek professional advice from a financial adviser.
• Stryx World Growth, Stryx America and Stryx Europa are collective investment schemes which are sub-funds of
Stryx International Funds plc, an umbrella fund with segregated liability between sub-funds a recognised
scheme under Section 264 under the Financial Services and Markets Act 2000.
• This presentation does not constitute an offer of sale to buy shares/units of Stryx World Growth Fund, Stryx
America Fund or Stryx Europa Fund (“the Funds”) unless accompanied by the current prospectus and
supplement(s).
• The Directors of Seilern Investment Management Ltd. have direct or indirect holdings in Stryx World Growth
Fund, Stryx America Fund and Stryx Europa Fund.
• Authorised and regulated by the Financial Conduct Authority.
• All sources are Seilern Investment Management Ltd. unless otherwise stated.