Somos la memoria que tenemos y la responsabilidad … · Tim, muchas gracias por la traducción de...
194
“Somos la memoria que tenemos y la responsabilidad que asumimos. Sin memoria no existimos y sin responsabilidad quizá no merezcamos existir” José Saramago
Transcript of Somos la memoria que tenemos y la responsabilidad … · Tim, muchas gracias por la traducción de...

“Somos la memoria que tenemos y la responsabilidad
que asumimos. Sin memoria no existimos y sin
responsabilidad quizá no merezcamos existir”
José Saramago

Promotors
Prof. dr. Patrick Kolsteren and
Prof. dr. Carl Lachat
Department of Food Safety and Food Quality, Faculty of Bioscience Engineering
Ghent University
Dean
Prof.dr.ir. Guido Van Huylenbroeck
Rector
Prof.dr. Anne Paepe

Angélica Ochoa Avilés
Cardiovascular risk factors among Ecuadorian adolescents: a school-based health promotion intervention
Thesis submitted in fulfillment of the requirements for the degree of Doctor (PhD) in Applied
Biological Sciences

Dutch title: Hart- en vaatziekten in adolescenten in Ecuador: een gezondheidspromotie interventie in
scholen
Cite as: Ochoa-Avilés A. (2015). Cardiovascular risk factors among Ecuadorian adolescents: a
school-based health promotion intervention. Doctoral thesis, Ghent University, Belgium.
ISBN: 978-90-5989-794-6
Cover: Javier Álvarez
Funding: This research was funded by VLIR-UOS (http://www.vliruos.be), Nutrition Third
World (http://www.nutrition-ntw.org) and Universidad de Cuenca
(http://www.ucuenca.edu.ec/).
The author and promoters give the authorization to consult and to copy parts of this work for personal use
only. Every other use is subject to the copyright laws. Permission to reproduce any material contained in
this work should be obtained from the author.

Members of the jury Prof. dr. Patrick Kolsteren (Promoter)
Department of Food Safety and Food Quality, Ghent University, Belgium
Nutrition and Child Unit, Institute of Tropical Medicine, Belgium
Prof. dr. Carl Lachat (Promoter)
Department of Food Safety and Food Quality, Ghent University, Belgium
Dr. Wendy Van Lippevelde (Reading committee)
Department of Public Health, Ghent University, Belgium
Prof. dr. Wilma Freire (Reading committee)
Instituto de Investigación en Salud y Nutrición, Universidad San Francisco de Quito, Ecuador
Prof. dr. ir. Marijke D'Haese (Reading committee, Secretary)
Department of Agricultural Economics, Ghent University, Belgium
Prof. dr. ir. Wim Verbeke (Chairman)
Department of Agricultural Economics, Ghent University, Belgium


Acknowledgments
Acknowledgments How did I end up here? That’s the question that comes to my mind while writing-up these
acknowledgments. When I start answering this question to myself I can just be grateful to God and life
for bringing me at this point. I am grateful for all the events, people and coincidences that encouraged
me to take the decision of working in research, because I ended up doing something I enjoy just by
chance. I will start thanking my promotors and professors. Patrick, thanks for giving me the opportunity
to work with you, for the lessons and for your trust. It was a new experience, and a continuous learning
process in which your valuable advice and guidelines were essential. Carl thanks for your support during
the past years. I will never forget that you helped me writing my first abstract for a poster presentation
as well as my first research paper, your input has been crucial.
John thanks for being not only the project leader but also someone worried about the welfare of all the
Ecuadorian team members, thanks also to your friendly and welcoming family. Lea, thanks for your
valuable involvement in this research project and for helping me even when it was not your task. I also
express my sincere acknowledgment to the jury members for their valued comments. Guido Wyseure,
Piet Wostyn, Tupac Calfat, Anne Opsomer, Anne-Marie Remaut-De Winter and Valerie Henrist thanks
for your support.
To all the colleagues and new friends I made in Belgium. Roos, thanks for trusting me and for all your
patience and effort. I remember the first time you went to Ecuador I cannot express in words how much
I have changed up to this point. A big part of the change is because you showed what I was able to do.
Thanks for sharing your knowledge and your experience and for walking together with me during this
period. Kim, thanks for all the talks, I did not expect to find a person who can has a similar way of
thinking at the other side of the world, you definitively made my life better in Belgium! Lieven, many
thanks for your support and your time. I deeply appreciate your statistical and Stata lessons, thanks for
sharing so many interesting and new things. Kathleen, thanks for your support in Belgium and in
Ecuador, for your dedication and for always being so welcoming and friendly. Vale y Tim, muchas
gracias por abrirme las puertas de su casa, por todos los momentos que han compartido conmigo y por
apoyarme en mi vida lejos de mi familia. Tim, muchas gracias por la traducción de mi resumen al
Neerlandés. Mariela, no me cansaré de agradecerte por ayudarme a preparar la recepción para la defensa.
Kathy, Maru, Douglas, Adriana, Livin, Dora, Eduardo, Janeth, Nathalie, Katherine, Pankti, Lorena and
Paúl thanks for your support. Claudia, muchas gracias por ser mi amiga por tu confianza y por ser una
persona tan especial que me apoyó en mi primera visita a Bélgica, siempre te recuerdo con mucho cariño.
En Ecuador, gracias a las personas en la Universidad de Cuenca que hicieron posible culminar
exitosamente esta labor. Un agradecimiento especial y con mucho cariño a la Dra. Silvana Donoso quien
ha sido un apoyo fundamental tanto profesional como personal, esta investigación no sería lo que es sin

Acknowledgments
su confianza y dedicación, gracias por su apoyo incondicional incluso cuando las circunstancias no son
del todo favorables, su labor es digna de mucha admiración y respeto. Al personal del VLIR, en especial
Fabián León quien ha demostrado su interés por mejorar el bienestar de los investigadores en la
Universidad. Agradezco el trabajo y la predisposición de Cecilia Loyola y Miguel Cordero. A todos los
profesores y colegas de la Facultad de Ciencias Químicas. Un especial reconocimiento a Susana
Andrade con quien hemos aprendido a emprender esta dura pero gratificante tarea en nuestro querido
país. Gracias por todo lo que he aprendido de usted y por su ayuda durante todo este proceso y sobre
todo en la organización final. Asimismo, un agradecimiento especial a las personas que han colaborado
de cerca en este trabajo y con quienes puedo decir hemos vivido juntas muchos momentos de alegría y
fraternidad pero también muchos otros difíciles, gracias por su perseverancia Dianita Andrade, Patricia
Ramírez, Diana Córdova, Silvia Torres y Juanita Cabrera. María Cecilia Vintimilla y Lourdes Jerves,
muchas gracias por su importante colaboración profesional y personal. Un reconocimiento para Johana
Ortiz, con quien empezamos y crecimos juntas desde hace ya algunos años. De igual manera, Paulina
Escobar muchas gracias por su ayuda. Gracias a todas las demás personas que forman o formaron parte
del equipo de investigación, Cecilia Romero, Marlene Gia, Rosendo Rojas, Ana Cristina Chávez, Diana
Morillo, Gabriela Zúñiga y Anita García. A los colegios, profesores, personal educativo, alumnos y
padres de familia que colaboraron durante el desempeño de esta investigación. Finalmente agradezco al
rector Fabián Carrasco y la vicerrectora Silvana Larriva por su apoyo al programa VLIR y a los
investigadores de la Universidad de Cuenca.
Dunita, Guillermito y Adri, muchas gracias por su ayuda incondicional y confianza a lo largo de este
proceso, aprecio de sobremanera sus incontables muestras de cariño y solidaridad. A mis amigos que
me apoyaron en cada viaje, gracias Sebas, aunque ya no estés con nosotros siempre nos apoyaste a mí y
al Feli, fuiste una de las mejores personas que conozco y parte muy importante en nuestras vidas. A mis
amigos Pepe, Fer, Abdón, Pepa, Pedro y Lola, gracias por los momentos de recreación entre mis
momentos de estrés.
Gracias a mis muy queridos padres, Edgar y Angélica que siempre han estado conmigo, han confiado
en mí y nunca me demostraron que tenía un defecto pequeño, solo en la adolescencia empecé a
comprender que tenía ciertas limitaciones. Gracias por no hacerlo notar antes y permitirme pensar que
puedo seguir adelante y hacer una vida completamente normal. Gracias por todo su tiempo, sus
sacrificios y su dedicación y por crecer en una familia llena de cariño. Siempre recuerdo que les dijeron
que seguramente me quedaría ciega a los 18 años y que ustedes esperaban que al menos terminara el
colegio y bueno aquí estamos terminando un PhD. Por todo esto y a más a ustedes les dedico este trabajo
con mucho cariño.
Como no agradecer a mis amados hermanos, Juan Pablo, mi hermano mayor, mi modelo a seguir y mi
ídolo de la infancia, y mi pequeña hermana Cristina, mi mejor amiga y mi confidente con ustedes crecí

Acknowledgments
llena de felicidad, cuidados, bromas y mimos. Por todo esto soy lo que soy y hemos llegado a este punto
en el que no puedo más que agradecerles por todo lo que representan en mi vida y por su apoyo brindado
no solo en esta etapa sino desde siempre. Y a mí igualmente amado sobrino Matías gracias por las
innumerables muestras de cariño y por las afectuosas despedidas en cada uno de mis viajes.
Feli, puedo escribir hojas enteras de agradecimientos, primero gracias a la vida que te puso en mi
camino, luego gracias a ti por toda tu paciencia, amor, bondad, confianza, etc, etc. Me has apoyado de
todas las maneras, moralmente, profesionalmente, logísticamente. Gracias por tus palabras en aquellos
momentos en los que pensaba que ya no podía. Gracias por estar siempre dispuesto a ayudarme, por
estar siempre a mi lado, aguantar todas mis ausencias y sobre todo por amarme como yo te amo.


Abbreviations
Abbreviations AM: Adjusted model
BM: Bivariate model
BMI: Body mass index
BP: Blood pressure
CPPE: Comprehensive and participatory planning and evaluation
CVD: Cardiovascular diseases
DBP: Diastolic blood pressure
HDL: High-density lipoprotein
HICs: High-income countries
IM: Intervention mapping
IQR: Interquartile range
LDL: Low-density lipoprotein
LMICs: Low- and middle-income countries
NCDs: Non-communicable diseases
PE: Process evaluation
RCT(s): Randomized controlled trial(s)
SBP: Systolic blood pressure
SD: Standard deviation
UBN: Unsatisfied basic needs

Summary
i
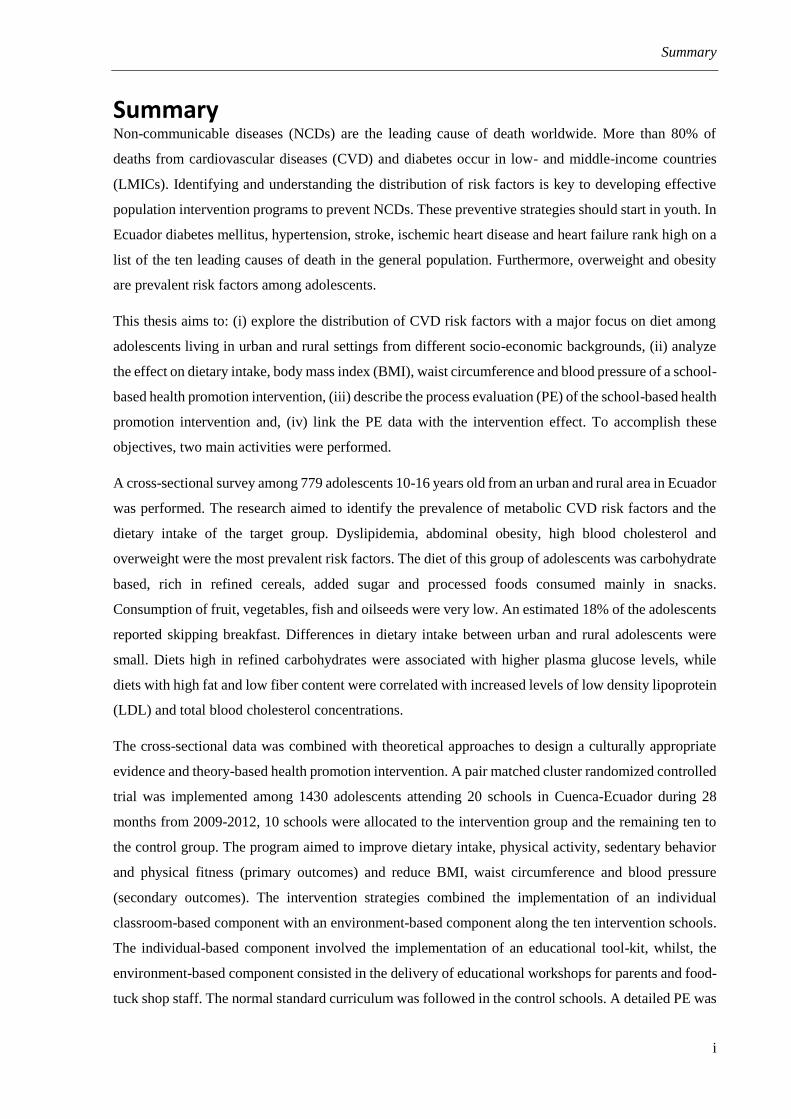
Summary Non-communicable diseases (NCDs) are the leading cause of death worldwide. More than 80% of
deaths from cardiovascular diseases (CVD) and diabetes occur in low- and middle-income countries
(LMICs). Identifying and understanding the distribution of risk factors is key to developing effective
population intervention programs to prevent NCDs. These preventive strategies should start in youth. In
Ecuador diabetes mellitus, hypertension, stroke, ischemic heart disease and heart failure rank high on a
list of the ten leading causes of death in the general population. Furthermore, overweight and obesity
are prevalent risk factors among adolescents.
This thesis aims to: (i) explore the distribution of CVD risk factors with a major focus on diet among
adolescents living in urban and rural settings from different socio-economic backgrounds, (ii) analyze
the effect on dietary intake, body mass index (BMI), waist circumference and blood pressure of a school-
based health promotion intervention, (iii) describe the process evaluation (PE) of the school-based health
promotion intervention and, (iv) link the PE data with the intervention effect. To accomplish these
objectives, two main activities were performed.
A cross-sectional survey among 779 adolescents 10-16 years old from an urban and rural area in Ecuador
was performed. The research aimed to identify the prevalence of metabolic CVD risk factors and the
dietary intake of the target group. Dyslipidemia, abdominal obesity, high blood cholesterol and
overweight were the most prevalent risk factors. The diet of this group of adolescents was carbohydrate
based, rich in refined cereals, added sugar and processed foods consumed mainly in snacks.
Consumption of fruit, vegetables, fish and oilseeds were very low. An estimated 18% of the adolescents
reported skipping breakfast. Differences in dietary intake between urban and rural adolescents were
small. Diets high in refined carbohydrates were associated with higher plasma glucose levels, while
diets with high fat and low fiber content were correlated with increased levels of low density lipoprotein
(LDL) and total blood cholesterol concentrations.
The cross-sectional data was combined with theoretical approaches to design a culturally appropriate
evidence and theory-based health promotion intervention. A pair matched cluster randomized controlled
trial was implemented among 1430 adolescents attending 20 schools in Cuenca-Ecuador during 28
months from 2009-2012, 10 schools were allocated to the intervention group and the remaining ten to
the control group. The program aimed to improve dietary intake, physical activity, sedentary behavior
and physical fitness (primary outcomes) and reduce BMI, waist circumference and blood pressure
(secondary outcomes). The intervention strategies combined the implementation of an individual
classroom-based component with an environment-based component along the ten intervention schools.
The individual-based component involved the implementation of an educational tool-kit, whilst, the
environment-based component consisted in the delivery of educational workshops for parents and food-
tuck shop staff. The normal standard curriculum was followed in the control schools. A detailed PE was

Summary
ii
also conducted. At the end of the intervention, data from 1079 adolescents from the 20 schools originally
contacted was available for analysis. The program effectively increased fruit and vegetable intake and
decreased added sugar and processed food intake during snacks. The intervention was also effective in
decreasing waist circumference and blood pressure in favor of the intervention group. The effect on
dietary intake was not moderated by the socioeconomic status or the weight or the age of the participants.
However, the effect on waist circumference was higher among younger and overweight-obese
adolescents.
The program was correctly implemented and well received by the target audiences i.e. adolescents,
teachers, parents and food-tuck shop staff. Dose, reach and fidelity were high with the exception of
parental reach (only 15%). Barriers for program implementation were the difficulty to attach the
program to the school curriculum, the low parental reach and, the resistance to a decrease in portion size
served in the food-tuck shops.
Although still below the nutritional recommendations, the combined effect of the intervention on several
individual risk factors is encouraging and promising. It suggests that school-based interventions can
address various risk factors simultaneously in adolescents from LMICs. This thesis provides new
evidence for the prevention of NCDs among adolescents from LMICs.
Samenvatting
iii
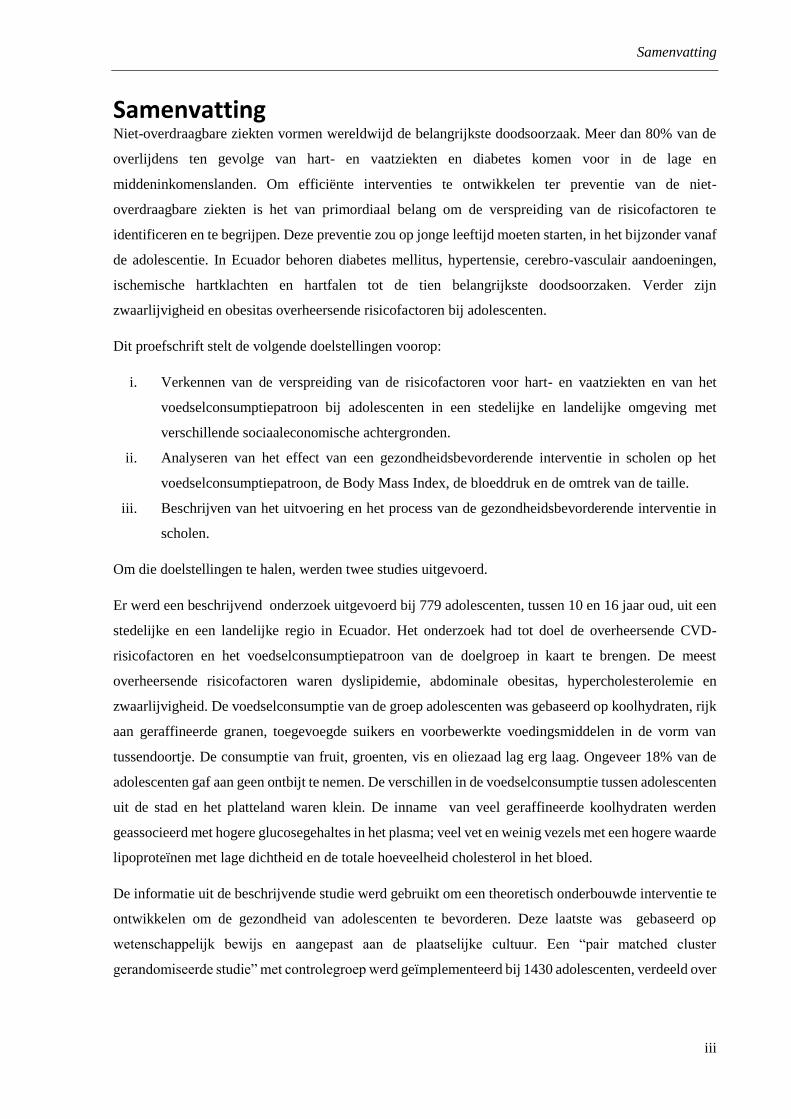
Samenvatting Niet-overdraagbare ziekten vormen wereldwijd de belangrijkste doodsoorzaak. Meer dan 80% van de
overlijdens ten gevolge van hart- en vaatziekten en diabetes komen voor in de lage en
middeninkomenslanden. Om efficiënte interventies te ontwikkelen ter preventie van de niet-
overdraagbare ziekten is het van primordiaal belang om de verspreiding van de risicofactoren te
identificeren en te begrijpen. Deze preventie zou op jonge leeftijd moeten starten, in het bijzonder vanaf
de adolescentie. In Ecuador behoren diabetes mellitus, hypertensie, cerebro-vasculair aandoeningen,
ischemische hartklachten en hartfalen tot de tien belangrijkste doodsoorzaken. Verder zijn
zwaarlijvigheid en obesitas overheersende risicofactoren bij adolescenten.
Dit proefschrift stelt de volgende doelstellingen voorop:
i. Verkennen van de verspreiding van de risicofactoren voor hart- en vaatziekten en van het
voedselconsumptiepatroon bij adolescenten in een stedelijke en landelijke omgeving met
verschillende sociaaleconomische achtergronden.
ii. Analyseren van het effect van een gezondheidsbevorderende interventie in scholen op het
voedselconsumptiepatroon, de Body Mass Index, de bloeddruk en de omtrek van de taille.
iii. Beschrijven van het uitvoering en het process van de gezondheidsbevorderende interventie in
scholen.
Om die doelstellingen te halen, werden twee studies uitgevoerd.
Er werd een beschrijvend onderzoek uitgevoerd bij 779 adolescenten, tussen 10 en 16 jaar oud, uit een
stedelijke en een landelijke regio in Ecuador. Het onderzoek had tot doel de overheersende CVD-
risicofactoren en het voedselconsumptiepatroon van de doelgroep in kaart te brengen. De meest
overheersende risicofactoren waren dyslipidemie, abdominale obesitas, hypercholesterolemie en
zwaarlijvigheid. De voedselconsumptie van de groep adolescenten was gebaseerd op koolhydraten, rijk
aan geraffineerde granen, toegevoegde suikers en voorbewerkte voedingsmiddelen in de vorm van
tussendoortje. De consumptie van fruit, groenten, vis en oliezaad lag erg laag. Ongeveer 18% van de
adolescenten gaf aan geen ontbijt te nemen. De verschillen in de voedselconsumptie tussen adolescenten
uit de stad en het platteland waren klein. De inname van veel geraffineerde koolhydraten werden
geassocieerd met hogere glucosegehaltes in het plasma; veel vet en weinig vezels met een hogere waarde
lipoproteïnen met lage dichtheid en de totale hoeveelheid cholesterol in het bloed.
De informatie uit de beschrijvende studie werd gebruikt om een theoretisch onderbouwde interventie te
ontwikkelen om de gezondheid van adolescenten te bevorderen. Deze laatste was gebaseerd op
wetenschappelijk bewijs en aangepast aan de plaatselijke cultuur. Een “pair matched cluster
gerandomiseerde studie” met controlegroep werd geïmplementeerd bij 1430 adolescenten, verdeeld over

Samenvatting
iv
20 scholen in Cuenca (Ecuador) tussen 2009 en 2012. Tien scholen vormden de interventiegroep en de
resterende scholen vormden de controlegroep.
De interventie had volgende doelstellingen: het verbeteren van het voedselinname, de
lichaamsbeweging, het sedentair gedrag, en de lichamelijke conditie (primaire resultaten) en het
verminderen van de BMI, de taille-omtrek en de bloeddruk (secundaire resultaten).
De interventie in de tien deelnemende scholen bestonden uit een individuele component in klasverband
en een omgeving gebonden component. De individuele component bestond uit de implementatie van
een educatieve toolkit, terwijl de omgevingscomponent bestond uit het houden van educatieve
workshops met de ouders en het personeel van lokale voedingswinkels. In de scholen van de
controlegroep werd het normale standaard leerplan gevolgd. Er werd eveneens een gedetailleerde
procesevaluatie uitgevoerd. De gegevens van 1079 adolescenten uit de 20 oorspronkelijk gecontacteerde
scholen konden worden geanalyseerd. Door de interventie steeg de consumptie van fruit en groenten en
daalde de consumptie van toegevoegde suikers en voorbewerkte voedingsmiddelen. De interventie bleek
ook doeltreffend voor de daling van de taille-omtrek en de bloeddruk bij de interventiegroep. Het effect
op het voedselconsumptiepatroon werd niet beïnvloed door de sociaaleconomische status, gewicht of
leeftijd van de deelnemers. Het effect op de taille-omtrek was echter groter bij jonge adolescenten en
zwaarlijvige en obese adolescenten.
Het programma werd correct geïmplementeerd en werd goed ontvangen door het doelpubliek, in het
bijzonder adolescenten, leerkrachten, ouders en personeel van lokale voedingswinkels. Dosis, bereik en
betrouwbaarheid van de interventie lagen hoog, met uitzondering van het bereik van de ouders (slechts
15%). Barrières voor het uitvoeren van het programma waren de moeilijkheid om het programma te
koppelen aan het schoolcurriculum, het lage bereik van de ouders en de weerstand om de porties die
geserveerd werden in de lokale voedingswinkels te verkleinen.
Het gecombineerde effect van de interventie op verschillende individuele risicofactoren is bemoedigend
en beloftevol, maar ligt nog steeds onder de voedingsaanbevelingen. Het resultaat toont aan dat
interventies in scholen verscheidene risicofactoren gelijktijdig kan aanpakken bij adolescenten uit lage
en middeninkomenslanden. Dit proefschrift levert nieuw bewijs voor de preventie van niet-
overdraagbare ziektes bij adolescenten uit lage en middeninkomenslanden.

Resumen
v
Resumen Las enfermedades crónicas no transmisibles son la principal causa de muerte a nivel mundial. Más de
80% de las muertes secundarias a enfermedades cardiovasculares y diabetes ocurrieron en países de
ingresos medios y bajos. Identificar y comprender la distribución de los más importantes factores de
riesgo asociados con este problema de salud es crucial para el desarrollo de intervenciones efectivas en
contra de las enfermedades crónicas no transmisibles en la población. Estas estrategias preventivas
deben empezar durante la juventud. En el Ecuador, diabetes mellitus, hipertensión, eventos
cerebrovasculares, enfermedad isquémica del corazón e insuficiencia cardiaca figuran entre las 10
primeras causas de muerte en la población general. Además el sobrepeso y la obesidad son prevalentes
entre los adolescentes.
Los objetivos de este trabajo de tesis son: (i) investigar la distribución de factores de riesgo para
enfermedades cardiovasculares con atención especial en la dieta en un grupo de adolescentes del área
urbanas y rural con diferentes niveles socio-económicos, (ii) analizar el efecto de un programa escolar
de promoción de salud en la dieta, el índice de masa corporal, el tamaño de la cintura y la presión arterial,
(iii) evaluar el proceso de implementación del programa escolar de promoción de salud, y, (iv) relacionar
los datos del proceso de implementación con el efecto de la intervención. Para cumplir con estos
objetivos se llevaron a cabo dos actividades.
Un estudio de corte transversal entre 779 adolescentes con edades comprendidas entre los 10 y los 16
años de un área urbana y un área rural del Ecuador. Esta investigación se llevó a cabo para identificar la
prevalencia de factores de riesgo metabólicos para enfermedades cardiovasculares y caracterizar la dieta
de la población de estudio. Dislipidemia, obesidad abdominal, y sobrepeso estuvieron entre los factores
de riesgo más prevalentes. La dieta de este grupo de adolescentes fue rica en carbohidratos, cereales
refinados, azúcares añadidos y alimentos procesados consumidos como refrigerios. El consumo de
frutas, verduras, pescado y semillas oleaginosas fue muy escaso. Además, alrededor del 18% de los
participantes reportaron no desayunar. Diferencias en la dieta entre adolescentes urbanos y rurales
fueron escasas. Dietas ricas en cereales refinados estuvieron asociadas con mayores niveles sanguíneos
de glucosa, así como dietas ricas en grasa y pobres en fibra estuvieron asociadas con incrementos en
lipoproteína de baja densidad y colesterol total.
La información del estudio de corte transversal se usó en combinación con enfoques teoréticos para
diseñar una intervención en promoción de salud culturalmente apropiada. Un ensayo aleatorio
controlado por clústeres pareados se implementó entre 1430 adolescentes de 20 colegios de la ciudad de
Cuenca-Ecuador entre los años 2009-2012. Diez colegios fueron asignados al grupo intervención y los
10 restantes al grupo control. El programa buscó mejorar los patrones dietarios, la actividad física, los
niveles de sedentarismo y la condición física (resultados primarios) así como el índice de masa corporal,
el tamaño de la cintura y la presión arterial (resultados secundarios). Las estrategias incluyeron la

Resumen
vi
implementación de un componente individual y un componente del entorno. El componente individual
consistió en la aplicación de un kit educativo mientras que el componente del entronó incluyó talleres
de alimentación saludable con padres de familia y propietarios de los bares escolares. En los colegios
de control únicamente se siguió el currículo escolar estándar. Al final de la intervención se dispuso de
datos de 1079 adolescentes de los 20 colegios originalmente contactados. El programa resultó efectivo
en mejorar el consumo de frutas y verduras, disminuir el consumo de azúcares añadidos y alimentos
procesados durante los refrigerios, disminuir el tamaño de la cintura y los niveles de presión arterial en
favor del grupo de intervención. El efecto en la dieta fue independiente del nivel socio-económico, el
índice de masa corporal y la edad de los participantes. Sin embargo el efecto en la cintura fue mayor en
adolescentes más jóvenes así como en aquellos diagnosticados con sobrepeso u obesidad.
El programa se implementó correctamente y fue bien recibido por los involucrados (adolescentes,
profesores, padres y trabajadores de los bares escolares). Dosis, cobertura y fidelidad del programa
fueron altos con excepción de la cobertura de padres (solo del 15%). Entre las barreras para la
implementación del programa figuraron la dificultad de incluir la intervención en el programa curricular,
la baja respuesta de padres, y la resistencia por parte de los trabajadores de los bares escolares para
modificar los tamaños de porción de sus platos
Aunque los efectos conseguidos son aún inferiores a las recomendaciones, el efecto combinado sobre
varios factores de riesgo es prometedor y motivante. Esto sugiere que intervenciones escolares pueden
atacar varios factores de riesgo en adolescentes de países con ingresos medios o bajos. Esta tesis provee
nueva evidencia para la prevención de las enfermedades crónicas no transmisibles en los adolescentes
con países de ingresos medios y bajos.

Content
vii
Content
1 General introduction and outline ________________________________________________ 1
1.1 The global burden of non-communicable diseases ________________________________ 3
1.1.1 NCDs risk factors ______________________________________________________ 3
1.1.2 NCDs in Latin America _________________________________________________ 4
1.1.3 NCDs in Ecuador ______________________________________________________ 5
1.2 Actions against NCDs in adolescents ___________________________________________ 5
1.2.1 Actions against NCDs in adolescents worldwide ______________________________ 5
1.2.2 Actions against NCDs in Latin American children and adolescents _______________ 6
1.2.3 Actions against NCDs in Ecuadorian children and adolescents ___________________ 7
1.3 Research area _____________________________________________________________ 7
1.3.1 Socio-demographic characteristics _________________________________________ 7
1.3.2 The Ecuadorian school system ____________________________________________ 8
1.4 Program framework ________________________________________________________ 9
1.4.1 The needs assessment __________________________________________________ 10
1.4.2 The intervention design and implementation ________________________________ 12
1.4.3 Evaluation of the intervention ___________________________________________ 17
1.5 Research questions, hypothesis and objectives of the thesis ________________________ 17
1.6 Specific objectives of the PhD research ________________________________________ 17
1.7 Thesis outline ____________________________________________________________ 18
2 Prevalence of metabolic risk factors of cardiovascular disease and dietary intake behaviors
among adolescents from Cuenca and Nabón __________________________________________ 21
2.1 Summary _______________________________________________________________ 23
2.2 Introduction _____________________________________________________________ 24
2.3 Methods ________________________________________________________________ 24
2.3.1 Subjects and sampling _________________________________________________ 24
2.3.2 Ethics ______________________________________________________________ 25
2.3.3 Anthropometric measurements___________________________________________ 25
2.3.4 Blood pressure _______________________________________________________ 25
2.3.5 Socio-demographic characteristics ________________________________________ 25
2.3.6 Blood sample determinations ____________________________________________ 26

Content
viii
2.3.7 Definition of metabolic risk factors _______________________________________ 26
2.3.8 Dietary assessment ____________________________________________________ 26
2.3.9 Data analysis _________________________________________________________ 29
2.4 Results _________________________________________________________________ 30
2.4.1 Prevalence of metabolic CVD risk factors and its predictors ____________________ 31
2.4.2 Dietary intake ________________________________________________________ 33
2.5 Discussion _______________________________________________________________ 40
2.5.1 Metabolic risk factors __________________________________________________ 40
2.5.2 Dietary intake ________________________________________________________ 41
2.5.3 Implications for health promotion programs ________________________________ 44
2.6 Limitations ______________________________________________________________ 46
2.7 Conclusion ______________________________________________________________ 46
3 Effect of the school-based health promotion intervention ACTIVITAL on dietary intake,
blood pressure and waist circumference: A pair-matched cluster randomized controlled trial _ 47
3.1 Summary ________________________________________________________________ 49
3.2 Introduction _____________________________________________________________ 50
3.3 Methods ________________________________________________________________ 50
3.3.1 Randomization and sample size __________________________________________ 50
3.3.2 Intervention __________________________________________________________ 51
3.3.3 Outcomes ___________________________________________________________ 52
3.3.4 Additional data _______________________________________________________ 58
3.3.5 Data analysis _________________________________________________________ 58
3.4 Results _________________________________________________________________ 60
3.4.1 Overall effect ________________________________________________________ 61
3.4.2 Additional analysis ____________________________________________________ 61
3.5 Discussion _______________________________________________________________ 65
3.6 Limitations ______________________________________________________________ 66
3.7 Conclusion ______________________________________________________________ 67
4 Effect of the school-based health promotion intervention ACTIVITAL on dietary intake,
waist circumference and blood pressure. A subgroup analysis of a cluster randomized controlled
trial 69
4.1 Summary ________________________________________________________________ 71

Content
ix
4.2 Introduction _____________________________________________________________ 72
4.3 Methods ________________________________________________________________ 72
4.3.1 Definition of subgroups ________________________________________________ 72
4.3.2 Data analysis ________________________________________________________ 73
4.4 Results _________________________________________________________________ 74
4.4.1 Baseline differences ___________________________________________________ 74
4.4.2 Results of the interaction terms __________________________________________ 74
4.4.3 Stratified analysis per weight status, age and UBN ___________________________ 75
4.5 Discussion ______________________________________________________________ 75
4.6 Limitations ______________________________________________________________ 76
4.7 Conclusion ______________________________________________________________ 76
5 Process evaluation of the ACTIVITAL school-based health promotion intervention _____ 77
5.1 Summary _______________________________________________________________ 79
5.2 Introduction _____________________________________________________________ 80
5.3 Methods ________________________________________________________________ 80
5.3.1 PE framework of the ACTIVITAL intervention _____________________________ 80
5.3.2 Ethics statement ______________________________________________________ 85
5.3.3 Data analysis ________________________________________________________ 85
5.4 Results _________________________________________________________________ 87
5.4.1 Recruitment _________________________________________________________ 87
5.4.2 Dose, reach, fidelity and context _________________________________________ 88
5.4.3 Determination of the level of implementation _______________________________ 95
5.5 Discussion ______________________________________________________________ 95
5.6 Limitations ______________________________________________________________ 98
5.7 Conclusion ______________________________________________________________ 99
6 General discussion __________________________________________________________ 101
6.1 Introduction ____________________________________________________________ 103
6.2 Practical implications, generalizability of the program ___________________________ 103
6.2.1 Internal validity _____________________________________________________ 104
6.2.2 External validity _____________________________________________________ 104
6.2.3 ACTIVITAL scaling-up _______________________________________________ 106

Content
x
6.3 Policy implications and the broader policy context ______________________________ 107
6.3.1 Government strategies aiming adolescents NCDs risk ________________________ 107
6.3.2 Government strategies addressing NCDs risk in the general population __________ 108
6.4 Methodological implications _______________________________________________ 109
6.4.1 Methodology of the ACTIVITAL intervention _____________________________ 109
6.4.2 The CPPE in the design of the intervention ________________________________ 110
6.4.3 Understanding the effect _______________________________________________ 110
6.4.4 Problems encountered that should be considered in future research _____________ 110
6.5 Future research __________________________________________________________ 111
6.6 Final conclusions ________________________________________________________ 113
Appendices ____________________________________________________________________ 115
List of references ________________________________________________________________ 143
Curriculum vitae _______________________________________________________________ 169

1
1 General introduction and outline

2

Chapter 1. General Introduction
3
1.1 The global burden of non-communicable diseases
NCDs are the leading cause of death and account for 63% of deaths worldwide (1). Around 27 million
out of 36 million deaths secondary to NCDs occurred in LMICs in 2010. Among NCDs, CVD, cancer,
chronic respiratory disease and diabetes are the primary causes of death (2). CVD includes angina,
myocardial infarction, transient cerebral ischemic attacks and strokes (3). These diseases alone represent
the major causes of death being responsible of 48% of the deaths secondary to NCDs worldwide (1).
Available data demonstrates that more than 80% of the deaths secondary to CVD and diabetes occurred
in LMICs (1) and NCDs deaths rates in LMICs occur at younger ages in comparison with the same
populations from high-income countries (HICs) (4).
1.1.1 NCDs risk factors
CVD, cancer and diabetes share some common risk factors (3). Several of these risk factors are
potentially modifiable and comprise environmental and behavioral determinants (5). Unhealthy diet and
low physical activity are among the most important behavioral risk factors (1, 5), while an inadequate
built environment constitutes an important environmental determinant (5). As a consequence some
metabolic or physiological CVD risk factors will appear such as high blood pressure, increased BMI,
high plasma glucose, dyslipidemia and increased waist circumference (1, 6). Unhealthy diet and low
physical activity are a priority as they are independent determinants of heart attacks, stroke and cancers
(5). Other risk factors such as low cardiorespiratory fitness and sedentary behavior are also important
for the development of NCDs (7-10).
Worldwide, from 1990 to 2010 risk has shifted from communicable diseases to the NCDs described
previously (11). This might be because risk factors for communicable disease (i.e. childhood
underweight, micronutrient deficiencies and inadequate water sanitation) have fallen globally over the
past/recent decade. In their place, high blood pressure, high BMI and diets low in fruits were among the
main disease burden risk factors in 2010 (11). However, communicable diseases still represent a health
problem in LMICs (2), and NCDs are on the rise leading to a double burden. This double burden affects
the already weak economy of LMICs by increasing health system expenditures and decreasing labor
units (4).
Socioeconomic conditions also play an important role in the risk of NCDs, with the most disadvantaged
populations at higher risk (4, 12). Currently, there is lack of information on the distribution of risk factors
for NCDs with regard to socioeconomic status in LMICs (13). Identifying and understanding the
distribution of risk factors is key to developing effective population intervention programs that aim to
prevent NCDs burden (14, 15).
Although NCDs are responsible of premature deaths in adults (12, 16), adolescent groups also suffer a
large burden of NCDs risk factors (17). The prevalence of overweight and obesity have increased

Chapter 1. General Introduction
4
worldwide (18, 19). In addition, a large body of evidence has documented high prevalence of several
risk factors for CVD and other NCDs during adolescence such as abdominal obesity (20), dyslipidemia
(21, 22), high blood pressure (23), low fruit and vegetable intake (24) and low physical activity (25).
Currently sexual and reproductive health are the main target in adolescents health research (17) and little
has been done to improve the understanding of NCDs risk factors and its consequences later in life (26-
28). Available data suggests that the occurrence of NCDs risk factors at this age period may not
immediately affect adolescent health but can have a negative impact on the health of future generations
(29). Several studies have indicated that the atherosclerotic process start in childhood and adolescence
but its clinical consequences will occur several years later. Besides the coexistence of various risk factors
during this sensitive period has been associated with a greater severity of atherosclerotic lesions (30).
For example low intake of fruit and vegetables during childhood and adolescence has been correlated
with arterial stiffness in young adulthood and the coexistence of various risk factors such as high BMI,
dyslipidemia and high blood pressure. All of these factors have been associated with greater
atherosclerotic defects (30). The importance of promoting lifestyle changes among children and
adolescents is a matter of immediate concern (31).
Evidence shows some behavioral risk factors such as unhealthy dietary intake and sedentary behavior
increases from childhood to adolescence (32). This trajectory is the consequence of various factors such
as increased autonomy and independence, the change from primary to secondary school and a larger
influence of peer pressure and social media (33). The presence of these risk factors at this age period is
associated with some metabolic risk factors such as abdominal obesity, abnormal blood lipid profile and
increased glucose plasma levels (34).
1.1.2 NCDs in Latin America
The situation of NCDs in Latin American countries is similar to other LMICs. Recent data demonstrates
the coexistence of overweight and obesity with under nutrition at household and individual level among
nine Latin American countries (35). As for LMICs, NCDs are the leading cause of death in the general
population; diabetes deaths will increase with 50% and more than 50% of males and 60% of females
will be overweight or obese by 2030 (36). NCDs start affecting poor populations and will become
diseases of the lower socioeconomic strata. This shift of NCDs from high to low socioeconomic groups
tends to affect the urban areas first (36).
Increased BMI is responsible of 10% of the general disease burden and together with high blood pressure
are the most predominant risk factors conductive to NCDs in Latin America (11). Specifically in Andean
Latin America, high blood pressure, high BMI, high fasting glucose and diets low in fruits are within
the ten leading causes of death in the general population (11). This concurs with the concomitant aging
population, urbanization and money spending on television devices, cars and processed foods (36).
Chapter 1. General Introduction
5
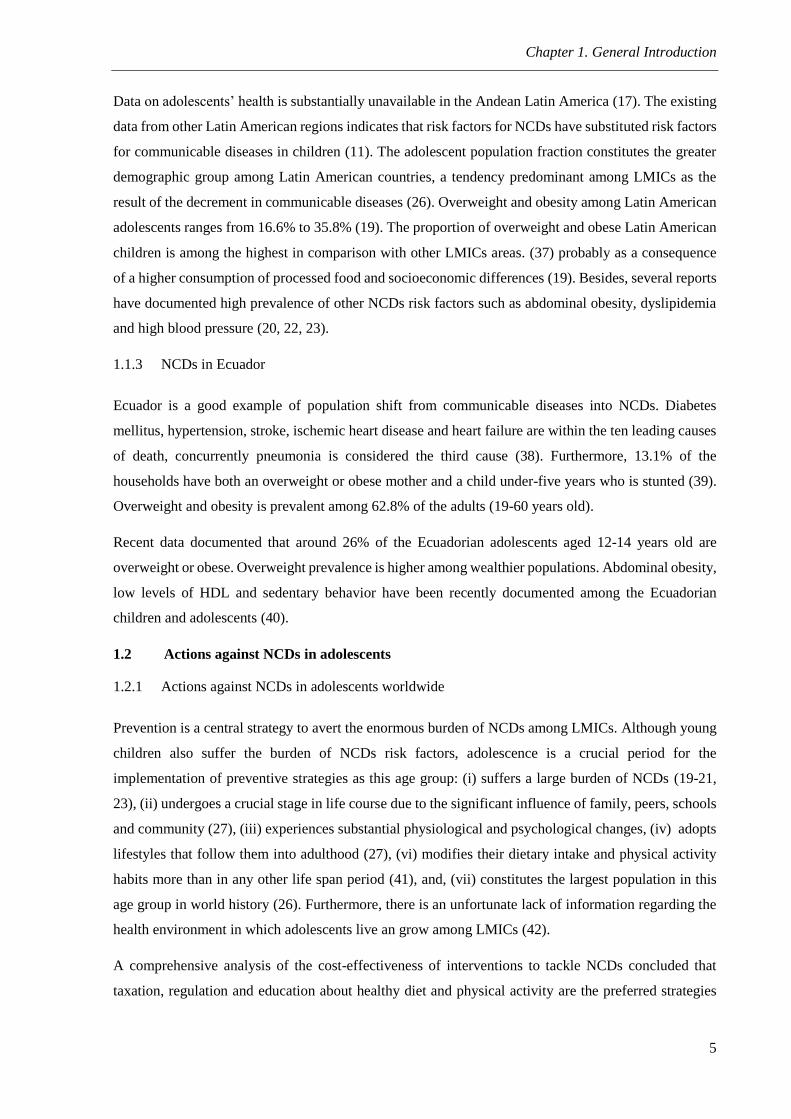
Data on adolescents’ health is substantially unavailable in the Andean Latin America (17). The existing
data from other Latin American regions indicates that risk factors for NCDs have substituted risk factors
for communicable diseases in children (11). The adolescent population fraction constitutes the greater
demographic group among Latin American countries, a tendency predominant among LMICs as the
result of the decrement in communicable diseases (26). Overweight and obesity among Latin American
adolescents ranges from 16.6% to 35.8% (19). The proportion of overweight and obese Latin American
children is among the highest in comparison with other LMICs areas. (37) probably as a consequence
of a higher consumption of processed food and socioeconomic differences (19). Besides, several reports
have documented high prevalence of other NCDs risk factors such as abdominal obesity, dyslipidemia
and high blood pressure (20, 22, 23).
1.1.3 NCDs in Ecuador
Ecuador is a good example of population shift from communicable diseases into NCDs. Diabetes
mellitus, hypertension, stroke, ischemic heart disease and heart failure are within the ten leading causes
of death, concurrently pneumonia is considered the third cause (38). Furthermore, 13.1% of the
households have both an overweight or obese mother and a child under-five years who is stunted (39).
Overweight and obesity is prevalent among 62.8% of the adults (19-60 years old).
Recent data documented that around 26% of the Ecuadorian adolescents aged 12-14 years old are
overweight or obese. Overweight prevalence is higher among wealthier populations. Abdominal obesity,
low levels of HDL and sedentary behavior have been recently documented among the Ecuadorian
children and adolescents (40).
1.2 Actions against NCDs in adolescents
1.2.1 Actions against NCDs in adolescents worldwide
Prevention is a central strategy to avert the enormous burden of NCDs among LMICs. Although young
children also suffer the burden of NCDs risk factors, adolescence is a crucial period for the
implementation of preventive strategies as this age group: (i) suffers a large burden of NCDs (19-21,
23), (ii) undergoes a crucial stage in life course due to the significant influence of family, peers, schools
and community (27), (iii) experiences substantial physiological and psychological changes, (iv) adopts
lifestyles that follow them into adulthood (27), (vi) modifies their dietary intake and physical activity
habits more than in any other life span period (41), and, (vii) constitutes the largest population in this
age group in world history (26). Furthermore, there is an unfortunate lack of information regarding the
health environment in which adolescents live an grow among LMICs (42).
A comprehensive analysis of the cost-effectiveness of interventions to tackle NCDs concluded that
taxation, regulation and education about healthy diet and physical activity are the preferred strategies

Chapter 1. General Introduction
6
(5). Schools are popular and ideal settings to implement health promotion interventions aiming at obesity
prevention and/or improvement of dietary and physical activity in children and adolescents. Literature
shows that obesity prevention should include multiple settings such as home, school and community
(4). The available evidence indicates a limited effect of behavioral school-based health promotion
interventions highlighting the importance to combine this approach with boarder strategies that include
several environments. However, without the implementation of robust school-based policies and
programs aiming at improving dietary intake and physical activity, obesity prevalence rates are expected
to keep rising (43). Therefore, programs aiming at improvements in the school environment and
strengthening connections between young people, parents and the school are crucial for improving
health outcomes during this age period (27, 43-45). Furthermore, schools offer the opportunity to target
the environmental and individual determinants of dietary and physical activity behavior (44), as children
spend most of the time outside home at school, an important fraction of the daily out of home energy
intake is obtained at school (46) and a successful education system relies on their students health (43).
Systematic reviews of school-based interventions targeting healthy eating and physical activity indicate
that the inclusion of educational and environmental components (44), the involvement of parents, and
long term interventions yields positive results in obesity prevention (47). Yet, the majority and higher
quality studies in the research area originate from HICs (45)
1.2.2 Actions against NCDs in Latin American children and adolescents
Currently, all Latin American countries have programs to tackle stunting among young children with
cash transfers and food distribution programs, but most of the countries are just starting to take their first
steps in NCDs and obesity prevention (35, 48, 49). Worryingly, little is done at national level to prevent
adolescents’ excess weight (19) and there is even some evidence that the programs aiming to tackle
under nutrition may be contributing to the obesity epidemic (35). The policies implemented in the Latin
America region include regulation of the food served at schools, educational programs or food labeling,
but there is limited evidence of the effectiveness and implementation of the running policies (49).
Some school-based interventions targeting healthy eating or physical activity have been implemented in
a number of Latina American countries such as Chile, Mexico and Brazil (50). The majority of the
programs included nutrition education and/or extra physical education sessions. Only few programs
addressed the environment or included parents. Unfortunately, such approaches have not been
performed in the Andean Latin American region. The available reports show important deficiencies.
The programs are usually short term, target small at risk populations (51), show deficiencies in their
designs and evaluations (45, 49, 51) or do not document the implementation process (45).

Chapter 1. General Introduction
7
1.2.3 Actions against NCDs in Ecuadorian children and adolescents
Among the strategies to tackle NCDs in Ecuadorian children and adolescents, the National Ministry of
Public Health is providing guidelines for children and adolescents’ primary and secondary health care
for public health centers. Guidelines to promote healthy eating and breastfeeding are distributed among
the primary health workers (52). For adolescents, a guideline with nutritional counseling instructions is
available for primary health care providers in the public sector. The guideline contains instructions to
(i) monitor and report the weight status, nutrition quality, sedentary behavior and familiar background
in adolescents attending the primary health care units, (ii) perform workshops with healthy weight
adolescents diagnosed with at least three NCDs risk factors, and (iii) treat and prevent complications
among overweight and obese children and adolescents. All this strategies are applicable only among
adolescents and their parents/guardians that attend voluntarily public primary health care units (52). In
parallel, a national regulation for food-tuck shops operating in public and private schools was passed
(53). Food-tuck shops are private small shops that function independently from the school. They are
regulated and selected in an open contest by the Ministries of Health and Education. The regulation
comprises specifications about infrastructure, food safety and food quality. The food quality regulates
the maximum levels of total fat, sugar and salt for pre-packed processed foods (See Table 23 for details).
For recipes prepared in the food-tuck shops, local traditional recipes are encouraged (53) and
recommended to contain a maximum energy content of 410 kcal per served portion. Other policies or
actions targeting schools are currently unavailable.
1.3 Research area
1.3.1 Socio-demographic characteristics
Ecuador is a Latin American country located in northwestern South America. It is bordered by Peru in
the south and east, by Colombia in the North and the Pacific Ocean in the west. The main language is
Spanish. Ecuador’s land area is 256.370 km2 with four geographic regions: (i) the coast (Pacific
coastline), (ii) the highlands (Andean mountains), (iii) the Amazon rainforest located in the eastern part,
and (iv) the Galápagos Islands. The country is divided in 24 provinces spread over the geographic
regions (Figure 1). Ecuador is an upper middle-income country (54) with 15.7 million inhabitants (55).
Life expectancy was 74.4 years in men and 79.8 years in women in 2010 (56). An estimated 67% of the
population lives in urban areas (57), adolescents represent 20% of the total population. The distribution
of ethnic groups is 71.9% “mestizos”, 7.4% “montubios”, 7.2% afro-Ecuadorians, 7% indigenous, 6.1%
white and 0.4% other minor ethnic groups (57).
The research was conducted in school-going adolescents from Cuenca and Nabón, both located in the
Azuay province at the southern Andean highlands (Figure 1). Cuenca, at 2350m above sea level has
505 585 inhabitants and constitutes the third largest city in the country (58, 59). In Cuenca 38.2% of the

Chapter 1. General Introduction
8
inhabitants are poor (60), of which 4.9% illiterate, 1% indigenous and 65% of the total population live
within the urban boundaries of the city (57). Nabón is located 68 km from Cuenca at 3000 m above sea
level has 15 892 inhabitants (59, 61). It is one of the poorest cantons with the largest indigenous
population in the province (87.8% inhabitants are poor, 19% are illiterate and 32% are indigenous) (62)
and only 7% of the total population live within an urban area.
Figure 1 Location of the research area of Cuenca and Nabón in Ecuador
1.3.2 The Ecuadorian school system
At the time of the study, the Ecuadorian school system comprised three levels: elementary school (3-5
year old children), primary school (1st-7th grade; 6-11 year old children), and high school (8th to 10th
grade and 1st-3rd bachelor; 12-17 year old adolescents). In Cuenca, there are both private and public
schools with contact hours either in the morning (7am-1pm) or in the afternoon (12am-6pm). In Nabón
there are only public schools, all with contact hours during the morning. All the public schools are for
free and the private schools charge a monthly fee regulated by the Ministry of Education in each
particular case. In both areas, schools have a break of approximately 30 minutes. A school year in the
Ecuadorian Andean highlands runs from September to June. Most (73%) adolescents between 12 and
17 years of age regularly attend high school in Cuenca, while 58% do so in Nabón (15). All schools
must follow a standard curriculum and use books provided by the government.

Chapter 1. General Introduction
9
1.4 Program framework
This PhD targets risk factors for the development of NCDs with a main focus on metabolic CVD risk
factors and particularly on dietary intake. The research was conducted in the framework of the “Food
Nutrition and Health Program”, in the context of the cooperation between the University of Cuenca,
Ecuador and the Ghent University, Belgium. The program aimed at improving dietary intake and
physical activity patterns among a group of Ecuadorian adolescents in the context of nutrition transition.
Dietary intake and physical activity were chosen based on literature, previous unpublished studies and
the experience of the research team. With this purpose, the program designed and implemented a
culturally appropriate multi-component school-based health promotion intervention. The intervention
followed a systematic approach and was organized in three steps: (i) the needs assessment, (ii) the design
and implementation of the intervention and (iii) the evaluation of the intervention. This section describes
the methodology of the full “Food Nutrition and Health Program” (Figure 2). Figure 5 illustrates the
components of the program that will be addressed in the present document. The program is funded by
the VLIR (UOS) http://www.vliruos.be/ and by Nutrition Third World http://www.nutrition-ntw.org/.
Figure 2 Framework of the “Food Nutrition and Health Program”
1. The needs assessment
Cross-sectional data / Description of the health problem (CVDs risk)
Metabolic risk factors
Dietary intake
Physical fitnessFocus groups / Individual and environmental factors influencing dietary intake and physical activity (Conceptual framework)
Systematic review of school interventions targeting dietary intake or physical activity for the prevention of obesity
2. Design of an evidence-based school health promotion intervention
The Intervention Mapping and Comprehensive and Participatory Planning and Evaluation framework
Identification of intervention objectives strategiesand components
3. Evaluation of the school health promotion intervention
The effect evaluation
Effect on dietary intake, BMI, blood pressure and waist circumference
Effect on physical activity, physical fitness and sedentary behavior
The process evaluation

Chapter 1. General Introduction
10
1.4.1 The needs assessment
Complex interventions in public health should be adapted to the local context and use the best evidence
available (63). Moreover, a wide understanding of the process of behavior change (63) as well as a clear
definition of the health problem and its associated determinants are highly recommended (64). Since
information for Ecuadorian adolescents was unavailable, an updated screening of CVD risk factors and
influential factors among adolescents in the research context was performed. Cross-sectional data
collection (65-67), focus groups discussions with adolescents, parents, and school staff from Cuenca
and Nabón (68, 69), and a systematic review of the school-based interventions implemented in LMICs
were performed (45). This section summarizes the needs assessment activities and provides an overview
of the main results used to design the school-based health promotion intervention.
1.4.1.1 Cross-sectional data. Description of the health problem. CVD risk factors among
adolescents from Cuenca and Nabón (Chapter 2)
A cross-sectional study was conducted from January 2008 until April 2009 among 779 adolescents
attending 8th, 9th and 10th grade in an urban area (Cuenca) and a rural area (Nabón). A two stage cluster
random sample of 606 adolescents was taken from Cuenca, while in Nabón all the school-going
adolescents from the four schools willing to participate were included (n = 173). A subgroup of 334
adolescents volunteered from both rural and urban area for blood sample determinations. Data collection
included anthropometry (height, weight and waist circumference), blood pressure, dietary intake by
means of two 24 hour recalls one during a week-day and a second one during a weekend-day randomly
selected, physical fitness by using the full EUROFIT battery (70), socio-demographic characteristics
measured by Unsatisfied Basic Needs (UBN) (71) and blood lipid determinations in the subsample
(blood glucose, total cholesterol, LDL cholesterol, HDL cholesterol and triglycerides). This study was
approved by both the Ecuadorian (COBI 2008/FWA00002482) and Belgian Ethics Committees (Nr
2008/462). An extra protocol for biochemical determinations was approved by the Ghent University
Hospital Ethics Committee (Nr 2008100-97). This study provides detailed information of the (i)
prevalence of metabolic CVD risk factors, (ii) dietary intake and fitness condition of adolescents in the
research area, (iii) differences in metabolic risk factors, dietary intake and physical fitness by place of
residence (Cuenca vs. Nabón) and UBN of the participants (poor vs. better-off) and, (iv) associations
between dietary intake and fitness condition with metabolic CVD risk factors.
1.4.1.2 Focus groups. Identification of Individual and environmental factors influencing dietary
intake and physical activity (Conceptual framework)
Intervention studies incorporating theoretical frameworks to address population-specific individual and
environmental influences on dietary and physical activity behavior are required (72). Twenty focus
groups (N=144 participants) were conducted from April to September 2008, 12 with adolescents aged
11–15 years old, four with parents and four with school staff to develop a conceptual framework for

Chapter 1. General Introduction
11
health promotion interventions aiming to change dietary intake and/or physical activity in Ecuadorian
adolescents. The discussions were performed in a convenient sample of three schools in Cuenca and two
in Nabón. In Cuenca, schools were categorized into low, middle, and high socio-economic based on the
type of school (public/private) and school fees (monthly fee in $), there were only schools of low socio-
economic level in Nabón. To better understand the individual and environmental factors influencing
Ecuadorian adolescents’ dietary and physical activity behavior, we used a theoretical framework to
conceptualize and analyze the findings. To ensure the cultural appropriateness of this framework, the
socio-cognitive variables from the ‘Attitude, Social influences and Self-efficacy’ model (73) were
nestled within the socio-cultural and physical context of adolescents’ environment as elaborated by the
socio-ecological model (74). Findings from the focus groups were grouped into individual and
environmental factors influencing eating and physical activity behavior. The ‘Attitude, Social influences
and Self-efficacy’ model suggests that behavior change can be explained by three factors, attitudes,
social influence and self-efficacy. Additionally, some barriers and lack of skills can limit the behavior
change. As the target behaviors are also influenced by the environment the ASE-model was combined
with the socio-ecological model that considers that behavior can be influenced by the intrapersonal,
interpersonal, organizational, community, and societal environment (75). As a result the identified
cultural specific factors were used to generate a conceptual framework for developing health promotion
interventions in Ecuador (68). The generated conceptual frameworks for dietary intake and physical
activity are provided in Appendixes 1 and 2.
1.4.1.3 Systematic review of the school-based interventions targeting dietary intake or physical
activity for the prevention of obesity
As a summary of the effectiveness of school-based interventions from LMICs targeting dietary intake
and/or physical activity behaviors was unavailable, we performed a systematic review of the effects of
school-based interventions in LMICs aimed at the primary prevention of obesity through changes in
dietary behavior, physical activity behavior, or both in children and adolescents 6–18 y of age. The
review aimed at identifying effective pathways that alter behavior and/or BMI in school children in
LMICs (45) as well as the weak points of the already implemented strategies.
1.4.1.4 Summary of the results of the needs assessment used to design the intervention
Figure 3 summarizes the main findings of the needs assessment used to design the school-based
intervention. Briefly, the cross-sectional data showed that overweight/obesity, abdominal obesity, high
blood pressure and dyslipidemia were prevalent in the population (66). Adolescents consumed
insufficient fiber, fruit and vegetables, and an excess of added sugar, refined cereals and processed foods
during snacks. Moreover, an important share of the participants reported not to consume breakfast (67)
and exhibited low levels of aerobic capacity (65). Modest differences in the described risk factors by
socio-economic status and by place of residence were found. A detailed description of these differences
is presented in Chapter 2.

Chapter 1. General Introduction
12
The conceptual framework identified the following individual and environmental factors influencing
healthy eating in the research area: lack of knowledge, financial autonomy (greater accessibility to
pocket money), food safety perceptions, lack of self-control, taste preferences and perceived peer-norms
were the most relevant individual factors. Environmental factors comprised poor nutritional quality of
food at school, and lack of time with its associated preparation of convenience food at home (68). With
regard to physical activity behavior, preference for sedentary activities, poor knowledge, insufficient
time and laziness were among the individual influential factors, whilst, lack of opportunities to be active
at home and school unsupportive parents and lack of role models figured within the environmental
factors (69). As with the cross-sectional data, only few differences in healthy eating and physical activity
influential factors were found by socio-economic status and place of residence (68, 69). Price and
availability of healthy food were barriers for healthy eating mainly in the rural area. Financial autonomy
(pocket money) was found to be an influential factor for healthy eating mainly in the higher socio-
economic strata. Female adolescents were not allowed to perform leisure physical activity in the rural
area. In addition, crime and traffic concerns were reported in the urban area. Additional analysis
(structural equation modeling) concluded that the majority of the hypothesized inter-relationships of
individual and environmental factors were confirmed (76).
Finally our systematic review of the school-based interventions performed in LMICs concluded that
similar program characteristics (with HICs) are associated with an increased effect. Multicomponent
interventions addressing dietary and physical activity behaviors, those including parents or families,
attached to the school curriculum and supporting changes in the school environment were reported to
be more effective (45). Nevertheless, high quality theory-based interventions and process evaluation are
often lacking in LMICs (45).
1.4.2 The intervention design and implementation
1.4.2.1 Design of the intervention
The results of the needs assessment were used to define the intervention objectives and strategies
assuring appropriateness of the intervention to the target population. The intervention named
ACTIVITAL was developed using the Intervention Mapping (IM) (77) and the Comprehensive and
Participatory Planning and Evaluation (CPPE) (78). The IM provided a framework for effective decision
making in the development, implementation and evaluation of interventions considering the ways to
guide the behavior change associated with the health problem (77). Meanwhile, with the CPPE,
workshops are performed to develop a causal model of the health problem (here unhealthy diet and low
physical activity) and to identify possible intervention strategies according with the perceptions of key
stakeholders (school staff and adolescents). Figure 4 shows the process used to design the intervention
by combining both approaches. The idea behind using these two techniques was to adapt the intervention
objectives and strategies (as described in the IM framework) in order increase acceptability and

Chapter 1. General Introduction
13
appropriateness in the target groups. Figure 4 summarizes the main outputs of the causal model after
the CPPE as well as the steps within the IM in which the CPPE outputs were integrated. In general, the
transversal themes generated during the causal model together with the results of the needs assessment
contributed for the identification of the intervention objectives and matrices (Step 2 of the IM). Later
the possible intervention strategies identified during the CPPE were combined with the IM techniques
to define the final intervention strategies (Step 3 of the IM). A detailed description of the intervention
design is provided in a separate thesis (76).
In summary, the following specific intervention objectives were set: adolescents (i) decrease their sugar
intake, (ii) increase their daily fruit and vegetable intake, (iii) decrease their unhealthy snack intake, (iv)
increase their healthy breakfast intake, (v) decrease daily screen time, and (vi) increase physical activity.
Additionally, schools offer (vii) more healthy food at their food-tuck shops, and, (viii) more
opportunities for being active. These objectives were translated into performance objectives. The
performance objectives were listed against the factors influencing dietary intake and physical activity
behaviors identified in the needs assessment and in the causal model. This procedure generated separate
matrices of change objectives for adolescents, parents and school staff. Finally, different effective
theoretical methods for each influential factor in the matrices were identified (i.e. behavioral change
techniques) from literature (79, 80) to translate change objectives into intervention strategies. These
strategies were then cross-linked with the results of the CPPE to define the final strategies. Appendix 3
contains the matrices of the theoretical methods and the related intervention strategies used to tackle
each influential factor. The generated intervention strategies and activities were then integrated into two
intervention components: a curriculum-based component and an environment-based component. The
curriculum-based component consisted of the implementation of a nutrition and physical activity
educational tool-kit, while the environment-based component comprised healthy eating and physical
activity educational workshops with parents and healthy eating workshops with food-tuck shop staff,
the implementation of a walking trail and social events such as the preparation of a healthy breakfast at
school.
1.4.2.2 Intervention strategies and components (Chapter 3)
In the control schools, no additional activities other than the existing national curriculum followed by
health science school teachers were covered. These included food groups (the food pyramid), physiology
of nutrition and digestion, nutrients structure and nutritional disorders. These topics were addressed in
two lessons throughout the entire school year.

Chapter 1. General Introduction
14
Cross-sectional data / Description
of the health problem (CVD risk)
Focus groups / Individual and
environmental factors influencing
dietary intake and physical activity
Systematic review of school
interventions targeting dietary
intake or physical activity for the
prevention of obesity
1. Metabolic Risk Factors Overweight (18%)
Obesity (2%)
Abdominal obesity (20%)
Dyslipidemia (34%)
High blood pressure (6%)
2. Dietary intake Insufficient fiber, fruit and
vegetables
Excess of added sugar,
refined cereals and
processed foods during
snacks
No breakfast consumption
(18%)
3. Physical fitness Low levels of aerobic
capacity (59%)
1. Heathy eating Individual factors Awareness: association of
healthy eating only with food
safety and home-growth
Attitudes: positive
Self-efficacy: low
Habit strength: strong unhealthy
habits at high school
Subjective norm: embarrassment
to eat healthy
Taste: preference of sweets and
fatty foods
Financial autonomy: pocket
money in high school
Perceived barriers: cost and
availability
Environmental factors Family: inconsistent rules,
modeling, availability and
permissiveness
School: high availability of
unhealthy food
Socio-cultural environment:
media and higher availability of
unhealthy food
1. Effective pathways Target both diet and physical
activity
Involve multiple stakeholders
Integrate educational activities
into the school curriculum.
2. Weak points Poor design
Short follow-up
Lack of documentation of the
implementation process
2. Physical activity Individual factors Awareness: poor knowledge
Attitudes: positive
Self-efficacy: low
Habit strength: preference of
sedentary activities
Subjective norm: leisure physical
activity inappropriate for rural
girls
Perceived barriers: lack of
skills/time
Environmental factors Family: media use, rules, lack of
opportunities and role modeling
School: lack of rules, financial
constrains
Socio-cultural environment:
media, transport
Built environment; traffic, crime
concerns
Figure 3 Summary of the results of the needs assessment used to design the intervention

Chapter 1. General Introduction
15
Figure 4 Design of the pair-matched cluster randomized controlled trial ACTIVITAL by integrating the CPPE and the IM
1. Needs
assessment
2. Intervention
objectives and
matrices
3. Theory-based
methods and
strategies
4. Design of the
materials
5. Implementation
plan
6. Evaluation plan
Environmental level Availability and accessibility
Individual level Psychological problems, skills, taste,
preferences, social influence, habits, time,
convenience and national legislations. Healthy eating
behavior
Physical activity
behavior Environmental level Availability, accessibility and crime
concerns
Individual level Peer and social influence, skills, injury and
time
1, Availability of clean, fresh and palatable fruit at school. 2. Additional opportunities for physical activity 3. Healthy eating advice to the parents
CPPE Intervention
Mapping
1. Transversal
themes
2. Intervention
strategies

Chapter 1. General Introduction
16
In the intervention schools, the ACTIVITAL program was implemented in two stages. Briefly, the first
stage comprised three activities: (i) participatory workshops with school staff and adolescents in order
to assure the cooperation throughout the process and to revise the implementation strategy, (ii) healthy
eating and physical activity introductory workshops with school staff and adolescents, and (iii) the
implementation of intervention package one. Stage two only included the implementation of
intervention package two. Details of the intervention packages are provided in Chapter 3.
1.4.2.3 Participants and randomization
This study targeted 12- to 14-year-old adolescents attending schools in the urban area of Cuenca from
September 2009 until June 2012. The trial aimed to improve dietary intake and physical activity. The
decision was based on the causal model and on the needs assessment results (68, 69).
A pair-matched cluster randomized controlled trial was designed with the schools (clusters) as units of
randomization. A sample of 10 school pairs was selected. Pair selection criteria included: same type of
schools (public/private), same gender of schools (male/female/co-ed schools) and no more than a 15%
difference in size (total number of students) and 30% difference in socioeconomic status (monthly fee
in $). From the 10 allocated pairs, each school was randomly assigned to either the treatment or the
control group. In each school, two 8th and two 9th grades were randomly selected. All adolescents from
these grades were invited to participate and 70 students were selected at random. A total of 10 matched
pairs of schools including an average sample of 65 children per school considering a Type I error of 5%,
a coefficient of between-cluster variation Km of 0.15 and a power of 80% (81), enabled the detection of
a decrease in 10% of the energy percentage derived from fat. This corresponded to a total sample size
of 1300 adolescents in 20 schools. Considering an expected 10% dropout we sampled 1430 adolescents.
1.4.2.4 Ethics
A separate protocol was written for the intervention study. This protocol was also approved by the ethics
committees of the University Central in Quito-Ecuador and the Ghent University Hospital in Belgium
(COBI- 2009/FWA00002482, B67020084010). The study was registered on ClinicalTrial.gov with
identifier NCT01004367.
1.4.2.5 Outcomes
Primary outcomes were food intake, physical activity, physical fitness and sedentary behavior. BMI,
waist circumference and blood pressure were the secondary outcomes. Anthropometry measures were
not within the primary outcomes based on the results of the causal model and on the needs assessment
(68, 69) and to reduce the chance of stigmatization and of contributing to eating disorders or distorted
perceptions of body image (82).

Chapter 1. General Introduction
17
1.4.3 Evaluation of the intervention
1.4.3.1 The effect evaluation
The effect evaluation was performed following the CONSORT statement for RCTs (83, 84). The effect
on primary and secondary outcomes was analyzed by applying an intention to treat analysis using linear
mixed effects models. Subgroup analysis by age, weight status and UBN of the outcomes with a
significant effect at the end of the intervention were also performed.
1.4.3.2 The process evaluation
Complex interventions, such as behavioral interventions are implemented at various levels and with
multiple audiences. They require exhaustive PE to help understanding the pathways of change, describe
the actual activities implemented and assess the opportunities to implement the intervention in real
practice. A pre-specified PE protocol was also developed and used to systematically document the
intervention activities. The PE documented: (i) the implementation of the curriculum and environment-
based components; (ii) the attitudes of teachers, food-tuck shop owners, parents and adolescents towards
the intervention; and (iii) factors in the external environment affecting the implementation of the
intervention components at each school. The systematic and stepwise approach as described by Saunders
et al. was used as the framework to design and analyze the PE data (85).
1.5 Research questions, hypothesis and objectives of the thesis
Within the “Food Nutrition and Health” program framework three different PhDs were developed, one
provided details of the intervention design (76), a second one will analyze the intervention effect on
physical activity, physical fitness and sedentary behavior. This PhD describes part of the needs
assessment, analyzes the intervention effect on dietary intake, waist circumference and blood pressure
and describes the implementation process of the intervention (Figure 5).
In detail, this thesis aims to (i) explore the distribution of NCDs risk factors with a major focus in
metabolic CVD risk factors and dietary intake behaviors among adolescents living in urban and rural
Ecuadorian setting from different socio-economic backgrounds, (ii) analyze the effect on dietary intake,
blood pressure, BMI and waist circumference and, (iii) the implementation process on strategies related
with dietary intake outcomes (i.e. classes and workshops focusing on dietary intake outcomes) of a
school-based health promotion intervention.
1.6 Specific objectives of the PhD research
Understand the distribution of metabolic CVDs risk factors among school-going adolescents
with different socioeconomic background living in an urban (Cuenca) and a rural (Nabón) area.
Describe the dietary intake behavior of school-aged Ecuadorian adolescents living in an urban
(Cuenca) and a rural (Nabón) area.

Chapter 1. General Introduction
18
Examine the association between dietary intake and metabolic cardiovascular risk factors
among school-going adolescents living in an urban (Cuenca) and a rural (Nabón) area.
Evaluate the effect of the ACTIVITAL school-based health promotion intervention program on
risky dietary behaviors, BMI, waist circumference and blood pressure among school-going
Cuencan adolescents.
Evaluate the effect of the ACTIVITAL school-based health promotion intervention according
to important subgroups.
Document the PE of the ACTIVITAL school-based health promotion intervention, and,
Link the PE data with the intervention effect
1.7 Thesis outline
Figure 5 Thesis chapters within the “Food Nutrition and Health” framework
1. The needs assessment
Cross-sectional data / Description of the health problem (CVD risk)Chapter 2
Metabolic Risk FactorsChapter 2
Dietary intakeChapter 2
Physical fitnessSeparate thesis (Summary in Chapter 1)
Development of a conceptual framework of the individual and environmental factors influencing risky behaviors.Separate thesis (Summary in Chapter 1)
Systematic review of school interventions targeting dietary intake or physical activity for the prevention of obesity. Separate thesis (Summary in Chapter 1)
2. Design of an evidence-based school health promotion intervention
The Intervention Mapping and Comprehensive and Participatory Planning and Evaluation framework Separate thesis (Summary in Chapter 1)
Intervention objectives strategies and componentsChapter 1 and Chapter 3
3. Evaluation of the school health promotion intervention
The effect evaluationChapter 3 and 4
Effect on physical activity, physical fitness and sedentary behaviorSeparate thesis
Effect on dietary intake, blood pressure and waist circumferenceChapter 3 and 4
The process evaluationChapter 5 Process evaluation of dietary oriented strategies

Chapter 1. General Introduction
19
Chapter 2 describes the distribution of metabolic CVD risk factors and characterizes the diet according
to socio-economic status, sex and place of residence of adolescents from Cuenca and Nabón.
Additionally, associations between dietary intake and metabolic risk factors are assessed.
Chapter 3 presents details of the intervention program and analyzes the intervention effect on diet,
BMI, waist circumference and blood pressure. Chapter 4 examines the differential effect of the school-
based intervention according with socio-economic status, age and weight status of the participants.
Chapter 5 describes the intervention implementation and provides an overview of the implementation
challenges by means of a PE.
Finally, Chapter 6 summarizes the main findings, contextualizes the intervention program in the
political and health reality of Ecuadorian adolescents and provides recommendations for policy makers
and future research
.

20

21
2 Prevalence of metabolic risk factors of
cardiovascular disease and dietary intake
behaviors among adolescents from Cuenca
and Nabón
Redrafted after
A. Ochoa-Avilés, S. Andrade, T. Huynh, R. Verstraeten, C. Lachat, R. Rojas, S. Donoso, B. Manuel-y-
Keenoy and P. Kolsteren. Prevalence and socioeconomic differences of risk factors of cardiovascular
disease in Ecuadorian adolescents. Pediatric Obesity, 2012, vol. 7, no 4, p. 274-283.
A. Ochoa-Avilés, R. Verstraeten, C. Lachat, S Andrade, J. Van Camp, S. Donoso and P. Kolsteren.
Dietary intake practices associated with cardiovascular risk in urban and rural Ecuadorian adolescents:
a cross-sectional study. BMC Public Health, 2014, vol. 14, no 1, p 939.

22

Chapter 2 Metabolic risk factors and dietary intake
23
2.1 Summary
Objective: This chapter aims to provide detailed information of the (i) prevalence of metabolic CVD
risk factors, (ii) dietary intake of adolescents in the research area, (iii) differences in metabolic risk
factors and dietary intake by place of residence (Cuenca vs. Nabón) and UBN of the participants (poor
vs. better-off) and, (iv) associations between dietary intake with metabolic CVD risk factors.
Methods: A cross-sectional study was conducted from January 2008 to April 2009 among 606
adolescents from the 8th, 9th and 10th grade in an urban area (Cuenca), and 173 adolescents from a rural
area (Nabón) in Ecuador. Data collection involved measuring anthropometric data (weight, height and
waist circumference), blood pressure, dietary intake (2-day 24h-recall) and socio-demographic
characteristics. Fasting blood lipids and glucose were measured in a subsample of 334 adolescents.
Results: Dyslipidemia (34.2%), abdominal obesity (19.7%) and overweight (18.0%) were the most
prevalent risk factors. Boys were 3.3 times (P < 0.001) more likely to have risk levels of blood pressure.
Children from better-off socioeconomic strata were 1.6 times (P = 0.021) more likely to be
overweight/obese and 1.5 times (P = 0.046) more likely to have abdominal obesity. Children living in
the rural area were 2.8 times (P = 0.004) more likely to have dyslipidemia than those from the urban
area. Median energy intake was 1851 kcal/day. Overall, fiber, fish and fruit and vegetables were
scarcely consumed, while added sugar, refined cereals and processed food consumed as snacks either at
school or at home were important constituents of the diet. Some modest differences in dietary intake by
setting or UBN were identified. Adolescents in the better-off group consumed more processed food and
added sugar compared with those in the poor group. Urban adolescents were more likely to consume
whole fruit, fresh fish and oilseeds than rural adolescents.
Two dietary patterns emerged, one labeled as “rice-rich non-animal fat pattern” and the other one as
“wheat-dense animal-fat pattern”. The first pattern was correlated with a moderate increase in glucose
in urban participants, while the second pattern was associated with higher LDL and cholesterol blood
levels in rural participants.
Conclusion: Several metabolic risk factors and dietary practices conducive to CVD and other NCDs
development were identified across the entire group. Effective strategies are needed to prevent CVD
and other NCDs in this group of Ecuadorian population by encouraging a balanced diet, which contains
less refined cereals, added sugar, and processed food, but more fruits, vegetables and whole grain
cereals. Such strategies should involve school and home settings, include participants from different
socio-economic backgrounds, and, target various CVD risk factors. A wider analysis of the health
problem in the rural area is needed.
Keywords: Adolescent, dyslipidemia, overweight, risk factors, dietary intake, Ecuador

Chapter 2 Metabolic risk factors and dietary intake
24
2.2 Introduction
Fresh fruit, vegetables, whole grains and fish consumption have been identified as important dietary
factors protecting against CVD. Meanwhile a high intake of added sugar, sodium and other refined
carbohydrates has been negatively associated with CVD in adults (86-89). Available data of dietary
behavior and metabolic cardiovascular risk factors among adolescents principally originates from HICs
(90, 91), and either takes a few aspects of dietary intake into consideration or focuses on a specific
population group such as overweight adolescents (92, 93). Identifying and understanding the distribution
of risk factors and health related behaviors is key to developing effective population intervention
programs that aim to prevent CVD (14, 15).
This chapter summarizes the prevalence of metabolic CVD risk factors, describes the dietary intake and
analyzes association between dietary intake and metabolic risk in adolescents from different
socioeconomic backgrounds living in Cuenca and Nabón. The findings were used to design the school-
based health promotion intervention ACTIVITAL (Chapter 3).
2.3 Methods
2.3.1 Subjects and sampling
A cross-sectional study was conducted from January 2008 until April 2009 among 779 adolescents
attending 8th, 9th and 10th grade (10 to 16 years old) in Cuenca and Nabón. A sample of 606 adolescents
was taken from the urban area, while in the rural area, all the school-going adolescents from the four
schools in Nabón willing to participate were included (n = 173). A subgroup of 334 adolescents
volunteered from both rural and urban area for blood sample determinations. Energy intake was
considered as the outcome parameter for the sample size calculation as food intake was considered as
the most comprehensive outcome. Given the lack of published data, sample size calculations were based
on the mean energy intake estimated by an unpublished survey (E. Segarra, unpublished data, 2006) that
estimated the average intake to be 1700 kcal among school-going adolescents from Cuenca, Ecuador.
With a precision of 10% and a cluster effect of 2, the sample size needed was 520. Considering an
expected dropout of 14% during the data collection process, the final sample size increased to 593
adolescents.
A two-stage cluster design was used, with schools as the primary sampling unit and classes as the
secondary sampling unit. In total, 30 out of 102 schools in Cuenca were probability proportionate to size
selected according to (i) their type (public or private school) and (ii) their gender (male, female and co-
ed schools) (94). Within each selected school, a full list of the students from 8th, 9th and 10th grade was
obtained and 20 students were selected form each school using a random number list. In total, 600
adolescents (30 clusters x 20 students) were invited to participate. Out of the 30 schools initially
sampled, five schools refused to participate as they feared students would miss classes. Therefore, five

Chapter 2 Metabolic risk factors and dietary intake
25
new schools were selected following the same procedure as described before. For biochemical
determinations, all the students (n = 334, 43% of the total sample) who accepted to participate were
included.
2.3.2 Ethics
A first written consent was obtained from participants and their parents/ guardians for the
anthropometry, blood pressure, food intake and socio-demographic characteristics and a second one for
biochemical determinations. All adolescents with a concomitant disease, following a special diet,
pregnant or that decided not to participate were excluded from the study.
2.3.3 Anthropometric measurements
Anthropometric variables were measured in duplicate by two independently trained interviewers
according to standardized procedures (95). During the measurements, the children wore light clothes
and no shoes. Optimal privacy was assured: girls were measured in a separate room by female
interviewers and boys by male interviewers. Weight was measured and recorded to the nearest 100g
using a digital calibrated balance (SECA 803, Seca GmbH & CO, Hamburg, Germany), and height to
the nearest mm using a portable stadiometer (PORTROD, Health O Meter, USA). BMI was calculated
as weight/height2 (kg/m2). The definition of nutritional status was based on average percentiles;
adolescents were classified as underweight, healthy weight, overweight and obese according to the
International Obesity Task Force criteria (96, 97). Waist circumference was measured at the mid-point
between the last rib and the iliac crest.
2.3.4 Blood pressure
Systolic blood pressure (SBP) and diastolic blood pressure (DBP) were measured and recorded after a
10-min seated rest using an automatic portable sphygmomanometer (Rister, ri-champion® N).
Measurements were carried out by trained staff, on-site and in triple. In order to avoid any false positives,
a fourth measurement was taken after a period of rest when initial values were higher than 120/80
mmHg. If a child was diagnosed with high blood pressure, he/she was referred to a specialist for a final
diagnosis and treatment. Normal blood pressure was defined as average SBP and/or DBP below the 90th
percentile for sex, age and height (98).
2.3.5 Socio-demographic characteristics
Socio-demographic characteristics were assessed using the method developed by the Integrated Social
Indicator System for Ecuador (62) following the World Bank recommendations (99). The approach
measures poverty according to Unsatisfied Basic Needs (UBN) and classifies a household as poor when
one or more serious deficiencies in access to education, health, housing, urban services and employment
opportunities is present. This method is applied in the Ecuadorian national surveys by the National

Chapter 2 Metabolic risk factors and dietary intake
26
Institute of Statistics to classify the participants in one of two groups; ‘Poor group’, if at least one of the
10 deprivations was present (water, electricity, sewerage, overcrowding, education of the head of the
family, illiteracy, maternal deliveries, occupation, illness and schooling) or the ‘Better-off group’, if no
deprivation was reported. Appendix 4 contains the form used to collect socio-demographic data.
2.3.6 Blood sample determinations
Overnight fasting (at least 8 h) blood samples were drawn by venipuncture at the ante-cubital vein. Ten
mL of blood was collected into tubes without anticoagulant and kept on ice. Serum was obtained by two
consecutive centrifugations at 4000 rpm for 5 min. The serum was used for glucose and total lipid profile
determination. Colorimetric enzymatic methods were used to determine fasting glucose (clinical
diagnostic reagent), total cholesterol (CHOD-PAP kit, Human, Wiesbaden-Germany), and triglycerides
(GPO-PAP kit, Human, Wiesbaden Germany) by absorbance measurement using a spectrophotometer
(Genesys 10, Thermo Scientific, Madison, Wisconsin-USA). High-density lipoprotein cholesterol
(HDL) was quantified after precipitation of lipoproteins containing Apo B with fosfotungstic acid and
magnesium chloride. Low-density lipoprotein cholesterol (LDL) was calculated using the Friedewald
formula (100). Precision and accuracy were estimated in the laboratory using commercial validated
standards. The global analytical coefficient of variation for total cholesterol and triglycerides was 3.1%
and 5.7%, respectively. The %bias ranged from 0% to 8% (101).
2.3.7 Definition of metabolic risk factors
The following dichotomy variables were created to define metabolic risk factors: (i) overweight-obese,
being or not either overweight or obese, (ii) abdominal obesity was defined as having a waist
circumference higher than the 80th percentile for age and sex (102), (iii) pre-hypertension and
hypertension were classified together as high risk level of blood pressure when the average SBP and/or
DBP was greater than or equal to the 90th percentile for sex, age and height (98), (iv) risk levels of total
cholesterol were defined when values were greater than or equal to 170 mg/dL, (v) risk levels of LDL
when values were greater than or equal to 110 mg/dL, respectively, (vi) HDL risk levels when values
were lower than or equal to 35 mg/dL (101), (vii) triglycerides risk levels when values were greater than
or equal to 150mg/dL, and (viii) glucose risk levels if values were lower than or equal to 100 mg/dL
(103).
2.3.8 Dietary assessment
Food intake was measured using an interview-administered 2-day 24-hour dietary recall. Days were
randomly allocated to include one recall on a weekday and a second one on a weekend day per each
participant (104). Locally used utensils were calibrated and used to estimate portion sizes in order to
quantify the amounts of food consumed. If the participants did not supply detailed information on the
ingredients used and/or cooking methods of a recipe, recipes were prepared in triple by local

Chapter 2 Metabolic risk factors and dietary intake
27
volunteering housewives. For each of these recipes the ingredients and their weights were measured.
The average was calculated and served as the final estimate for the ingredients and their weight of the
recipe. In the case of uncommon recipes, such as some desserts or traditional dishes, an experienced
cook was asked to prepare the recipe. The ingredients and their weights were recorded and calculated
from this.
Since an up-to-date Ecuadorian food composition database does not exist, a compiled food composition
database was developed using a pre-determined procedure. During the first stage all the 24-hour dietary
recall forms were revised to make a list of all consumed recipes or ingredients. The second stage
involved constructing a database using the following procedure: we searched the U.S. (USDA, 2012)
database, when food items were not available the Mexican database (INNSZ, 1999) was used. If data
could not be obtained, the Central American (INCAP/OPS, 2012) and Peruvian (CENAN/INS, 2008)
databases were searched to compose the final food composition database. For locally processed and pre-
packed food items, food labels were used to obtain the composition. A total of 13 food items were not
available in any of the searched databases and data were obtained from analysis in our lab. In the case
of the latter, 12 samples per food item were randomly taken from local markets and then mixed to form
a composite sample. One analytical portion was analyzed in triplicate for moisture and dry matter, ash,
total fat by Weibull, total nitrogen by the Kjeldahl method and total carbohydrates were determined by
difference (105). Fiber, sodium and potassium content were not available for the 13 food items included
in proximal analysis and could not be found in other databases.
2.3.8.1 Nutrients and recommendations
Added sugar was estimated by including all sugars used in any type of processed or prepared food
(recipes), sugar naturally present in food was excluded from the analysis (88). From a total of 556
identified food items, sugar content was available for 408 of them; either from the USDA or the Mexican
food composition databases. For the remaining 148 food items, sugar content was estimated as follows:
58 food items were coded as containing natural sugar, since they were fruit, vegetables, grains, tubers
or maize. For the remaining food items, either the sugar content of food items with similar nutritional
characteristics was extrapolated (n = 35 food items), food labels were used (n = 42 food items), or the
information of standardized recipes was used to quantify the sugar content (n = 12 food items). The
sugar content of one food item (“Chicha de Jora”) could not be determined and was excluded from the
analysis as it was consumed by only one participant. The following sources of added sugar were
identified as described by Wesh et al.: Sweets (candies and gums, soda, added sugar and syrups, fruit
flavored drinks, pre-sweetened coffees and tea, sport drinks and energy drinks), grains (cake and
cookies, ready to eat cereals, bread and muffins and other grains), fruits and vegetables, dairy (dairy
desserts, milk, yoghurt, and other dairy), protein sources (meat, egg and beans) and fat and oils (88).

Chapter 2 Metabolic risk factors and dietary intake
28
Macronutrients and added sugar energy percentages per day (E%/day) were calculated by dividing the
energy of each variable by the total energy intake per day. Macronutrient E% and sodium intake were
compared with Dietary Reference Intakes for sex and age (106). Since a clear definition of recommended
added sugar intake is not available, we used the US recommendation of consuming <15% E% intake of
solid fats and added sugar (107). Therefore the variable solid fat was generated as described by the U.S.
Department of Agriculture: all excess fat from the milk and meat and beans and solid fats added to foods
in preparation or at the table, including cream, butter, stick margarine, regular or low-fat cream cheese,
lard, meat drippings, cocoa, and chocolate (108). The energy of added sugar and solid fats was summed
up, expressed as E%/day and compared with the threshold of 15%. Total fruit and vegetable
consumption were compared with the 400g/day recommendation of the World Health Organization
(109).
2.3.8.2 Food groups
The food groups used in this study were based on the classification as proposed by the Health
Department of Mexico (110) since this classification is in concordance with the objectives of this study
and both the ingredients and recipes were comparable to those in Ecuador. After adapting this
classification we identified a total of 20 main food groups: (i) white rice, (ii) refined wheat (bread, pasta,
wheat powder), (iii) other refined cereals (tapioca, maize powder, banana powder and any other kind of
powder different from wheat), (iv) whole grain cereals (quinoa, oat, barley), (v) maize, (vi) tubers, (vii)
plantain, (viii) legumes, (ix) total fruit (including raw fruit and fruit used in juices or any other
preparation), (x) vegetables, (xi) poultry, (xii) red meat (including processed meat), (xiii) fish and
seafood, (xvi) dairy products (milk, yogurt, flavored milk, cheese), (xv) oilseeds (nuts, peanuts,
almonds), (xvi) vegetable oils, (xvii) animal fat (butter, mayonnaise, crackling), (xviii) coffee, (xix)
spices and (xx) processed food rich in salt, fat or added sugar included the following subgroups based
on the Mexican classification which comprised (a) table sugar and sweets (honey, candies, chocolates,
ice creams, sweet cookies, traditional sweet desserts and sugar added to juices, coffee, etc.), (b) salty
snacks and fast food (all packaged salty snacks, salty cookies, French fries, pizza, hamburgers) (c) soft
drinks (soda, artificial sweetened juices, energy drinks) and (d) any other packaged food (ketchup,
packaged soups, gelatin). Food groups are presented as E%/day.
Food groups considered as protective (fruit, vegetables, oilseeds and fish) (87, 89) against CVD were
further analyzed in subgroups. As the type of fish could be important in determining this protective
effect (111), we divided the reported fish consumption by processing methods, i.e. (i) fresh fish
including steamed and roasted fish, (ii) fried fish and (iii) canned fish. As preparation methods may play
a role in nutritional value (112), the most common preparation methods of fruit, vegetable, legumes and
oilseeds were also identified.

Chapter 2 Metabolic risk factors and dietary intake
29
2.3.8.3 Mealtimes
Mealtimes were defined as: breakfast, morning refreshment, lunch, afternoon refreshment, dinner and
evening refreshment. The schools in this study have morning and afternoon schedules. In general,
morning schools have classes from 7:00 until 13:00 and afternoon schools from 12:00 to 18:00.
Mealtimes during the week were defined in accordance to these school hours. For morning schools the
times were set as follows: breakfast between 5:00-7:00, morning snack between 7:00-13:00, lunch from
13:00-16:00 and afternoon snack from 16:00–18:00. For afternoon schools the timings were breakfast
from 5:00–8:00, morning snack from 8:00–11:00, lunch from 11:00–12:00, and afternoon snack from
12:00–18:00. Dinner and night snack were set equally for the whole sample from 18:00–21:00 and any
hour later than 21:00 respectively. The weekend’s timing was set equally for all the participants. They
were as follows: breakfast from 5:00–9:00, morning refreshment from 9:00–12:00, lunch from 12:00–
15:00, afternoon refreshment from 15:00–18:00 and dinner from 18:00–21:00.
2.3.9 Data analysis
At the end of each workday, all the forms were collected and revised by the supervisors. In case of
missing data, the researcher returned to the school to collect the information needed. Anthropometric,
socioeconomic and blood lipid data were entered in duplicate into Epidata (Epidata Association, Odense,
Denmark) by two independent researchers. Any discrepancy was corrected using the original forms.
Food intake data was entered using an online software designed to analyze 24-hour recall data (Lucille
software 0.1, 2010, Gent University; www.foodintake.ugent.be). Data were analyzed using Stata
version 11.0. (College Station, TX, USA). The analysis was adjusted for the cluster sampling design, by
using specific survey commands with schools being the primary sampling unit.
Results were expressed as mean ± standard deviation (SD) or as median and interquartile range (IQR)
when data were not normally distributed. Prevalence estimates were reported as percentages with 95%
confidence intervals. A X2 test (or Fisher exact test when cell values were low) was used to compare
frequencies and linear regression models adjusted for UBN, sex and location when appropriate were
used to compare means. When appropriate, continuous variables were transformed into a normal
distribution. A significance level of 5% was used for all statistical tests.
Predictors of metabolic risk factors (sex, UBN and location) were determined using a logistic regression
model. First, the associations between the predictors and each risk factor as dependent variables were
analyzed in bivariate models (BM). Next, predictors with P < 0.1 in the bivariate models were entered
in an adjusted multivariable model (AM). Results are reported as odds ratio (OR) and 95% confidence
interval (CI).
Factor analysis was carried out to identify underlying dietary patterns that could be related with
metabolic risk factors. This analysis was performed including twenty food groups expressed as E%/day.

Chapter 2 Metabolic risk factors and dietary intake
30
The number of factors retained was based on a scree-plot. Food groups with a loading factor below 0.10
were removed from the analysis. Foods with a factor loading above 0.3 were identified as the main
contributors to each pattern (113). A score of each dietary pattern was calculated for each participant.
The scores were split into tertiles in order to identify differences in nutrients and in metabolic risk profile
either in the lower or in the higher tertiles of the identified patterns. Therefore, for each tertile of the
dietary pattern score, the median of the macronutrients E%, added sugar and sodium contribution were
reported as well as the mean of the metabolic risk factors.
Linear regression models were used with two extra purposes: (i) to identify differences in age,
anthropometry, blood parameters, energy intake, macronutrient E%, added sugar, sodium and food
group energy sources, by gender, UBN or place of residence (ii) to compare, macronutrients E%, added
sugar, sodium and metabolic risk factors across the tertiles of the dietary patterns score. The comparisons
of dietary components and metabolic risk factors among the dietary patterns score tertiles were split into
subgroups (UBN or place of residence) only if interactions were significant. Outcomes not following a
normal distribution were log-transformed (natural logarithm) before inclusion in the models, and beta
coefficients were back transformed and expressed as percentage differences (estimate-1*100). All the
models were adjusted for sex, UBN and place of residence.
Logistic regression models were also used to determine UBN and place of residence differences in: (i)
the amount of participants exceeding the macronutrient, sodium and added sugar recommended intake
per day, (ii) the number of consumers of protective groups (subgroups) such as fish (roasted, fresh,
canned), fruit and oilseeds (preparation methods) as well as in (iii) the number of consumers of the main
sources of added sugar. All the models were adjusted for sex, UBN and place of residence. Results are
reported as odds ratio (OR) and 95% confidence interval (CI).
2.4 Results
A total of 779 children were enrolled, 50.1% were boys. General characteristics are displayed in Table
1. More girls from the rural area participated in the study (P<0.01). Based on the UBN, 44% of the
adolescents were classified as poor and a higher proportion of rural adolescents were poor compared
with their urban peers (95% vs. 45% P<0.01). The average age was 13.6 ±1.2 years and did not differ
between boys and girls (P = 0.70). Participants’ age ranged from 10-16 years old. A higher proportion
of girls were from poor households, although this difference was marginal (P = 0.05). No differences in
the mean age (P = 0.24), BMI (P = 0.21), waist circumference (P = 0.52), SBP (P = 0.72), DBP (P=
0.98), sex (P = 0.19) and categories of BMI (P = 0.44) were found between the sample providing blood
samples and the other adolescents.
Boys had a lower BMI (P=0.001), were taller (P=0.008) and had higher SBP and DBP (P=0.001 and
0.024 respectively) than girls. No differences in waist circumference and weight were found according
to sex. Blood parameters were not different between sexes. With regard to dietary intake, 43 participants

Chapter 2 Metabolic risk factors and dietary intake
31
out of 779 provided only one recall, while for the remaining participants two days of dietary intake recall
were available (one for a weekday and one for a weekend day), boys had a higher energy intake (P<0.01)
mainly from carbohydrates (P=0.01) and ate more sodium (P<0.01) than girls.
2.4.1 Prevalence of metabolic CVD risk factors and its predictors
Prevalence of the metabolic cardiovascular risk factors according to sex UBN and location are presented
in Table 2. The most prevalent risk factors were dyslipidemia (34.2%) abdominal obesity (19.7%), risk
levels of total cholesterol (18.6%), overweight (18%) and risk levels of triglycerides (15.6%).
Table 1 Age, anthropometry, blood pressure, energy, sugar, sodium and macronutrients intake overall and by sex
Total Boys Girls
P value
n Mean or
Median
SD or
IQR
Mean or
Median
SD or
IQR
Mean or
Median
SD or
IQR
Age (years)1 770 13.6 ±1.2 13.6 ±1.2 13.6 ±1.2 0.701
Weight (kg)1 764 46.5 ±10.1 46.7 ±11.2 46.2 ±8.9 0.423
Height (cm)1 764 150.8 ±9.0 152.2 ±10.3 149.3 ±7.1 0.008
BMI (kg/m2)1 760 20.3 ±3.1 19.9 ±3.1 20.6 ±3.1 0.001
Waist (cm)1 767 70.2 ±8.0 70.6 ±8.4 69.7 ±7.7 0.203
SBP2 (mmHg)1 766 101.6 ±10.0 103.3 ±10.6 99.8 ±9.0 0.001
DBP3 (mmHg)1 766 62.3 ±8.7 63.2 ±9.1 61.3 ±8.1 0.024
Total cholesterol (mg/dL)1 334 146.9 ±32.1 145.6 ±32.0 147.9 ±32.5 0.953
LDL cholesterol (mg/dL)1 334 77.3 ±28.6 76.3 ±29.7 78.3 ±27.6 0.940
HDL cholesterol (mg/dL)1 334 50.0 ±12.2 51.6 ±12.9 48.7 ±11.5 0.217
Triglycerides (mg/dL)1 334 98.0 ±55.5 90.2 ±49.6 104.8 ±59.6 0.076
Glucose (mg/dL)1 334 74.9 ±13.1 75.8 ±9.0 74.1 ±15.9 0.140
Energy (kcal)4 779 1851 710 2001 721 1731 612 <0.001
Carbohydrates (E%)4 779 60.7 9.2 61.5 8.5 60.0 9.2 0.010
Other carbohydrates (E%)4 779 44.4 12.0 44.9 12.1 43.5 12.2 0.009
Added sugar (E%)4 779 15.4 7.2 15.4 7.7 15.5 6.9 0.392
Fiber (g)4 779 11.1 8.0 11.0 7.5 11.2 8.3 0.935
Total fat (E%)4 779 24.2 6.9 23.7 6.7 24.8 7.2 0.001
Protein (E%)4 779 13.4 3.6 13.7 3.6 13.2 3.4 0.717
Sodium (mg)4 779 2227.8 1174.5 2430.4 1260.6 2053.6 998.6 <0.001
1 Mean and standard deviation.2 Systolic blood pressure 3Diastolic blood pressure. 4Median and interquartile range. Bold: P values <0.05. Differences tested using linear regression models adjusted for UBN and place of residence.

Chapter 2 Metabolic risk factors and dietary intake
32
Table 2 Prevalence of metabolic risk factors by sex, unsatisfied basic needs and place of residence
Total
UBN Location
Poor Better-off Urban Rural
% CI1 % CI % CI % CI % CI
Overweight 18.0 [14.2;15.1] 14.7 [11.3;18.2] 22.2 [17.4;27.0] 19.2 [15.9;22.5] 13.9 [8.54;19.2]
Obesity 2.11 [1.10;3.14] 1.66 [0.31;3.01] 2.70 [0.95;4.45] 2.10 [1.02;3.36] 1.81 [-1.6;5,31]
Abdominal obesity 19.7 [16.6;22.9] 16.9 [12.8;21.0] 23.3 [18.5;28.2] 19.5 [16.5;22.6] 20.5 [6.05;34.9]
Risk blood pressure 6.21 [4.34;8.10] 6.05 [3.70;8.39] 6.53 [3.48;9.58] 6.10 [4.26;7.95] 6.66 [-0.7;14.0]
Dyslipidemia 34.2 [27.0;41.5] 37.7 [26.1;49.2] 29.9 [21.2;38.5] 27.3 [21.2;33.5] 51.0 [22.7;79.3]
Risk levels of cholesterol 18.5 [13.4;23.5] 20.6 [12.4;28.8] 15.7 [9.28;22,1] 15.1 [11.0;19.3] 26.5 [-0.2;53.3]
Risk levels of HDL 10.4 [5.82;15.0] 11.6 [5.37;17.7] 8.95 [1.46;16.4] 6.72 [1.95;11.5] 19.4 [4.80;3.40]
Risk levels of LDL 10.7 [6.65;14.8] 13.1 [6.46;19.7] 7.50 [2.47;12.5] 7.60 [3.86;11.3] 18.4 [1.50;39.7]
Risk levels of triglycerides 15.5 [10.3;20.6] 18.1 [10.9;25.2] 11.9 [6.84;17.0] 11.8 [6.70;16.8] 24.5 [10.2-38.8]
Impaired fasting glucose 0.89 [-0.08;1.9] 1.50 [-0.2;3.23] 0.0 – 0.84 [-0.37;2.05] 1.02 [-0.3;4.03]
1Confidence interval

Chapter 2 Metabolic risk factors and dietary intake
33
Table 3 Predictors of metabolic risk factors in Ecuadorian adolescents
Sex1 UBN2 Location3
OR CI P value OR CI P value OR CI P value
Overweight/
obesity
BM4 0.9 [0.6;1.4] 0.780 1.6 [1.2;2.4] 0.012* 0.7 [0.5;1.0] 0.028*
AM5 –6 – – 1.6 [1.1;2.5] 0.021 0.9 [0.6;1.4] 0.676
Abdominal
obesity
BM 0.9 [0.7;1.2] 0.471 1.5 [1.2;2.0] 0.046* 1.1 [0.6;1.8] 0.817
AM – – – 1.5 [1.2;2.0] 0.046 – – –
Risk blood
pressure
BM 3.3 [1.9;5.9] <0.001* 1.1 [0.6;2.0] 0.181 1.1 [0.6;2.2] 0.776
AM 3.3 [1.9;5.9] <0.001 – – – – – –
Dyslipidemia BM 0.7 [0.4;1.3] 0.229 1.4 [0.7;2.9] 0.309 2.8 [1.4;5.6] 0.004*
AM – – – – – – 2.8 [1.4;5.6] 0.004
Risk levels of
triglycerides
BM 0.8 [0.5;1.3] 0.279 0.6 [0.3;1.2] 0.126 2.5 [1.3;4.8] 0.005*
AM – – – – – – 2.5 [1.3;4.8] 0.005
Risk levels of
total cholesterol
BM 0.9 [0.4;1.9] 0.727 0.7 [0.3;1.6] 0.409 2.1 [1.0;4.6] 0.059*
AM – – – – – – 2.1 [1.0;4.6] 0.059
Risk levels of
HDL
BM 0.4 [0.1;0.9] 0.029* 0.8 [0.2;2.4] 0.637 3.2 [1.2;8.9] 0.024*
AM 0.4 [0.2;1.0] 0.057 – – – 2.8 [1.1;7.0] 0.031
Risk levels of
LDL
BM 1.0 [0.4;2.5] 0.950 0.5 [0.2;1.4] 0.198 2.9 [1.1;7.4] 0.031*
AM – – – – – – 2.9 [1.1;7.4] 0.031 1 Sex (female/male); 2 Unsatisfied Basic Needs (poor/ better-off); 3 Location (urban/rural); 4 Bivariate model; 5 Adjusted model
(includes predictors with a P value <0.01 in the bivariate models); *Significant predictors in the bivariate model; 6 No included
in the adjusted models (P>0.01 in the bivariate model. Bold: P values <0.05 in the adjusted models. Differences tested using
logistic regression models.
The predictors of metabolic risk factors are displayed in Table 3. Sex was a predictor of high blood
pressure: boys were 3.3 (P < 0.001; 95% CI: 1.9, 5.9) times more likely to have risk levels of blood
pressure than girls. Socioeconomic status was a predictor of overweight/obesity and abdominal obesity,
children from the better-off group were 1.6 times (P=0.021; 95% CI: 1.1, 2.5) more likely to be
overweight/obese and 1.5 times (P=0.046; 95% CI: 1.2, 2.0) more likely to suffer from abdominal
obesity compared to their poorer peers. Location showed to be a significant predictor of dyslipidemia,
risk levels of triglycerides HDL and LDL. Children from the rural area were 2.8 times (P = 0.004; 95%
CI: 1.4, 5.6) more likely to have dyslipidemia, 2.5 times (P = 0.005; 95% CI: 1.3, 4.8) more likely to
have risk levels of triglycerides, 2.8 times (P = 0.031; 95% CI: 1.1, 7.0) more likely to have risk levels
of HDL and 2.9 times (P = 0.031; 95% CI: 1.1, 7.4) more likely to have risk levels of LDL than those
from the urban area.
2.4.2 Dietary intake
2.4.2.1 Energy, macronutrient, added sugar and sodium intake
Median energy intake was 1851 kcal/day (Table 1). Energy intake, macronutrients E% and sodium
intake per UBN and place of residence are presented in Table 4. Adolescents from the urban (8.0% less
energy, P<0.01) and the better-off group (3.2% less energy, P=0.03) got less energy from total
carbohydrates when compared to their rural peers and the group classified as poor, respectively. This

Chapter 2 Metabolic risk factors and dietary intake
34
lower carbohydrate intake is due to a lower intake of carbohydrates other than added sugar (P<0.01 for
both). In contrast, added sugar was consumed more by adolescents from the higher socioeconomic strata
(P<0.01). Fat and protein were also highly consumed by urban adolescents as well as by those in the
better-off group.
The median intake of added sugar was 86.5 g (25th-75th: 60.8, 120.9). The main sources were refined
sugar added to fresh fruit-juices, coffee, tea, milkshakes (median intake 33.2 grams; 25th-75th: 22.4,
45.0), sodas (median intake 15 grams; 25th-75th: 0, 24.4 g), and bread and muffins (median intake 3.6
grams; 25th-75th: 3.0, 6.2 g). Fiber intake was low among the whole sample. Urban adolescents ate less
fiber than their rural peers (P<0.01).
2.4.2.2 Dietary intake and recommendations
An estimated 23.9% of the participants exceeded the recommended E%/day of carbohydrates intake.
Rural and poor adolescents were 3.1 (P<0.01; 95% CI: 1.6, 5.7) and 1.7 (P=0.02; 95% CI: 1.1, 2.8) times
more likely to exceed their carbohydrate E%/day, respectively. In total, 92.1% of the adolescents got
more than 15% of their daily energy intake from solid fats and added sugar, (median sugar intake =
15.4%). Adolescents in the better-off group were almost three times more likely to exceed this threshold
(P<0.01; 95% CI: 1.4, 6.0). Only 5.0% of the adolescents reached the recommended fiber intake with
no statistical differences in UBN or place of residence.
A small number of participants (5.7%) exceeded the recommended E%/day from fat, but urban
adolescents were 6.3 times more likely to exceed this recommendation (P<0.01; 95% CI: 2.5, 16.1).
With regard to sodium recommendations, 85.6% participants consumed more than 1.5 g of sodium /day
and 46.1% consumed more than 2.3 g of sodium/day. There was no statistical difference according to
UBN or place of residence. Only 11% of adolescents achieved the WHO recommended fruit and
vegetable intake of 400g per day.
2.4.2.3 Energy sources (food groups)
Energy sources per day are illustrated in Table 5. Overall, the main sources of energy (in total more
than 50% of daily energy intake) in the diet were refined cereals, such as white rice, refined wheat
products and processed food. In contrast, less than 1% of the daily energy intake originated from whole
grain cereals. Furthermore, only 26% of the participants consumed any kind of whole grain (median
intake among consumers of whole grains was 33.0g; 25th-75th: 12.5, 60.9). Urban adolescents consumed
more red meat (P<0.01) and dairy (P=0.02), but less rice (P<0.01) and tubers (P<0.01) than their rural
counterparts. With regard to socioeconomic differences, adolescents from the higher strata ate less rice
(P<0.01) and vegetable oil (P=0.02) but more processed food (P<0.01) than those in the lower strata.

Chapter 2 Metabolic risk factors and dietary intake
35
Table 4 Macronutrient, sodium and added sugar intake per day (median 25th-75th) according to UBN and place of residence
UBN1 β% P value
Place of Residence β% P value
Poor Better-off Rural Urban
Energy (kcal) 1837 [1495;2161] 1857 [1528;2272] 0.1 0.95 1766 [1465;2076] 1863 [1528;2251] 4.3 0.08
Carbohydrates (E%)2 62.3 [57.7;65.9] 58.4 [53.9;62.9] -3.2 0.01 63.8 [61.0;68.0] 59.2 [54.7;63.5] -8.0 <0.01
Other CH (E%) 47.1 [42.0;52.9] 40.7 [35.4;46.3] -8.7 <0.01 51.0 [46.9;55.4] 42.2 [36.9;47.8] -14.9 <0.01
Added Sugar (E%) 14.4 [11.1;17.8] 16.5 [13.4;21] 15.4 <0.01 13.4 [9.9;16.4] 15.9 [12.8;19.9] 14.6 0.05
Fiber (g) 11.1 [8.2;16.3] 10.9 [7.9;15.2] -1.8 0.63 12.3 [8.7;17.9] 10.8 [7.9;15.2] -13.7 <0.01
Total Fat (E%) 23.1 [20.4;26.7] 25.8 [22.4;30.1] 5.2 <0.01 21.8 [18.6;24.3] 25.0 [21.9;29.1] 16.0 <0.01
Protein (E%) 13.0 [11.4;14.6] 14.2 [12.2;15.8] 4.2 0.04 12.0 [10.6;13.4] 13.8 [12.1;15.6] 11.5 <0.01
Sodium (mg) 2099 [1672;2709] 2360 [1811;3087] 6.0 0.05 2038 [1596;2575] 2284 [1777;2991] 8.0 0.01
1 Unsatisfied basic needs; 2 Energy percentage. Bold: P values <0.05. Differences tested using linear regression models adjusted for gender UBN and place of residence.

Chapter 2 Metabolic risk factors and dietary intake
36
Table 5 Energy sources per day (median 25th-75th) in order of importance according to UBN and place of residence
Energy sources Overall (n=779) UBN1
β% P value Place of Residence
β% P value Poor Better-off Rural Urban
White rice (E%)2 23.0 [16.2;29.6] 25.4 [19.7;32.4] 19.0 [12.8;25.9] -22.0 <0.01 27.6 [23.0;33.7] 21.4 [14.7;28.3] -22.1 <0.01
Processed food3 (E%) 19.3 [13.4;24.8] 18.4 [12.6;23.5] 21.3 [15.3;27.1] 17.5 <0.01 17.6 [11.7;22.7] 20.1 [14.1;25.7] 6.7 0.28
Refined wheat (E%) 10.4 [6.5;14.7] 10.3 [6.3;14.2] 10.4 [6.8;15.1] -3.0 0.67 10.7 [5.8;14.7] 10.3 [6.7;14.7] 7.0 0.35
Dairy (E%) 7.1 [3.6;10.9] 6.3 [3;9.7.0] 8.2 [4.9;11.8] 10.5 0.11 4.6 [2.1;7.7] 7.9 [4.4;11.5] 57.5 <0.01
Red meat (E%) 6.2 [3.5;9.7] 5.6 [3.1;9.1] 7.1 [4.2;11.0] 6.1 0.26 4.3 [2.1;7.4] 6.8 [4.0;10.5] 32.1 <0.01
Poultry (E%) 4.8 [1.5;8.5] 4.7 [1.6;9.5] 5.2 [1.6;8.5] 2.2 0.82 3.6 [1.2;7.1] 5.3 [1.7;8.7] 14.1 0.17
Vegetable oils (E%) 3.8 [2.5;5.3] 5.4 [2.6;5.4] 3.6 [2.4;5.2] -12.0 0.02 3.8 [2.4;5.0] 3.8 [2.6;5.4] 14.3 0.11
Total fruit (E%) 3.0 [1.4;3.5] 3.2 [1.5;5.7] 2.9 [1.3;5.3] -7.6 0.31 2.9 [1.4;5.4] 3.1 [1.5;5.6] 6.2 0.52
Tubers (E%) 2.4 [1.3;4.0] 2.5 [1.5;4.2] 2.1 [1.1;3.6] -6.9 0.43 3.1 [2.2;5.1] 2.1 [1.1;3.6] -39.3 <0.01
Animal fat (E%) 1.2 [0.3;3.1] 1.1 [0.3;2.5] 1.3 [0.3;3.5] 24.3 0.08 1.1 [0.4;2.1] 1.2 [0.3;3.3] 11.3 0.37
Whole grain cereals (E%) 0.1 [0.0;0.2] 0.1 [0.0;0.3] 0.1 [0.0;0.2] -27.0 0.11 0.1 [0.0;0.3] 0.1 [0;0.2.0] 23.5 0.42
Vegetables (E%) 0.7 [0.4;1.0] 0.7 [0.4;1.1] 0.6 [0.4;0.9] -1.1 0.86 0.8 [0.5;1.2] 0.6 [0.3;1.0] -15.3 0.18
Fish and seafood (E%) 0.5 [0.0;3.1] 0.6 [0.0;2.8] 0.5 [0.0;3.1] 8.0 0.65 0.7 [0.0;4.3] 0.5 [0;2.6.0] -30.9 0.20
Whole grain cereals (E%) 0.1 [0.0;0.2] 0.1 [0.0;0.3] 0.1 [0.0;0.2] -27 0.11 0.1 [0.0;0.3] 0.1 [0;0.2.0] 23.5 0.42
Other sources4 (E%) 6.1 [2.4;11.2] 5.9 [2.3;11.8] 6.1 [2.4;10.4] 7.1 0.36 6.9 [3.1;15.3] 5.9 [2.3;10.5] -11.2 0.07
1 Unsatisfied basic needs. 2 Energy percentage. 3 Processed food includes sweets; snacks; soft drinks and any other packaged food item. 4 Other sources includes: plantain; maize; other cereals; oilseeds; legumes spices and coffee. Differences using linear regression models adjusted for gender UBN and place of residence. Bold: P values <0.05

Chapter 2 Metabolic risk factors and dietary intake
37
2.4.2.4 Protective food groups
Total fruit intake was reported by 92% participants and the median total fruit intake was 121.0 g/day
(25th-75th: 58.1, 215.4g). Fruit was mainly consumed in three forms: (i) whole fresh fruit (58.4%), (ii)
fresh fruit used in sugary juices (32.0 %.) and (iii) as fresh fruit used in sugary milkshakes (4.6%).
Although median fruit intake was not different by place of residence, urban adolescents were 2.6 times
more likely to eat whole fruit than rural adolescents (P<0.01; 95% CI: 1.6, 4.2). Vegetable intake was
reported by 99% of the adolescents, and the median vegetable intake was 50.1 g/day (25th-75th: 24.5,
81.9). Vegetables were consumed in salads (73%), as ingredients of composed recipes (22%) and in
soups (5%). Legumes were consumed by 57% of the participants, its median intake was 12.7g/day (25th-
75th: 0.0, 49.4), used for “menestras” (49%), soups (38%) and salads (13%). Oilseeds were only
consumed by 12% of the adolescents and the median intake among consumers was 14.5g/day (25th-
75th: 2.7, 20). Urban adolescents were 5 times more likely to consume oilseeds (P<0.01; 95% CI: 1.6,
14.4) as ingredients for local typical main dishes (75%), cakes (13%) and pure oilseeds (12%). Fish and
seafood were rarely consumed: only 38% of participants reported any intake, with a median intake of
57.1 g/day (25th-75th; 28.1, 87.5 g among consumers). Fried fish contributed to 44% of total fish
consumption, followed by canned fish at 33.5% and fresh fish at 22.4%. Urban adolescents consumed
more fresh fish and were 7.0 (P<0.01; 95% CI: 2.9, 16.9) times more likely to consume fresh fish than
rural adolescents. In contrast, rural participants were 2.5 times more likely to eat canned fish (P<0.01;
95% CI: 1.3, 4.7).
2.4.2.5 Energy sources at different mealtimes
Eighty-two-percent of the adolescents had breakfast, mainly composed of refined wheat in form of
bread, dairy and processed food as sugar and cocoa. The three snack times are rich in processed food.
Lunch consisted of white rice, processed food in the form of sugar used for juices and milkshakes, meat,
tuber, vegetable oil, fruit and vegetables. Dinner is similar to lunch but with a lower meat consumption.
Urban adolescents seemed to drink more milk during breakfast and refreshments. The night refreshment
was the least important meal as it was consumed by only 18% of the adolescents overall and only by
12% of the participants in the rural area.
2.4.2.6 Dietary patterns
Two dietary patterns emerged from the factor analysis (Table 6). The first is a “rice-rich non-animal fat
pattern”, which reflects a high intake of white rice, vegetable oil and tubers together with a lower
contribution of animal fat, dairy products, pre-packaged food and other cereals to the diet. The second
dietary pattern, a “wheat-dense animal-fat pattern”, is mainly based on refined wheat products, red meat,
animal fat, dairy and plantain intake with low maize and whole grains consumption. None of the patterns
appear to be “healthy” as both are rather rich in refined carbohydrates or animal sources. Moreover,
food groups identified as protective factors such as fruit, vegetables, whole grains and fish were not

Chapter 2 Metabolic risk factors and dietary intake
38
important constituents of these patterns. Some differences in terms of nutritional content were observed
between the two identified patterns as illustrated in Table 7. In the case of the “rice-rich non-animal fat
pattern”, carbohydrates were a more important source of energy, mainly due to carbohydrates other than
added sugar, (P<0.01 for all). While, protein, fat energy and added sugar supply tend to decreases
through the score tertiles of the “rice-rich non-animal fat pattern” (fat: P=0.05 for rural and P<0.01 for
urban) (protein: P=0.04 for all) (added sugar: P<0.01 for all). For the “wheat-dense animal-fat pattern”
a lower carbohydrate (P<0.01 for all) and fiber (P=0.01 for rural and P<0.01 for urban) intake is
observed, together with a higher fat (P<0.01 for all), and protein intake (P=0.04 for all) through the score
tertiles.
Table 6 Food patterns loadings using food groups’ E%/ day
Food group "Rice-rich non-
animal fat pattern "
"Wheat-dense
animal-fat pattern "
White rice 0.8 0.0
Refined wheat -0.1 0.5
Other refined cereals -0.4 -0.1
Whole grains 0.0 -0.3
Maize 0.1 -0.5
Tubers 0.3 0.0
Plantain 0.2 0.4
Legumes 0.2 -0.2
Total fruit 0.0 -0.2
Vegetables 0.2 0.0
Poultry 0.1 -0.2
Red meat 0.0 0.4
Fish and seafood -0.1 -0.2
Dairy -0.5 0.3
Oilseeds -0.2 0.1
Vegetable oil 0.6 0.4
Animal fat -0.4 0.4
Processed food1 -0.5 -0.2
Coffee 0.2 0.1
% Variance explained 10.8 19.0 1Processed food includes sweets; snacks; soft drinks and any other packaged food item; Spices were removed as food groups as the factor loading was <0.10 Bold: Factor loadings greater than 0.3
2.4.2.7 Metabolic risk factors and dietary patterns
The “rice-rich non-animal fat pattern” was associated with a moderate increase in glucose blood levels
among urban adolescents (P<0.01), while the “wheat-dense animal-fat pattern” was associated with an
increment in blood cholesterol (P=0.02) and LDL (P=0.04) among rural participants (Table 8).

Chapter 2 Metabolic risk factors and dietary intake
39
Table 7 Nutrient content (median 25th-75th) of food patterns across the score tertiles
Population Tetile 1 Tertile 2 Tertile 3 β % P1
"Rice-non animal fat pattern”
Energy (kcal) Rural 1925 [1119;2117] 1516 [1332;1884] 1857 [1551;2177] 14.6 0.02
Urban 1853 [1483;2296] 1730 [1418;2073] 2037 [1778;2406] 3.3 0.04
CH2 (E%) Overall 56.0 [ 51.6; 60.4] 61.2 [ 57.5; 65.1] 63.7 [ 60.4; 67.6] 5.6 <0.01
Other CH (E%) Overall 37.5 [ 37.5; 41.7] 44.8 [ 41.1; 48.6] 51.9 [ 46.3; 56.2] 14.5 <0.01
Added sugar (E%) Overall 18.2 [ 14.4; 22.8] 15.9 [ 13.0; 19.2] 12.6 [ 9.3; 15.5] -16.6 <0.01
Fiber (g) Overall 11.0 [ 8.0; 15.1] 10.3 [ 7.4; 14.0] 12.4 [ 8.6; 18.2] 3.8 0.16
Total fat (E%) Rural 25.3 [ 23.1; 27.8] 22.2 [ 19.7; 23.5] 21.4 [ 17.8; 23.9] -7.0 0.05
Urban 28.3 [ 24.7; 32.4] 24.6 [ 21.8; 27.6] 22.0 [ 19.8; 24.5] -11.3 <0.01
Protein (E%) Overall 14.2 [ 12.7; 15.8] 13.3 [ 11.8; 15.0] 12.7 [ 11.0; 14.7] -2.9 0.04
Sodium (mg) Rural 1728 [1175;2581] 1842 [1478;2278] 2214 [1829;2775] 20.3 0.01
Urban 2356 [1736;3138] 2057 [1666;2697] 2422 [1960;3010] 1.6 0.45
“Wheat-animal fat pattern”
Energy (kcal) Overall 1836 [1516;2196] 1772 [1418;2124] 1919 [1585;2263] 0.8 0.53
CH (E%) Overall 62.2 [57.8;66.8] 60.7 [56.3;64.6] 58.5 [53.9;63.0] -2.6 <0.01
Other CH (E%) Overall 47.1 [41.3;52.6] 44.4 [38.9;50.0] 42.2 [35.8;48.1] -3.4 <0.01
Added sugar (E%) Overall 15.0 [11.3;19.2] 15.7 [12.9;18.8] 15.5 [12.0;19.6] -1.2 0.58
Fiber (g) Rural 15.9 [11.1;24.4] 10.3 [ 6.9;13.0] 9.9 [ 8.4;15.7] -23.5 0.01
Urban 12.9 [ 9.3;19.0] 10.7 [ 7.0;14.7] 10.0 [ 7.6; 13.2] -13.6 <0.01
Total fat (E%) Overall 22.4 [19.0;26.6] 24.3 [21.5;27.7] 25.8 [22.8;30.4] 6.8 <0.01
Protein (E%) Overall 13.1 [11.3;14.9] 13.3 [11.9;15.2] 14.1 [12.0;15.7] 1.0 0.35
Sodium (mg) Overall 2058 [1613;2745] 2106 [1640;2797] 2454 [1949;3110] 6.0 <0.01
1P value. 2Carbohydrates. Bold: P values <0.05. Differences testedusing linear regression models adjusted for gender UBN and place of residence.
Table 8 Metabolic risk factors (mean ±SD) per food pattern across the score tertiles
Population Tertile 1 Tertile 2 Tertile 3 β % P1
"Rice-non animal fat pattern
BMI2 (kg/m2) Overall 20.6 ±3.2 20.2 ±3.2 20.0 ±2.9 -12.7 0.41
Waist circumference (cm) Overall 71.0 ±8.3 69.2 ±8 70.3 ±7.7 -19.6 0.57
SBP3 (mmHg) Overall 102.2 ±9.7 101.3 ±10.2 101.3 ±10.1 -23.6 0.58
DBP4 (mmHg) Overall 62.8 ±8.8 62.1 ±8.8 62.0 ±8.6 -23.5 0.51
Glucose (mg/dL) Rural 73.7 ±3.5 73.6 ±9.0 72.6 ±8.8 -1.5 0.41
Urban 72.7 ±7.2 77.3 ±21.4 77.9 ±10.4 3.3 <0.01
Triglycerides (mg/dL) Overall 90.9 ±56.7 105.5 ±61.6 97.5 ±45.9 1.4 0.80
Cholesterol (mg/dL) Overall 144.4 ±27.1 150.3 ±28.8 145.9 ±38.9 -1.4 0.95
HDL (mg/dL) Overall 52.8 ±12.8 50.1 ±12.0 47.1 ±11.1 -3.7 0.93
LDL (mg/dL) Overall 73.4 ±22.1 79.0 ±24.0 79.3 ±36.6 -0.9 0.93

Chapter 2 Metabolic risk factors and dietary intake
40
Table 8 continued
Population Tertile 1 Tertile 2 Tertile 3 β % P1
"Wheat-animal fat pattern"
BMI2 (kg/m2) Overall 20.3 ±3.1 20.4 ±3.2 20.2 ±3.1 -7.9 0.51
Waist circumference (cm) Overall 70.0 ±7.7 70.2 ±8.3 70.3 ±8.1 1.5 0.97
SBP3 (mmHg) Rural 99.9 ±6.5 99.3 ±11.1 99.0 ±10.2 -70.8 0.06
Urban 102.3 ±9.9 101.9 ±9.9 102.6 ±9.8 17.1 0.69
DBP4 (mmHg) Overall 62.4 ±8.7 62.0 ±8.6 62.5 ±8.9 -17.2 0.83
Glucose (mg/dL) Overall 74.0 ±8.2 76.5 ±18.9 74.0 ±8.6 -0.2 0.98
Triglycerides (mg/dL) Overall 100.0 ±58.6 99.4 ±57.1 94.7 ±48.6 2.2 0.58
Cholesterol (mg/dL) Rural 137.0 ±45.4 152.4 ±33.2 155.2 ±33.9 3.7 0.02
Urban 144.8 ±25.9 149.3 ±26.9 137.4 ±41.4 -1.9 0.20
HDL (mg/dL) Overall 49.0 ±12.6 51.0 ±12.3 49.5 ±11.3 -0.3 0.86
LDL (mg/dL) Rural 74.5 ±26.6 79.4 ±26.8 87.8 ±31.7 8.4 0.04
Urban 73.3 ±21.9 78.9 ±22.8 71.6 ±39.2 4.3 0.17
1P value. 2 Body mass index .3 Systolic blood pressure. 4 Diastolic blood pressure. Bold: P values <0.05. Differences tested using linear regression models adjusted for gender UBN and place of residence.
2.5 Discussion
This group of adolescents appears to be in full nutritional transition. Our findings indicate the need to
consider adolescents' health in the primary health care actions. The understanding of the distribution of
metabolic risk factors and dietary behaviors using local evidence is crucial for the development of
appropriate health promotion interventions. High prevalence of metabolic risk factors such as
overweight, obesity, abdominal obesity and dyslipidemia were found. Moreover, fiber, fish and fruit and
vegetables were scarcely consumed, while added sugar, refined cereals and processed food were
important constituents of the diet. This leads this group of adolescents at a higher risk for CVD and other
NCDs development.
2.5.1 Metabolic risk factors
Our overweight and obesity prevalence (20.1%) is lower than the Mexican, Chilean (35%) (19), USA
(114) or European countries reports (115), higher than the prevalence as found in Colombia (16.7%)
(19), but similar than the Brazilian reports (20%) (19). Worryingly, a considerable share (19.7%) of
adolescents was diagnosed with abdominal obesity. This figure is lower than the prevalence reported in
Mexico (27.9%) and Brazil (32.7%), but higher than that of Argentina (13.9%) (20). Overweight and
obesity are associated with atherosclerosis and a high prevalence of subclinical disease, which increases
the risk of CVD. In addition, the development of type 2 diabetes mellitus is positively associated with
early weight gain (116).

Chapter 2 Metabolic risk factors and dietary intake
41
Prevalence estimates of pre-hypertension and hypertension (6.2%) were lower than those from the USA
(20%) (117) and Mexico (20%) (118). Hypertension can be considered as the most important risk factor
linking obesity with the development of CVD in adults (119). Boys had a higher prevalence of risk
levels of blood pressure than girls (9.4% vs. 3%), Similarly, a meta-analysis of the prevalence of high
blood pressure among adolescents concluded that boys show higher values of blood pressure (23), which
could be attributable to the role of androgens in the development of hypertension (120). Besides, sodium
intake was also high among boys compared with girls in our sample. Sodium intake has been strongly
correlated with high blood pressure in previous reports (121, 122).
Overall, biochemical values are comparable to those reported in other Latin American LMICs (123-
125). Similarly to what we found for BMI, girls had higher triglycerides plasma levels than boys.
Evidence from the literature shows that as BMI raises over 21 kg m2, dyslipidemia raises progressively
(126). As described in Chapter 1, the presence of an abnormal blood lipid profile during adolescence
constitutes an important risk factor for the development of CVD and other NCDs later in life.
2.5.2 Dietary intake
2.5.2.1 Protective food groups and nutrients
Only 11% of the participants reached the recommended fruit and vegetable intake of 400 grams per day,
which is lower than the intake reported in European children (127). One question that arises is why this
group of adolescents consumes such a small amount of fruit and vegetables as Ecuador is considered
one of the most bio-diverse countries in the world (128) and availability of this food group does not
seem not to be an issue. The focus groups performed in adolescents from Cuenca and Nabón suggested
that the low fruit consumption is a consequence of a large abundance of competitive foods (junk food),
lack of fresh fruit offered in schools, the preference for tasty food poor in nutritional quality and peer
acceptance (fear of embarrassment) (68). Additional analysis identified an inverse association between
food safety and intake of processed food during snacks which could be an indication on avoidance of
fruit and vegetable intake secondary to food safety concerns (76).
Similarly, whole grains were scarcely consumed, which together with the low fruit and vegetable intake
is reflected in a considerably low total fiber intake. Instead, refined cereals such as white rice and refined
wheat were important sources of carbohydrates. A low whole grain and fiber consumption has been also
reported among US (15, 129) and Mexican children and adolescents (92). Low whole grain intake has
been strongly and positively correlated with cardiovascular risk factors, atherosclerosis and the
occurrence of CVD (86), whilst energy intake from refined carbohydrates is positively correlated with
the prevalence of type II diabetes (86). The reasons for not consuming whole grains according with the
focus groups performed during the needs assessment seems to be a complete lack of knowledge of the
beneficial effect of this food group. Nobody mentioned whole grains as a healthy food group in any of
the focus groups performed (68).

Chapter 2 Metabolic risk factors and dietary intake
42
Fish was also poorly consumed, a practice noted among adolescents from other countries such as US
(15). Fish consumption has been moderately linked with a protective effect against fatal coronary heart
disease (87). Specifically a cohort study suggested that the consumption of baked or boiled, but not fried
fish is linked with a lower risk of death for ischemic heart disease (111). Oilseeds were also scarcely
consumed and not often in a pure form. This leads this group of adolescents at risk of death and coronary
heart disease (130, 131). In total, 2.5 million deaths worldwide were attributable to low intake of nuts
and seeds in 2010 (131). Prospective data suggest that the risk of coronary heart disease death is 8.3%
lower per each 30g of nuts consumed weekly (130). As with whole grains, the participants of the focus
groups did not mention fish or oilseeds within healthy food groups.
2.5.2.2 Harmful food groups and nutrients
A high consumption of added sugar from fresh-fruit-juices followed by soda and bread was reported.
These findings are similar to the added sugar consumed by US children and adolescents (132), with the
only difference being that in the US population soda is the main source of added sugar followed by fruit
drinks and grain desserts. Sweetened beverages intake could be correlated with increased energy intake,
increased body weight and type II diabetes (92, 133, 134).
Processed food was an important source of energy among the study population, confirming previous
estimates in LMICs (135). Initially, the intake of these foods is higher in wealthy groups, but
consumption in poorer populations has steadily increased since the emerging nutrition transition (135).
Our results confirm this and show how participants from the better off group got more energy from
added sugar and pre-packaged food. Additionally, urban adolescents and those in the better off group
had a higher energy contribution from animal sources than their rural and poor peers. Nevertheless, these
differences were small and indicate how the diet in rural areas is becoming increasingly similar to that
of the urban areas.
Sodium intake is also high among these adolescents, but still lower than the estimates from US (136).
Considering that this nutrient tends to be underestimated using a 24-hour recall (137), the already high
proportion of adolescents exceeding the recommended sodium intake is a concern. Although sodium
intake was high, we did not find any association with high blood pressure, a finding previously observed
among children and adolescents (data not shown). There is still a debate with regard to the relationship
between sodium intake and high blood pressure in young people, especially since RCTs performed in
adolescents have shown only a small effect of sodium intake on blood pressure levels (138). This lack
of relationship is probably the result of the methods used to estimate sodium intake and the short duration
of RCTs (138).
Adolescents expressed their preference for sugary drinks and sweets during the focus groups
discussions. All the audiences included recognized the large availability of this kind of food at school

Chapter 2 Metabolic risk factors and dietary intake
43
and outside the school and the influence of social media. In addition the financial autonomy reached at
high school was also an influential factor for the consumption of harmful food groups (68).
2.5.2.3 Dietary patterns
The diet of the studied population is low in fruit, vegetables whole grains and fiber, but rich in processed
food, added sugar and sodium. This pattern is comparable with the diet of adolescents from other
countries such as the US (15) and Mexico (92). Nevertheless, we can identify some peculiarities, the
carbohydrate intake is higher than that reported by Mexican adolescents (61 vs 52%) while protein and
fat intake was lower in our sample. Carbohydrate intake is also high in neighboring countries, i.e. Bolivia
and Peru (Baya Boti Ana, unpublished data; Javier Hidalgo Miguel, unpublished data), as well as in
Asian countries (139). The main carbohydrate and daily energy source is white rice, a seed highly
consumed in the Asian region as well (139). The replacement of one serving of rice with vegetables,
fruit and whole grain bread has been associated with lower ischemic heart disease mortality in the Asian
populations (139), stressing the importance of promoting a balanced diet in this group of Ecuadorian
adolescents.
2.5.2.4 Dietary patterns and metabolic risk factors
Although the idea behind the identification of dietary patterns was to identify underlying patterns
possibly related with metabolic risk factors, the two retained patterns are rather similar. None of the
patterns seem to be “healthy” and both share important risks such as high content of refined
carbohydrates or animal sources and poor content of fruit, vegetables, whole grains and fish. This
suggests that the whole group is homogeneously consuming an unhealthy diet and highlights the
importance of implementing health promotion programs among all the studied groups. Anyhow we did
identified modest correlations between the dietary patterns that should be considered in future studies
and in health promotion programs.
Among rural participants we found a positive correlation between LDL and cholesterol and the “wheat-
dense animal fat pattern”, a pattern of higher fat and lower fiber intake. Previous studies have described
a strong correlation between fiber intake and cholesterol levels and studies conducted in animal models
suggest that fiber intake increases bile acid degradation and loss, thus decreasing the amount of
cholesterol available for LDL synthesis (86). A large prospective study demonstrated associations
between carotid intima media thinness and LDL blood levels during childhood, suggesting that children
at the higher LDL quartiles are at higher risk of CVD (140). Furthermore, autopsies performed in
children and adolescents have also shown associations between total cholesterol and LDL levels and
atherosclerosis (140).
On the other hand the “rice-rich non-animal-fat pattern” was correlated with a small increment of blood
glucose among urban adolescents. Type II diabetes is the leading cause of death in the Ecuadorian

Chapter 2 Metabolic risk factors and dietary intake
44
population (38), although, the mean blood glucose values in the higher tertile of this pattern are within
the normal ranges, a study performed in young men concluded that subjects in the higher quintiles of
normal fasting blood glucose are four times more likely to develop diabetes than those in the lower
quintiles (141). We cannot identify the “rice-rich non-animal-fat pattern” as a risk factor for diabetes
development, but the fact that glucose plasma level tend to increase from tertile 1 to the tertile 3 may
help to identify dietary characteristics related with increments in plasma blood glucose. The
predominance of refined cereals as carbohydrate sources (white rice), the poorer intake of protein and
lack of whole grains maybe responsible of the higher glucose plasma level in the higher tertiles of this
pattern. The poor protein content may decrease the clearance of glucose from blood (112). In the other
hand, foods rich in refined carbohydrates may displace whole grain intake (139), depriving their
protective effect of reducing glucose response, and insulin sensitivity (86), furthermore, a systematic
review of prospective studies concluded that the intake of two serving per day of whole grain cereals
may decrease the risk of type II diabetes in 21% (142).
Although glucose levels are within normal ranges and only a small proportion of participants show high
glucose blood levels (66), it seems that dietary patterns with a higher refined carbohydrate content are
correlated with an increment in glucose blood levels among urban adolescents. Meanwhile diets richer
in fat and lower in fiber are positively correlated with LDL and cholesterol blood concentrations among
rural participants.
2.5.3 Implications for health promotion programs
Evidently, adolescent from both urban and rural areas as well as the better-off and the poor groups suffer
a large burden of CVD risk factors. The reported prevalence of metabolic risk factors together with the
poor dietary intake demonstrates the need to design and implement health promotion programs targeting
the entire population. Anyhow some differences by socio-economic status and by place of residence
should be considered before the design of school-based promotion interventions in the research area.
2.5.3.1 Differences in metabolic risk factors and dietary intake by UBN and place of residence
Our data shows a higher prevalence of overweight and obesity among adolescents belonging to the
better-off group. These findings are similar to those reported in Bolivia (143) and with more recent data
(2014) generated in Ecuador (40). During the nutrition transition, overweight initially affects the more
wealthy members with a further spreading of the disease burden to lower socioeconomic strata (144).
When the burden of CVD finally settles in lower socioeconomic groups, it proves to be very persistent
(145, 146). One question that arises is why overweight/obesity is higher in the better-off group, while
dyslipidemia is higher in the rural area. We expected to find a higher prevalence of dyslipidemia in the
urban area. One study conducted in Mexican adolescents equally showed a higher occurrence of
overweight/obesity in the urban areas, with a predominance of dyslipidemia among rural adolescents,
mainly because of elevated triglycerides and low HDL concentrations (125). Our findings are similar

Chapter 2 Metabolic risk factors and dietary intake
45
with risk levels of triglycerides and HDL being significantly higher among the rural adolescents. We
hypothesize that rural participants were more recently exposed to a diet poor in fiber, which may have
a greater effect on their lipid profiles. A previous study has argued that at the early stages of exposure
to ‘Westernized’ diet biochemical parameters and in particular COLT increase more rapidly (147). The
ethnic differences between the rural and urban studied population are also important. The last national
demographic survey, showed how an estimated 32% of the population in Nabón was considered
indigenous while this is only 1% in Cuenca (148). A third explanation might be an epigenetic mismatch
between the predicted and actual mature environments. This infers that underweight during prenatal and
early post-natal life programs leads towards a greater susceptibility to develop chronic diseases when
exposed to the diets and lifestyles associated with advanced levels of the nutrition transition (149). In
conclusion, before designing and implementing health promotion programs targeting adolescents living
in Nabón, new research should identify the real causes of this health problem in order to implement
appropriate and relevant strategies.
As discussed before, adolescents in the better-off group ate more processed food and added sugar
compared to the poor. Remarkably, these foods were more frequently consumed as snacks either at home
or at school. Data originated during the needs assessment indicated that financial autonomy was a
predominant influential factor among adolescents in the higher socio-economic strata. The pocket
money usually provided by parents/guardians is commonly used to buy food with poor nutritional
quality. In contrast, parents in the lower socio-economic strata reported that when they are not able to
provide pocket money, their children bring food from home (68). Still one should consider that the
differences in processed food and added sugar intake between poor and adolescents in the better-off
group are small and availability of healthy food at home is also a concern.
Urban adolescents were more likely to consume whole fruit, fresh fish and oilseeds in comparison with
their rural pairs. The results of the focus groups discussions may help to understand these differences.
In contrast with the rural area, urban parents and adolescents expressed that healthy food is ready
available and cost is not an issue (68).
Based in the described information, four main decisions were taken: the school-based health promotion
intervention should (i) involve school and home settings, (ii) include participants from different socio-
economic backgrounds, (iv) address various influential factors for different socio-economic populations,
(iii) target various CVD risk factors, and, (iii) be implemented in the urban area. The research team
decided not to design and implement the intervention in the rural area as availability and financial
concerns were beyond the scope of a research program.
As described in Chapter 1, this information was combined with the IM and the CPPE to define the final
intervention objectives and strategies described in Chapter 3 (76).

Chapter 2 Metabolic risk factors and dietary intake
46
2.6 Limitations
We acknowledge some limitations in this study. The present analysis is cross-sectional and hence limits
the findings to the level of associations. Nonetheless, the metabolic parameters indicate that important
changes have occurred and that quite a considerable number of adolescents are at risk.
These results can only be extrapolated to adolescents from Cuenca and Nabón. However, our results
clearly indicate the need for more and particularly national studies to identify the prevalence of CVD
risk factors in the Ecuadorian adolescent population. Adolescents living in other rural areas should be
included in future studies in order to confirm our particular findings for these areas. It is important to
note that we used international reference values since national cut-offs are not available. One Bolivian
study noticed that international references overestimated overweight and obesity in adolescents (150).
In addition, ethnic differences between rural and urban adolescents could exist as there is no formal
identification and classification system for ethnicity in Ecuador and we were unable to carry out further
analyses to detect ethnic differences in the risk factors studied. In addition blood samples were taken
only in a subsample.
We could not compile information on saturated fat content of all the foods consumed. This is unfortunate
as the type of fat is vital to the reduction of LDL cholesterol and concomitant reduction in risk of
coronary heart disease (151).
2.7 Conclusion
Several metabolic risk factors and dietary practices conducive to CVD and other NCDs development
were identified. Effective strategies are needed to prevent CVD and other NCDs in this group of
Ecuadorian population by encouraging a balanced diet, which contains less refined cereals, added sugar,
and processed food, but more fruits, vegetables and whole grain cereals. Such strategies should involve
school and home settings, include participants from different socio-economic background and target
various CVD risk factors.

47
3 Effect of the school-based health promotion
intervention ACTIVITAL on dietary intake,
blood pressure and waist circumference: A
pair-matched cluster randomized controlled
trial
Under review at the International Journal of Behavioral Nutrition and Physical Activity
Trial identifier ClinicalTrial.gov-NCT01004367

48

Chapter 3 Effect of the health promotion intervention ACTIVITAL
49
3.1 Summary
Objective: To evaluate the effect of the ACTIVITAL school-based health promotion intervention
program on risky dietary behaviors, BMI, waist circumference and blood pressure among school-going
Cuencan adolescents.
Methods: A pair-matched cluster randomized controlled trial including 1430 adolescents (12-14 years
old) was conducted in urban Ecuador (Cuenca). The program aimed at improving dietary intake and
physical activity (primary outcomes), BMI, waist circumference and blood pressure (secondary
outcomes). The outcomes were reported after 28-months, and at the first 17-months (stage one) and the
last 11-months (stage two). Two educational tool-kits and healthy eating workshops with parents and
canteen staff were implemented.
Results: Data from 1079 adolescents in 20 schools were analyzed. Daily fruit and vegetable [23.4g,
95% CI: 7.28, 40.3] intake increased, while processed food intake during snacks [-23.3g, 95% CI: -
45.3,-1.40] and added sugar [-5.6g; 95% CI:-9.80,-1.68] intake decreased during the trial. Waist
circumference, [-0.84 cm; 95% CI: -1.68, 0.28], systolic [-3.64 mmHg; 95% CI: -4.48,-2.52] and
diastolic blood pressure [-1.96 mmHg; 95% CI: -3.08,-0.84] decreased after 28 months. The effect of
the intervention was mainly observed at stage one and attenuated at stage two.
Conclusion: An evidence and theory-based culturally appropriated school-based health promotion
intervention improved several risk factors after 28 months in a group of adolescents from an upper-
middle-income country. This data provide new evidence for adolescents living in LMICs
Keywords: RCT, diet, school, adolescents, Ecuador

Chapter 3 Effect of the health promotion intervention ACTIVITAL
50
3.2 Introduction
The risk of CVD and other NCDs is attenuated by reducing body weight and blood pressure, increasing
physical activity, improving physical fitness, supporting diets rich in fruit and vegetables, grains and
nuts, and restricting sugared beverages and sweets intake (11, 34, 87, 152, 153). In Ecuador, type II
diabetes, hypertension and stroke are leading causes of death (154), with a larger disease burden in the
urban areas (40). Overweight, obesity and dyslipidemia (66), together with diets poor in fiber, fruit and
vegetables, and high in added sugar, refined cereals and processed food (67) are prevalent in Ecuadorian
adolescents.
Prevention is urgently needed to tackle this increasing burden of NCDs (5). Interventions focusing on
education and improvements in the food environment have proven to be effective to reduce the risk of
NCDs (5, 43, 155). Schools are suitable settings to implement preventive interventions for adolescents
as they allow tackling of environmental drivers (43) with respect to dietary intake and its determinants
(44). However, school-based lifestyle interventions in LMICs have methodological and conceptual
flaws i.e. they are often not theory- and evidence-based or adapted to the specific context (155).
We conducted a pair-matched cluster randomized controlled school-based trial called “ACTIVITAL”,
aimed at improving dietary intake and physical activity in a sample of school-going Ecuadorian
adolescents. To our knowledge, the ACTIVITAL trial is unique as (i) it was tailored to the local context
using a theoretical framework and participatory approaches and (ii) it targeted multiple risk factors for
NCDs. This paper reports the overall effect of the trial after 28 months on dietary intake (primary
outcome), BMI, waist circumference, and systolic and diastolic blood pressure (secondary outcomes).
3.3 Methods
3.3.1 Randomization and sample size
This study was conducted in 20 schools in the urban area of Cuenca. A pair-matched cluster RCT was
designed with the schools (the clusters) as units of randomization. A cluster design was preferred as this
avoids spillover effects between treatment groups (156). Schools were matched on baseline
characteristics (at cluster level) identified as potential influencers of the trial outcomes. This allowed to
ensure comparability of groups and potential gains in study power (156). Schools were eligible if (i)
they had 8th-10th basic education grades and 1st-3rd high school years within the same campus, (ii) were
located in the urban area of Cuenca, and (iii) had at least 90 students enrolled in the 8th and 9th grade in
order to reach the desired sample size of 70 students per school. In total, 108 eligible schools were
registered at the local Direction of Education of which 31 operated in the rural area, and 28 did not meet
the criteria of having at least 90 students. From the remaining 49 schools, 28 were pair-matched by size
(total number of students), type (public-private), school gender (single gender or co-ed schools) and
socioeconomic status (monthly fee). The other schools (n=21) did not have a matching pair. A sample

Chapter 3 Effect of the health promotion intervention ACTIVITAL
51
of 10 pairs was selected. To be selected, pairs needed to have the same type, the same gender and no
more than a 15% difference in size and 30% difference in socioeconomic status. The remaining 4 pairs
were used as a backup in case schools did not agree to participate. Within the 10 pairs, each school was
randomly assigned to either to the treatment group or the control group, using random numbers in Stata
12.0 by a researcher who was not directly involved in the implementation. Adolescents and school staff
were not aware about the existence of a counterfactual school. Blinding of assessors was not possible
due to the nature of the study. In any case, field workers of outcome measurements were unaware of the
existence of intervention and control schools to the extent possible.
In each school, two 8th and two 9th grades were randomly selected. All adolescents from these grades
were invited to participate and 70 students were selected at random. Only adolescents with a signed
written consent from their parents/guardians and an informed assent signed by themselves were included
in the final sample. Students were excluded prior and during the intervention if they were pregnant or
suffered from a chronic medical or physical disorder which may have interfered with a normal diet or
physical activity performance, e.g. Crohn's Disease or severe physical disability. A total of 10 matched
pairs of schools including an average sample of 65 children per school considering a Type I error of 5%,
a coefficient of between-cluster variation Km of 0.15 and a power of 80%, enabled detecting a decrease
of 10% of the energy percentage derived from fat (81). This corresponded to a total sample size of 1300
adolescents in 20 schools. Considering an expected 10% dropout we sampled 1401 adolescents. The
CONSORT guidelines were followed to report this study (83) (Appendix 5).
3.3.2 Intervention
3.3.2.1 Intervention design
As described in Chapter 1, the results of the needs assessment were used to ensure appropriateness of
the intervention to the target population.
The intervention was developed through the IM (77) and CPPE approach (78) This process resulted in
specific intervention objectives: adolescents (i) decrease their sugar intake, (ii) increase their daily fruit
and vegetable intake, (iii) decrease their unhealthy snack intake, (iv) increase their healthy breakfast
intake, and schools, (v) offer more healthy food at their food-tuck shops. These objectives were
translated into intervention strategies and activities integrated into two intervention components: a
curriculum-based component and an environment-based component incorporating two intervention
packages, further referred to as intervention package 1 and 2 (Table 9). The curriculum-based
component consisted of the implementation of an educational tool-kit, while the environment-based
component involved workshops with parents and food-tuck shop staff, and social events; all of these
differed based on intervention stage (Table 9). Strategies targeting physical activity are not presented
in this thesis.

Chapter 3 Effect of the health promotion intervention ACTIVITAL
52
3.3.2.2 Intervention strategies and components
In the control group schools, no additional activities other than the existing national curriculum followed
by health science school teachers were covered including food groups (the food pyramid), physiology
of nutrition and digestion, nutrients structure and nutritional disorders. These topics are addressed in
two lessons throughout the entire school year.
In the intervention schools, the ACTIVITAL program was implemented in two stages. Briefly, the stage
one comprised three activities: (i) participatory workshops with school staff and adolescents in order to
assure the cooperation throughout the process and to revise the implementation strategy, (ii) healthy
eating introductory workshops with school staff and adolescents, and (iii) the implementation of
intervention package one (Table 9). Stage two only included the implementation of intervention package
two.
3.3.3 Outcomes
Dietary intake was a primary outcome of this study, in concordance with the intervention objectives the
outcomes are the intake of fruit and vegetables, added sugar, energy contribution from fat, processed
food intake during shacks, intake of processed food consumed and prepared at school and breakfast
intake. BMI, waist circumference and blood pressure were the secondary outcomes. Sodium intake was
not included within the intervention objectives, but this outcome is analyzed to enable interpretation of
the effects on blood pressure.
All measurements were performed by trained staff (medical doctors, nutritionist and health related
professionals). The staff received 40 hours of training prior to taking measurements. Measurements were
performed at baseline and after stage one and two, at 17 and 28 months, respectively (Figure 6).
Dietary intake was estimated by means of two interactive 24h dietary recalls conducted during two
randomly chosen weekdays. The average of the two days was used for the final analysis. Portion sizes,
recipes and the compilation of the food composition database were performed following the same
procedure as described in Chapter 2.

Chapter 3 Effect of the health promotion intervention ACTIVITAL
53
Table 9 The ACTIVITAL intervention packages, components and strategies to improve dietary intake
Intervention
component
Intervention strategy Providers Target population Support material Number of meetings /content
Intervention package 1 (September 2010 – February 2011)
1. Curriculum-
based component
Implementation of an
interactive educational
tool-kit: Classes
performed every two
weeks
Life science school
teachers as
volunteers or external
teachers if the school
teacher did not
participate
Adolescents (8th and
9th grades)
Booklets, games,
didactic material
1. Food pyramid
2. Healthy eating (introduction)
3. Healthy breakfast
4. Healthy snacking
5. Sugary drinks
6. Game. Financial autonomy
2. Environment-
based component
2.1 Food-tuck shop
workshops
ACTIVITAL staff Food-tuck shop staff Recipes, leaflets,
books, food for recipe
preparation.
1. Identification of needs and problems
2. Prioritization of needs and problems
3. Introduction to food safety
4. HACCP and recipe development
5. Food pyramid
6. Cooking skills
7. Food preparation
8. Breakfast, snacks, sugary drink
alternatives and fruit and vegetable
preparation
9. National legislation, adaptation and
implementation
10. Management of the food-tuck shop
2.2 Parental workshops ACTIVITAL staff Parents of children
participating in the
intervention
Booklets based on the
curriculum based
component
1. Food pyramid
2. Breakfast, snacks and sugary drinks
3. Healthy eating and physical activity
2.3 Preparation of a
healthy breakfast
Teachers,
ACTIVITAL staff
Adolescents (8th and
9th grades)
Books, food, utensils,
blackboards.
1. Students prepare a healthy breakfast
at school in small groups

Chapter 3 Effect of the health promotion intervention ACTIVITAL
54
Intervention package 2 (September 2011 – February 2012)
1. Curriculum-
based component
- Application of an
interactive educational
tool-kit: Classes
performed every two
weeks
-Life science school
teachers as
volunteers or external
teachers if the school
teacher did not
participate
Adolescents (10th and
1st bachelor grades)
Booklets, games,
didactic material
1. Nutrients
2. Food labels
3. Portion sizes
4. Fruit and vegetables
5. Healthy lunch and dinner
6. Advertisements
2. Environment
-based component
2.1 Food-tuck shop
workshops
ACTIVITAL staff Food-tuck shop staff Recipes, leaflets,
books, food for recipe
preparation.
1. Portion sizes and nutritional
guidelines
2. Healthy menu planning
3. Analysis, evaluation and discussion
of --implanting healthy menus
2.2 Parental workshops ACTIVITAL staff Parents of children
participating in the
intervention
Booklets based on the
curriculum based
component
1. Portion sizes
2. Food labels and advertisements
Intervention package 1 (September 2010 – February 2011) Intervention package 2 (September 2011 – February 2012)

Chapter 3 Effect of the health promotion intervention ACTIVITAL
55
Figure 6 Timeline of the ACTIVITAL trial
Schools
recruitment,
random
assignment
Baseline survey Participatory
and Healthy
eating
workshops
Annual
Recess
Intervention
package 1
First follow-up
measurement
Annual
recess
Intervention
package 2
Second follow-
up
measurement
I I I I I I I I I
C C C C C C
Sept ´09 Oct ´09-Feb ´10 Mar-Jun ´10 Jul-Aug ´10
Sept´10-Feb ´11
Mar-Jun ´11 Jul-Aug ´11
Sept ´11-Jan ´12 Feb-Jun ´12
I: intervention schools, C: control schools

Chapter 3 Effect of the health promotion intervention ACTIVITAL
56
3.3.3.1 Primary outcomes
Fruit and vegetables
Fruit intake included raw fruit and fruit used in juices or any other preparation. Vegetables included
dark green, red and orange vegetables, either raw or boiled. Beans, peas or starchy vegetables were not
included in the vegetables group. Fruit and vegetables were classified as one food group reported as
g/day consumed. The food group classification corresponds to that of the Health Department of Mexico
(Chapter 2) (110).
Added sugar intake
Added sugar included all sugars in processed or prepared food and excluded sugars present naturally in
food (88). Added sugar content was not available in the USDA or the Mexican databases for 271 of the
total 872 food items reported. Data on added sugar of these food items were obtained from food labels
(n = 175 food items), by extrapolating the sugar content from food items with similar nutritional
characteristics (n = 73 food items) or by using the information of standardized recipes (n = 23 food
items). Added sugar intake is reported as g/day.
Processed food consumed at snacks
First snacking time was defined following the same procedure as described in Chapter 2. Then all the
processed food recipes consumed during snack timing were identified applying the classification as
described in Chapter 2. (Sweets, salty snacks, fast food and soft drinks were considered as processed
food). Finally the processed food consumed per day during all the snacks (morning, afternoon and night
snacks) was calculated. Processed food intake during snacks is reported as g/day.
Intake of processed food prepared and consumed at school
This outcome was estimated by identifying all the processed food recipes reported to be prepared and
consumed at school. The intake of processed food prepared and consumed at school was reported by
less than 50% of the participants and data are presented as a dichotomous variable (0 = non-consumers,
1 = consumers).
Breakfast intake
Breakfast time was defined following the same procedure as described in Chapter 2. Breakfast intake
is reported as a dichotomous variable (0 = non-consumers, 1 = consumers).
Energy from fat and sodium
Energy from fat is reported as energy %/day and sodium intake is reported in g/day.

Chapter 3 Effect of the health promotion intervention ACTIVITAL
57
Figure 7 Flowchart of the trial

Chapter 3 Effect of the health promotion intervention ACTIVITAL
58
3.3.3.2 Secondary outcomes
BMI and waist circumference
Body weight, height and waist circumference were measured following the same procedure described
in Chapter 2. BMI was calculated as weight/height2 (kg/m2). BMI z-score was calculated using the
World Health Organization standards (157, 158).
Blood pressure
Systolic and diastolic blood pressure was measured as described in Chapter 2. Normal blood pressure,
pre-hypertension and hypertension were defined as average systolic and/or diastolic blood pressure <
90th, ≥ 90th and ≥ 95th percentile for age sex and height, respectively (159).
Socio-demographic characteristics
Adolescents were allocated to one of two groups: ‘Poor’ and ‘Better-off’ as described in Chapter 2.
The following extra questions based on the national census (160) about remittances and snack allowance
were asked: ‘Does the family receive remittances from abroad?’ ‘Does the adolescent receive a daily
snack allowance?’ and ‘How much does the adolescent receive for his/her snack allowance?’ Age was
obtained from the reported date of birth.
3.3.4 Additional data
We carried out a sensitivity analysis by adjusting the intervention effect on BMI z-score. Effects on
physical activity, sedentary behavior and fitness of the trial are presented in a separate thesis. We could
not adjust our analysis for physical activity as these outcome was measured only in a subsample of 181
adolescents (161).
3.3.5 Data analysis
Descriptive data are reported as proportions, means with SD, or medians with 25th and 75th using all the
available data per follow-up time point and after adjustment for the cluster design (by using the svy
command in Stata). Differences adjusted for cluster design between dropout and data retained for
analysis were assessed using linear regression models adjusted for treatment allocation and matching
pairs.
An intention-to-treat analysis was performed to evaluate the intervention effect. The overall effect after
the full intervention period was assessed using linear mixed models. The models were adjusted for
baseline differences between the treatment and the control group by excluding the treatment allocation
main effect (162):

Chapter 3 Effect of the health promotion intervention ACTIVITAL
59
𝑦 ~𝛽0 + 𝑢1,𝑖 + 𝑢2,𝑗 + 𝛽1 𝑠𝑒𝑥 + 𝛽2𝑈𝐵𝑁 + 𝛽3𝑓𝑜𝑙𝑙𝑜𝑤 − 𝑢𝑝 𝑡𝑖𝑚𝑒 + 𝛽4𝑡𝑟𝑒𝑎𝑡𝑚𝑒𝑛𝑡 𝑎𝑙𝑙𝑜𝑐𝑎𝑡𝑖𝑜𝑛
∗ 𝑓𝑜𝑙𝑙𝑜𝑤 − 𝑢𝑝 𝑡𝑖𝑚𝑒 + 𝑢3,𝑖𝑡𝑟𝑒𝑎𝑡𝑚𝑒𝑛𝑡 𝑎𝑙𝑙𝑜𝑐𝑎𝑡𝑖𝑜𝑛 + 𝑢4,𝑗𝑓𝑜𝑙𝑙𝑜𝑤 − 𝑢𝑝 𝑡𝑖𝑚𝑒
Where y is the effect per month of intervention, 𝑖 the school pairs (1, 2, 3…….10) and 𝑗 the adolescents (1, 2,
3…….1079)
The models comprised the school pair and participants as random effect. The treatment allocation was
nested as a random slope within each pair. Adolescent’s sex and UBN at baseline were included as fixed
effects. The effect of the intervention was evaluated by testing the interaction term between follow-up
time (in months) and treatment allocation. The results of the interaction term between the treatment
groups with time (in months) were multiplied by 28 (duration of the trial) to calculate the overall
intervention effect. Therefore, the reported differences between intervention and control group
correspond to the effect after the whole program implementation and indicates the mean differences for
continuous dependent variables and the proportion difference for dichotomous outcomes between the
treatment and the control group (163). The Akaike-Schwartz criterion was used to select the optimal
covariance structure for the random effects (164). Goodness-of-fit of the models were tested by the
following procedure: Models were compared using likelihood-ratio test to assess which models provided
a better fit. Residual distributions were also assessed. As a numerical estimation of goodness-of-fit is
unavailable in Stata, the graphical inspection of residuals provides a safer way of assessing the goodness-
of-fit.
3.3.5.1 Additional analysis
As intervention stages one (17 months) and two (11 months) were considerably different in timing,
strategies and content (Figure 6 and Table 9), their effect was also estimated separately. Regression
spline mixed effects models were used for this purpose, accounting for the effects of clustering by
individual and school. One knot (the point of time where the slope of the linear function changes) was
defined at the mean time (in months) of the first follow-up data collection (17 months). The Stata
command “mkspline” was used to create two auxiliary variables (time in months 1 and time in months
2). These models were constructed in a similar way to those assessing the total effect, but this time, the
interaction terms between time1 and treatment allocation and time2 and treatment allocation” were
added as covariates. The Beta coefficients of these interaction terms were multiplied by 17 for the first
stage and by 11 for the second stage, corresponding to the respective duration of both stages.
We assessed the influence of missing data on our outcomes with a P<0.1. For this purpose, we used a
multiple imputation strategy using chained equations (n=50 imputations) to impute the missing outcome
data under the assumption of ‘missing at random’. Predictors for the regression models for the
imputation were adolescent’s sex, UBN and BMI z-score at baseline. Data management and statistical
analysis were conducted using Stata 12.0 (Stata Corporation, Texas, USA). Statistical significance was
set at 5% and all tests were two-sided.

Chapter 3 Effect of the health promotion intervention ACTIVITAL
60
3.4 Results
A total of 1430 adolescents from 20 schools were recruited (Figure 7). There were relatively more girls
than boys (66% vs. 59%) in the intervention group (Table 10). More participants in the intervention
group received remittances from abroad (24% vs. 17%). Outcome data at baseline and the two follow-
up periods are reported in Table 11. At baseline, adolescents from the intervention group consumed on
average more fruit and vegetables (7%). Adolescents in the control group however, consumed more
processed food during snacks (11%). Appendix 6 provides figures of the changes in the mean dietary
intake outcomes by treatment group and over time.
Table 10 Baseline characteristics at individual and cluster level
Intervention group Control Group
Individual level n Mean ±SD or % n Mean ±SD or %
Age (y) 696 12.9±0.8 692 12.9±0.8
Girls (%) 702 66.2 699 58.2
Better-off (%) 670 68.2 655 67.5
Weight (kg) 691 44.3±9.6 692 44.0±8.8
Height (cm) 691 148.9±7.2 692 149.0±7.9
BMI (kg/m2) 689 19.8±3.3 692 19.7±2.9
Overweight (%) 683 16.3 687 17.5
Prehypertension (%) 679 5.7 685 5.8
Hypertension (%) 679 2.0 685 3.0
Remittances from abroad (%) 643 23.8 636 16.5
Snack allowance (%) 651 82.5 643 82.9
Amount of snack allowance ($) 642 0.9±0.6 653 0.9±0.6
Education of the father (years) 568 12.1±4.8 571 12.2±4.9
Education of the mother (years) 611 11.8±4.7 613 11.5±4.8
Cluster level1 n Median (25th-75th) or % n Median (25th-75th) or %
Students per school (n) 10 751 (335-1169) 10 787 (326-1335)
Public schools (%) 10 50.0 10 50.0
Co-ed schools (%) 10 70.0 10 70.0
Monthly fee ($) 10 7.00 (0.0-68.3) 10 6.50 (0.0-81.8)
Morning schools (%) 10 60.0 10 60.0
1School (Cluster) characteristics
The sample size retained for analysis of all the dietary intake outcomes included 1079 adolescents in 20
schools, 546 (78% of the sample at baseline) in the intervention and 532 (76% of the sample at baseline)
in the control group. Sample sizes for the other outcomes differed slightly (Figure 6) but the attrition

Chapter 3 Effect of the health promotion intervention ACTIVITAL
61
rate was similar for both groups (22 and 20% for the intervention and control group respectively,
P=0.55). No major differences were found between the final sample remaining for analysis and the
participants lost to follow-up. The only differences were that the dropouts systolic blood pressure was
1.4mmHg higher (95% CI: 0.33, 2.49), and diastolic blood pressure 1.5mmHg higher (95% CI: 0.40,
2.59) in the dropouts compared to the final sample.
3.4.1 Overall effect
The effect of the program after 28 months is presented in Table 12. Participants from the intervention
group consumed less processed food during snacks (-23.3 g; 95% CI: -45.3,-1.40) and less added sugar
(-5.6g; 95% CI: -9.80,-1.68) in comparison with the control group. Moreover, the average intake of fruit
and vegetables (23.4 g; 95% CI: 7.28, 40.3) increased in favor of the intervention group. No differences
were found for energy % from fat between treatment groups.
Waist circumference (-0.84 cm; 95% CI: -1.68, 0.28), systolic (-3.64 mmHg; 95% CI: -4.48,-2.52) and
diastolic blood pressure (-1.96 mmHg; 95% CI: -3.08,-0.84) were lower in the intervention group
compared with the control groups at the end of the program.
3.4.2 Additional analysis
3.4.2.1 Effect according to intervention stage
The effect was larger during the first stage (Table 12). In stage one the effect on fruit and vegetables
(29.2 g; 95% CI: 10.4, 47.6) was statistically significant and in favor of the intervention group.
Additionally, the amount of processed food consumers at school decreased by 15% in the intervention
school when compared with the control schools (15%; 95% CI: -20.0,-8.0). A decline in the intervention
effect was observed in the second stage compared to the first stage. During stage two, the fraction of
processed food consumers at school increased in 11% among the intervention participants (11%; 95%
CI: 8.0, 50.0) and the percentage of breakfast consumers also decreased in the intervention schools (-
7%; 95% CI: -13.0, -2.0) compared with the control group. On the other hand, the intake of processed
food during snacks decreased largely at stage two but did not reach statistically significance at any stage
(-9.35 g; 95% CI: -32.1, 13.4 at stage one and -18.5 g; 95% CI: -44.8, 7.81 at stage two).
The effect on waist circumference reached statistical significance only after stage one (-1.68 cm; 95%
CI: -2.38, -1.02). The decrease in both systolic and diastolic blood pressure reached statistical
significance during stage two only (systolic blood pressure: -3.85 mmHg; 95% CI: -5.06,-2.53 and
diastolic blood pressure: -2.86 mmHg; 95% CI: -4.07,-1.65).

Chapter 3 Effect of the health promotion intervention ACTIVITAL
62
Table 11 Primary and secondary outcomes at baseline and at follow-up measurements by treatment group1
Intervention group Control group
Measurement n Median (25th-75th) or Mean (SD2) n Median (25th-75th) or Mean (SD)
Fruit and vegetables (g/day)* Baseline 691 204.6 (119.1-337.0) 689 191.5 (104.1-304.2)
First follow-up 618 176.7 (111.0-274.3) 612 164.4 ( 99.0-247.8)
Second follow-up 546 150.6 (101.2-248.1) 532 153.1 ( 48.6-181.9)
Added sugar (g/day)* Baseline 691 68.2 ( 48.1- 92.7) 689 68.9 ( 84.2- 240.4)
First follow-up 618 58.1 ( 42.7- 77.5) 612 60.3 ( 44.6- 82.9)
Second follow-up 546 57.1 ( 41.7- 75.2) 532 62.8 ( 42.9- 85.0)
Total fat (E %/d)* Baseline 691 25.5 ( 22.0- 29.0) 689 25.3 ( 21.6- 29.2)
First follow-up 618 25.5 ( 21.7- 29.3) 612 26.3 ( 22.4- 30.2)
Second follow-up 546 25.9 ( 22.1- 30.5) 532 26.2 ( 22.5- 30.5)
Sodium (g/day)* Baseline 691 2.26 (1.78-2.87) 532 2.40 (1.85-2.93)
First follow-up 618 2.10 (1.64-2.65) 612 2.11 (1.61-2.70)
Second follow-up 546 1.92 (1.51-2.50) 532 2.00 (1.55-2.61)
Processed food intake as snacks (g/day)* Baseline 691 94.5 (27.5-220.0) 689 97.5 (40.0-258.0)
First follow-up 618 63.8 (0.00-184.6) 612 81.5 (12.6-204.6)
Second follow-up 546 60.0 (0.00-180.0) 532 98.1 (16.3-233.8)
Processed food consumed and prepared at
school (% of consumers)
Baseline 691 18.4 689 20.6
First follow-up 618 18.1 612 31.4
Second follow-up 546 26.5 172 32.3

Chapter 3 Effect of the health promotion intervention ACTIVITAL
63
Intervention group Control group
Measurement n Median (25th-75th) or Mean (SD2) n Median (25th-75th) or Mean (SD)
Breakfast intake (%) Baseline 691 78.4 532 75.6
First follow-up 618 79.3 612 77.3
Second follow-up 546 74.0 532 80.8
BMI3 (kg/m2)¶ Baseline 687 19.8 (3.3) 692 19.7 (2.9)
First follow-up 612 20.8 (3.3) 607 20.7 (2.9)
Second follow-up 542 21.3 (3.3) 528 21.0 (2.9)
Waist circumference (cm) ¶ Baseline 691 68.9 (9.0) 692 68.3 (8.1)
First follow-up 615 68.3 (8.0) 607 69.4 (7.6)
Second follow-up 543 71.1 (8.4) 530 71.2 (7.9)
Systolic blood pressure (mmHg)¶ Baseline 690 101.0 (9.3) 692 101.0 (9.2)
First follow-up 618 101.5 (9.6) 612 101.7 (9.5)
Second follow-up 543 101.2 (9.8) 533 105.0 (9.7)
Diastolic blood pressure (mmHg)¶ Baseline 690 62.1 (8.5) 692 62.2 (9.0)
First follow-up 618 63.0 (7.3) 612 62.8 (7.6)
Second follow-up 543 63.5 (7.3) 533 65.7 (7.9)
1 Summary statistics using all the available data at baseline and follow-up points adjusted for the cluster design; 2 Standard deviation; 3 Body mass index. *Median and IQR. ¶ Mean and SD

Chapter 3 Effect of the health promotion intervention ACTIVITAL
64
Table 12 Intervention effect (overall and by intervention stage)
Primary outcomes
Effect after the intervention
28 months1
Effect after stage 1
(17 months)2
Effect after stage 2
(11 months)2
n Diff3 95% CI P4 ICC5 Diff 95% CI P Diff 95% CI P ICC6
Fruit and vegetables (g/day) 1078 23.4 ( 7.28; 40.3) 0.005 0 29.2 ( 10.4; 47.6) 0.002 -13.4 (-37.4; 10.2) 0.265 0
Added sugar (g/day) 1078 -5.60 (-9.80;-1.68) 0.005 0.07 -2.72 (-6.97; 1.36) 0.204 -4.07 (-8.47; 0.44) 0.074 0.07
Fat (E%/d) 1078 -0.56 (-1.12; 0.28) 0.241 0.03 -0.51 (-1.36;0.24) 0.169 0.11 (-0.77; 1.10) 0.742 0.03
Sodium (g/d) 1078 0.01 (-0.08; 0.08) 0.897 0.00 0.05 (-0.05; 0.15) 0.450 -0.04 (-0.17; 0.77) 0.477 0.00
Processed food at snacks (g/day) 1078 -23.3 (-45.3;-1.40) 0.037 0.03 -9.35 (-32.1; 13.4) 0.421 -18.5 (-44.8; 7.81) 0.168 0.03
Processed food consumers at school (PD7) 1078 -0.02 (-0.08; 0.06) 0.486 0.09 -0.15 (-0.20;-0.08) <0.001 0.11 (0.08; 0.50) 0.005 0.07
Breakfast intake (PD) 1078 -0.03 (-0.06; 0.03) 0.387 0.00 0.03 (-0.005; 0.085) 0.109 -0.07 (-0.13;-0.02) 0.011 0.00
Secondary outcomes
BMI (kg/m2) 1072 0.06 (-0.14; 0.25) 0.596 0.21 0.01 (-0.17; 0.17) 0.922 0.10 (-0.03; 0.22) 0.139 0.31
Waist circumference (cm) 1075 -0.84 (-1.68;-0.28) 0.005 0.05 -1.68 (-2.38;-1.02) <0.001 0.66 [-0.07; 1.21) 0.081 0.06
SBP8 (mmHg) 1078 -3.64 (-4.48;-2.52) <0.001 0.06 -0.34 (-1.36; 0.85) 0.623 -3.85 (-5.06;-2.53) <0.001 0.01
DBP9 (mmHg) 1078 -1.96 (-3.08;-0.84) <0.001 0.10 0.34 (-0.85; 1.53) 0.525 -2.86 (-4.07;-1.65) <0.001 0.10
1 Results obtained from linear mixed models accounting for the effects of clustering by individual and school. The models were adjusted for sex, unsatisfied basic needs and differences at baseline
(excluding the treatment group main effect) (162); 2 Results obtained from regression spline mixed effects models accounting for the effects of clustering by individual and school. One knot was defined at
the mean time of the first follow up data collection (17 months). These models were also adjusted for sex, UBN and differences at baseline; 3Mean differences; 4 P value; 5 Intraclass correlation coefficient
of linear mixed models; 6 Intraclass correlation coefficient of regression spline mixed effects models; 7Proportion difference. 8Systolic Blood pressure; 9Diastolic Blood pressure; Bold: P value <0.05

Chapter 3 Effect of the health promotion intervention ACTIVITAL
65
3.4.2.1 Sensitivity analysis
The intervention effect on waist circumference remained significant and in favor of the intervention
group after additional adjustment for BMI z-score (Appendix 7).
The intervention effect did not change considerably with the exception of processed food intake during
snacks when missing outcome data were imputed (Appendix 8). After imputing missing values the
effect on processed food intake at snack time was no longer significant (P=0.092) and the coefficient
decreased from -23.3 to -18.3 g/day.
3.5 Discussion
This is the first multicomponent and theory-based health promotion intervention performed among a
group of Andean adolescents. The ACTIVITAL trial increased fruit, vegetables, and decreased added
sugar intake, processed food intake during snacks and in food prepared at schools, as well as average
systolic-diastolic blood pressure and waist circumference in the intervention group. To the best of our
knowledge, this study is unique in that it provides a comprehensive effect of a school-based intervention
after various school years of implementation in LMICs.
The trial resulted in an increment of 23g of fruit and vegetable intake. Using average serving sizes (165),
this represents an increment of 0.3 servings. This effect is comparable to that of other school-based
health promotion programs in this age group (166-168). Nevertheless, the final intake in the intervention
group was still below the recommended intake of 400g of fruits and vegetables per day (169).
We report improvements in snacking by an overall reduction of 23g of processed food intake during
snacks and a decrease of 15% in the proportion of consumers of processed food prepared at school in
the intervention group during the first stage. A reduction of 6g in added sugar intake per day in favor of
the intervention group was also accomplished. The implementation of a multicomponent parents
involved program can explain these results, as programs aiming the food sources at school and at home
and focusing in a variety of unhealthy food items seem to be less likely to fail (170). The decrease in the
fraction of consumers of unhealthy food at school during stage one may suggests improvements in the
food prepared at school, the PE will allow a better understanding of these results (Chapter 5). On the
other hand, our results in added sugar are slightly lower than those of previous studies targeting added
sugar intake (171, 172). However, most of the latter studies were conducted in overweight adolescents
(171) or focused only on carbohydrates and sugar intake (172). Even though we succeeded in decreasing
sugar and processed food intake, it is clear that mean added sugar intake in our sample is more than
double the recommended maximum of 25g of sugar per day (173), and that the average processed food
intake during snacks remains high.
Our reductions of 1cm of waist circumference, 4mmHg of systolic blood pressure and 2mmHg in
diastolic blood pressure are comparable to previous studies (174). Diets high in fruit and vegetables,

Chapter 3 Effect of the health promotion intervention ACTIVITAL
66
low in fast food and soda, and improvements in physical fitness have been inversely correlated with
waist circumference (34, 175). Similarly, evidence suggest that high sodium intake (121), sedentary
behavior and low physical activity/fitness can influence blood pressure (34). Our effect on diet could
partially explain the effect on waist circumference. However, diet may not have contributed to the effect
on blood pressure as our trial did not affect sodium intake. Nevertheless, the ACTIVITAL trial also had
important effects on both physical activity and physical fitness (161): at the end of the trial, the
proportion of adolescents reaching the recommended moderate to vigorous physical activity decreased
less in the intervention group, the proportion of adolescents spending more than 3 hours in front of a
screen decreased in the intervention group during week days, performance on the vertical jump test was
better among the intervention participants, and finally, participants in the control group performed worse
on the speed shuttle run test (161).
The effects of the trial were larger during stage one and tended to level off during stage 2. Differences
in program implementation at stage two can explain this. Chapter 5 provides details in differences of
the program implementation according to the intervention stage.
3.6 Limitations
We acknowledge a number of limitations. We had a considerable number of dropouts in our study due
to adolescents changing or leaving the schools. However, this dropout was balanced over the groups and
the analysis of missing values did not result in important differences. Some schools were not considered
for randomization in the pair-matching process because they either had very few students or an
unavailable matching pair. Nevertheless, we do not believe that these may affect generalizability of the
results as in the recent years all the schools became co-ed, an important share of the small schools as
well as all the schools without 8th-10th basic education grades and 1st-3rd high school grades in the same
campus have stopped functioning. Sodium intake could not be estimated in 30 food items. Yet, as the
same method was used for both the intervention and the control schools, this lack of micronutrient data
is unlikely to have influenced our findings.
The change in fruit and vegetable intake consumption over time in the intervention and in the control
group shows that fruit and vegetable intake decreases in both groups (Appendix 6). Therefore it seems
that the reported effect is the consequence of a lower decrease in the intake of fruit and vegetables in the
intervention group in comparison with the control group. The current analysis only shows the overall
effect of the intervention on primary and secondary outcomes. The mechanism throughout the
intervention was effective cannot be determined with this analysis. Mediation analysis will be necessary
in order to identify the factors and strategies that are influencing the described effect (176)

Chapter 3 Effect of the health promotion intervention ACTIVITAL
67
3.7 Conclusion
ACTIVITAL lead to improvements of several risk factors for NCDs, i.e. fruit and vegetable and waist.
Although still below the nutritional recommendations, the combined effect of the intervention on several
individual risk factors is encouraging and promising (11, 166). It suggests that school-based
interventions can address various risk factors simultaneously in adolescents from LMICs.

68

69
4 Effect of the school-based health promotion
intervention ACTIVITAL on dietary intake,
waist circumference and blood pressure. A
subgroup analysis of a cluster randomized
controlled trial

70

Chapter 4 Subgroup analysis
71
4.1 Summary
Objective: The objective of this chapter is to analyze if the effect of the ACTIVITAL program after 28
months varies with weight-status, age and socioeconomic status estimated by UBN of the participants.
Methods: A subgroup analysis for weight-status, age and UBN was performed including all the
outcomes with a significant intervention effect after 28 months. The analysis was stratified if the
interaction terms were concomitantly significant (P<0.1) in bivariate and fully adjusted models and if
they remained significant after further adjustment including all the significant subgroups per each
outcome.
Results: Our data suggests that the intervention effect on fruit and vegetables, added sugar, processed
food intake during snacks and blood pressure was independent of the subgroups. In addition,
adolescents’ UBN was not associated with an intervention effect. The effect on waist circumference on
the contrary was larger among overweight-obese (-1.35 cm; 95% CI: -2.25, -0.45) and younger
adolescents (-1.89 cm; 95% CI: -3.70, -0.08).
Conclusion: ACTIVITAL has the potential to be effective among adolescents regardless of their
socioeconomic background. Future studies involving similar target groups should be designed and
powered to confirm differential effects in weight status and the age of the participants when waist
circumference is within the outcomes.
Keywords: RCT, diet, school, adolescents, Ecuador, subgroup analysis

Chapter 4 Subgroup analysis
72
4.2 Introduction
The burden of NCDs risk factors affects people belonging to distinct subgroups differently (13, 41).
There is evidence that people from the lower socioeconomic strata present higher NCDs risk such as
tobacco use, high blood pressure and low fruit and vegetables intake compared with people from the
higher strata (13). In our particular research population, some modest differences in the prevalence of
risk factors as well as in its influential factors were documented by socio-economic status (Chapter 1
and 2).
Similarly, overweight-obese children and adolescents show greater mortality rates and are more likely
to be obese adults (41). Depending on the setting, evidence also shows that the effect of school-based
interventions aiming at improving dietary intake and physical activity vary according to weight status
and age of the participants in HICs (177). There is still limited evidence of the differential effect of
nutrition interventions according with socio-economic status (177, 178). In general, the few data
available from HICs suggest that such interventions could work better in the higher socio-economic
groups (178). In summary, it is unclear if the effect of these behavioral interventions performed in
LMICs varies with socioeconomic status, weight status or age.
Within their limitations, subgroup analysis of RCTs offers useful insights for further research and policy
makers (179, 180). Subgroup analysis of trials in a specific setting can provide useful information about
the heterogeneity or the consistency in the treatment effect across the subgroups. This information can
be used to decide whether or not the intervention can be used more extensively (179).
The school-based pair matched cluster RCT ACTIVITAL improved dietary intake outcomes, waist
circumference and blood pressure (Chapter 3) after 28 months. In the present chapter, this effect is
further analyzed according to weight-status, age and socioeconomic status of the participants estimated
by UBN.
4.3 Methods
4.3.1 Definition of subgroups
As described in Chapter 3 dietary intake and physical activity were the primary outcomes, while waist
circumference, BMI and blood pressure were secondary outcomes. Weight status definition was based
on the International Obesity Task Force criteria for age and gender (97, 181). Three subgroups were
considered: (i) underweight, (ii) healthy weight and (iii) overweight and obese were included together
in one subgroup. Age was dichotomized at its median value (12.7 years). As described in Chapter 2,
UBN was categorized in two groups: the poor and the better-off.
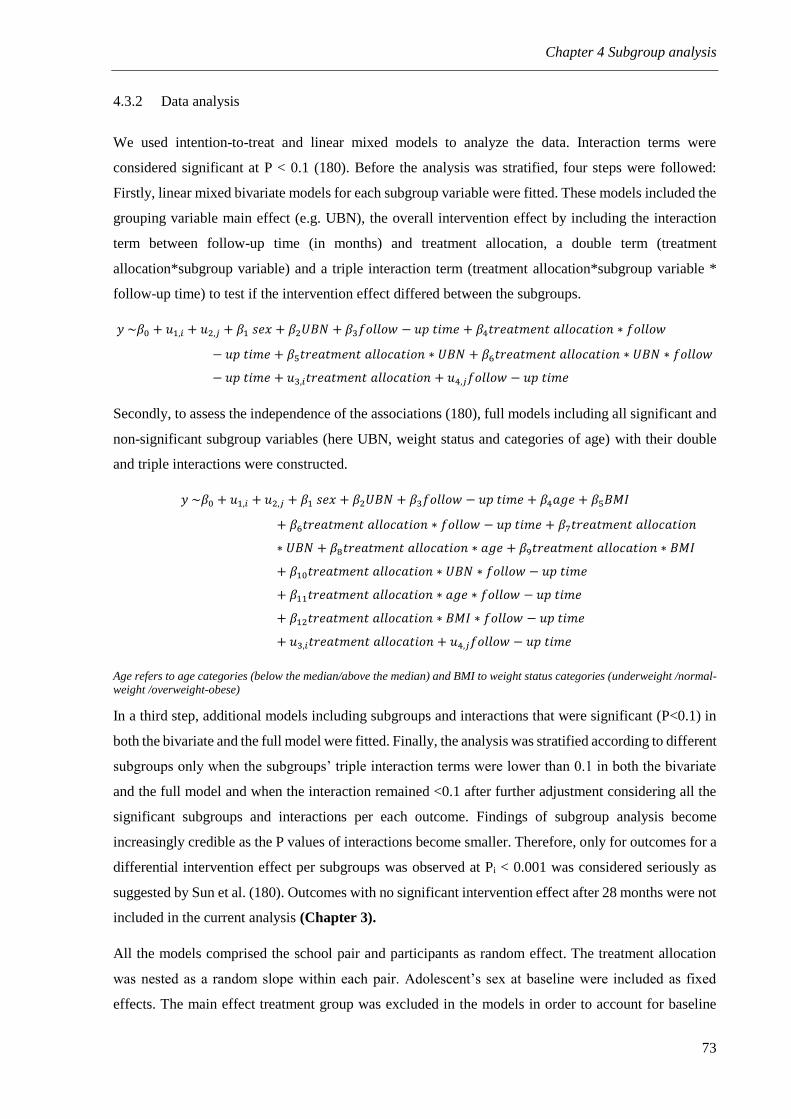
Chapter 4 Subgroup analysis
73
4.3.2 Data analysis
We used intention-to-treat and linear mixed models to analyze the data. Interaction terms were
considered significant at P < 0.1 (180). Before the analysis was stratified, four steps were followed:
Firstly, linear mixed bivariate models for each subgroup variable were fitted. These models included the
grouping variable main effect (e.g. UBN), the overall intervention effect by including the interaction
term between follow-up time (in months) and treatment allocation, a double term (treatment
allocation*subgroup variable) and a triple interaction term (treatment allocation*subgroup variable *
follow-up time) to test if the intervention effect differed between the subgroups.
𝑦 ~𝛽0 + 𝑢1,𝑖 + 𝑢2,𝑗 + 𝛽1 𝑠𝑒𝑥 + 𝛽2𝑈𝐵𝑁 + 𝛽3𝑓𝑜𝑙𝑙𝑜𝑤 − 𝑢𝑝 𝑡𝑖𝑚𝑒 + 𝛽4𝑡𝑟𝑒𝑎𝑡𝑚𝑒𝑛𝑡 𝑎𝑙𝑙𝑜𝑐𝑎𝑡𝑖𝑜𝑛 ∗ 𝑓𝑜𝑙𝑙𝑜𝑤
− 𝑢𝑝 𝑡𝑖𝑚𝑒 + 𝛽5𝑡𝑟𝑒𝑎𝑡𝑚𝑒𝑛𝑡 𝑎𝑙𝑙𝑜𝑐𝑎𝑡𝑖𝑜𝑛 ∗ 𝑈𝐵𝑁 + 𝛽6𝑡𝑟𝑒𝑎𝑡𝑚𝑒𝑛𝑡 𝑎𝑙𝑙𝑜𝑐𝑎𝑡𝑖𝑜𝑛 ∗ 𝑈𝐵𝑁 ∗ 𝑓𝑜𝑙𝑙𝑜𝑤
− 𝑢𝑝 𝑡𝑖𝑚𝑒 + 𝑢3,𝑖𝑡𝑟𝑒𝑎𝑡𝑚𝑒𝑛𝑡 𝑎𝑙𝑙𝑜𝑐𝑎𝑡𝑖𝑜𝑛 + 𝑢4,𝑗𝑓𝑜𝑙𝑙𝑜𝑤 − 𝑢𝑝 𝑡𝑖𝑚𝑒
Secondly, to assess the independence of the associations (180), full models including all significant and
non-significant subgroup variables (here UBN, weight status and categories of age) with their double
and triple interactions were constructed.
𝑦 ~𝛽0 + 𝑢1,𝑖 + 𝑢2,𝑗 + 𝛽1 𝑠𝑒𝑥 + 𝛽2𝑈𝐵𝑁 + 𝛽3𝑓𝑜𝑙𝑙𝑜𝑤 − 𝑢𝑝 𝑡𝑖𝑚𝑒 + 𝛽4𝑎𝑔𝑒 + 𝛽5𝐵𝑀𝐼
+ 𝛽6𝑡𝑟𝑒𝑎𝑡𝑚𝑒𝑛𝑡 𝑎𝑙𝑙𝑜𝑐𝑎𝑡𝑖𝑜𝑛 ∗ 𝑓𝑜𝑙𝑙𝑜𝑤 − 𝑢𝑝 𝑡𝑖𝑚𝑒 + 𝛽7𝑡𝑟𝑒𝑎𝑡𝑚𝑒𝑛𝑡 𝑎𝑙𝑙𝑜𝑐𝑎𝑡𝑖𝑜𝑛
∗ 𝑈𝐵𝑁 + 𝛽8𝑡𝑟𝑒𝑎𝑡𝑚𝑒𝑛𝑡 𝑎𝑙𝑙𝑜𝑐𝑎𝑡𝑖𝑜𝑛 ∗ 𝑎𝑔𝑒 + 𝛽9𝑡𝑟𝑒𝑎𝑡𝑚𝑒𝑛𝑡 𝑎𝑙𝑙𝑜𝑐𝑎𝑡𝑖𝑜𝑛 ∗ 𝐵𝑀𝐼
+ 𝛽10𝑡𝑟𝑒𝑎𝑡𝑚𝑒𝑛𝑡 𝑎𝑙𝑙𝑜𝑐𝑎𝑡𝑖𝑜𝑛 ∗ 𝑈𝐵𝑁 ∗ 𝑓𝑜𝑙𝑙𝑜𝑤 − 𝑢𝑝 𝑡𝑖𝑚𝑒
+ 𝛽11𝑡𝑟𝑒𝑎𝑡𝑚𝑒𝑛𝑡 𝑎𝑙𝑙𝑜𝑐𝑎𝑡𝑖𝑜𝑛 ∗ 𝑎𝑔𝑒 ∗ 𝑓𝑜𝑙𝑙𝑜𝑤 − 𝑢𝑝 𝑡𝑖𝑚𝑒
+ 𝛽12𝑡𝑟𝑒𝑎𝑡𝑚𝑒𝑛𝑡 𝑎𝑙𝑙𝑜𝑐𝑎𝑡𝑖𝑜𝑛 ∗ 𝐵𝑀𝐼 ∗ 𝑓𝑜𝑙𝑙𝑜𝑤 − 𝑢𝑝 𝑡𝑖𝑚𝑒
+ 𝑢3,𝑖𝑡𝑟𝑒𝑎𝑡𝑚𝑒𝑛𝑡 𝑎𝑙𝑙𝑜𝑐𝑎𝑡𝑖𝑜𝑛 + 𝑢4,𝑗𝑓𝑜𝑙𝑙𝑜𝑤 − 𝑢𝑝 𝑡𝑖𝑚𝑒
Age refers to age categories (below the median/above the median) and BMI to weight status categories (underweight /normal-weight /overweight-obese)
In a third step, additional models including subgroups and interactions that were significant (P<0.1) in
both the bivariate and the full model were fitted. Finally, the analysis was stratified according to different
subgroups only when the subgroups’ triple interaction terms were lower than 0.1 in both the bivariate
and the full model and when the interaction remained <0.1 after further adjustment considering all the
significant subgroups and interactions per each outcome. Findings of subgroup analysis become
increasingly credible as the P values of interactions become smaller. Therefore, only for outcomes for a
differential intervention effect per subgroups was observed at Pi < 0.001 was considered seriously as
suggested by Sun et al. (180). Outcomes with no significant intervention effect after 28 months were not
included in the current analysis (Chapter 3).
All the models comprised the school pair and participants as random effect. The treatment allocation
was nested as a random slope within each pair. Adolescent’s sex at baseline were included as fixed
effects. The main effect treatment group was excluded in the models in order to account for baseline

Chapter 4 Subgroup analysis
74
differences between the intervention and the control group. The effect of the intervention in the different
subgroups was evaluated by testing the interaction term between follow-up time (in months) and
treatment allocation. The results of the interaction term between the treatment groups with time (in
months) in the final stratified models were multiplied by 28 (duration of the trial) to obtain the
intervention effect after 28 months. The resulting Beta coefficients correspond to the effect after the
whole program implementation and indicate the mean differences between the treatment and the control
group.
Outcome differences at baseline were tested using linear mixed models accounting for the treatment
groups and the school pairs, when the variables did not follow a normal distribution, log transformation
were carried before including them in the models.
4.4 Results
4.4.1 Baseline differences
Baseline differences of primary and secondary outcomes between the intervention and the control group
among the proposed subgroups are reported in Appendices 9 and 10. Underweight participants in the
intervention group consumed less fruit (49% less) and more processed food during snacks (56% more)
than the underweight participants in the control group. Mean diastolic blood pressure was lower among
the overweight-obese control participants (4% lower, P=0.028) but higher among the underweight group
(8% higher, P=0.016) compared with their peers in the intervention group.
Table 13 Triple interactions terms obtained from bivariate models and full models of outcomes with a significant intervention
effect after 28 months
Outcomes UBN1 Weight status2 Age3
B4 F5 B F B F
Fruit and vegetables (g/day) 0.800 0.883 0.428 0.544 0.600 0.342
Added sugar (g/day) 0.833 0.895 0.175 0.159 0.197 0.176
Processed food at snacks (g/day) 0.976 0.989 0.706 0.697 0.307 0.237
Waist circumference (cm) 0.552 0.752 <0.001 <0.001 0.003 0.004
Systolic blood pressure (mmHg) 0.084 0.148 0.354 0.344 0.141 0.165
Diastolic blood pressure (mmHg) 0.472 0.293 0.619 0.623 0.101 0.113
1Unsatisfied basic needs: Better-off and poor; 2Weight status includes three categories: underweight, healthy weight and
overweight-obese; 3Age: younger and older than 12.7 years; 4P value of the interaction terms of the bivariate models; 5P value
of the interaction terms of fully adjusted models. Bold: significant interaction terms (P<0.1) in both the bivariate and full models
4.4.2 Results of the interaction terms
Table 13 contains the results of the interaction tests of bivariate and fully adjusted models. The findings
suggest that the intervention effect on fruit and vegetables, added sugar processed food intake during
snacks and blood pressure was independent of the subgroups. UBN was not associated with a differential

Chapter 4 Subgroup analysis
75
intervention effect. Waist circumference was the only outcome with significant interaction terms for
age-categories and weight-status categories. Both interaction terms remained significant after further
adjustment including the significant interactions and subgroups. The interaction term for age-categories
was the only one Pi < 0.001 (Pi intervention*time*weight status=0.013; Pi intervention
*time*age=<0.001).
4.4.3 Stratified analysis per weight status, age and UBN
Based on the interaction terms, a stratified analysis is presented in Table 14. The effect on waist
circumference was larger among overweight-obese (-1.35 cm; 95% CI: -2.25, -0.45) and younger
adolescents (-1.89 cm; 95% CI: -3.70, -0.08).
Table 14 Effect on waist circumference according with categories of BMI and age
Outcomes by subgroups n Diff1 95% CI2 P value
Weight status 1071
Underweight 67 -0.25 [-2.16; 1.66] 0.799
Healthy weight 792 -0.65 [-1.32; 0.03] 0.059
Overweight-obese 212 -1.89 [-3.70;-0.08] 0.041
Age 1074
Younger than 12.7 years 534 -1.34 [-2.24;-0.45] 0.003
Older than 12.7 years 536 -0.56 [-1.46; 0.36] 0.239
1 Results obtained from linear mixed models accounting for the effects of clustering by individual and school. The models were adjusted for sex, unsatisfied basic needs and differences at baseline (162); 2 Confidence Interval. Bold: P value <0.05
4.5 Discussion
This subgroup analysis indicated that the trial is equally effective among adolescents from different
socioeconomic backgrounds for several outcomes such as fruit and vegetables, added sugar, processed
food and blood pressure. The increased effect on waist circumference among younger participants is
remarkable. Our results also suggest that the intervention resulted in a higher effect on waist
circumference among overweight-obese adolescents.
After testing the interaction terms in both bivariate and fully adjusted models, no differential effect was
noticed for the dietary intake outcomes and blood pressure across the proposed subgroups. Obtaining
consistent results of subgroup analysis across different outcomes enhances credibility of the findings
(180). Although these findings remain to be confirmed by adequately powered studies, our observations
provide useful evidence for policy makers as they indicate that the ACTIVITAL intervention is effective
to improve food intake and blood pressure in adolescents independently of their age, UBN or weight
status.
The effect on waist was larger among the participants younger than 12.7 years old. The effect on diet
was not different for the proposed age groups, suggesting that the differential effect is the consequence

Chapter 4 Subgroup analysis
76
of a larger effect on fitness and physical activity among the younger participants (Andrade et al,
unpublished data). Other similar interventions from HICs have also reported a higher effect on physical
activity among younger participants (177). Once again, the differential effect was consistent for various
outcomes in the study, suggesting stronger credibility of our findings (180).
We report that the effect on waist circumference was larger in overweight and obese participants.
Previous reports have found that at risk populations are more susceptible to interventions (182).
Improving other risk factors in overweight-obese populations has important clinical implications (11).
Abdominal obesity is an important predictor of CVD and type II diabetes and has been associated
independently of BMI with adult morbidity and mortality (34). The larger effect on overweight
participants is consistent with the larger effect on speed-agility as measured by the speed shuttle run test
among the same group (data presented in a separate thesis). Furthermore, high levels of speed-agility
have been inversely correlated with lower abdominal adiposity (34).
4.6 Limitations
These post-hoc estimations should be interpreted with caution. An analysis of the proposed subgroups
was not pre-specified. The trial was powered to detect a 10% decrease in energy percentage from fat.
The subgroup analysis presented here is therefore exploratory and no firm conclusions can be drawn on
the intervention effect in the different groups. Nevertheless, the findings provide useful information for
researchers to design and implement adequately powered studies comparing the effects in these sub-
groups in similar settings. The best method to validate the findings of this analysis is indeed by
reproducing the subgroup-treatment effect interactions in other trials (179).
4.7 Conclusion
A school-based intervention performed among adolescents in LMICs has the potential to be effective in
improving fruit and vegetable intake and in reducing added sugar and processed food intake among
adolescents with different socioeconomic backgrounds, age and weight status. Future studies involving
similar target groups should be adequately powered and consider in their sample sizes the weight status
and the age of the participants when waist circumference and physical activity are within the outcomes.
Reproducing the results in other studies will allow confirming the findings of the present analysis (179).

77
5 Process evaluation of the ACTIVITAL school-
based health promotion intervention

78

Chapter 5 Process evaluation
79
5.1 Summary
Objective: to describe the PE of the ACTIVITAL school-based health promotion intervention and to
link the PE data with the intervention effect.
Methods: A full pre-specified PE was performed to systematically document the process, content, and
implementation of the ACTIVITAL school-based intervention in Ecuadorian adolescents. Reach, dose
delivered, dose received, fidelity and an analysis of the context (barriers and environment) of the
intervention were evaluated at both stages of the intervention. Observations, face-to-face interviews and
questionnaires were applied to all audiences (adolescents, parents, teachers and school staff). Linear
regression models were performed to identify schools that better implement the program components
than others.
Results: The intervention was implemented in the ten schools, 46% of the school teachers delivered the
classes themselves. Students received 94% of the planned classes, teachers were motivated in 89% of
them. The teachers demonstrated sufficient knowledge in 88% of the classes and their students enjoyed
around 93% of the delivered classes. All the parental workshops were implemented in the ten
intervention schools and all but one school participated in the food-tuck shop workshops. All the parental
and food-tuck shop workshops were delivered by experienced staff and the attendants showed a positive
attitude towards the classes, but the reach of parents was low (15%). The main barriers that should be
considered before implementing the program in real practice were the difficulty to include the program
in the school curriculum, the voluntary participation of the school teachers, lack of time to perform the
classes, poor parental reach, difficulties to change the food and portion sizes served by the food-tuck
shop staff and persistence of an adverse nutritional environment outside the school. The intervention
was more or less homogenously implemented along the ten intervention schools.
Conclusion: In general, the ACTIVITAL intervention was well implemented, its content was excellent
and well received by the included audiences. Future programs should incorporate the activities in the
school curriculum, provide clear and easy guidelines designed in a formative way to the food-tuck shops
and deal with the poor parental reach.
Keywords: RCT, diet, school, adolescents, Ecuador, process evaluation
Chapter 5 Process evaluation
80
5.2 Introduction
PE collects information about the extent, fidelity, and quality of the implementation of interventions
(85). It is used to monitor and document how and to what extent interventions are implemented as
planned and adopted by the beneficiaries in a specific setting (85). Particularly for complex interventions
such as behavioral interventions implemented at multiple levels and with multiple audiences, PE can
help to understand the pathways of change (45, 85, 183), describe the actual activities implemented and
assess the opportunities to implement the intervention in real practice (183).
Conducting a PE for complex interventions is gaining interest in HICs (184). However, in LMICs little
attention is paid to PE and the focus of research is placed mainly on the evaluation of end points (effect
evaluation) (45). This is unfortunate as focusing only on outcome evaluation assumes a uniform
implementation of the interventions (185, 186). The latter possibly hampers (i) understanding the
implementation and the findings, (ii) identifying differences or similarities with other interventions in
similar settings, and (iii) recognizing key elements for success or failure (187). Only by understanding
how behavioral interventions work in LMICs, these interventions will be able to reach their full potential
of addressing unhealthy risk factors in school-age children (45).
This chapter documents (i) the implementation of the curriculum and environment-based components
of the intervention; (ii) the attitudes of teachers, food-tuck shop owners, parents and adolescents towards
the intervention; (iii) the existence of other factors in the external environment affecting the
implementation of the intervention components at each school; and (iv) differences in the degree of the
program components implementation across the ten intervention schools and by intervention stage of
the dietary-oriented strategies (i.e. healthy eating classes and workshops).
5.3 Methods
5.3.1 PE framework of the ACTIVITAL intervention
A pre-specified PE protocol was developed and used to systematically document the intervention
activities from September 2009 - June 2012. The systematic and stepwise approach as described by
Saunders et al. was used as the framework to design and analyze the PE (85). This framework included
the following PE elements: recruitment activities, reach (degree to which the intended priority audience
participates in the intervention), dose delivered (amount of program delivered by implementers), dose
received (extent to which participants received and used materials or other resources), fidelity (quality
of implementation) and the context (barriers and environment) across the whole implementation process
in the ten intervention schools (188). These elements were evaluated across the different audiences
included in the intervention (adolescents, parents, teachers and school staff). A combination of both
quantitative and qualitative evaluation instruments was applied to gather information (189). The
different methods of data collection for each of these elements were defined prior to the start of the trial

Chapter 5 Process evaluation
81
based on previous work (29, 189-195). Table 15 describes the PE instruments used to collect
information on the PE elements, the data types, timing of data collection and final outputs used to present
the results. Appendices 11-13 contain examples of the PE instruments. Table 9 (Chapter 3) contains a
detailed description of the intervention components and strategies implemented at stage one and two.
For the parental component, only the implementation of the workshops was evaluated, a measure of the
degree of use of the provided information at home was not planned.
5.3.1.1 Registers of the school food environment
The registers of the school environment described in this section were the only data collected in both
the intervention and control schools during the PE development, the other data is available for the
intervention schools only. The nutritional environment outside the school of both the intervention and
control schools was documented at baseline and at both follow-ups. Validated tools were applied to
collect these data (196). For this, the number of ‘fast food’ restaurants, grocery stores and street vendors
one block around the school are reported (Cuenca is a square-block city). Fast food restaurants were
defined as any restaurant or cafeteria serving food normally prepared in trans-national ‘fast food’ chains
(e.g. hot dogs, hamburgers, French fries and pizza) (197).
5.3.1.2 Differences in PE data collection methods between the intervention packages
In the first intervention package, all classes of the curriculum-based component were observed by the
ACTIVITAL staff. In the second intervention package only two randomly selected classes per school
were observed. The minor observation of the classes in the second stage allowed implementing classes
in a less controlled environment. Teachers were not notified in advance which classes would be observed
by the ACTIVITAL staff. The evaluation forms filled out by staff of the food-tuck shops were not
administered during the intervention package one. Similarly, adolescents’ evaluation forms were not
administrated during intervention package two (Table 15). Data obtained throughout the structured
observation of the classes are presented in general and not separately by intervention package. Data
obtained throughout the adolescents and food-tuck shop evaluation forms are presented only for the
intervention package that they were measuring. As a consequence, data originated from these tools are
not compared between stage one and two.

Chapter 5 Process evaluation
82
Table 15 Instruments used to collect PE data during the ACTIVITAL intervention (PE framework)
PE element PE instruments Data sources Timing
Content Type of
data Output IP11 IP22
The curriculum-based component
Recruitment Field notes3 ACTIVITAL
staff
N/A N/A Schools, teachers and adolescents, recruitment
activities
Qualitative Register of the recruitment procedures
Dose
delivered
Structured observations ACTIVITAL
staff
Yes Partially4 Number of classes delivered Quantitative % of classes delivered
Use of the planned methods and materials Qualitative % of classes with all the planned methods and
materials used
Teachers’ evaluation forms Teachers Yes Yes Number of classes delivered Quantitative % of classes delivered (Cross-checked with
the observations)
Dose received Structured observations ACTIVITAL
staff
Yes Partially4 -Students’ attitude towards the classes Qualitative % of students with a highly positive attitude
-Teachers’ motivation Qualitative % of classes delivered by motivated teachers
Teachers’ evaluation forms Teachers Yes Yes -Students’ enjoyment Quantitative % of classed enjoyed by adolescents
-Problems during the classes Quantitative % of classes with absence of problems
Semi-structured interviews
with teachers
ACTIVITAL
staff
Yes Yes -Teachers’ level of satisfaction with the program Qualitative % of satisfied teachers with the program
Adolescents’ evaluation
form
Adolescents Yes No -Adolescents’ rate the classes /10
Quantitative Adolescents’ rate of the classes/10 (Median
and range)
Reach Field notes3 ACTIVITAL
staff
N/A N/A -Invited vs. accepted schools and teachers Quantitative % of classes delivered by school teachers
Structured observations ACTIVITAL
staff
Yes Partially4 -School teachers delivering the classes Quantitative % of classes delivered by school teachers
(Cross-checked with the field notes5)
Fidelity Structured observations ACTIVITAL
staff
Yes Partially4 -Teachers’ knowledge Qualitative % of classes delivered by teachers with
sufficient knowledge
-Accurately of the teachers explanation Qualitative % of classes with an accurate explanation
-Timing was sufficient Qualitative % of classes for which the planned time was
sufficient
ACTIVITAL staff intervention during the classes Qualitative % of classes in which the staff did not
intervene
Context Structured observations of
the classes
ACTIVITAL
staff
Yes Partially4 -Problems during the classes Qualitative List of the most common problems and
possible solutions (if available)
Teachers’ evaluation forms Teachers Yes Yes Additional problems mentioned by teachers Qualitative List of the most common problems and
possible solutions (if available)
Semi-structured interview
with teachers
ACTIVITAL
staff
Yes Yes Barriers identified by teachers Qualitative List of the most common barriers and possible
solutions (if available)

Chapter 5 Process evaluation
83
PE element PE instruments Data sources Timing
Content Type of
data Output
IP11 IP22
The environment-based component
Food-tuck shops workshops
Recruitment Field notes3 ACTIVITAL
staff
N/A N/A Food-tuck shops recruitment activities Qualitative Register of the recruitment procedures
Dose delivered Structured observations ACTIVITAL
staff
Yes Yes -Number of workshops delivered Qualitative % of workshops delivered
-Use of the planned methods Qualitative % of workshops with all the planned methods
and materials used
Dose received Structured observations ACTIVITAL
staff
Yes Yes -Staff’ attitude towards the workshops Qualitative % of staffs with a positive attitude
Attendants’ rate the workshops/10 Quantitative Attendants’ rate of the workshops/10 (Median
and range)
Reach Field notes3 ACTIVITAL
staff
N/A N/A Invited vs. accepted staff Quantitative -% of schools that attended to at least 80% of
the food-tuck shops workshops
- Number of attendants /workshop (Median,
Range)
Structured observations ACTIVITAL
staff
Yes Yes Invited vs. accepted staff Quantitative -% of schools that attended to at least 80% of
the food-tuck shops workshops
- Number of attendants /workshop (Median,
Range) (cross-checked with the field notes)
Fidelity Structured observations ACTIVITAL
staff
Yes Yes -Trainers’ knowledge Qualitative % of workshops delivered by trainers with
sufficient knowledge
Yes Yes -Timing Qualitative % of workshops with the planned time
sufficient
Context Structured observations ACTIVITAL
staff
Yes Yes -Problems during the workshops Qualitative List of the most common problems and
possible solutions (if available)
Evaluation forms Food-tuck shops
staff
No Yes -Additional comments and problems Qualitative List of common comments and problems and
possible solutions (if available)

Chapter 5 Process evaluation
84
PE element PE instruments Data sources Timing
Content Type of
data Output
IP11 IP22
Parental workshops
Recruitment Field notes3 ACTIVITAL staff N/A N/A Parents’ recruitment activities Qualitative Register of the recruitment procedures
Dose delivered Structured observations ACTIVITAL staff Yes Yes -Number of workshops delivered Qualitative % of workshops delivered
-Use of the planned methods Qualitative % of workshops with all the planned methods
and materials used
Dose received Structured observations ACTIVITAL staff Yes Yes -Parents’ attitude towards the
workshops
Qualitative % of parents with a positive attitude
Evaluation forms Parents Yes Yes -Was the delivered information new? Quantitative % of parents considered the delivered
information as new
-Did the workshop address the parents’
concerns?
Quantitative % of parents reporting that the workshops
address their concerns
-Attendants rate the workshops/10 Quantitative Attendants rate of the workshops/10 (Median
and range)
-Perception of the quality of the
workshop
Quantitative % of parents that qualify the workshop content
as very good or excellent
Reach Field notes3 ACTIVITAL staff N/A N/A -Invited vs. accepted staffs and parents Quantitative % of parents reached
Number of attendants/workshop (Median,
Range) (Median, Range)
Structured observations ACTIVITAL staff Yes Yes -Invited vs. accepted staffs and parents Quantitative % of parents reached
Number of attendants/workshop (Median,
Range) (Median, Range)
(cross-checked with the field notes)
Fidelity Structured observations -Timing Qualitative % of workshops in which the planned time was
sufficient
Context Structured observations ACTIVITAL staff Yes Yes -Problems during the workshops Qualitative List of the most common problems and possible
solutions (if available)
Evaluation forms Parents and food-
tuck shops staff
Yes Yes -Additional comments and problems Qualitative List of common comments and problems and
possible solutions (if available)
Environment
Register of the
environment6
-Food inventory ACTIVITAL staff N/A N/A -Recipes prepared in the food-tuck
shops
Quantitative % of type of recipes prepared in the food-tuck
shops
-Mapping the outside school
food environment
ACTIVITAL staff N/A N/A -Register the number of food shops one
block around the school
Quantitative Number and type of food shops around the
school (Median and Range) 1Intervention package one; 2Intervention package two; 3The field notes were taken throughout the whole program; 4All the classes of the curriculum-based component were observed by ACTIVITAL
staff during the intervention package one, while in the intervention package two only two randomly selected classes per school were observed; 5 In case that in an structured observation the
information regarding if the school teacher delivered the class or not was unclear, this information was cross-checked with the field notes; 6 Thee registers of the school environment were the only outputs obtained in the intervention and the control schools at baseline, follow-up one and follow-up two. N/A: Not applicable;

Chapter 5 Process evaluation
85
5.3.2 Ethics statement
The different audiences included in this PE were asked for their consent. Adolescents who returned
signed parental consent forms and gave written assent to participate were included in the analysis of the
PE. Parents and school staff provided written consent.
5.3.3 Data analysis
5.3.3.1 Qualitative data analysis
Qualitative data, i.e. structured observations and semi-structured interviews were transcribed verbatim
in Spanish and crosschecked by two researchers. The instruments were designed to collect specific
information of each PE element (Table 15 and Appendices 11-13). NVivo software (QSR international
– version 10.0) was used to code, manage and analyze these data. Coding was performed in two steps.
First, each question per instrument was assigned to its corresponding PE element, i.e. for the output “%
of classes in which the planned methods and materials were used”. The corresponding question of the
structured observations “Did the teacher use the materials/games/methods as planned in the booklet?”
was assigned to the PE element “dose delivered”. Second, new nodes (subcategories) were created for
each question per instrument. Following the example of the output “% of classes in which the planned
methods and materials were used”, all the responses to this question collected in the structured
observations were checked to identify the classes in which all the planned methods and materials were
used. A query was constructed in NVivo to determine the final % of sources (i.e. classes’ structured
observations) assigned to the node “all the planned methods and materials were used” to report the final
results. Appendix 14 shows a detailed description of the coding tree and the specific nodes reported per
each output. The teachers’ origin (school teacher or external teacher), and intervention stage (one and
two) were attributes cross-linked with constructs and themes for each observation and interview. The
differences in implementation among teachers’ origin are only presented where relevant. The
‘Consolidated criteria for reporting qualitative research checklist’ was used to report qualitative data
(198).
5.3.3.2 Quantitative data analysis
Quantitative data (i.e. evaluation forms for each audience as well as the registers of the environment)
were entered in duplicate in Epidata (Epidata Association, Odense, Denmark) by two researchers. Any
discrepancy was corrected using the original forms and Stata 12 was used to analyze the data. Data is
presented in percentages, mean (SD) or median (Range). For “dose delivered”, the number of activities
performed was divided by those scheduled. For “dose received” tuck shops staff and parents rates of the
classes /workshops were tabulated, and the average (SD) rates were computed. For “reach” of these, the
number of participants (adolescents, parents, teachers and staff) attending all the classes/workshops was
divided by the number of invited participants.

Chapter 5 Process evaluation
86
A Wilcoxon-rank sum t-test was used to compare differences in the number of food shops outside the
school between intervention and control schools at each measurement point. Differences in
implementation between stage one and two were tested using test for proportions in case of dichotomous
PE variables and a two-sample t-test in case of continuous PE variables. When variables did not follow
a normal distribution after transformations, a Wilcoxon-rank sum test was used.
5.3.3.3 Determination of the level of implementation
Table 16 Variables used to estimate the PE elements and the total score per school
PE elements PE outputs
The curriculum-based component
Dose delivered Classes delivered
Classes with the planned methods and materials used
Dose received Students with a highly positive attitude
Classes delivered by motivated teachers
Classes enjoyed by adolescents
Classes with absence of problems
Teachers satisfied with the program
Reach School teachers who delivered the classes
Fidelity Classes delivered by teachers with sufficient knowledge
Classes with an accurate explanation
Classes in which the planned time sufficient
Staff did not intervene during the classes
The environment-based component
Parental workshops
Dose received Parents motivation
Parents considered the delivered information as new
Parents reported the workshops address their concerns
Parents that qualify the workshop content as very good or excellent
Reach Parents reached
Fidelity Parental workshops with the planned time was sufficient
Food tuck shops workshops
Reach Food tuck shops reached
Total score/19
To determine if the intervention was implemented differently in the ten schools, the PE outputs described
in Table 15 were estimated separately for each intervention school. Outputs obtained from the structured
observations of the food-tuck shops workshops were excluded of this analysis (n=5) as these data are
not available per school. Some outputs were 100% implemented in all the schools (n=3) and were hence
also excluded for analysis. The remaining 19 PE outputs were used (Table 16). Scores of dose or fidelity

Chapter 5 Process evaluation
87
are often used to identify higher and lower implementer schools (199, 200). As almost no visual
differences were noticed for these PE outputs along the ten intervention schools, the following procedure
was completed: First, each PE element was computed as the average of its corresponding PE outputs
(i.e. dose delivered is the result of the average between classes delivered and classes with the planned
methods and materials used). Second, a total score of implementation was obtained per school by
summing the proportion of the 19 PE outputs per school. Finally, linear regression models were used to
compare the PE elements as well as the total score across the intervention schools. As the PE elements
and the total score did not follow a normal distribution, the variables were log-transformed (natural
logarithm) before inclusion in the models. The coefficients are presented as β% following the same
procedure described in Chapter 2 when log-transformations were applied.
5.4 Results
Chapter 3 presents a description of the adolescents included in the ACTIVITAL intervention. Table
17 contains the characteristics of the teachers, workshop trainers and food-tuck shops managers
participating in the intervention. More females implemented the program (80% of the teachers, 83% of
the food-tuck shops managers and 100% of the workshops trainers). Mean age of the teachers was
40.8±11.3 years, and the mean age of the managers of the food-tuck shops was 43.1±9.9 years. All the
teachers had a university degree while only 18% of the food-tuck shop staff obtained such degree. Food-
tuck shop workshops were principally implemented by culinary specialists and nutritionists.
5.4.1 Recruitment
Schools were invited by an official letter signed by the ACTIVITAL coordinator. Furthermore, a
meeting with the school principals and key school stakeholders (medical doctors, school managers, etc.)
was held to introduce the project. The objectives of the planned intervention activities, their timing and
measurements were discussed in detail. Teacher’s participation was voluntary, external teachers were
hired to perform the classes if the school teachers refused to participate. The 20 (100%) schools
originally contacted all agreed to participate. This participation remained constant until the end of the
intervention. Nine schools expressed a desire to terminate the program at the end of the first stage (four
intervention and five control schools). Several meetings with the principals and school managers were
necessary to maintain the participation of these schools. The reasons to consider terminating the program
were that teachers did not want to implement the classes anymore or the school staff did not want their
students to miss classes because of the measurements.
Parents were invited to the workshops through a letter signed by the school principal two days in
advance. The 10 schools accepted to implement the parental workshops at both stages. Food-tuck shop
staffs were also invited by means of an official letter and a phone call one day in advance. For the food-
tuck shops workshops one school refused to participate. They felt no need to change the offer in the tuck
shops, as they thought it was already healthy.
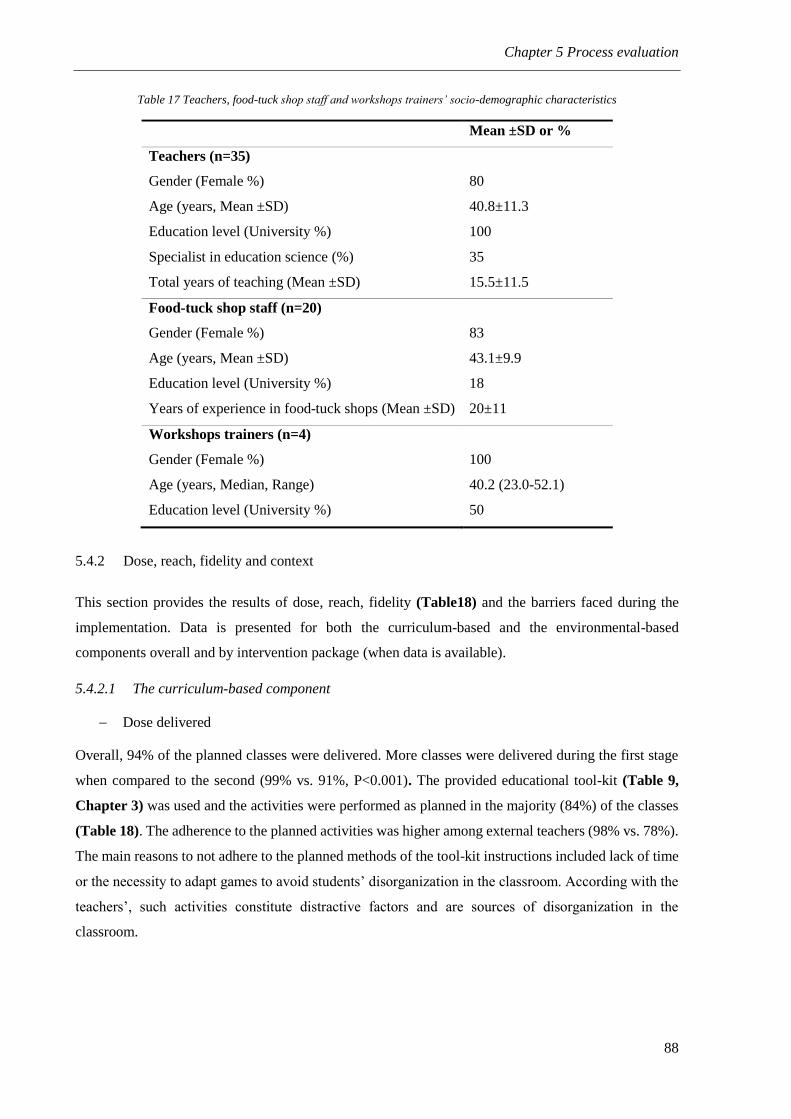
Chapter 5 Process evaluation
88
Table 17 Teachers, food-tuck shop staff and workshops trainers’ socio-demographic characteristics
Mean ±SD or %
Teachers (n=35)
Gender (Female %) 80
Age (years, Mean ±SD) 40.8±11.3
Education level (University %) 100
Specialist in education science (%) 35
Total years of teaching (Mean ±SD) 15.5±11.5
Food-tuck shop staff (n=20)
Gender (Female %) 83
Age (years, Mean ±SD) 43.1±9.9
Education level (University %) 18
Years of experience in food-tuck shops (Mean ±SD) 20±11
Workshops trainers (n=4)
Gender (Female %) 100
Age (years, Median, Range) 40.2 (23.0-52.1)
Education level (University %) 50
5.4.2 Dose, reach, fidelity and context
This section provides the results of dose, reach, fidelity (Table18) and the barriers faced during the
implementation. Data is presented for both the curriculum-based and the environmental-based
components overall and by intervention package (when data is available).
5.4.2.1 The curriculum-based component
Dose delivered
Overall, 94% of the planned classes were delivered. More classes were delivered during the first stage
when compared to the second (99% vs. 91%, P<0.001). The provided educational tool-kit (Table 9,
Chapter 3) was used and the activities were performed as planned in the majority (84%) of the classes
(Table 18). The adherence to the planned activities was higher among external teachers (98% vs. 78%).
The main reasons to not adhere to the planned methods of the tool-kit instructions included lack of time
or the necessity to adapt games to avoid students’ disorganization in the classroom. According with the
teachers’, such activities constitute distractive factors and are sources of disorganization in the
classroom.

Chapter 5 Process evaluation
89
Dose received
Students showed a highly positive attitude in 64% of the classes, more students showed a positive
attitude when school teachers delivered the classes (72% vs. 64%). Teachers were highly motivated in
around 90% of the classes delivered (Table 18). Classes were more or less equally liked by adolescents
at stage one compared with stage two (96 vs 90%, P=0.020) and if school teachers or external teachers
delivered the classes (94% vs. 90%, P=0.354). The adolescents enjoyed more the classes that focused
on active skills learning. All but one teacher (during stage two) stated they liked the classes and the
project in general. They liked the topics and believed the content was excellent and interesting. Teachers
reported not having problems in 68% of the classes delivered (75% at stage one and 63% at stage two,
P=0.005). The percentage of classes without reported problems were similar for school teachers and
external teachers (69% vs. 68%, P=0.772).
Reach
A higher proportion of school teachers implemented the classes themselves in stage one compared to
stage two (70% vs. 31% respectively, P<0.001) (Table 18). Teachers attributed the lower response in
the second stage to the increasing pressure to complete the standard curriculum and to their perception
of contributing substantially during stage one. Since the classes were implemented at schools, all the
targeted students were reached.
Fidelity
Teachers’ explanations during the classes were accurate in almost 91% of the cases and their knowledge
was sufficient in 88% of them. An inadequate planning and lack of teachers’ ability to perform the
classes were the main reasons for an inadequate explanation. Important to note here, is that there was
one particular school in which 70% of the performed classes were inaccurate. Timing was sufficient in
58% of the delivered classes. Many teachers noted that some classes were too long and required more
time to deliver them properly. External teachers were more prone to report sufficient timing compared
with school teachers (70% vs. 53%). The ACTIVITAL staff intervened in approximately 48% of the
classes delivered by school teachers. Half of the interventions occurred during games or group activities.
The other half was to maintain students’ discipline. It is important to point out that the intervention of
the ACTIVITAL staff occurred mainly at stage one since at stage two only two classes per school were
observed by the ACTIVITAL staff and therefore the staff were not always present at stage two.

Chapter 5 Process evaluation
90
Table 18 Results by PE elements and components (excluding the list of problems and reasons)
PE element Output Overall IP11 IP22 P-value3
The curriculum-based component N=655
classes
N=252
classes
N=399
classes
Dose delivered % of classes delivered 94 99 91 <0.001
% of classes with all the planned methods and materials used4 84 - - -
Dose received % of students with a highly positive attitude4 64 - - -
% of classes delivered by motivated teachers4 90 - - -
% of classed enjoyed by adolescents 93 96 90 <0.001
% of classes with absence of problems 68 75 63 0.005
% of satisfied teachers 93 100 89 -
Adolescents rate of the classes/10 (Median and range)5 - 9 (1-10) - -
Reach % of classes delivered by school teachers 46 70 31 <0.001
Fidelity % of classes delivered by teachers with sufficient knowledge4 88 - - -
% of classes with an accurate explanation 4 91 - - -
% of classes with the planned time sufficient4 58 - - -
% of classes in which the staff did not intervene4 52 - - -
The environment-based component
Food-tuck shops workshops N=13 N=10 N=3
Dose delivered % of workshops delivered 100 100 100 -
% of workshops with the planned methods and materials used 100 100 100 -
Dose received % of staff with a positive attitude 100 100 100 -
Attendants rate of the workshops/10 (Median and range)6 - - 10 (8-10) -
Reach % of schools that attended to at least 80% of the workshops 65 70 60 -
Number of food-tuck shops staffs attendants/workshop, Median(Range) 15 (8-23) 16 (11-23) 9 (8-15) -

Chapter 5 Process evaluation
91
PE element Output Overall IP11 IP22 P-value3
Fidelity % of workshops delivered by trainers with sufficient knowledge 100 100 100 -
% of workshops with the planned time sufficient 72 66 100 -
Parental workshops N=60 N=30 N=20
Dose delivered % of workshops delivered 100 100 100 -
% of workshops with thee planned methods and materials used 100 100 100 -
Dose received % of parents with a positive attitude 70 82 63 -
% of parents considered most of the delivered information as new 77 78 71 0.035
% of parents reporting that the workshops fulfilled their concerns 95 96 90 <0.001
Attendants rate of the workshops/10 (Median and range) 9 (2-10) 9 (2-10) 9 (4-10) 0.491
% of parents that qualify the workshop content as very good or excellent 91 89 92 0.076
Reach % of parents reached 15 20 11 -
Number of attendants/workshop, Median(Range) 23 (5-113) 26 (5-113) 21 (6-87) 0.846
Fidelity % of workshops with the planned time sufficient 65 67 64 0.156
1 Intervention package one; 2 Intervention package two; 3Test of proportions applied for quantitative data only, 4Data obtained from the classes structured observations, as all the classes were
observed at intervention package one (N=252) and only two randomly selected classes per school were observed at the intervention package two (N=20) only the overall results are presented; 5Data obtained from the adolescents’ evaluation forms only collected at the intervention package one; 6Data obtained from the food-tuck shops staffs’ evaluation forms only collected at the intervention package two. Bold: P value <0.05

Chapter 5 Process evaluation
92
Context and barriers
We did not succeed in integrating the program into the school curriculum. The main barrier was that
schools are obliged to follow the governmental program coordinated by the National Ministry of
Education. The authorities did not agree with changing the curriculum in ten schools only. Table 19
lists the problems and the possible solutions identified from the structured observations.
Table 19 Barriers during the implementation of the curriculum-based component
Barriers Explanations Suggestions to
overcome the problems
(If available)
Some adolescents show a
negative attitude
Lack of teachers’ ability to keep their students
engaged
NA1
Students forgetting their booklets at home Perform full day sessions
Insufficient time NA1
Indiscipline, difficulties to
maintain the students
organized
External teachers. 49% of the problems for
external teachers were related with indiscipline
and 27% for the school teachers
Include the classes in the
school curriculum
Games and group activities NA1
Insufficient time Very short school hours Perform full day sessions
Inadequate teachers planning Divide the lessons for
different teachers or
subjects
Interruptions or unforeseen school activities such
as meetings, sport matches and talks
Include the classes in the
school curriculum
Difficult to interrupt their own classes Include the classes in the
school curriculum
Some games are too long NA1
Games and group activities
were unwelcome by some
school teachers
Games cause indiscipline among the students;
teachers believed these kinds of activities were
inadequate
NA1
Logistic difficulties Large spreading of participants over the bachelor
grades at stage two (252 grades were involved at
stage one and 399 at stage two).
NA1
1Not applicable. The possible solutions were not available in the PE data
5.4.2.2 The environment-based component
Dose delivered
All the workshops planned with the food-tuck shop staff were delivered in stage one and stage two
(Table 18). All the materials were used as originally planned and all the planned topics were addressed
at both stages (Table 9, Chapter 3). Three issues were repeatedly requested and addressed by the trainer
at stage one: (i) difficulties in understanding the guidelines of the national legislation for food-tuck shops
issued by the Ministry of Public Health (52), (ii) concerns regarding the nutritional quality of street food
vendors outside the school, and, (iii) high interest in new recipes and in sharing their experiences with
others. Additionally, during the last workshop at stage two the staff expressed their desire to establish a
local trade union. The latter was proposed as they felt left out during the design of new policies.
Similar to the food-tuck shop workshops, all parental workshops were delivered as scheduled (100%).
The trainers used all the materials and adhered to the pre-planned topics in both stages.

Chapter 5 Process evaluation
93
Dose received
The food-tuck shop staff was interested and showed a positive attitude in 100% of the delivered
workshops. The staff was highly motivated and participative. Only during stage two, they did not
appreciate the advice to increase vegetable portion sizes. At stage two it was intended to change the
menu planning (Table 9). According to the observations during the last workshop however, none of the
schools reported changes in their menus.
The parents scored the intervention workshops overall at 9/10 (Range 2-10) and 77% of the parents
considered the delivered information as new (78% at stage one and 71% at stage two, P=0.035), and
95% reported that the workshops fulfilled their concerns (96% at stage one and 90% at stage two
P<0.001). Parents were fully interested and motivated in 70% of the delivered workshops. The
motivation however, was higher at stage one compared with stage two (82% vs. 63% respectively, Table
18). Furthermore, 91% of the attendants qualified the delivered content as very good or excellent.
Reach
Seven schools attended at least 80% of the food-tuck shop workshops at stage one and six at stage two
(Table 18). In stage one, the mean number of attendants per workshop was 16 staff (range 11-23), while
in stage two the mean was only 9 (range 8-15). One private school was absent in all the workshops as
the school owner operated the canteen and considered that the nutritional quality was adequate.
Reach of parents was low with only 15% of the invited parents attending the workshops. Once again,
the reach was higher during stage one (20% vs. 11%).
Fidelity
The explanation of the trainer was accurate in 100% of the delivered food-tuck shop workshops. Their
knowledge was considered sufficient and they were able to address the questions. Time was sufficient
in 72% of the food-tuck shop workshops. Lack of time occurred in the following three workshops at
stage one: (i) definition of priorities and problems, (ii) national legislation for food-tuck shops from the
Ministry of Public Health, and (iii) examples of new recipes. Furthermore, we noted a higher reach for
the workshop in which a representative of the Ministry of Public Health was invited. The food-tuck shop
staff had difficulties in understanding the Ministry guidelines. In addition, they were afraid to lose the
admission of the food shops if they do not comply with the rules.
Around 65% of the parents considered that the workshop timing was perfect while 33% believed it was
too short.

Chapter 5 Process evaluation
94
Context and barriers
Table 20 summarizes the barriers for the environment-based component and possible suggestions to
overcome the barriers identified during the structured observations.
Table 20 The environment-based component barriers
Barriers Explanations Suggestions to overcome
the problems (If available)
Food-tuck shops workshops
Staffs skipping the workshops Lack of interest NA1
Lack of support or communication
from the school principal
Inform periodically to the
school principal
Staff reluctant to serve more vegetables,
change their portion sizes and food
combinations
They believe the students will not
eat half a plate of vegetables NA1
Others believed that the suggested
vegetables portion size is
unrealistic
NA1
Presence of street vendors around
the school NA1
Presence of street vendors around the
school
This business functions with
permission of the local city hall
Control the nutritional
quality or re-allocate them
Parental workshops
Poor response Lack of time or laziness NA1
Work overload NA1
Schools do not send the invitations
on time
Improve the communication
with the schools 1Not applicable. The possible solutions were not available in the PE data
Context and environment
Table 21 shows the number of food shops around the intervention schools at baseline and the two
follow-up measurements. No important differences between the intervention and the control schools or
changes were noticed over time. The adolescents had easy access to fast food and processed food sold
in the grocery stores. The fast food restaurants around the schools are small family restaurants or
cafeterias. The majority of the street food vendors sold fast food and ice creams (around 65%).
Table 21 Median number of food stores around the intervention schools during the ACTIVITAL intervention (2009-2012)
Measurement Intervention
group
n (Range)
Control
group
n (Range)
P
value
Fast food
restaurants
Baseline 1 (0-2) 1 (0-3) 0.66
First follow-up 1 (0-2) 1 (0-2) 0.68
Second follow-up 1 (0-5) 1 (0-2) 0.45
Grocery stores Baseline 2 (0-3) 2 (0-3) 0.66
First follow-up 1 (0-3) 2 (0-4) 0.08
Second follow-up 1 (0-2) 1 (0-4) 0.21
Street vendors Baseline 1 (0-2) 1 (0-4) 0.51
First follow-up 1 (0-2) 1 (0-2) 0.06
Second follow-up 1 (0-2) 1 (0-3) 0.54
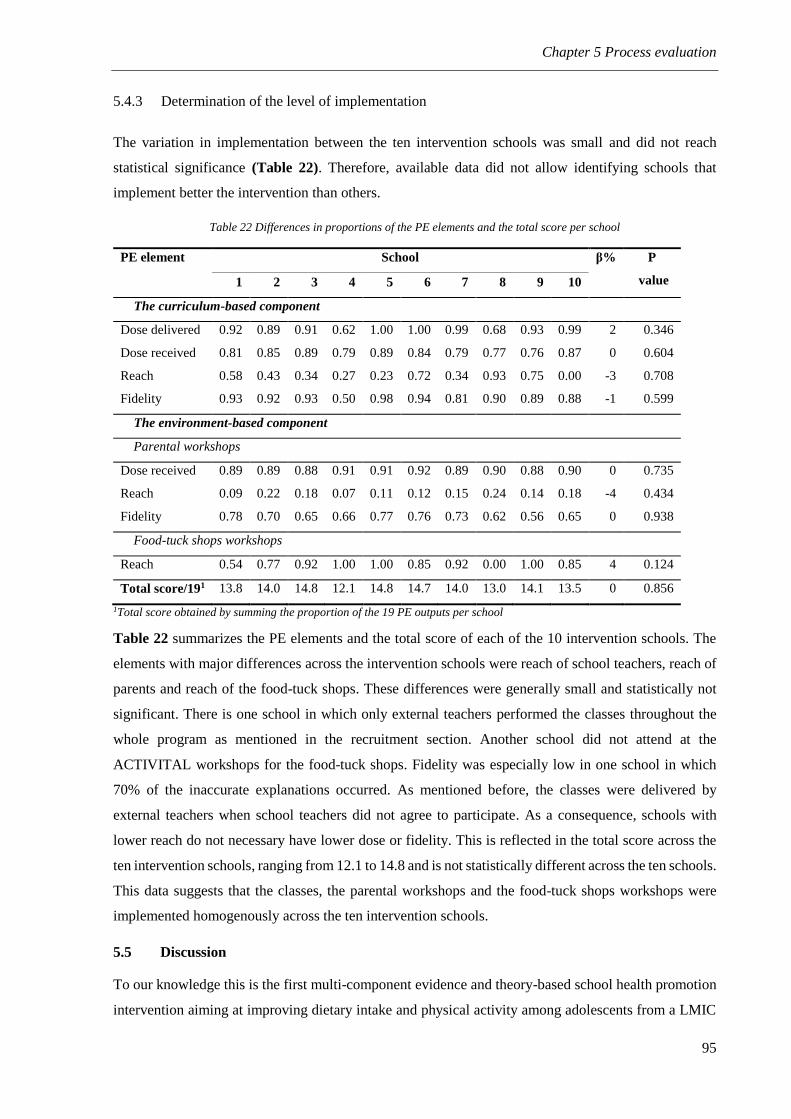
Chapter 5 Process evaluation
95
5.4.3 Determination of the level of implementation
The variation in implementation between the ten intervention schools was small and did not reach
statistical significance (Table 22). Therefore, available data did not allow identifying schools that
implement better the intervention than others.
Table 22 Differences in proportions of the PE elements and the total score per school
PE element School β%
P
value 1 2 3 4 5 6 7 8 9 10
The curriculum-based component
Dose delivered 0.92 0.89 0.91 0.62 1.00 1.00 0.99 0.68 0.93 0.99 2 0.346
Dose received 0.81 0.85 0.89 0.79 0.89 0.84 0.79 0.77 0.76 0.87 0 0.604
Reach 0.58 0.43 0.34 0.27 0.23 0.72 0.34 0.93 0.75 0.00 -3 0.708
Fidelity 0.93 0.92 0.93 0.50 0.98 0.94 0.81 0.90 0.89 0.88 -1 0.599
The environment-based component
Parental workshops
Dose received 0.89 0.89 0.88 0.91 0.91 0.92 0.89 0.90 0.88 0.90 0 0.735
Reach 0.09 0.22 0.18 0.07 0.11 0.12 0.15 0.24 0.14 0.18 -4 0.434
Fidelity 0.78 0.70 0.65 0.66 0.77 0.76 0.73 0.62 0.56 0.65 0 0.938
Food-tuck shops workshops
Reach 0.54 0.77 0.92 1.00 1.00 0.85 0.92 0.00 1.00 0.85 4 0.124
Total score/191 13.8 14.0 14.8 12.1 14.8 14.7 14.0 13.0 14.1 13.5 0 0.856
1Total score obtained by summing the proportion of the 19 PE outputs per school
Table 22 summarizes the PE elements and the total score of each of the 10 intervention schools. The
elements with major differences across the intervention schools were reach of school teachers, reach of
parents and reach of the food-tuck shops. These differences were generally small and statistically not
significant. There is one school in which only external teachers performed the classes throughout the
whole program as mentioned in the recruitment section. Another school did not attend at the
ACTIVITAL workshops for the food-tuck shops. Fidelity was especially low in one school in which
70% of the inaccurate explanations occurred. As mentioned before, the classes were delivered by
external teachers when school teachers did not agree to participate. As a consequence, schools with
lower reach do not necessary have lower dose or fidelity. This is reflected in the total score across the
ten intervention schools, ranging from 12.1 to 14.8 and is not statistically different across the ten schools.
This data suggests that the classes, the parental workshops and the food-tuck shops workshops were
implemented homogenously across the ten intervention schools.
5.5 Discussion
To our knowledge this is the first multi-component evidence and theory-based school health promotion
intervention aiming at improving dietary intake and physical activity among adolescents from a LMIC

Chapter 5 Process evaluation
96
and including a comprehensive PE. This chapter evaluates only the dietary component of the
intervention. Overall the program was well implemented and received by the intervention audiences
with good dose, fidelity and reach (except for parental reach). The program has been homogenously
implemented across the intervention schools. The results presented in this chapter offer opportunities
and barriers to implement the program in real practice and in similar settings.
ACTIVITAL and the content of the educational tool-kit were well received by teachers and students.
Teachers believed that the program was appropriate, excellent and necessary. Nevertheless some issues
clearly arose from the PE and should be considered. The most important difficulty was the inclusion of
the program in the school curriculum. This triggered a majority of other problems in the classes such as:
low response of teachers (mainly at stage two), lack of time to implement the classes, the high
involvement of the ACTIVITAL staff and the inclusion of external teachers when school teachers did
not agree to implement the classes. Although the research team tried very hard to enable inclusion in the
curriculum, it was not accepted by the government. Changing the curriculum among ten schools only
was not feasible as the Central Ministry of Education is the only entity with enough authority to make
any minor change in the schools’ curriculums. Previous studies have reported the importance of
including these kind of programs in the school curriculum (45, 177) to enhance sustainability (177).
Some school teachers needed extra help or did not perform some games and group activities as planned
in the educational tool-kit. Nevertheless, these activities were highly enjoyed by adolescents. External
teachers were more likely to adhere to the planned activities and reported more frequently sufficient
time to perform the classes. Therefore including the classes in the school curriculum will probably result
in a better adherence to the planned methods and may enhance a better implementation as timing would
no longer represent a problem. Future studies including participatory activities within educational tool-
kits must be attached to the school curriculum and possibly should include peer leaders to improve
fidelity (201).
The parental workshops were well received and enjoyed by the attendants, they considered that the
delivered information was high quality and new. Yet the parental reach was considerably low. A
systematic review of the most effective strategies targeting parents for improving dietary intake among
adolescents living in HICS, showed that direct methods such as nutritional education sessions or family
behavior counseling are among the most effective strategies (202). However, there is an important lack
of information for LMICs in this regard. The results of our PE show that the nutritional education
sessions were highly enjoyed and our intervention resulted in positive effects, but an important share of
the invited parents did not attend. In order to enable a most intensive effect by improving parental reach,
future studies should identify most effective strategies to involve parents in diet oriented health
promotion programs implemented in LMICs. For example, qualitative analysis of the views of parents
regarding strategies to promote children healthy eating in HICs concluded that health promotion

Chapter 5 Process evaluation
97
strategies should include interactive and practical activities performed together with their children such
as the preparation of healthy breakfast or healthy recipes (203). These activities were also highly enjoyed
by adolescents and food-tuck shop staff in the ACTIVITAL program as well. In our particular setting,
the results of the needs assessment showed that parents believed that their children’s eating behavior is
the consequence of their own preferences and the environment. They did however, not recognize their
responsibility in their children’s eating behavior (68), possibly associated with a poor interest in
attending school workshops. This suggests that future programs should find ways to improve parents
understanding of their role in their children´s eating behavior. In any case, previous reports have
documented the difficulty of reaching parents even after adapting interventions to their requirements.
For example the program UP4FUN designed its strategies based on focus groups in order to identify the
strategies that best engage parents’ participation, still, the parental reach was low (204). The last research
suggests that there is still insufficient evidence on how to engage and reach parents with these kind of
programs. This finding stresses the importance of targeting different domains, such as the food
environment, the food system and behavior-change (205).
Attendants of the food-tuck shops workshops enjoyed the meetings and always expressed feeling
comfortable with the program. We accomplished a significant decrease of 15% in the amount of
processed food consumers in the intervention schools during the first stage. This may indicate that the
delivery of workshops within a multicomponent school intervention can have some effect on
adolescents’ food choices. Although the program was well accepted and enjoyed, the staffs were
reluctant to change the portion sizes and recipes served significantly. In order to achieve better effects,
small and gradual changes in portion sizes are advised to enable a correct adaptation of the audiences to
the proposed changes. During the IM and the CPPE, a school food policy was identified as a possible
intervention strategy (76), however, it was not feasible as the food shops are privately owned and
regulated only by the Ministries of Education and Health. This suggests that the Ministry should
implement new school food policies that focuses on improving the nutritional quality and the portion
sizes of the food served at schools. In that sense, our data offers the opportunity of evaluating not only
the ACTIVITAL trial but also de local food system at schools and the legislation implemented by the
Ministry of Health. Clearly, the staff was interested in implementing the Ministry program at first sight,
but the regulation is limited and probably not adequately designed and evaluated. For example,
adolescents still report processed food consumption during snacks. The legislation is not dealing with
the existence of street vendors outside the schools which can play a role in adolescents’ food
consumption and purchases (206) and according with the staffs is a reason for the resistance to improve
portion sizes and recipes. The Ministry guideline is difficult to understand and should be designed by
means of formative research including the point of view of the school staff. A continuous evaluation of
the implementation process would enable the government to perform corrections and to control the
fulfillment of the rules as the staff expressed their fear to lose their business if they not comply with the

Chapter 5 Process evaluation
98
rules. In that sense the government would be able to accomplish the needed changes in portion sizes and
the improvements of the nutritional quality of the recipes prepared in the school food shops.
As in the effect evaluation, this PE shows that the program was better implemented at stage one. At
stage one: (i) all the schools agreed to participate without any questioning, (ii) more school teachers
implemented the program voluntarily, (iii) more parents and staff attended the workshops, (iv) the
teachers reported less problems and were more satisfied with the classes, and (iv) a higher proportion of
the parents showed a positive attitude during the workshops. The lower acceptance at stage two possible
could reflect a negative attitude of the involved audiences towards the program, probably related with
the voluntary participation of the teachers or with the long term duration of the intervention.
The decrease in the effect in our trial is higher than those reported previously (182). Previous studies
have shown how similar differences lead to lower intervention effects. For example, the TEENS study
reported how the presence of peer leaders supporting the teaching sessions was related to an
improvement in fruit and vegetables intake which disappeared when there was no additional help (201).
Additionally, the same study concluded that the performance of a formative assessment with an active
participation of the food-tuck shops staff allows to adapt the program according to important influential
factors (207). A more intensive coverage of the interventions has been linked with increased fruit intake
(166). Additionally, others have identified pressure on the school curriculum and lack of parental support
as barriers to obesity school prevention (208). The ACTIVITAL trial allows evaluating both the efficacy
and effectiveness of the program: higher effects were found when activities were more controlled.
Nevertheless, the fact that our effect was maintained after 28 months suggests that an initial intensive
preparatory phase can result in sustained effects one year later. Future studies should evaluate the
effectiveness of ACTIVITAL in a less controlled setting, with less intervention of the program staff and
attaching the program to the school curriculum.
We intended to perform an analysis of the intervention effect according to the degree of implementation.
The data indicated that the implementation of the intervention components was more or less
homogenous across the ten intervention schools. This result can be evaluated from two different
perspectives. On the one hand, it seems that adolescents and parents in all the intervention schools were
similarly exposed to the classes and workshops and therefore the beneficial effect can be generalized.
On the other hand, the large involvement of the ACTIVITAL staff seems to be responsible of the
homogenous implementation.
5.6 Limitations
This analysis has a number of limitations. The adolescents and food-tuck shops evaluation forms were
not administrated at both stages. The program was not attached to the school curriculum, an issue related
with the majority of the difficulties encountered during the implementation of the educational tool-kit.
Objective measurements of the food prepared and served at the food-tuck shops throughout the

Chapter 5 Process evaluation
99
intervention were not performed. Only at stage two a la carte recipes prepared in the food-tuck shops
were measured before and after the workshops. These data demonstrated that in fact, neither the portion
sizes or the nutritional quality improved comparing the pre and post measurements (209). The
environment of the participating schools still needs to be evaluated and improved in order to achieve the
full potential of the program. Most of the data was collected only in the intervention schools, this
hampers the possibility to be aware about possible strategies implemented among the control schools.
Some evaluation forms were not collected at both stages preventive a more exhaustive comparison of
the implementation between stage one and two.
5.7 Conclusion
In general, the ACTIVITAL intervention was well implemented, the content was considered excellent
and it was well received by the target population. Future programs should incorporate the activities in
the school curriculum, invest in continuous communication with stakeholders and establish stronger
relationships with the government in order to accomplish better changes in the school environment and
outside the school.

100

101
6 General discussion

102
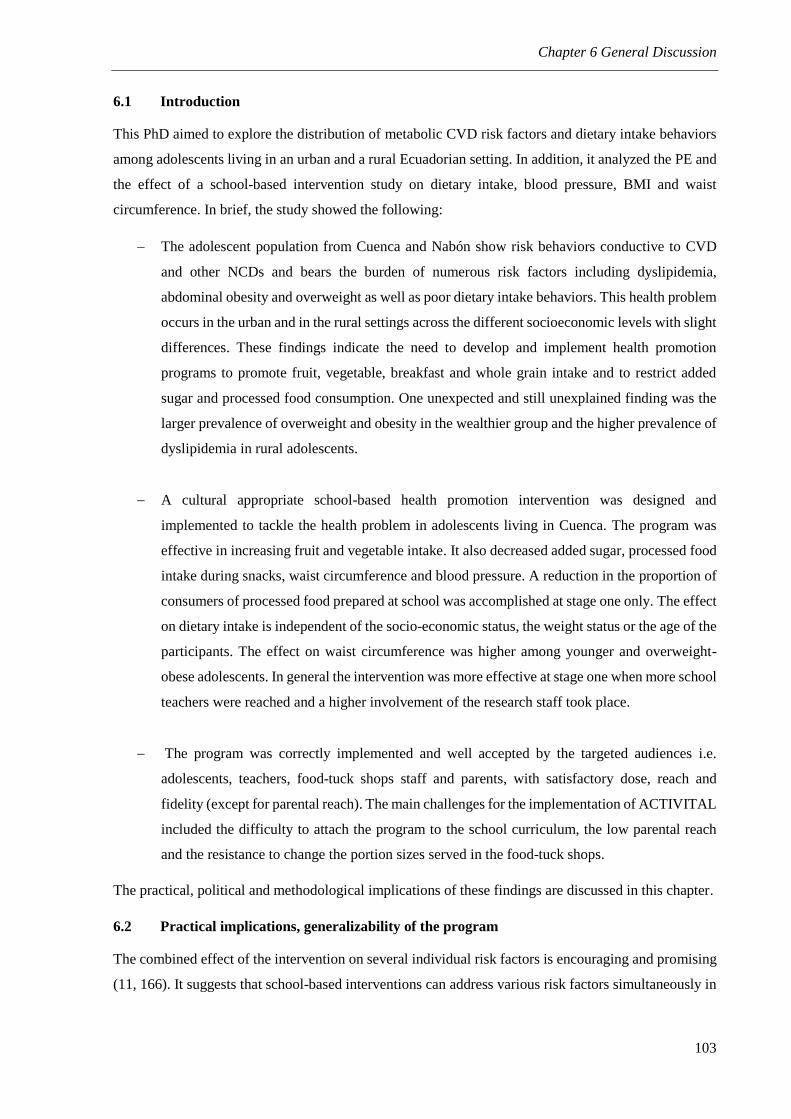
Chapter 6 General Discussion
103
6.1 Introduction
This PhD aimed to explore the distribution of metabolic CVD risk factors and dietary intake behaviors
among adolescents living in an urban and a rural Ecuadorian setting. In addition, it analyzed the PE and
the effect of a school-based intervention study on dietary intake, blood pressure, BMI and waist
circumference. In brief, the study showed the following:
The adolescent population from Cuenca and Nabón show risk behaviors conductive to CVD
and other NCDs and bears the burden of numerous risk factors including dyslipidemia,
abdominal obesity and overweight as well as poor dietary intake behaviors. This health problem
occurs in the urban and in the rural settings across the different socioeconomic levels with slight
differences. These findings indicate the need to develop and implement health promotion
programs to promote fruit, vegetable, breakfast and whole grain intake and to restrict added
sugar and processed food consumption. One unexpected and still unexplained finding was the
larger prevalence of overweight and obesity in the wealthier group and the higher prevalence of
dyslipidemia in rural adolescents.
A cultural appropriate school-based health promotion intervention was designed and
implemented to tackle the health problem in adolescents living in Cuenca. The program was
effective in increasing fruit and vegetable intake. It also decreased added sugar, processed food
intake during snacks, waist circumference and blood pressure. A reduction in the proportion of
consumers of processed food prepared at school was accomplished at stage one only. The effect
on dietary intake is independent of the socio-economic status, the weight status or the age of the
participants. The effect on waist circumference was higher among younger and overweight-
obese adolescents. In general the intervention was more effective at stage one when more school
teachers were reached and a higher involvement of the research staff took place.
The program was correctly implemented and well accepted by the targeted audiences i.e.
adolescents, teachers, food-tuck shops staff and parents, with satisfactory dose, reach and
fidelity (except for parental reach). The main challenges for the implementation of ACTIVITAL
included the difficulty to attach the program to the school curriculum, the low parental reach
and the resistance to change the portion sizes served in the food-tuck shops.
The practical, political and methodological implications of these findings are discussed in this chapter.
6.2 Practical implications, generalizability of the program
The combined effect of the intervention on several individual risk factors is encouraging and promising
(11, 166). It suggests that school-based interventions can address various risk factors simultaneously in

Chapter 6 General Discussion
104
adolescents from LMICs. The main practical question to answer at this point is how to scale it up. Cluster
RCTs should have both internal and external validity to enable generalizability (210).
6.2.1 Internal validity
Internal validity relies on sample sizes, data analyzes and blinding (211, 212). ACTIVITALs’ Internal
validity was fairly acceptable. Although our sample size retained for analysis was smaller than expected,
analysis of missing values did not provide different results. The differences between the dropouts and
the sample retained for analysis were small. Furthermore, the key issue in loss of observations is the
likelihood of not detecting an intervention effect (210). Consistent differences between groups were
detected, the cluster nature of the study was considered in both the sample size calculations and data
analyzes. Participants in the intervention and the control group were selected at random and we ensured
blinding among the field workers during outcome measurements as much as possible. Internal validity
of the study is therefore considered adequate.
6.2.2 External validity
Several authors have stressed the importance to perform detailed PE of health promotion programs in
order to assess external validity and generalizability of RCTs (213, 214). This is especially important
for complex cluster RCTs (215). External validity could be estimated by the adoption, the
implementation and the maintenance of the programs (211, 212).
6.2.2.1 Adoption
Adoption refers to the extent to which the setting is representative of the wider population (210, 212).
In that sense, the findings of ACTIVITAL are only applicable to the urban areas. The program maybe
not effective among rural adolescents as financial concerns are important determinants of healthy eating
and physical activity risk in the rural area (68, 69). At this point a question that remains unanswered is
whether or not the ACTIVITAL program can be implemented in all the urban schools at national level.
During the selection of clusters, some schools were not considered for randomization in the pair-
matching process because they either had very few students or an unavailable matching pair (mainly
because of differences in the school gender). This selection however, may not have affected
generalizability of the results as in recent years the Ecuadorian school system was reformed. Currently,
all the schools became co-ed. In addition, an important share of the small schools as well as all the
schools without 8th-10th basic education grades and 1st-3rd high school grades in the same campus have
stopped functioning. In addition, all the clusters originally contacted agreed to participate and the
subgroup analysis showed that the program effect is independent of the UBN of the participants
indicating that the research is representative for the urban setting. The last could be an indication that
the minor differences in influential factors by socio-economic status were correctly addressed.

Chapter 6 General Discussion
105
Next, it is important to consider if the research setting is representative for other urban areas in the
country. There are reasons to believe that the dietary habits could vary across the Ecuadorian geographic
regions. An analysis of the causes of death by region found lower mortality rates secondary to CVD in
provinces located in the Amazon rainforest compared with provinces in the other regions (216).
Furthermore, Ecuador is the country with the highest diversity of vegetables per square meter and one
of the most biodiverse country in natural resources and cultural attributes (128). Certainly, we cannot
conclude if the dietary profile is different or not across the Ecuadorian geographic regions with the
available data. National representative data was collected from 2011-2013 by the Ministry of Public
Health (40). Analysis of this data is undergoing during write-up of this document. The findings of the
national survey will provide a detailed description of the dietary profile of the wider national population
across its geographical regions and by age groups. Currently such information is unavailable making it
difficult to identify differences in dietary behavior across the whole country. Anyhow, coming back to
the ACTIVITAL adoption in other urban areas, previous reports recommend to implement complex
interventions in different settings to assess its wider effectiveness (214).
6.2.2.2 Implementation
Implementation of the program was described in Chapter 5. The program was well implemented and
received by the targeted audiences with adequate dose, reach and fidelity. Nevertheless, some barriers
that can prevent generalizability should be addressed before scaling-up the program. This section
analyzes these barriers and proposes ways to address them before scaling-up ACTIVITAL at the national
level.
The most important issues that compromise the generalizability of the ACTIVITAL trial are the
difficulty to integrate the program to the school curriculum and the voluntary teachers’ participation.
Although the ACTIVITAL staff was trained and asked to interfere as little as possible during the classes,
the staff was eagerly involved during the classes. As the participation of the teachers was voluntary,
they felt uncomfortable when the project staff did not assist during the classes. Strong contacts and
partnerships must be established with the Ministry of Education as this is the only entity with sufficient
authority to change the curriculum in schools with regard to health promotion programs. Future
programs aiming health promotion in schools must not be implemented until such partnerships are
strongly established to enhance sustainability. This can probably be accomplished by designing and
implementing joint programs between the government and the academia.
Other important barrier identified during the PE was the difficulty to change portion sizes and nutritional
quality of the food served at the school food-tuck shops. Our analysis showed the importance of
performing formative research to adapt the programs to the needs and context of the food-tuck shops
staff as well as their willingness to participate in health promotion programs organized by the Ministries
in order to maintain their business.

Chapter 6 General Discussion
106
Therefore, before implementing ACTIVITAL at the national level, partnerships with both the Ministry
of Education and Health are needed. The available law and guidelines issued by the Ministries of
Education and Health for the food-tuck shops must be revised and propose gradual and easy to apply
changes to the content and portion sizes of the foods offered. As our analysis only involved local
stakeholder research should further investigate the role and views of all the stakeholders involved such
as the government, the health sector, the food industry, the schools staff, food-tuck shops managers,
researchers and the media towards the guidelines and policy proposed. These may help to achieve better
results, to understand and solve possible conflicts of interest (48) as well as to identify the most feasible
alternatives. Finally, a continuous monitoring of evaluation of the fulfillment of the rules and guidelines
is strongly advised.
Family and parents are highly important for health promotion programs aiming children and adolescents
(202, 217). The parental reach in the ACTIVITAL trial was low. The communication with schools was
crucial to notify parents on time for meetings and activities. Still, the intervention provides limited data
on how to improve parental involvement in health promotion programs. New research is needed in order
to identify better ways to reach parents and families in health promotion programs aiming improvements
in dietary intake among adolescents in the research area. In addition, the proposed activities should be
combined with interventions in other settings as previous reports indicate that reaching parents remain
challenging.
The implementation data shows the importance of street vendors and fast food stores in the school
surroundings. Currently, there is no evidence of the real impact of these stores on children and
adolescents eating behavior. An evaluation of the actual influence of food outlets near the school on
children’s food consumption and purchases must be performed in order to identify the actual exposure
along adolescents journey (206). These data will enable the design of an integral health promotion
program that takes into consideration all the possible determinants related with the health problem
(NCDs risk).
6.2.2.3 Maintenance
ACTIVITAL was a relatively long term intervention, implemented along three consecutive academic
years. An effect was maintained after 28 months of implementation suggesting a sustained effect.
Nonetheless, without attaching the program to the school curriculum and establishing partnerships with
key Ministries maintenance of the program at large scale will be seriously compromised. Evidently,
such programs cannot depend on the voluntary work of teachers and schools.
6.2.3 ACTIVITAL scaling-up
We already know that ACTIVITAL improved several outcomes, it did not lead to harmful effects and
was highly accepted by the involved audiences. When scaling up, no implementation in other urban
Chapter 6 General Discussion
107
schools would hence be unethical (218). Based on the analysis of the internal and external validity of
the ACTIVITAL trial, the following approach should be performed in order to implement the program
at national level.
As interventions are usually costly, possible disagreements between policy makers and researchers must
be resolved before the development or implementation of new interventions and/or policies, instead the
program should be designed and implemented by both the government and researchers. Education and
activities to increase motivation of policy makers might be required though (218, 219). In that way, new
evidence will be generated and guide the evaluation of policy implementation (218).
To enable this, a parallel group RCT can be implemented across the different Ecuadorian regions. This
would allow a proper implementation and evaluation of the program effectiveness within a new running
policy. The new program must be streamlined in the school curriculum. Available data suggests that a
higher effect was accomplished during the first stage when the ACTIVITAL staff was more involved in
the implementation process. In order to clarify if the higher involvement of the research staff is a cause
of the larger effect, a group of schools would be allocated to one treatment group not receiving any
support from the research staff rather than training and explanation of the planned activities. Meanwhile,
a second treatment group would obtain continuous involvement of the research staff (like in
ACTIVITAL at stage one). At the same time, a cost-effectiveness study and an extensive PE to assess
the degree of application and acceptance of the proposed strategies by the target audiences should be
performed. Only in that way, following issues will be addressed: (i) is the program effective under real
and “uncontrolled” conditions? (ii) Is it cost-effective to allocate the budget at the national level? Lastly,
(iii) Do differences in regions interfere with the program effectiveness? In addition monitoring of the
participants involved in programs and policies must be sustained in order to determine the contribution
of the interventions to the incidence of related diseases (214).
6.3 Policy implications and the broader policy context
The findings of this research are analyzed in relation with the existing policies since ACTIVITAL was
designed and implement.
6.3.1 Government strategies aiming adolescents NCDs risk
As described in Chapter 1, the main focus of the Ecuadorian Ministry of Public Health was previously
on children undernutrition. The development of policies aiming to prevent NCDs in children and
adolescents has barely started. The results presented in the current work, show how Ecuadorian
adolescents are consuming an unhealthy diet, suffering the burden of CVD risk factors and being
exposed to unhealthy food at home, at schools and outside the schools. Policies targeting this at risk
group should be designed and implemented at the national level.

Chapter 6 General Discussion
108
Currently, the strategy with food-tuck shops is the only national policy aiming the determinants of NCDs
risk factors among children and adolescents. Common to many programs implemented in LMICs and
South America (48), rigorous research to evaluate the effectiveness and implementation process of this
program is unavailable (170). This hampers the possibility to: (i) understand the key stakeholders points
of view and degree of involvement in the design and implementation of such programs (ii) perform an
effect evaluation, and, (iii) identify the barriers, strengths and weaknesses in the whole implementation
process. Data on the effect and the implementation process of the policy would allow the identification
of most effective and relevant strategies for the target population, enabling the allocation of the public
budgets to the most effective strategies. Furthermore, implementing the nutritional guidelines alone is
probably not to the most effective. Instead, comprehensive policies combined with wider stakeholder
and family involvement are more likely to be effective than isolated policies (220). Highlighting the
importance to integrate such strategies with more comprehensive health promotion programs like
ACTIVITAL.
6.3.2 Government strategies addressing NCDs risk in the general population
After ACTIVITAL was implemented, the Ecuadorian government started actions to tackle obesity and
NCDs among the general population. New data are currently available, new strategies were executed
and other are in process. ACTIVITAL already showed that designing public health programs result in
important effects and enable the identification of the influential factors related with NCDs risk in
adolescents.
6.3.2.1 Front traffic light labeling
On November 15th 2013 the Ministry of Public Health issued a national law to implement a front traffic
lights food label system since November 29th 2014 (221). This system applies for all the pre-packaged
processed food items containing artificially added fat, sugar or salt produced nationally or internationally
and sold in Ecuador. In summary, the front labels classify processed food in low medium or high content
of total fat, sugars and salt as described in Table 23. Advertisements are also regulated. The promotion
of unsubstantiated health claims and use of images of health professionals, children, adolescents or
celebrities in products with amber or red label are forbidden. Previous studies have already described
how the application of a front traffic light system increases the understanding and interpretation of the
nutritional quality of selected food items (222). Still, studies show that even though the population is
able to recognize easily the nutritional quality of the food, they persist in old purchasing habits (222).
Research performed in HICs also demonstrates that combining this national strategies with
improvements in knowledge constitute cost-effective strategies against NCDs (223). This underlines the
importance to combine these policies with the ACTIVITAL strategies in order to achieve better effects
as the school program implemented alone was already effective in decreasing processed food intake

Chapter 6 General Discussion
109
during snacks. Furthermore, the message to reduce fat intake should come together with health education
about the increased consumption of other healthy foods (11).
6.3.2.2 “Junk food” taxation
The government has proposed taxation on “junk food” (224). Available data, mainly from HICs,
demonstrates that fast food taxation can be especially beneficial for children and adolescents (225). Our
school intervention succeeded in decreasing processed food intake (including fast food) during snacks.
The revenues of these taxes can be used to implement our program in a large scale as described in
previous paragraphs. Hence, combining our strategies with fast food taxation may result in important
benefices among the adolescents population (223, 225). As mentioned before, new policies should be
issued based on a deeper understanding of the different stakeholders points of view, and its effectiveness
should be proved before investing the budgets in a large scale. Our findings indicate how implementing
the “junk food” taxation can be challenging, as there is a large range of street vendors and small family
restaurants and cafeterias offering fast food (Chapter 5).
Table 23 Total fat, sugar and salt classification defined by the Ecuadorian Ministry of Public Health for food labels
Low content
(Green label)
Medium content
(Amber label)
High content
(Red label)
Total fat ≤3g/100g >3g and <20g /100g ≥20g/100g
≤1.5g/100mL >1.5g and <10g/100mL ≥10g/100mL
Sugar ≤5g/100g >5g and <15g /100g ≥15g/100g
≤2.5g/100mL >2.5g and <7.5g/100mL ≥7.5g/100mL
Salt ≤0.3g/100g >0.3g and <1.5g/100g ≥1.5g/100g
≤0.3/100mL >0.3g and <1.5g/100mL ≥1.5g/100mL
Source: “Reglamento sanitaria de etiquetado de alimentos procesados para el consumo humano”. Ministerio de Salud Pública
del Ecuador
6.4 Methodological implications
6.4.1 Methodology of the ACTIVITAL intervention
Previous analysis have highlighted the deficiencies with regard to a clear documentation of the
recruitment procedures of both individuals and clusters, a detailed description of the implementation
and the application of appropriate analysis of complex cluster RCTs (210, 214). These methodological
shortcomings are predominant in research from LMICs (45). This research shows that an intervention
designed using a systematic approach, addressing several risk factors and applying relatively simple
strategies can be effective among adolescents living in an upper-middle-income country. Furthermore,
such effect was maintained after 28 months of implementation. These results emphasized the importance
of design and implement similar programs in other LMICs.
Chapter 6 General Discussion
110
6.4.2 The CPPE in the design of the intervention
The intervention presented in this thesis is innovative in applying the IM together with the CPPE for
developing the intervention objectives and strategies. The experience shows how the CPPE is a useful
tool for the identification of feasible, relevant and appropriate objectives and strategies. For example,
during the needs assessment, changing the school polices were identified as important strategies, but
after the CPPE workshops the research team decided not to target school policies as they are established
at national level by the Ministry of Health. This procedure allowed the definition of appropriate
strategies by using available resources and identifying possible barriers. Nonetheless, it is not possible
to conclude if the inclusion of the CPPE has a real impact in the intervention effect. Specific research
would be needed to compare the effects of interventions with and without the application of the CPPE.
6.4.3 Understanding the effect
Beyond the objectives of this thesis, the data presented does not consider the mechanisms throughout
the effect was accomplished. Future analysis will be performed to identify these underlying effective or
ineffective mechanisms. With this propose, data on the healthy eating and physical activity influential
factors used to design the intervention (Chapter 1) (76) were collected at baseline as well as at the two
follow-up periods. A mediation analysis of these data will provide important evidence for future
interventions in LMICs as well as for policy makers. Specifically, this data will enable the identification
of the effective and ineffective ACTIVITAL intervention components for scaling-up or designing future
intervention programs in similar settings. The last is another strength of the ACTIVITAL trial as such
evidence from LMICs is currently limited (176).
The available data suggests that the differences by socio-economic status are not really influencing the
risk factors, its determinants or the intervention effect as: differences in metabolic risk factors and
dietary intake by UBN were small, differences in the determinants by socio-economic status were few
and the intervention effect was independent of the UBN of the participants. Nonetheless, the mediation
analysis will also provide more information in this regard. For example, such analysis of the level of
satisfaction by UBN, age groups or BMI categories will help to understand the mechanisms of the
existence or inexistence of a differential effect and again will provide important information for policy
makers and future school-based health promotion interventions.
6.4.4 Problems encountered that should be considered in future research
Ecuador is a biodiverse country with 13 ethnic groups highly different in language, believes and customs
(226). During the needs assessment (Chapter 1) a kichwa group from Shiña-Nabón was included in the
sample (227). The researchers faced difficulties with this community as they did not speak the language
and were not familiar with these communities. Previous research performed with Australian indigenous
have reported similar barriers such as questioning the benefits of research, and showing cautions to

Chapter 6 General Discussion
111
western researchers (228). Before setting surveys or health promotion research programs in rural areas
with wide indigenous populations, important stakeholders of the community must be included in the
research team, this will minimize sources of bias and would enhance a better understanding of the
determinants of health as well as would decrease burden (228).
During ACTIVITAL, several measurements were performed along three consecutive school years.
Some of the data collection tools such as the 24-hour recall and the physical fitness measurements were
time consuming and constitute one of the reasons because several schools considered stopping the
program at the end of the first stage. To avoid this, future research should validate and apply other
methods such as a food frequency questionnaire or reduce the number of outcomes.
When time series data is collected in schools, the percentage of students changing or abandoning the
schools reported in this research should be considered for sample size calculations. This will assure the
maintenance of a representative sample size enhancing more powerful results. Besides, when waist
circumference is included within the outcomes for similar health promotion programs, the age of the
participants as well as the weight status should be considered for sample size calculations.
During the implementation of the health promotion program, the research team experienced some
problems in attaching strictly to an intervention plan. The research staff had to adapt the activities to the
availability and willingness of the school staff. Still, even if the staff was motivated and interested, they
often forgot about the planned activities. These situations should be considered in future programs
implemented among LMICs
6.5 Future research
The ACTIVITAL program provides new evidence for the development and implementation of health
promotion programs aiming at NCDs risk among adolescents from LMICs. Nevertheless, some
limitations should be addressed in future research. In addition to some research already proposed in
previous paragraphs, the following studies are proposed:
Future studies should address the CVD risk among adolescents in the rural areas. Reasons for
the larger dyslipidemia prevalence must be investigated. Furthermore, strategies to prevent
NCDs burden in the rural population are needed. A deeper understanding of the determinants
and the magnitude and repercussions of the financial concerns expressed during the needs
assessment are mandatory to enable the design of culturally appropriate and effective
intervention programs.
The sodium intake reported in the needs assessment was considerably high. Future studies
should investigate the actual sodium intake applying more accurate methods (137). Considering
that high sodium intake has been largely correlated with hypertension (121), high blood pressure

Chapter 6 General Discussion
112
is one of the major CVD risk factors worldwide (11) and hypertensive diseases are within the
five leading causes of death in the Ecuadorian population (38). Preventive strategies aiming to
reduce sodium intake must be designed and implemented.
An updated and complete food composition Ecuadorian table is needed. This will allow an
accurate assessment of the population dietary intake. The database should include sufficient data
on fiber, sodium, added sugar and saturated fat as such data is often unavailable in food
composition tables from the neighboring countries as well. Lack of this data is an important
barrier to identify risk behaviors and populations at risk for NCDs (48, 151).
Furthermore, Ecuador is one of the countries with higher biodiversity worldwide (128). Our
findings shows that white rice is the main carbohydrate source providing in itself 25% of the
daily energy. Only few other food items contributed significantly to the daily energy intake.
Identification and analysis of the nutritional content of the available edible species should be
performed (229). This information will enable a greater use of the local diversity enhancing
more balanced and diverse diets (229) and can be used for the development of more sustainable
dietary diversity interventions (229).
Oilseeds were also scarcely consumed by our group of Ecuadorian adolescents. Prospective data
suggest that the risk of coronary heart disease death is 8.3% lower per each 30g of nuts
consumed weekly (130). Future studies should determine the possibility to increase the
production and promotion of the intake of locally produced and underused oilseeds products
such as “zambo” seeds.
A wider stakeholder analysis including all the stakeholders related with the health problem at
national level will help to identify more effective and acceptable policies to tackle the burden
of NCDs in the whole Ecuadorian adolescent population. Such analysis will account for the
views of the different key persons related with NCDs and will enable the identification of
feasible, acceptable and relevant strategies and policies.
Country differences can affect the program generalizability (230). Future interventions
performed among adolescents living in LMICs should design and implement evidence and
theory based intervention programs in order to determine differences across neighboring
countries.
Future studies should involve other important age groups such as younger children

Chapter 6 General Discussion
113
6.6 Final conclusions
ACTIVITAL was effective in improving several risk factors conductive to NCDs, and provides new and
important evidence for LMICs. But certainly, this is not the only strategy to resolve the increasing NCD
burden in the research area. As described previously, school based interventions are not the only route
through which NCDs risk factors should be tackled (43). Although some improvements have occurred
in the recent years at the national level (231, 232), more actions targeting the Ecuadorian adolescents’
population are needed. Such actions should be multidisciplinary, comprehensive and designed using the
best possible evidence and implemented hand in hand with researchers and policy makers. In that way,
cost-effective, relevant and adequate strategies aiming to prevent NCDs at the national level can be
identified.

114

115
Appendices

116

Appendices
117
Appendix 1 Conceptual framework for healthy eating behavior
fgff
INDIVIDUAL FACTORS
Self-efficacy
Subjective norm
Attitudinal beliefs (barriers
and benefits)
Habit strength
Perceived food safety
Taste
Dietary
behavior
MODERATORS
Socio-economic status
Financial autonomy
Setting (rural/urban)
ENVIRONMENT
Socio-cultural
changes
Increased
workload
Changed food
patterns
School
School practices:
Rules
Support
Lack of self-control
Family
Parenting practices:
Rules
Role modelling
Permissiveness
Financial co nstraints
Lack of self-control
Availability/Accessibility

Appendices
118
Appendix 2 Conceptual framework for physical activity behavior
INDIVIDUAL
FACTORS
Self-efficacy
Subjective norm
Attitudinal beliefs
Perceived barriers
Habit strength
Knowledge
Physical
activity
behavior
MODERATORS
Socio-economic status
Setting (rural/urban)
ENVIRONMENT
Built
Traffic and
crime concerns
Geographical
distances
School
Rules
Opportunity
Role
modelling &
support
Financial
constraints
Family
Rules
Opportunity
Role modelling
& support
Financial
constraints

Appendices
119
Appendix 3 Matrix. Theoretical methods and related intervention strategies
Factors Theoretical methods Intervention strategies
Adolescents
Knowledge/Awareness Active learning (IMB model) The ACTIVITAL toolkit: providing information, facts about a healthy breakfast through an interactive
session (games, visual exercises, etc.)
Using imagery (theories of information processing) Images are used as analogy to create awareness on health benefits or risks
Goal setting (CT) Current habits are discussed (quiz) and new goals are set
Rehearsal Throughout the intervention, knowledge is repeated and evaluated
Self-evaluation (TTM)
Prompt barrier identification (SCogT)
They identify barriers, get feedback (group discussion) which is followed by problem-solving and
teaching them skills (breakfast event/athletes sharing their experiences) on how to overcome these
Attitudinal beliefs Self-evaluation (TTM)
Prompt barrier identification (SCogT)
They identify barriers, get feedback (group discussion) which is followed by problem-solving and
teaching them skills (breakfast event/athletes sharing their experiences) on how to overcome these
Persuasive communication Guided towards adoption of a positive attitude towards a healthy breakfast
Modelling (SCogT) Famous young athletes share their experiences on breakfast, attention, remembrance and show them
how they can improve
Skills/Self-control Guided practice (SCogT) A session in which a “real life game” is played in which they get money to buy a healthy breakfast and
evaluate what they bought for a limited amount of money
Planning coping responses Providing them with alternatives in case they are confronted with limitations
Active learning (IMB)
Direct experience
Events, workshops in which they prepare a healthy breakfast and share experiences and receive
practical tips
Subjective norm Shifting the focus (TPB)
Information about other’s approval (TPB)
Focusing on e.g. better performance at school, a healthy skin, rather than on healthy weight, etc.
Modelling
Prompt identification as role models (SCogT)
Famous athletes share their experience, and increase acceptance of eating a healthy breakfast.
Workshops
Plan social support and change (social support theories) Workshops

Appendices
120
Factors Theoretical methods Intervention strategies
Parents
Knowledge/Awareness Active learning (IMB model) Workshops providing information, facts about a healthy breakfast through an interactive session
Using imagery (theories of information processing) Images are used as analogy to create awareness on health benefits or risks
Goal setting (CT) Current habits are discussed (quiz) and new goals are set
Attitude Self-evaluation (TTM)
Prompt barrier identification (SCogT)
They identify barriers, get feedback (group discussion) which is followed by problem-solving and
skills training on how to overcome these (breakfast recipes)
Prompt identification as role models (SCogT) Their exemplary role for their children is discussed in an interactive session
Persuasive communication Guided towards adoption of a positive attitude towards a healthy breakfast
Skills/Self-control Planning coping responses Providing them with alternatives in case they are confronted with limitations
Active learning (IMB)
Direct experience (Theories of learning)
Workshops in which they receive breakfast recipes for different budgets, share experiences and receive
practical tips
School staff
Knowledge/Awareness Active learning (IMB model) The ACTIVITAL toolkit: providing information, facts about a healthy breakfast through an interactive
session (games, visual exercises, etc.). Each chapter provides details on how to deliver sessions within
the toolkit.
Using imagery (theories of information processing) Images are used as analogy to create awareness on health benefits or risks
Attitude Prompt identification as role models (SCogT) They are encouraged to be an exemplary role for the adolescents throughout the ACTIVITAL toolkit,
use of leaflets, and informal meetings
Persuasive communication Guided towards adoption of a positive attitude towards a healthy breakfast
Skills/Self-control Guided practice (SCogT) A session in which a “real life game” is played in which they get money to buy a healthy breakfast and
evaluate what they bought for a limited amount of money. The teacher first models the good behavior
and then the adolescents are asked to play the game themselves.
Planning coping responses Providing them with alternatives in case they are confronted with limitations

Appendices
121
Factors Theoretical methods Intervention strategies
Outcome expectations Enactive mastery experience (SCogT) Participatory development and problem-solving: including recommendations in the toolkit, technical
assistance in problems in implementing the toolkit, generating solutions, and obtaining feedback after
implementation
Persuasive communication Benefits of protecting children from diseases by having a healthy breakfast
Food-tuck shops
Knowledge/Awareness Active learning (IMB model) Workshops providing information, facts about a healthy breakfast, food safety issues, planning healthy
breakfasts through interactive session
Using imagery (theories of information processing) Images are used as analogy to create awareness on health benefits or risks
Goal setting (CT) Current practices are discussed (quiz) and new goals are set
Skills/Self-control Planning coping responses Providing them with alternatives in case they are confronted with limitations
Active learning (IMB)
Direct experience (Theories of learning)
Workshops in which they receive breakfast recipes for different budgets, share experiences and receive
practical tips
Attitude Self-evaluation (TTM)
Prompt barrier identification (SCogT)
They identify barriers, get feedback (group discussion) which is followed by problem-solving and
teaching them skills on how to overcome these
Persuasive communication Guided towards adoption of a positive attitude towards a healthy breakfast
Direct experience (Theories of learning) Sharing experiences
Outcome expectations Structural redesign (organizational development theory) Trainings with manager or employees of tuck shops on providing healthy breakfasts
Guided practice (SCogT) Tuck shops with positive experiences on healthy recipes shared these with the other tuck shops
Enactive mastery experience (SCogT) Participatory problem-solving: including technical assistance in diagnosing problem, generating
solutions, developing priorities, making action plan, obtaining feedback after implementation
SCogT, Social Cognitive Theory; CTh, Control Theory; TTM, Trans Theoretical Model; IMB, Information-Motivation Behavioral skills model; TPB, Theory of Planned Behavior

Appendices
122
Appendix 4 Unsatisfied basic needs questionnaire
NECESIDADES BÁSICAS: todas estas preguntas deberán responderse en función del alumno a quien usted
representa.
1. La casa en la que vive es:
1 Propia
2 Arrendada
3 Prestada
4 Otros
2. .El material de las paredes de la casa es:
1 Ladrillo, Bloque o similares
2 Adobe o bareque
3 Material Mixto
4 Otros _______________________
3. La vivienda tiene:
1 Servicio higiénico
2 Letrina
3 Pozo séptico 4 Otros______________
4. ¿Cuántas personas duermen en el cuarto en el cual duerme su representado/a? ______________
5. ¿La casa tiene electricidad?
1 Si
2 No
ID:
Su Nombre
Completo
Nombre Completo
de su
representado/a
Fecha de hoy:
_____ /________________________/200__
(Día - Mes en letras - Año
Género 1 Masculino
2 Femenino
Fechas de
Nacimiento de su
representado/a
_____ /_______________________/______
(Día - Mes en letras - Año
Teléfono
Nombre del
Colegio
¿Dónde
vive usted?
1 Cuenca
Dirección exacta
(de su
representado/a)
Parroquia
¿Qué idioma
hablan en su casa?
1 Español ¿Quién
cuida a su
repre-
sentado/a?
1 Los padres 4 Los abuelos
2 Quichua 2 La madre 5 Otros
3 Otro ___
_______
3 El padre
¿Cuántos
hermanos y
hermanas tiene su
representado/a?
1 Hermanos
2 Hermanas

Appendices
123
6. ¿El agua de la casa viene de:
1 Red de agua potable
2 Entubada
3 Río vertiente, lluvia, fuera de la vivienda
4 Otros_______________
7. La última vez que una mujer dio a luz en la familia, el parto fue atendido por:
1 Profesional de salud: medico, obstetriz, enfermera.
2 Comadrona, familiar, otra persona no profesional de salud
8. ¿En que trabajan los miembros de la familia?
1 Padre
2 Madre
3 1er hijo/a
4 2do hijo/a
5 3er hijo/a
6 Otros_______
7 ____________
8 ____________
9 ____________
10 ____________
11 ____________
9. Años de estudio de los miembros de la familia.
1 Padre
2 Madre
3 1er hijo/a
4 2do hijo/a
5 3er hijo/a
7 Otros_______
8 __________
9 __________
10 __________
11 __________
10. ¿Estuvo enfermo algún miembro de la familia los últimos 3 días? Señalar con una x en el casillero a la
izquierda de la persona correspondiente, y responder si esta persona ha recibido atención médica o no en
los casilleros de la derecha
Atención médica
SI NO
1 Padre
2 Madre
3 1er hijo/a
4 2do hijo/a
5 3er hijo/a
6 Ninguno
7 Otros_______
8 ____________
9 ____________
10 ____________

Appendices
124
BIENES
12. ¿El hogar tiene alguno de los siguientes bienes? ¿En el caso de que lo tenga adquirió éste bien nuevo o
de segunda mano?
BIEN SI NO Nuevo Segunda
mano
Bicicleta?
Carro?
Cocina?
Computadora?
Equipo de sonido?
Lavadora de platos?
Lavadora de ropa?
Línea telefónica?
Motocicleta?
Radio grabadora
Refrigerador?
Televisión a color?
Cable
Satelital
Plasma
LCD
13. La familia tiene:
MIGRACION
14. ¿Cuánto tiempo ha vivido aquí? Si la respuesta es siempre pasar a la pregunta 17
1 Siempre
2 ______ años
15. ¿Dónde vivió antes de vivir aquí?
1 Fuera de la ciudad
2 Fuera del país
16. Cuál es la razón principal por la que la familia se vino a vivir a éste lugar?
1 Trabajo 5 Salud o enfermedad
2 Compró o les dieron una casa/terreno 6 Para mejorar los ingresos
3 Seguridad familiar 7 Estudio
4 Matrimonio 8 Otros__________________ (especificar)
17. ¿Recibe dinero de familiares que vivan en el extranjero?
1 Si
2 No
18. ¿Envían dinero al estudiante para su refrigerio?
1 Si
2 No
19. ¿Si la respuesta es afirmativa, cuánto dinero le envían en un día normal de clases?
_____________________
1 Terrenos? (Excluye uso agropecuario)
2 Casas departamentos
3 Locales comerciales

Appendices
125
Appendix 5 CONSORT 2010 checklist of information to include when reporting a cluster randomized trial
Section/Topic Item
No
Standard Checklist item Extension for cluster designs Page
No.
Title and abstract
1a Identification as a
randomized trial in the title
Identification as a cluster
randomized trial in the title
45
1b Structured summary of trial
design, methods, results, and
conclusions (for specific
guidance see CONSORT for
abstracts) (84).
47
Introduction
Background and
objectives
2a Scientific background and
explanation of rationale
Rationale for using a cluster
design
48
2b Specific objectives or
hypotheses
Whether objectives pertain to
the cluster level, the
individual participant level or
both
48
Methods
Trial design 3a Description of trial design
(such as parallel, factorial)
including allocation ratio
Definition of cluster and
description of how the design
features apply to the clusters
48-49
3b Important changes to methods
after trial commencement
(such as eligibility criteria),
with reasons
Participants 4a Eligibility criteria for
participants
Eligibility criteria for clusters 48-49
4b Settings and locations where
the data were collected
7-8
Interventions 5 The interventions for each
group with sufficient details
to allow replication, including
how and when they were
actually administered
Whether interventions pertain
to the cluster level, the
individual participant level or
both
50-52
Outcomes 6a Completely defined pre-
specified primary and
secondary outcome measures,
including how and when they
were assessed
Whether outcome measures
pertain to the cluster level, the
individual participant level or
both
54-55
6b Any changes to trial
outcomes after the trial
commenced, with reasons
Sample size 7a How sample size was
determined
Method of calculation,
number of clusters(s) (and
whether equal or unequal
cluster sizes are assumed),
cluster size, a coefficient of
intracluster correlation (ICC
or k), and an indication of its
uncertainty
49
7b When applicable, explanation
of any interim analyzes and
stopping guidelines
Randomization:
Sequence
generation
8a Method used to generate the
random allocation sequence
49

Appendices
126
Section/Topic Item
No
Standard Checklist item Extension for cluster designs Page
No.
8b Type of randomization;
details of any restriction (such
as blocking and block size)
Details of stratification or
matching if used
48-49
Allocation
concealment
mechanism
9 Mechanism used to
implement the random
allocation sequence (such as
sequentially numbered
containers), describing any
steps taken to conceal the
sequence until interventions
were assigned
Specification that allocation
was based on clusters rather
than individuals and whether
allocation concealment (if
any) was at the cluster level,
the individual participant level
or both
48-49
Implementation
10 Who generated the random
allocation sequence, who
enrolled participants, and who
assigned participants to
interventions
Replace by 10a, 10b and 10c
10a Who generated the random
allocation sequence, who
enrolled clusters, and who
assigned clusters to
interventions
49
10b Mechanism by which
individual participants were
included in clusters for the
purposes of the trial (such as
complete enumeration,
random sampling)
49
10c From whom consent was
sought (representatives of the
cluster, or individual cluster
members, or both), and
whether consent was sought
before or after randomization
49
Blinding 11a If done, who was blinded
after assignment to
interventions (for example,
participants, care providers,
those assessing outcomes)
and how
11b If relevant, description of the
similarity of interventions
Statistical methods 12a Statistical methods used to
compare groups for primary
and secondary outcomes
How clustering was taken into
account
49,57
12b Methods for additional
analyzes, such as subgroup
analyzes and adjusted
analyzes
57,
71-72
Results
Participant flow (a
diagram is strongly
recommended)
13a For each group, the numbers
of participants who were
randomly assigned, received
intended treatment, and were
analyzed for the primary
outcome
For each group, the numbers
of clusters that were randomly
assigned, received intended
treatment, and were analyzed
for the primary outcome
55

Appendices
127
Section/Topic Item
No
Standard Checklist item Extension for cluster designs Page
No.
13b For each group, losses and
exclusions after
randomization, together with
reasons
For each group, losses and
exclusions for both clusters
and individual cluster
members
55
Recruitment 14a Dates defining the periods of
recruitment and follow-up
53
14b Why the trial ended or was
stopped
Baseline data 15 A table showing baseline
demographic and clinical
characteristics for each group
Baseline characteristics for the
individual and cluster levels
as applicable for each group
58-61
Numbers analyzed 16 For each group, number of
participants (denominator)
included in each analysis and
whether the analysis was by
original assigned groups
For each group, number of
clusters included in each
analysis
58
Outcomes and
estimation
17a For each primary and
secondary outcome, results
for each group, and the
estimated effect size and its
precision (such as 95%
confidence interval)
Results at the individual or
cluster level as applicable and
a coefficient of intracluster
correlation (ICC or k) for each
primary outcome
62
17b For binary outcomes,
presentation of both absolute
and relative effect sizes is
recommended
Ancillary analyzes 18 Results of any other analyzes
performed, including
subgroup analyzes and
adjusted analyzes,
distinguishing pre-specified
from exploratory
59-63
72-73
Harms 19 All important harms or
unintended effects in each
group (for specific guidance
see CONSORT for harms)
(233).
Discussion
Limitations 20 Trial limitations, addressing
sources of potential bias,
imprecision, and, if relevant,
multiplicity of analyzes
64,
74
Generalizability 21 Generalizability (external
validity, applicability) of the
trial findings
Generalizability to clusters
and/or individual participants
(as relevant)
102-
105
Interpretation 22 Interpretation consistent with
results, balancing benefits and
harms, and considering other
relevant evidence
63-64
Other information
Registration 23 Registration number and
name of trial registry
16
Protocol 24 Where the full trial protocol
can be accessed, if available
Funding 25 Sources of funding and other
support (such as supply of
drugs), role of funders
9

Appendices
128
Appendix 6 Changes in dietary intake outcomes by treatment group and over time (mean and SD)
30
80
130
180
230
280
330
380
430
Baseline First Follow-up Second follow-up
gram
s/d
ay
Fruit and vegetables
Control
Intervention
30
50
70
90
110
Baseline First Follow-up Second follow-up
gram
s/d
ay
Added sugar
Control
Intervention

Appendices
129
19
24
29
34
Baseline First Follow-up Second follow-up
E%/d
ay
Total fat
Control
Intervention
1
1,5
2
2,5
3
3,5
Baseline First Follow-up Second follow-up
gram
s/d
ay
Sodium
Control
Intervention

Appendices
130
-45
5
55
105
155
205
255
305
Baseline First Follow-up Second follow-up
gram
s/d
ay
Processed food as snacks
Control
Intervention

Appendices
131
Appendix 7 Intervention effect adjusted for BMI z-score
Primary outcomes Effect after 28 months1 Effect after stage 1 (17 months)2 Effect after stage 2 (11 months)2
n Diff3 95% CI P4 Diff 95% CI P Diff 95% CI P
Fruit and vegetables (g/day) 1075 23.3 ( 6.69; 39.9) 0.006 28.5 ( 9.60; 47.3) 0.003 -13.1 (-36.9; 10.7) 0.279
Added sugar (g/day) 1075 -5.71 (-9.72;-1.74) 0.005 -2.55 (-6.80; 1.67) 0.235 -4.26 (-8.72; 0.22) 0.062
Fat (E%/day) 1075 -0.48 (-1.20; 0.28) 0.225 -0.60 (-1.39; 0.22) 0.157 0.15 (-0.77; 1.08) 0.747
Sodium (g/day) 1075 0.01 (-0.08; 0.11) 0.849 0.03 (-0.07; 0.15) 0.492 -0.03 (-0.17; 0.09) 0.594
Processed food at snacks (g/day) 1075 -23.9 (-45.8;-1.96) 0.033 -9.71 (-32.5; 13.1) 0.403 -18.9 (-45.3; 7.57) 0.162
Processed food consumers at school (PD5) 1075 -0.03 (-0.08; 0.06) 0.466 -0.15 (-0.22;-0.09) <0.001 0.11 ( 0.03; 0.20) 0.004
Breakfast intake (PD) 1075 -0.03 (-0.06; 0.03) 0.345 0.03 ( 0.01; 0.09) 0.104 -0.08 (-0.13;-0.02) 0.008
Secondary outcomes
Waist circumference (cm) 1075 -0.98 (-1.57;-0.42) 0.001 -1.60 (-2.21;-1.00) <0.001 0.36 (-0.28; 1.00) 0.262
Systolic blood pressure (mmHg) 1075 -3.70 (-4.79;-2.60) <0.001 -0.41 (-1.56; 0.75) 0.486 -3.97 (-5.20;-2.73) <0.001
Diastolic blood pressure (mmHg) 1075 -1.90 (-2.97;-0.87) <0.001 0.41 (-0.71; 1.53) 0.471 -2.92 (-4.11;-1.72) <0.001 1 Results obtained from linear mixed models accounting for the effects of clustering by individual and school. The models were adjusted for sex, unsatisfied basic needs and
differences at baseline (excluding the treatment group main effect) (162). 2 Results obtained from regression spline mixed effects models accounting for the effects of
clustering by individual and school. One knot was defined at the mean time of the first follow up data collection (17 months). These models were also adjusted for sex, UBN
and differences at baseline; 3 Mean differences; 4 P value; 5Proportion difference. Bold: P values <0.05

Appendices
132
Appendix 8 Analysis of missing values of outcomes with P<0.1 after 28 months of intervention
Primary outcomes n Diff 95% CI P value
Fruit and vegetables (g/day) 1379 20.0 [ 2.24; 37.2] 0.026
Added sugar (g/day) 1379 6.71 [ 0.97; 12.5] 0.022
Processed food at snacks (g/day) 1379 -18.3 [-39.5; 2.94] 0.092
Secondary outcomes
Waist circumference (cm) 1224 -1.01 [-1.64;-0.39] 0.001
Systolic blood pressure (mmHg) 1227 -3.31 [-4.36;-2.26] <0.001
Diastolic blood pressure (mmHg) 1227 -1.77 [-2.77;-0.77] 0.001
Bold: P values <0.05

Appendices
133
Appendix 9 Baseline characteristics per subgroups by treatment group of primary outcomes with a significant intervention
effect after 28 months
Outcomes Subgroups Intervention Control
n Median 25th-75th n Median 25th-75th P
Fruit and
vegetables
(g/day)
Poor 212 197.6 (109.2;321.0) 213 187.7 (101.4;288.4) 0.732
Better-off 448 211.1 (124.9;340.7) 442 195.0 (105.4;321.2) 0.158
Underweight 45 211.5 (150.3;347.0) 33 330.3 (195.5;443.3) 0.053
Healthy weight 492 202.3 (120.0;333.2) 513 183.8 (101.9;292.8) 0.110
Overweight-obese 139 211.7 (113.3;337.8) 134 188.5 (106.5;292.4) 0.342
Younger 336 211.8 (128.5;328.2) 316 185.3 (102.0;290.8) 0.599
Older 352 194.8 (113.9;338.2) 369 197.5 (105.4;317.9) 0.176
Added sugar
(g/day)
Poor 212 63.7 (43.6;86.1) 213 62.5 (46.6;87.2) 0.673
Better-off 448 70.5 (50.2;94.1) 442 69.8 (50.9;92.9) 0.449
Underweight 45 81.3 (56.0;101.5) 33 72.5 (56.8;103.1) 0.600
Healthy weight 492 68.8 (48.9;93.6) 513 68.9 (48.0;91.5) 0.601
Overweight-obese 139 64.3 (43.5;83.0) 134 66.7 (52.2;89.4) 0.239
Younger 336 70.2 (49.8;93.9) 316 68.7 (48.8;92.0) 0.260
Older 352 67.7 (46.7;90.1) 369 69.2 (49.2;91.5) 0.393
Processed
food at
snacks
(g/day)
Poor 212 84.90 (7.50;222.3) 213 87.5 (38.5;218.5) 0.905
Better-off 448 101.4 (32.9;216.5) 442 98.5 (40.5;265.0) 0.422
Underweight 45 150.0 (60.0;293.5) 33 73.0 (18.0;204.0) 0.024
Healthy weight 492 94.3 (23.5;220.9) 513 95.0 (40.7;256.3) 0.353
Overweight-obese 139 78.0 (4.40;204.5) 134 124.5 (45.0;270.6) 0.587
Younger 336 97.8 (31.5;226.8) 316 92.4 (42.0;239.5) 0.186
Older 352 91.0 (23.5;205.1) 369 100.0 (38.5;270.6) 0.678
Bold: P values <0.05
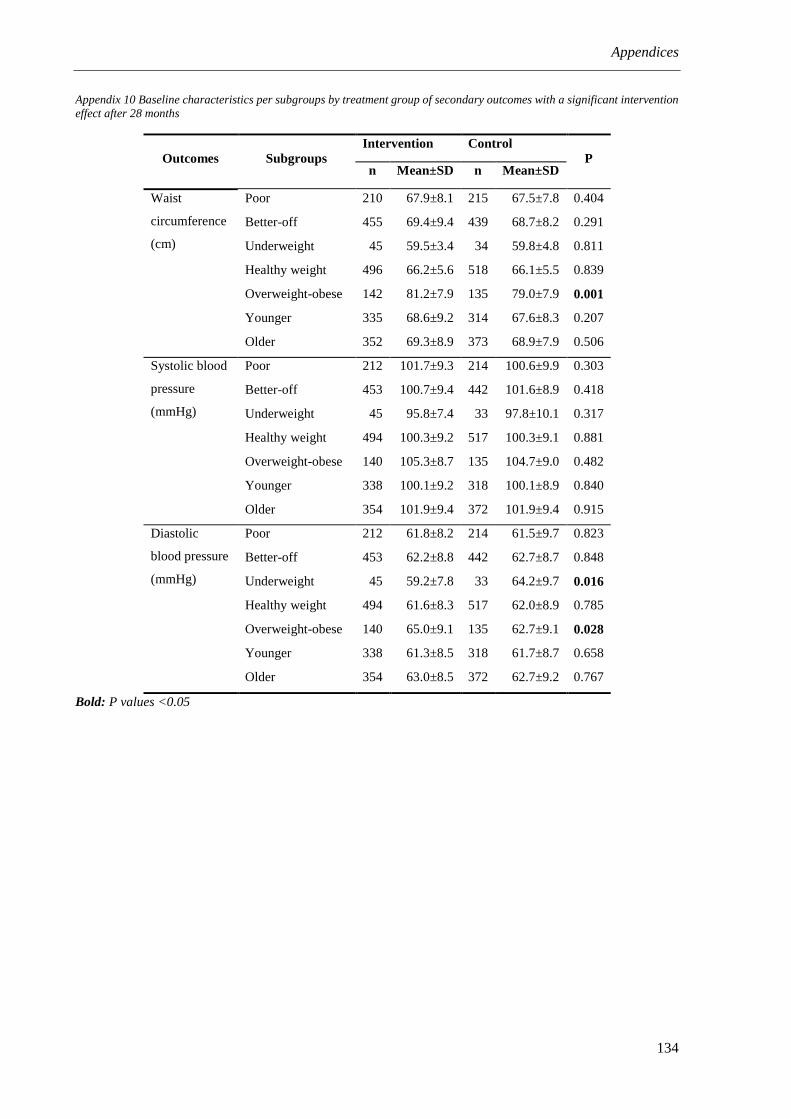
Appendices
134
Appendix 10 Baseline characteristics per subgroups by treatment group of secondary outcomes with a significant intervention
effect after 28 months
Outcomes Subgroups
Intervention Control
P n Mean±SD n Mean±SD
Waist
circumference
(cm)
Poor 210 67.9±8.1 215 67.5±7.8 0.404
Better-off 455 69.4±9.4 439 68.7±8.2 0.291
Underweight 45 59.5±3.4 34 59.8±4.8 0.811
Healthy weight 496 66.2±5.6 518 66.1±5.5 0.839
Overweight-obese 142 81.2±7.9 135 79.0±7.9 0.001
Younger 335 68.6±9.2 314 67.6±8.3 0.207
Older 352 69.3±8.9 373 68.9±7.9 0.506
Systolic blood
pressure
(mmHg)
Poor 212 101.7±9.3 214 100.6±9.9 0.303
Better-off 453 100.7±9.4 442 101.6±8.9 0.418
Underweight 45 95.8±7.4 33 97.8±10.1 0.317
Healthy weight 494 100.3±9.2 517 100.3±9.1 0.881
Overweight-obese 140 105.3±8.7 135 104.7±9.0 0.482
Younger 338 100.1±9.2 318 100.1±8.9 0.840
Older 354 101.9±9.4 372 101.9±9.4 0.915
Diastolic
blood pressure
(mmHg)
Poor 212 61.8±8.2 214 61.5±9.7 0.823
Better-off 453 62.2±8.8 442 62.7±8.7 0.848
Underweight 45 59.2±7.8 33 64.2±9.7 0.016
Healthy weight 494 61.6±8.3 517 62.0±8.9 0.785
Overweight-obese 140 65.0±9.1 135 62.7±9.1 0.028
Younger 338 61.3±8.5 318 61.7±8.7 0.658
Older 354 63.0±8.5 372 62.7±9.2 0.767
Bold: P values <0.05

Appendices
135
Appendix 11 Structured observations for the classes’ instrument.
Clase No: Colegio:
Fecha
Curso
Capítulo Nro.
Nombre del profesor
Actividades pendientes del capítulo de hoy
Fecha de siguiente clase
¿Se impartió la clase y por qué?
¿Cuántos alumnos no tienen sus libros en la clase?
¿Cuánto se impartió? (Dose delivered)
Avance de la clase (número de página)
Hora del inicio de la clase ¿Cuánto tiempo
duró la clase?
Hora de finalización de la clase
¿El profe revisó y corrigió si los alumnos hicieron sus
deberes?
¿El/la profesor/a utilizó todos los materiales / juegos /
métodos como se ha planificado en el libro?
¿El profe utilizó materiales/deberes adicionales?
¿Cuáles?
¿El profe hizo gastos adicionales? ¿Cuáles?
¿Cuánto recibió? (Dose received)
¿Los estudiantes mostraron interés, están atentos
durante toda la clase? (% estimado)
(Contestaron las preguntas que les hace el/la profesor/a)
¿Participaron en los juegos/actividades? ¿Los estudiantes
disfrutaron (explicación)?
¿Los estudiantes tuvieron una actitud positiva a lo largo
de la clase? (explicación)
.
¿El profe estaba motivado durante la clase?
¿Tuvo que intervenir en la clase?
¿Tuvo que dar la clase? ¿Por qué?
Alcance? (Reach)
¿Cuántos alumnos hay en la clase?
Calidad de la clase (Fidelity)

Appendices
136
¿El conocimiento del profesor sobre el contenido de la
clase fue suficiente? (cometió algún error?)
¿Pudo contestar las preguntas?
¿Fue adecuado el tiempo de la clase, faltó tiempo? Por
qué?
¿Estuvieron disponibles todos los materiales necesarios
(libros, juegos, etc.)?
¿Es clara la explicación del profesor? ¿El profesor hacía
preguntas?
¿Cuál fue la metodología del profesor?
Ambiente de la clase (Environment)
¿Existieron cambios en el ambiente físico del aula
durante la clase?
¿El/la profesor/a realizo clases adicionales de
alimentación y actividad física? (ejemplo: en las clases de
CCNN o en otras materias)
Barreras y facilidades
¿Qué problemas tuvieron durante la clase?
¿Existieron situaciones que influyeron la atención de los
estudiantes? Por ejemplo: ¿Hay muchas ventanas en el
aula? ¿Hubo mucho ruido? ¿Entraba otro profe,
inspector,…?
¿Por qué el profe no dio la clase, cuáles son sus razones?
¿Qué ha facilitado la clase? (ejemplo: libros en la clase,
material disponible, la manejo de la disciplina…)
¿Por qué los adolescentes no llevan los libros?
¿Otras barreras y facilitadores?
Material
¿Errores que aparecen en el libro?
¿Qué no se entendió del material? (confuso)
Preguntas realizadas por los alumnos
Otras notas y anécdotas

Appendices
137
Appendix 12 Adolescents evaluation form
Fecha de hoy: □□/□□/□□□□ (dd/mm/yyyy) ID: □□□□
Colegio:
Curso:
Nombres y Apellidos:
Género: O Masculino O Femenino
Nombre de su profesor (quien dictó las clase de nutrición)
1. Querido estudiante, en el siguiente cuestionario encontrará algunas de las actividades que se
incluyeron durante la intervención que realizamos en su colegio. Por favor responda con un visto en el recuadro que corresponda a su respuesta. Le pedimos que escoja una sola respuesta por fila, si usted comete algún error al responder, por favor tache la respuesta incorrecta y coloque un visto en la respuesta correcta
Actividades No me gustó No me gusto mucho
Neutral Me gustaron algunas cosas
Me gustó mucho
Posters de deportistas famosos comiendo saludablemente y realizando actividad física
Preparación de un refrigerio saludable en las clases
Presentación de los deportistas
Evento de Actividad Física
Evento de desayuno/refrigerio saludable
Test “¿Qué tan sano me alimento?”
Test “tomemos un paseo”
Juego Bingo
Juego de Beneficios de Actividad Física
Juego “Dinero, dinero, dinero”
Disponibilidad de comida saludable
Nuevas recetas saludables
Menos comida no saludable

Appendices
138
2. ¿Cuáles de las siguientes clases fueron dadas en su curso? (puede marcar más de una opción)
La pirámide alimenticia si no
Actividad Física si no
Sedentarismo si no
Refrigerio Saludables si no
Desayuno si no
Dinero si no
Propagandas de alimentos si no
Almuerzos y meriendas si no
3. ¿Entendió todo lo que el profesor explicaba en las clases?
No, nunca Rara vez A veces La mayoría de las veces
Sí, siempre
4. ¿Le interesó el contenido de las clases?
No me interesaron para nada
No me interesaron mucho
Más o menos Me interesaron un poco
Me interesaron mucho
5. ¿La información que recibió en las clases fue nueva? (es decir NO tenia conocimientos previos) Sí, todo fue Nuevo
Parte de la información fue nueva para mí, por ejemplo: …………………………………………………………………………………………………………………….
No, nada fue nuevo
6. ¿Cómo calificaría las clases recibidas del 1 al 10? (encierre en un círculo su calificación)
1 2 3 4 5 6 7 8 9 10
7. ¿Existieron otras clases en su colegio relacionadas con nutrición y/o actividad física en su colegio? 1. Si. La actividad consistió en lo siguiente (describir la actividad):
………………………………………………………………………………………………………………………………….
2. No 8. ¿Asistieron sus padres a los talleres?
Si, a todos
Si, a algunos
No, a ninguno
9. ¿Cree que las clases hacen ver mal a las personas con sobrepeso u obesidad?
Si
No

Appendices
139
Appendix 13 Parental workshops evaluation form.
Fecha de hoy: □□/□□/□□□□ (dd/mm/yyyy) ID: □□□□
Colegio:
Curso:
Nombre completo del representante
Nombres y Apellidos de su hijo
Nombre del Taller: Etiquetas Nutricionales
1. ¿Qué piensa usted sobre los contenidos del taller? (Por favor encierre en un círculo su respuesta)
Mala Regular Buena Muy buena Excelente
1 2 3 4 5
2. ¿Cuál fue el tema más interesante en el taller para usted?
Partes de la etiqueta nutricional
reglas para elegir etiquetas saludables
Trucos publicitarios
Secretos publicitarios
Todos
Ninguno
3. ¿Cuál fue el tema menos interesante en el taller para usted?
Partes de la etiqueta nutricional
reglas para elegir etiquetas saludables
Trucos publicitarios
Secretos publicitarios
Todos
Ninguno
4. ¿Qué tan fácil es para usted aplicar la información del folleto?
Muy difícil Difícil Ni difícil, ni fácil
Fácil Muy fácil
1 2 3 4 5
5. ¿Fue nueva la información que recibió en el taller?
Sí, todo fue completamente nuevo
Parte de la información fue nueva, por ejemplo:………………………..
No
6. ¿El contenido del taller respondió sus inquietudes sobre ese tema?
Si
No
Parcialmente
7. ¿Qué piensa usted sobre la duración del taller?
Muy corta

Appendices
140
Perfecta
Muy larga
8. ¿Después de haber asistido a este taller ¿Consideraría en cambiar sus hábitos?
Si
No
Si su respuesta es no ¿Por qué?...................................................................
9. ¿Tiene una mejor idea de cómo interpretar las etiquetas nutricionales?
Si
No Si su respuesta es no ¿Por qué?...................................................................
10. ¿Asistiría de nuevo al taller?
Sí, porque: o La información es práctica o Conocí a otros padres o Estuvo interesante o Otras razones …………………………………..
No, porque: o No es interesante o No puedo usar la información o Era obligatorio o Otras razones……………………………………………
11. ¿Recomendaría el taller a otros?
Sí
No Si su respuesta es no ¿Por qué?.......................................................................
12. Evalúe usted el taller en una escala de 1 a 10
1 2 3 4 5 6 7 8 9 10
13. ¿Qué otros temas deberíamos tratar?
………………………………………………………………………………………………………………………………….………………………………………………………………………………………………………………………………………………………………………………………………………………………………
!Gracias por su colaboración!

Appendices
141
Appendix 14 Coding tree of the classes structured observations.
Context
¡What are the problems
Booklet problems
Indiscipline
Lack of time-other activities
Noise
None
Students don´t bring their booklets-materials
teacher did not plan the class
Dose delivered
Did the teacher use all materials/games/methods as described in the book?
Most of the materials
Nothing
Partially
Yes, all the materials
Dose received
Was the teacher motivated throughout the class?
More or less
Not at all
Not that much
Yes a lot
Did the students have a positive attitude throughout the class? (explanation)
Most of them
Not at all
Not that much, Some yes but others no
Yes
Did you have to intervene in the class? Did you have to give the class? Why?
No
Yes
Fidelity
The knowledge of the teacher about the topic of the class was sufficient? Did he/she make a
mistake? Was he/she able to answer the questions?

Appendices
142
Bad knowledge
Good knowledge
More or less some deficiencies
Was the explanation of the teacher clear? Did he/she asked questions to the students?
More or less
Not at all
Yes very clear
Was the foreseen time sufficient to give the class? Why not?
a bit too short
not enough
Yes, perfect

143
List of references

144

List of references
145
1. Alwan A. Global status report on noncommunicable diseases 2010: World Health Organization;
2011.
2. Boutayeb A. The double burden of communicable and non-communicable diseases in
developing countries. Transactions of the Royal society of Tropical Medicine and Hygiene.
2006;100(3):191-9.
3. World Health Organization. Prevention of Cardiovascular Disease. Guidelines for assessment
and management of cardiovascular risk. World Health Organization [Internet]. 2011. Available from:
http://www.who.int.
4. Abegunde DO, Mathers CD, Adam T, Ortegon M, Strong K. The burden and costs of chronic
diseases in low-income and middle-income countries. Lancet. 2007;370(9603):1929-38.
5. Jamison DT, Summers LH, Alleyne G, Arrow KJ, Berkley S, Binagwaho A, et al. Global health
2035: a world converging within a generation. The Lancet. 2013;382(9908):1898-955.
6. Koh-Banerjee P, Chu N-F, Spiegelman D, Rosner B, Colditz G, Willett W, et al. Prospective
study of the association of changes in dietary intake, physical activity, alcohol consumption, and
smoking with 9-y gain in waist circumference among 16 587 US men. The American journal of clinical
nutrition. 2003;78(4):719-27.
7. Carnethon MR, Evans NS, Church TS, Lewis CE, Schreiner PJ, Jacobs DR, et al. Joint
Associations of Physical Activity and Aerobic Fitness on the Development of Incident Hypertension:
Coronary Artery Risk Development in Young Adults (CARDIA). Hypertension. 2010;56(1):49-55.
8. Carnethon MR, Sternfeld B, Schreiner PJ, Jacobs DR, Lewis CE, Liu K, et al. Association of
20-Year Changes in Cardiorespiratory Fitness With Incident Type 2 Diabetes: The Coronary Artery
Risk Development in Young Adults (CARDIA) fitness study. Diabetes Care. 2009;32(7):1284-8.
9. Sarzynski MA, Sternfeld B, Carnethon MR, Sidney S, Quesenberry CP, Haskell WL, et al.
Association of 20-Year Changes in Cardiorespiratory Fitness with Incident Dyslipidemia Between
Years 20 and 25 in the CARDIA Fitness Study. Circulation. 2013;127(12 Supplement):A038.
10. Thorp AA, Owen N, Neuhaus M, Dunstan DW. Sedentary Behaviors and Subsequent Health
Outcomes in Adults: A Systematic Review of Longitudinal Studies, 1996–2011. American Journal of
Preventive Medicine. 2011;41(2):207-15.

List of references
146
11. Lim SS, Vos T, Flaxman AD, Danaei G, Shibuya K, Adair-Rohani H, et al. A comparative risk
assessment of burden of disease and injury attributable to 67 risk factors and risk factor clusters in 21
regions, 1990–2010: a systematic analysis for the Global Burden of Disease Study 2010. The Lancet.
2012;380(9859):2224-60.
12. Beaglehole R, Bonita R, Alleyne G, Horton R, Li L, Lincoln P, et al. UN high-level meeting on
non-communicable diseases: addressing four questions. The Lancet. 2011;378(9789):449-55.
13. Di Cesare M, Khang Y-H, Asaria P, Blakely T, Cowan MJ, Farzadfar F, et al. Inequalities in
non-communicable diseases and effective responses. The Lancet. 2013;381(9866):585-97.
14. Pérez-Rodrigo C, Wind M, Hildonen C, Bjelland M, Aranceta J, Klepp KI, et al. The Pro
Children Intervention: Applying the Intervention Mapping Protocol to Develop a School-Based Fruit
and Vegetable Promotion Programme. Annals of Nutrition and Metabolism. 2005;49(4):267-77.
15. American Heart Association, Gidding SS, Dennison BA, Birch LL, Daniels SR, Gilman MW,
et al. Dietary Recommendations for Children and Adolescents: A Guide for Practitioners. Pediatrics.
2006;117(2):544-59.
16. Harris KM, Gordon-Larsen P, Chantala K, Udry JR. Longitudinal trends in race/ethnic
disparities in leading health indicators from adolescence to young adulthood. Arch Pediatr Adolesc Med.
2006;160(1):74-81.
17. Patton GC, Coffey C, Cappa C, Currie D, Riley L, Gore F, et al. Health of the world's
adolescents: a synthesis of internationally comparable data. The Lancet. 2012.
18. Lobstein. Child and adolescent obesity: part of a bigger picture. Lancet. 2015.
19. Rivera JÁ, de Cossío TG, Pedraza LS, Aburto TC, Sánchez TG, Martorell R. Childhood and
adolescent overweight and obesity in Latin America: a systematic review. The Lancet Diabetes &
Endocrinology. 2014;2(4):321-32.
20. de Moraes AC, Fadoni RP, Ricardi LM, Souza TC, Rosaneli CF, Nakashima AT, et al.
Prevalence of abdominal obesity in adolescents: a systematic review. ObesRev. 2010;12(2):66-97.

List of references
147
21. Bibiloni MdM, Salas R, Novelo HI, Villarreal JZ, Sureda A, Tur JA. Serum Lipid Levels and
Dyslipidaemia Prevalence among 2–10 Year-Old Northern Mexican Children. PLoS ONE.
2015;10(3):e0119877.
22. Yamamoto-Kimura L, Posadas-Romero C, Posadas-Sánchez R, Zamora-González J, Cardoso-
Saldaña G, Ramírez IM. Prevalence and interrelations of cardiovascular risk factors in urban and rural
Mexican adolescents. Journal of adolescent health. 2006;38(5):591-8.
23. de Moraes ACF, Lacerda MB, Moreno LA, Horta BL, Carvalho HB. Prevalence of High Blood
Pressure in 122,053 Adolescents: A Systematic Review and Meta-Regression. Medicine.
2014;93(27):e232.
24. Kimmons J, Gillespie C, Seymour J, Serdula M, Blanck HM. Fruit and Vegetable Intake Among
Adolescents and Adults in the United States: Percentage Meeting Individualized Recommendations.
The Medscape Journal of Medicine. 2009;11(1):26-.
25. Hallal PC, Andersen LB, Bull FC, Guthold R, Haskell W, Ekelund U, et al. Global physical
activity levels: surveillance progress, pitfalls, and prospects. Lancet. 2012;380(9838):247-57.
26. Sawyer SM, Afifi RA, Bearinger LH, Blakemore SJ, Dick B, Ezeh AC, et al. Adolescence: a
foundation for future health. The Lancet. 2012.
27. Viner RM, Ozer EM, Denny S, Marmot M, Resnick M, Fatusi A, et al. Adolescence and the
social determinants of health. The lancet. 2012;379(9826):1641-52.
28. Gore FM, Bloem PJN, Patton GC, Ferguson J, Joseph V, Coffey C, et al. Global burden of
disease in young people aged 10–24 years: a systematic analysis. The Lancet. 2011;377(9783):2093-
102.
29. Patel AI, Bogart LM, Uyeda KE, Martinez H, Knizewski R, Ryan GW, et al. School site visits
for community-based participatory research on healthy eating. American journal of preventive medicine.
2009;37(6):S300-S6.
30. Berenson GS, Srinivasan SR, Bao W, Newman WP, Tracy RE, Wattigney WA. Association
between Multiple Cardiovascular Risk Factors and Atherosclerosis in Children and Young Adults. New
England Journal of Medicine. 1998;338(23):1650-6.

List of references
148
31. Aatola H, Koivistoinen T, Hutri-Kahonen N, Juonala M, Mikkila V, Lehtimaki T, et al. Lifetime
fruit and vegetable consumption and arterial pulse wave velocity in adulthood: the Cardiovascular Risk
in Young Finns Study. Circulation. 2010;122(24):2521-8.
32. Ambrosini GL, Emmett PM, Northstone K, Howe LD, Tilling K, Jebb SA. Identification of a
dietary pattern prospectively associated with increased adiposity during childhood and adolescence. Int
J Obes. 2012;36(10):1299-305.
33. Story M, Neumark-Sztainer D, French S. Individual and environmental influences on adolescent
eating behaviors. Journal of the American Dietetic Association. 2002;102(3):S40-S51.
34. Ortega F, Ruiz J, Castillo M, Sjöström M. Physical fitness in childhood and adolescence: a
powerful marker of health. International Journal of obesity. 2007;32(1):1-11.
35. Rivera JA, Pedraza LS, Martorell R, Gil A. Introduction to the double burden of undernutrition
and excess weight in Latin America. The American journal of clinical nutrition. 2014.
36. Webber L, Kilpi F, Marsh T, Rtveladze K, Brown M, McPherson K. High rates of obesity and
non-communicable diseases predicted across Latin America. PloS one. 2012;7(8):e39589.
37. Ahrens W, Moreno LA, Pigeot I. Childhood Obesity: Prevalence Worldwide-Synthesis Part I.
Epidemiology of obesity in children and adolescents: Springer; 2011. p. 219-35.
38. Usiña J, Carrera S. Anuario de estadísticas vitales nacimientos y defunciones 2013. Ecuador:
Instituto Nacional de Estadísticas y Censos; 2013. Available from: http://www.ecuadorencifras.gob.ec/.
39. Freire WB, Silva-Jaramillo KM, Ramírez-Luzuriaga MJ, Belmont P, Waters WF. The double
burden of undernutrition and excess body weight in Ecuador. The American journal of clinical nutrition.
2014.
40. Freire W RM, Belmont P, Mendieta M, Silva M, Romero N, Sáenz K, Piñeiros P, Gómez L,
Monge R. Resumen Ejecutivo Tomo I. Encuesta Nacional de Salud y Nutrición del Ecuador. In:
Ministerio de Salud Pública INdEyC, editor. Quito Ecuador2013.
41. Biro FM, Wien M. Childhood obesity and adult morbidities. The American journal of clinical
nutrition. 2010;91(5):1499S-505S.

List of references
149
42. Patton GC, Viner RM, Linh LC, Ameratunga S, Fatusi AO, Ferguson BJ, et al. Mapping a global
agenda for adolescent health. Journal of Adolescent Health. 2010;47(5):427-32.
43. Story M, Nanney MS, Schwartz MB. Schools and obesity prevention: creating school
environments and policies to promote healthy eating and physical activity. Milbank Quarterly.
2009;87(1):71-100.
44. De Bourdeaudhuij I, Van Cauwenberghe E, Spittaels H, Oppert JM, Rostami C, Brug J, et al.
School‐based interventions promoting both physical activity and healthy eating in Europe: a systematic
review within the HOPE project. Obesity Reviews. 2011;12(3):205-16.
45. Verstraeten R, Roberfroid D, Lachat C, Leroy JL, Holdsworth M, Maes L, et al. Effectiveness
of preventive school-based obesity interventions in low- and middle-income countries: a systematic
review. The American journal of clinical nutrition. 2012;96(2):415-38.
46. Lachat C, Nago E, Verstraeten R, Roberfroid D, Van Camp J, Kolsteren P. Eating out of home
and its association with dietary intake: a systematic review of the evidence. Obesity Reviews.
2012;13(4):329-46.
47. Khambalia A, Dickinson S, Hardy L, Gill T, Baur L. A synthesis of existing systematic reviews
and meta‐analyses of school‐based behavioural interventions for controlling and preventing obesity.
Obesity Reviews. 2012;13(3):214-33.
48. Lachat C, Otchere S, Roberfroid D, Abdulai A, Seret FMA, Milesevic J, et al. Diet and physical
activity for the prevention of noncommunicable diseases in low-and middle-income countries: a
systematic policy review. PLoS medicine. 2013;10(6):e1001465.
49. Kain J, Cordero SH, Pineda D, de Moraes AF, Antiporta D, Collese T, et al. Obesity Prevention
in Latin America. Current Obesity Reports. 2014;3(2):150-5.
50. Holub CK, Elder JP, Arredondo EM, Barquera S, Eisenberg CM, Sánchez Romero LM, et al.
Obesity Control in Latin American and U.S. Latinos: A Systematic Review. American Journal of
Preventive Medicine. 2013;44(5):529-37.
51. Marshall SJ, Simoes EJ, Eisenberg CM, Holub CK, Arredondo EM, Barquera S, et al. Weight-
Related Child Behavioral Interventions in Brazil: A Systematic Review. American Journal of Preventive
Medicine. 2013;44(5):543-9.

List of references
150
52. Ministerio de Salud del Ecuador - Unidad de Nutrición. Guías y Manuales [webpage]. Quito-
Ecuador: Ministerio de Salud del Ecuador; 2014 [cited 2014 09/11/2014]. Available from:
http://www.salud.gob.ec/unidad-de-nutricion-guias-y-manuales/.
53. Ministerio de Salud - Ministerio de Educación. Reglamento Sustitutivo para el Funcionamiento
de Bares Escolares del Sistema Nacional de Educación. Quito2010.
54. The World Bank Group. Ecuador Data 2014 [cited 2014 April 22th]. Available from:
http://data.worldbank.org/country/ecuador.
55. Instituto Nacional de Estadísticas y Censos INEC. Anuario Estadístico 2012 2012 [cited 2014
April 22th]. Available from: http://www.inec.gob.ec.
56. Salomon JA, Wang H, Freeman MK, Vos T, Flaxman AD, Lopez AD, et al. Healthy life
expectancy for 187 countries, 1990–2010: a systematic analysis for the Global Burden Disease Study
2010. The Lancet. 2012;380(9859):2144-62.
57. Secretaría Nacional de Planificación y Desarrollo del Ecuador. Sistema Nacional de
Información. Indicadores de Educación Ecuador2011 [updated 2011; cited 2014 15/01]. Available from:
http://app.sni.gob.ec/web/menu/.
58. Alcaldía de Cuenca. Cuenca 2013. Available from: http://www.cuenca.gov.ec.
59. Ecuador en cifras. Resultados del Censo 2010 de Población y Vivienda 2010. Available from:
http://www.ecuadorencifras.gob.ec.
60. Sistema Integrado de Indicadores Sociales del Ecuador. Necesidades Básicas Insatisfechas
Ecuador2012 [updated 31/10/2012]. Available from:
http://www.siise.gob.ec/siiseweb/PageWebs/POBREZA/ficpob_P05.htm.
61. Visita Ecuador. Nabón. Available from: https://visitaecuador.com.
62. Sistema Integrado de Indicadores Sociales del Ecuador (SIISE). Pobreza por Necesidades
Básicas Insatisfechas 2010. Available from:
http://www.siise.gob.ec/siiseweb/siiseweb.html?sistema=1#.

List of references
151
63. Craig P, Dieppe P, Macintyre S, Michie S, Nazareth I, Petticrew M. Developing and evaluating
complex interventions: the new Medical Research Council guidance. Bmj. 2008;337.
64. Hardeman W, Sutton S, Griffin S, Johnston M, White A, Wareham NJ, et al. A causal modelling
approach to the development of theory-based behaviour change programmes for trial evaluation. Health
Educ Res. 2005;20(6):676-87.
65. Andrade S, Ochoa-Aviles A, Lachat C, Escobar P, Verstraeten R, Van Camp J, et al. Physical
fitness among urban and rural Ecuadorian adolescents and its association with blood lipids: a cross
sectional study. BMC Pediatrics. 2014;14(1):106.
66. Ochoa‐Avilés A, Andrade S, Huynh T, Verstraeten R, Lachat C, Rojas R, et al. Prevalence and
socioeconomic differences of risk factors of cardiovascular disease in Ecuadorian adolescents. Pediatric
Obesity. 2012;7(4):274-83.
67. Ochoa-Aviles A, Verstraeten R, Lachat C, Andrade S, Van Camp J, Donoso S, et al. Dietary
intake practices associated with cardiovascular risk in urban and rural Ecuadorian adolescents: a cross-
sectional study. BMC Public Health. 2014;14(1):939.
68. Verstraeten R, Van Royen K, Ochoa-Avilés A, Penafiel D, Holdsworth M, Donoso S, et al. A
Conceptual Framework for Healthy Eating Behavior in Ecuadorian Adolescents: A Qualitative Study.
PLOS ONE. 2014;9(1):e87183.
69. Van Royen K, Verstraeten R, Andrade S, Ochoa-Avilés A, Donoso S, Maes L, et al. Factors
Affecting Physical Activity in Ecuadorian Adolescents: A Focus Group Study. J Phys Act Health. 2014.
70. Adam C, Klissouras V, Ravazzolo M, Renson R, Tuxworth W. EUROFIT: European test of
physical fitness. Rome: Council of Europe, Committee for the development of sport. 1988.
71. Necesidades Básicas Insatisfechas [Internet]. 2012 [cited 31/10/2012]. Available from:
http://www.siise.gob.ec/siiseweb/PageWebs/POBREZA/ficpob_P05.htm.
72. Kremers SP, De Bruijn G-J, Visscher TL, Van Mechelen W, De Vries NK, Brug J.
Environmental influences on energy balance-related behaviors: a dual-process view. International
Journal of Behavioral Nutrition and Physical Activity. 2006;3(1):9.
List of references
152
73. de Vries H, Dijkstra M, Kuhlman P. Self-efficacy: the third factor besides attitude and subjective
norm as a predictor of behavioural intentions. Health education research. 1988;3(3):273-82.
74. Green LW, Richard L, Potvin L. Ecological foundations of health promotion. American Journal
of Health Promotion. 1996;10(4):270-81.
75. Gregson J, Foerster SB, Orr R, Jones L, Benedict J, Clarke B, et al. System, environmental, and
policy changes: using the social-ecological model as a framework for evaluating nutrition education and
social marketing programs with low-income audiences. Journal of nutrition education. 2001;33:S4-S15.
76. Verstraeten R. Development of a school-based health promotion intervention in Ecuadorian
adolescents and its cluster randomised-controlled evaluation design. Ghent-Belgium: Ghent University;
2014.
77. Bartholomew LK, Parcel GS, Kok G. Intervention mapping: A process for developing theory
and evidence-based health education programs. Health Education & Behavior. 1998;25(5):545-63.
78. Ndirangu M, Perkins H, Yadrick K, West JR, Bogle ML, Avis-Williams A, et al. Conducting
needs assessment using the comprehensive participatory planning and evaluation model to develop
nutrition and physical activity interventions in a rural community in the Mississippi Delta. Progress in
Community Health Partnerships: Research, Education, and Action. 2007;1(1):41-8.
79. Abraham C, Michie S. A taxonomy of behavior change techniques used in interventions. Health
psychology. 2008;27(3):379.
80. Bartholomew LK, Parcel GS, Kok G, Gottlieb NH, Fernandez ME. Planning health promotion
programs: an intervention mapping approach: John Wiley & Sons; 2011.
81. Hayes R, Bennett S. Simple sample size calculation for cluster-randomized trials. International
journal of epidemiology. 1999;28(2):319-26.
82. Swinburn B, Egger G. Preventive strategies against weight gain and obesity. Obesity reviews.
2002;3(4):289-301.
83. Campbell MK, Elbourne DR, Altman DG. CONSORT statement: extension to cluster
randomised trials. Bmj. 2004;328(7441):702-8.

List of references
153
84. Hopewell S, Clarke M, Moher D, Wager E, Middleton P, Altman DG, et al. CONSORT for
reporting randomized controlled trials in journal and conference abstracts: explanation and elaboration.
PLoS medicine. 2008;5(1):e20.
85. Saunders RP, Evans MH, Joshi P. Developing a process-evaluation plan for assessing health
promotion program implementation: a how-to guide. Health Promotion Practice. 2005;6(2):134-47.
86. Mellen PB, Walsh TF, Herrington DM. Whole grain intake and cardiovascular disease: A meta-
analysis. Nutrition, Metabolism and Cardiovascular Diseases. 2008;18(4):283-90.
87. Mente A, de Koning L, Shannon HS, Anand SS. A systematic review of the evidence supporting
a causal link between dietary factors and coronary heart disease. Arch Intern Med. 2009;169(7):659-69.
88. Welsh JA, Sharma AJ, Grellinger L, Vos MB. Consumption of added sugars is decreasing in
the United States. The American journal of clinical nutrition. 2011;94(3):726-34.
89. Yusuf S, Hawken S, Ôunpuu S, Dans T, Avezum A, Lanas F, et al. Effect of potentially
modifiable risk factors associated with myocardial infarction in 52 countries (the INTERHEART study):
case-control study. The Lancet. 2004;364(9438):937-52.
90. Ambrosini GL, Huang RC, Mori TA, Hands BP, O'Sullivan TA, de Klerk NH, et al. Dietary
patterns and markers for the metabolic syndrome in Australian adolescents. Nutrition, Metabolism and
Cardiovascular Diseases. 2010;20(4):274-83.
91. Au LE, Economos CD, Goodman E, Houser RF, Must A, Chomitz VR, et al. Dietary Intake and
Cardiometabolic Risk in Ethnically Diverse Urban Schoolchildren. Journal of the Academy of Nutrition
and Dietetics. 2012;112(11):1815-21.
92. Perichart-Perera O, Balas-Nakash M, Rodríguez-Cano A, Muñoz-Manrique C, Monge-Urrea A,
Vadillo-Ortega F. Correlates of dietary energy sources with cardiovascular disease risk markers in
Mexican school-age children. J Am Diet Assoc. 2010;110(2):253-60.
93. Ventura EE, Davis JN, Alexander KE, Shaibi GQ, Lee W, Byrd-Williams CE, et al. Dietary
intake and the metabolic syndrome in overweight Latino children. J Am Diet Assoc. 2008;108(8):1355-
9.

List of references
154
94. Magnani R. Sampling Guide. Food and Nutrition Technical AssistanceFANTA [Internet]. 2011.
Available from: http://www.fantaproject.org/downloads/pdfs/sampling.pdf.
95. Cogill B. Anthropometric Indicators Measurement Guide. FANTA [Internet]. 2011. Available
from: http://www.fantaproject.org/publications/anthropom.shtml.
96. Cole TJ, Bellizzi MC, Flegal KM, Dietz WH. Establishing a standard definition for child
overweight and obesity worldwide: international survey. BMJ. 2000;320(7244):1240-3.
97. Cole TJ, Flegal KM, Nicholls D, Jackson AA. Body mass index cut offs to define thinness in
children and adolescents: international survey. BMJ. 2007;335(7612):194.
98. Program. NHBPE. The fourth report on the diagnosis, evaluation, and treatment of high blood
pressure in children and adolescents: US Department of Health and Human Services, National Institutes
of Health, National Heart, Lung, and Blood Institute, National Hight Blood Pressure Education Program;
2005.
99. Grosh M, Glewwe. P. Designing Household Survey Questionnaires for Developing Countries:
Lessons from 15 Years of the Living Standards Measurement Study. Washington, DC: World Bank;
2000 7/11/2011.
100. DeLong DM, DeLong ER, Wood PD, Lippel K, Rifkind BM. A comparison of methods for the
estimation of plasma low- and very low-density lipoprotein cholesterol. The Lipid Research Clinics
Prevalence Study. JAMA. 1986;256(17):2372-7.
101. National Cholesterol Education Program (NCEP). Highlights of the report of the Expert Panel
on Blood Cholesterol Levels in Children and Adolescents. Pediatrics. 1992;89(3):495-501.
102. Taylor RW, Jones IE, Williams SM, Goulding A. Evaluation of waist circumference, waist-to-
hip ratio, and the conicity index as screening tools for high trunk fat mass, as measured by dual-energy
X-ray absorptiometry, in children aged 3-19 y. AmJClinNutr. 2000;72(2):490-5.
103. Zimmet P, Alberti KG, Kaufman F, Tajima N, Silink M, Arslanian S, et al. The metabolic
syndrome in children and adolescents - an IDF consensus report. PediatrDiabetes. 2007;8(5):299-306.
104. Gibson RS, Ferguson EL. An interactive 24-hour recall for assessing the adequacy of iron and
zinc intakes in developing countries. Washington, DC: International Life Sciences Institute. 2008.
List of references
155
105. Greenfield H, Southgate D. Food composition data. Production, management and use, 1992.
Elsevier Applied Science, Barking.
106. National Research Council. Dietary Reference Intakes for Energy, Carbohydrate, Fiber, Fat,
Fatty Acids, Cholesterol, Protein, and Amino Acids (Macronutrients): The National Academies Press;
2005.
107. United States Department of Agriculture U. Dietary guidelines for Americans, 2010 2010.
Available from: www.dietaryguidelines.gov.
108. Guenther PM, Reedy J, Krebs-Smith SM. Development of the healthy eating index-2005.
Journal of the American Dietetic Association. 2008;108(11):1896-901.
109. Workshop on Fruit and Vegetables for Health [Internet]. 2004 [cited 07/01/2012]. Available
from: http://www.who.int/dietphysicalactivity/fruit/en/index.html.
110. Lozada AL, Flores M, Rodríguez S, Barquera S. Patrones dietarios en adolescentes mexicanas.
Una comparación de dos métodos. Encuesta Nacional de Nutrición, 1999. salud pública de méxico.
2007;49(4):263-73.
111. Mozaffarian D, Lemaitre RN, Kuller LH, Burke GL, Tracy RP, Siscovick DS. Cardiac Benefits
of Fish Consumption May Depend on the Type of Fish Meal Consumed: The Cardiovascular Health
Study. Circulation. 2003;107(10):1372-7.
112. Sheard NF, Clark NG, Brand-Miller JC, Franz MJ, Pi-Sunyer FX, Mayer-Davis E, et al. Dietary
Carbohydrate (Amount and Type) in the Prevention and Management of Diabetes A statement by the
American Diabetes Association. Diabetes care. 2004;27(9):2266-71.
113. Lachat C, Khanh LNB, Huynh TTT, Verstraeten R, Nago E, Roberfroid D, et al. Factors
associated with eating out of home in Vietnamese adolescents. Appetite. 2011;57(3):649-55.
114. Ogden CL, Carroll MD, Curtin LR, Lamb MM, Flegal KM. Prevalence of high body mass index
in US children and adolescents, 2007-2008. JAMA. 2010;303(3):242-9.
115. Farajian P, Risvas G, Karasouli K, Pounis GD, Kastorini CM, Panagiotakos DB, et al. Very high
childhood obesity prevalence and low adherence rates to the Mediterranean diet in Greek children: the
GRECO study. Atherosclerosis. 2011;217(2):525-30.

List of references
156
116. Pi-Sunyer FX. The obesity epidemic: pathophysiology and consequences of obesity. ObesRes.
2002;10 Suppl 2(19):97S-104S.
117. McNiece KL, Poffenbarger TS, Turner JL, Franco KD, Sorof JM, Portman RJ. Prevalence of
hypertension and pre-hypertension among adolescents. JPediatr. 2007;150(6):640- 4.
118. Juarez-Rojas JG, Cardoso-Saldana GC, Posadas-Sanchez R, Medina-Urrutia AX, Yamamoto-
Kimura L, Posadas-Romero C. Blood pressure and associated cardiovascular risk factors in adolescents
of Mexico City. ArchCardiolMex. 2008;78(4):384-91.
119. Virdis A, Ghiadoni L, Masi S, Versari D, Daghini E, Giannarelli C, et al. Obesity in the
childhood: a link to adult hypertension. CurrPharmDes. 2009;15(10):1063-71.
120. Reckelhoff JF, Zhang H, Srivastava K. Gender differences in development of hypertension in
spontaneously hypertensive rats: role of the renin-angiotensin system. Hypertension. 2000;35(1 Pt
2):480-3.
121. Adrogué HJ, Madias NE. Sodium and potassium in the pathogenesis of hypertension. New
England Journal of Medicine. 2007;356(19):1966-78.
122. Graudal NA, Hubeck-Graudal T, Jürgens G. Effects of low-sodium diet vs. high-sodium diet on
blood pressure, renin, aldosterone, catecholamines, cholesterol, and triglyceride (Cochrane Review).
American journal of hypertension. 2012;25(1):1-15.
123. Candido AP, Benedetto R, Castro AP, Carmo JS, Nicolato RL, Nascimento-Neto RM, et al.
Cardiovascular risk factors in children and adolescents living in an urban area of Southeast of Brazil:
Ouro Preto Study. EurJPediatr. 2009;168(11):1373-82.
124. Milos C, Casanueva V, Campos R, Cid X, Silva V, Rodriguez W, et al. [Risk factors of
cardiovascular disease in a Chilean school population: I: Blood lipids in 552 children and adolescents
6-15 years of age]. RevChilPediatr. 1990;61(2):67-73.
125. Yamamoto-Kimura L, Posadas-Romero C, Posadas-Sanchez R, Zamora-Gonzalez J, Cardoso-
Saldana G, Mendez R, I. Prevalence and interrelations of cardiovascular risk factors in urban and rural
Mexican adolescents. JAdolescHealth. 2006;38(5):591-8.

List of references
157
126. Marinou K, Tousoulis D, Antonopoulos AS, Stefanadi E, Stefanadis C. Obesity and
cardiovascular disease: from pathophysiology to risk stratification. Int J Cardiol. 2010;138(1):3-8.
127. Yngve A, Wolf A, Poortvliet E, Elmadfa I, Brug J, Ehrenblad B, et al. Fruit and vegetable intake
in a sample of 11-year-old children in 9 European countries: The Pro Children Cross-sectional Survey.
Ann Nutr Metab 2005. 2006;49(4):236-45.
128. Larrea C, Warnars L. Ecuador's Yasuni-ITT Initiative: Avoiding emissions by keeping
petroleum underground. Energy for Sustainable Development. 2009;13(3):219-23.
129. Hur IY, Reicks M. Relationship between Whole-Grain Intake, Chronic Disease Risk Indicators,
and Weight Status among Adolescents in the National Health and Nutrition Examination Survey, 1999-
2004. Journal of the Academy of Nutrition and Dietetics. 2012;112(1):46-55.
130. Kelly JH, Sabaté J. Nuts and coronary heart disease: an epidemiological perspective. British
Journal of Nutrition. 2006;96(S2):S61-S7.
131. Lim SS, Vos T, Flaxman AD, Danaei G, Shibuya K, Adair-Rohani H, et al. A comparative risk
assessment of burden of disease and injury attributable to 67 risk factors and risk factor clusters in 21
regions, 1990?2010: a systematic analysis for the Global Burden of Disease Study 2010. The Lancet.
2012;380(9859):2224-60.
132. Reedy J, Krebs-Smith SM. Dietary sources of energy, solid fats, and added sugars among
children and adolescents in the United States. J Am Diet Assoc. 2010;110(10):1477.
133. Barquera S, Hernandez-Barrera L, Tolentino ML, Espinosa J, Ng SW, Rivera JA, et al. Energy
intake from beverages is increasing among Mexican adolescents and adults. J Nutr. 2008;138(12):2454-
61.
134. Vartanian LR, Schwartz MB, Brownell KD. Effects of soft drink consumption on nutrition and
health: a systematic review and meta-analysis. Journal Information. 2007;97(4).
135. Stuckler D, McKee M, Ebrahim S, Basu S. Manufacturing Epidemics: The Role of Global
Producers in Increased Consumption of Unhealthy Commodities Including Processed Foods, Alcohol,
and Tobacco. PLoS Med. 2012;9(6):e1001235.

List of references
158
136. Yang Q, Zhang Z, Kuklina EV, Fang J, Ayala C, Hong Y, et al. Sodium Intake and Blood
Pressure Among US Children and Adolescents. Pediatrics. 2012;130(4):611-9.
137. Espeland MA, Kumanyika S, Wilson AC, Reboussin DM, Easter L, Self M, et al. Statistical
issues in analyzing 24-hour dietary recall and 24-hour urine collection data for sodium and potassium
intakes. American Journal of Epidemiology. 2001;153(10):996-1006.
138. Geleijnse JM, Grobbee DE. High salt intake early in life: does it increase the risk of
hypertension? Journal of hypertension. 2002;20(11):2121-4.
139. Rebello SA, Koh H, Chen C, Naidoo N, Odegaard AO, Koh W-P, et al. Amount, type, and
sources of carbohydrates in relation to ischemic heart disease mortality in a Chinese population: a
prospective cohort study. The American journal of clinical nutrition. 2014:ajcn. 076273.
140. Li S CWSSR, et al. Childhood cardiovascular risk factors and carotid vascular changes in
adulthood: The bogalusa heart study. JAMA: The Journal of the American Medical Association.
2003;290(17):2271-6.
141. Tirosh A, Shai I, Tekes-Manova D, Israeli E, Pereg D, Shochat T, et al. Normal fasting plasma
glucose levels and type 2 diabetes in young men. New England Journal of Medicine.
2005;353(14):1454-62.
142. de Munter JS, Hu FB, Spiegelman D, Franz M, van Dam RM. Whole grain, bran, and germ
intake and risk of type 2 diabetes: a prospective cohort study and systematic review. PLoS medicine.
2007;4(8):e261.
143. Perez-Cueto FJ, Botti AB, Verbeke W. Prevalence of overweight in Bolivia: data on women
and adolescents. ObesRev. 2009;10(4):373-7.
144. Prentice AM. The emerging epidemic of obesity in developing countries. IntJEpidemiol.
2006;35(1):93-9.
145. Plachta-Danielzik S, Pust S, Asbeck I, Czerwinski-Mast M, Langnase K, Fischer C, et al. Four-
year follow-up of school-based intervention on overweight children: the KOPS study.
Obesity(SilverSpring). 2007;15(12):3159-69.

List of references
159
146. van Sluijs EM, Skidmore PM, Mwanza K, Jones AP, Callaghan AM, Ekelund U, et al. Physical
activity and dietary behaviour in a population-based sample of British 10-year old children: the SPEEDY
study (Sport, Physical activity and Eating behaviour: environmental Determinants in Young people).
BMCPublic Health. 2008;8(1):388.
147. Couch SC, Cross AT, Kida K, Ros E, Plaza I, Shea S, et al. Rapid westernization of children's
blood cholesterol in 3 countries: evidence for nutrient-gene interactions? AmJClinNutr. 2000;72(5
Suppl):1266S-74S.
148. Instituto Nacional de Estadísticas y Censos. Población por área, según provincia, cantón y
parroquia de empadronamiento y grupos étnicos Ecuador: Instituto Nacional de Estadísticas y Censos;
2011 [cited 2012 17/11]. Available from: http://www.inec.gob.ec.
149. Hochberg Z, Feil R, Constancia M, Fraga M, Junien C, Carel JC, et al. Child health,
developmental plasticity, and epigenetic programming. EndocrRev. 2011;32(2):159-224.
150. Baya BA, Perez-Cueto FJ, Vasquez Monllor PA, Kolsteren PW. International BMI-for-age
references underestimate thinness and overestimate overweight and obesity in Bolivian adolescents.
NutrHosp. 2010;25(3):428-36.
151. Astrup A, Dyerberg J, Elwood P, Hermansen K, Hu FB, Jakobsen MU, et al. The role of
reducing intakes of saturated fat in the prevention of cardiovascular disease: where does the evidence
stand in 2010? The American journal of clinical nutrition. 2011;93(4):684-8.
152. Juhola J, Magnussen CG, Berenson GS, Venn A, Burns TL, Sabin MA, et al. Combined Effects
of Child and Adult Elevated Blood Pressure on Subclinical Atherosclerosis The International Childhood
Cardiovascular Cohort Consortium. Circulation. 2013;128(3):217-24.
153. Mozaffarian D, Appel LJ, Van Horn L. Components of a Cardioprotective Diet: New Insights.
Circulation. 2011;123(24):2870-91.
154. Instituto Nacional de Estadísticas y Censos. Presentación Defunciones 2011 Ecuador: Instituto
Nacional de Estadísticas y Censos; 2011 [updated 07/01/2013]. Available from: http://www.inec.gob.ec.
155. Verstraeten R RD, Lachat C, Leroy JL, Holdsworth M, Maes L. Effectiveness of preventive
school-based obesity interventions in low- and middle-income countries: a systematic review. Am J Clin
Nutr 2012 Aug;96.

List of references
160
156. Balzer LB, Petersen ML, van der Laan MJ. Why Match in Individually and Cluster Randomized
Trials? 2012.
157. Onis Md, Onyango AW, Borghi E, Siyam A, Nishida C, Siekmann J. Development of a WHO
growth reference for school-aged children and adolescents. Bulletin of the World Health Organization.
2007;85(9):660-7.
158. World Health Organization. Geneva2009. Available from:
http://www.who.int/growthref/tools/en/.
159. Falkner B, Daniels SR. Summary of the fourth report on the diagnosis, evaluation, and treatment
of high blood pressure in children and adolescents. Hypertension. 2004;44(4):387-8.
160. Instituto Nacional de Estadísticas y Censos. Encuesta de Estratificación del Nivel Socio-
Económico. Ecuador: INEC; 2011.
161. Andrade S, Carl L, Angelica O-A, Roosmarijn V, Lieven H, Dominique R, et al. A school-based
intervention improves physical fitness in Ecuadorian adolescents: a cluster-randomized controlled trial.
International Journal of Behavioral Nutrition and Physical Activity. 2014;11(1):153.
162. Fitzmaurice GM, Laird NM, Ware JH. Applied longitudinal analysis: John Wiley & Sons; 2012.
163. Hellevik O. Linear versus logistic regression when the dependent variable is a dichotomy.
Quality & Quantity. 2009;43(1):59-74.
164. Díaz FFC. Selección de modelos mediante criterios de información en análisis factorial:
aspectos teóricos y computacionales: Editorial de la Universidad de Granada; 2011.
165. Siega-Riz AM, El Ghormli L, Mobley C, Gillis B, Stadler D, Hartstein J, et al. The effects of
the HEALTHY study intervention on middle school student dietary intakes. Int J Behav Nutr Phys Act.
2011;8:7.
166. Knai C, Pomerleau J, Lock K, McKee M. Getting children to eat more fruit and vegetables: A
systematic review. Prev Med. 2006;42(2):85-95.
167. Thomson CA, Ravia J. A systematic review of behavioral interventions to promote intake of
fruit and vegetables. Journal of the American Dietetic Association. 2011;111(10):1523-35.

List of references
161
168. Evans CE, Christian MS, Cleghorn CL, Greenwood DC, Cade JE. Systematic review and meta-
analysis of school-based interventions to improve daily fruit and vegetable intake in children aged 5 to
12 y. The American journal of clinical nutrition. 2012;96(4):889-901.
169. World Health Organization JC, FAO Expert. Diet, nutrition and the prevention of chronic
diseases. WHO technical report series. 2003;916.
170. Jaime PC, Lock K. Do school based food and nutrition policies improve diet and reduce obesity?
Prev Med. 2009;48(1):45-53.
171. Davis JN, Kelly LA, Lane CJ, Ventura EE, Byrd‐Williams CE, Alexandar KA, et al.
Randomized control trial to improve adiposity and insulin resistance in overweight Latino adolescents.
Obesity. 2009;17(8):1542-8.
172. Paineau DL, Beaufils F, Boulier A, Cassuto D-A, Chwalow J, Combris P, et al. Family dietary
coaching to improve nutritional intakes and body weight control: a randomized controlled trial. Archives
of pediatrics & adolescent medicine. 2008;162(1):34-43.
173. WHO opens public consultation on draft sugars guideline. March 5, 2014, (2014).
174. Vandongen R, Jenner DA, Thompson C, Taggart AC, Spickett EE, Burke V, et al. A controlled
evaluation of a fitness and nutrition intervention program on cardiovascular health in 10-year-old to 12-
year-old children. Prev Med. 1995;24(1):9-22.
175. Newby PK, Muller D, Hallfrisch J, Qiao N, Andres R, Tucker KL. Dietary patterns and changes
in body mass index and waist circumference in adults. The American journal of clinical nutrition.
2003;77(6):1417-25.
176. van Stralen MM, Yildirim M, Velde SJt, Brug J, van Mechelen W, Chinapaw MJM. What works
in school-based energy balance behaviour interventions and what does not: A systematic review of
mediating mechanisms. Int J Obes. 2011;35(10):1251-65.
177. Brown T, Summerbell C. Systematic review of school-based interventions that focus on
changing dietary intake and physical activity levels to prevent childhood obesity: an update to the
obesity guidance produced by the National Institute for Health and Clinical Excellence. Obesity reviews:
an official journal of the International Association for the Study of Obesity. 2009;10(1):110-41.

List of references
162
178. Oldroyd J, Burns C, Lucas P, Haikerwal A, Waters E. The effectiveness of nutrition
interventions on dietary outcomes by relative social disadvantage: a systematic review. Journal of
epidemiology and community health. 2008;62(7):573-9.
179. Rothwell PM. Subgroup analysis in randomised controlled trials: importance, indications, and
interpretation. The Lancet. 2005;365(9454):176-86.
180. Sun X, Briel M, Walter SD, Guyatt GH. Is a subgroup effect believable? Updating criteria to
evaluate the credibility of subgroup analyses. Bmj. 2010;340:850-4.
181. Cole TJ, Bellizzi MC, Flegal KM, Dietz WH. Establishing a standard definition for child
overweight and obesity worldwide: international survey. BMJ. 2000;320(7244):1240.
182. Ammerman AS, Lindquist CH, Lohr KN, Hersey J. The efficacy of behavioral interventions to
modify dietary fat and fruit and vegetable intake: a review of the evidence. Prev Med. 2002;35(1):25-
41.
183. Grant A, Treweek S, Dreischulte T, Foy R, Guthrie B. Process evaluations for cluster-
randomised trials of complex interventions: a proposed framework for design and reporting. Trials.
2013;14(1):15.
184. Waters E, de Silva-Sanigorski A, Hall BJ, Brown T, Campbell KJ, Gao Y, et al. Interventions
for preventing obesity in children. Cochrane Database Syst Rev. 2011;12:00.
185. Bouffard JA, Taxman FS, Silverman R. Improving process evaluations of correctional programs
by using a comprehensive evaluation methodology. Evaluation and Program Planning. 2003;26(2):149-
61.
186. Harachi TW, Abbott RD, Catalano RF, Haggerty KP, Fleming CB. Opening the black box: using
process evaluation measures to assess implementation and theory building. American journal of
community psychology. 1999;27(5):711-31.
187. Des Jarlais DC, Lyles C, Crepaz N, the TG. Improving the Reporting Quality of Nonrandomized
Evaluations of Behavioral and Public Health Interventions: The TREND Statement. American Journal
of Public Health. 2004;94(3):361-6.

List of references
163
188. Steckler AB, Linnan L, Israel B. Process evaluation for public health interventions and research:
Jossey-Bass San Francisco; 2002.
189. Rosecrans A, Gittelsohn J, Ho L, Harris S, Naqshbandi M, Sharma S. Process evaluation of a
multi-institutional community-based program for diabetes prevention among First Nations. Health
Education Research. 2008;23(2):272-86.
190. Bere E, Veierød M, Bjelland M, Klepp K. Outcome and process evaluation of a Norwegian
school-randomized fruit and vegetable intervention: Fruits and Vegetables Make the Marks (FVMM).
Health Education Research. 2006;21(2):258-67.
191. De Bock F, Fischer JE, Hoffmann K, Renz-Polster H. A participatory parent-focused
intervention promoting physical activity in preschools: design of a cluster-randomized trial. BMC public
health. 2010;10(1):49.
192. Mukoma W, Flisher AJ, Ahmed N, Jansen S, Mathews C, Klepp K-I, et al. Process evaluation
of a school-based HIV/AIDS intervention in South Africa. Scandinavian Journal of Public Health.
2009;37(2 suppl):37-47.
193. Salmon J, Ball K, Crawford D, Booth M, Telford A, Hume C, et al. Reducing sedentary
behaviour and increasing physical activity among 10-year-old children: overview and process evaluation
of the ‘Switch-Play’intervention. Health promotion international. 2005;20(1):7-17.
194. Wind M, Bjelland M, Perez-Rodrigo C, Te Velde S, Hildonen C, Bere E, et al. Appreciation
and implementation of a school-based intervention are associated with changes in fruit and vegetable
intake in 10-to 13-year old schoolchildren—the Pro Children study. Health education research.
2008;23(6):997-1007.
195. Young D, Steckler A, Cohen S, Pratt C, Felton G, Moe S, et al. Process evaluation results from
a school-and community-linked intervention: the Trial of Activity for Adolescent Girls (TAAG). Health
education research. 2008;23(6):976-86.
196. Saelens BE, Glanz K, Sallis JF, Frank LD. Nutrition Environment Measures Study in restaurants
(NEMS-R): development and evaluation. American journal of preventive medicine. 2007;32(4):273-81.
197. Marmot M, Atinmo T, Byers T, Chen J, Hirohata T, Jackson A, et al. Food, nutrition, physical
activity, and the prevention of cancer: a global perspective. 2007.

List of references
164
198. Tong A, Sainsbury P, Craig J. Consolidated criteria for reporting qualitative research (COREQ):
a 32-item checklist for interviews and focus groups2007 2007-12-01 00:00:00. 349-57 p.
199. Salmivalli C, Kaukiainen A, Voeten M. Anti‐bullying intervention: Implementation and
outcome. British Journal of Educational Psychology. 2005;75(3):465-87.
200. Saunders RP, Ward D, Felton GM, Dowda M, Pate RR. Examining the link between program
implementation and behavior outcomes in the lifestyle education for activity program (LEAP).
Evaluation and program planning. 2006;29(4):352-64.
201. Lytle LA, Murray DM, Perry CL, Story M, Birnbaum AS, Kubik MY, et al. School-based
approaches to affect adolescents’ diets: Results from the TEENS study. Health Education & Behavior.
2004;31(2):270-87.
202. Hingle MD, O'Connor TM, Dave JM, Baranowski T. Parental involvement in interventions to
improve child dietary intake: a systematic review. Prev Med. 2010;51(2):103-11.
203. Van Lippevelde W, Verloigne M, De Bourdeaudhuij I, Bjelland M, Lien N, Fernández-Alvira
JM, et al. What do parents think about parental participation in school-based interventions on energy
balance-related behaviours? A qualitative study in 4 countries. BMC public health. 2011;11(1):881.
204. Van Lippevelde W, Bere E, Verloigne M, van Stralen M, De Bourdeaudhuij I, Lien N, et al.
The role of family-related factors in the effects of the UP4FUN school-based family-focused
intervention targeting screen time in 10- to 12-year-old children: the ENERGY project. BMC Public
Health. 2014;14(1):857.
205. Roberto CA, Swinburn B, Hawkes C, Huang TTK, Costa SA, Ashe M, et al. Patchy progress
on obesity prevention: emerging examples, entrenched barriers, and new thinking. The Lancet.
206. Williams J, Scarborough P, Matthews A, Cowburn G, Foster C, Roberts N, et al. A systematic
review of the influence of the retail food environment around schools on obesity-related outcomes.
Obesity Reviews. 2014;15(5):359-74.
207. Lytle LA, Kubik MY, Perry C, Story M, Birnbaum AS, Murray DM. Influencing healthful food
choices in school and home environments: Results from the TEENS study. Prev Med. 2006;43(1):8-13.

List of references
165
208. Clarke J, Fletcher B, Lancashire E, Pallan M, Adab P. The views of stakeholders on the role of
the primary school in preventing childhood obesity: a qualitative systematic review. Obesity Reviews.
2013;14(12):975-88.
209. García AM. Evaluation of the changes in the nutritional quality of the meals offered by nine
school food tuck shops in Cuenca, Ecuador after the ACTIVITAL school-based intervention. 2013.
210. Eldridge S, Ashby D, Bennett C, Wakelin M, Feder G. Internal and external validity of cluster
randomised trials: systematic review of recent trials2008 2008-04-17 22:01:31. 876-80 p.
211. Glasgow RE, McKay HG, Piette JD, Reynolds KD. The RE-AIM framework for evaluating
interventions: what can it tell us about approaches to chronic illness management? Patient education and
counseling. 2001;44(2):119-27.
212. Glasgow RE, Vogt TM, Boles SM. Evaluating the public health impact of health promotion
interventions: the RE-AIM framework. American Journal of Public Health. 1999;89(9):1322-7.
213. Oakley A, Strange V, Bonell C, Allen E, Stephenson J. Process evaluation in randomised
controlled trials of complex interventions. Bmj. 2006;332(7538):413-6.
214. Bonell C, Oakley A, Hargreaves J, Strange V, Rees R. Assessment of generalisability in trials
of health interventions: suggested framework and systematic review2006 2006-08-10 22:00:24. 346-9
p.
215. Godwin M, Ruhland L, Casson I, MacDonald S, Delva D, Birtwhistle R, et al. Pragmatic
controlled clinical trials in primary care: the struggle between external and internal validity. BMC
Medical Research Methodology. 2003;3(1):28.
216. Neira Mosquera JA, Pérez Rodríguez F, Sánchez-Llaguno S, Moreno Rojas R. Study on the
mortality in Ecuador related to dietary factors. 2013.
217. Rennie KL, Johnson L, Jebb SA. Behavioural determinants of obesity. Best Practice & Research
Clinical Endocrinology & Metabolism. 2005;19(3):343-58.
218. Moore L, Moore GF. Public health evaluation: which designs work, for whom and under what
circumstances? Journal of Epidemiology and Community Health. 2011;65(7):596-7.

List of references
166
219. Lachat C, Nago E, Roberfroid D, Holdsworth M, Smit K, Kinabo J, et al. Developing a
Sustainable Nutrition Research Agenda in Sub-Saharan Africa—Findings from the SUNRAY Project.
PLoS Med. 2014;11(1):e1001593.
220. Williams A, Henley W, Williams C, Hurst A, Logan S, Wyatt K. Systematic review and meta-
analysis of the association between childhood overweight and obesity and primary school diet and
physical activity policies. International Journal of Behavioral Nutrition and Physical Activity.
2013;10(1):101.
221. Reglamento sanitario de etiquetado de alimentos procesados para el consumo humano,
00004522 (2013).
222. Borgmeier I, Westenhoefer J. Impact of different food label formats on healthiness evaluation
and food choice of consumers: a randomized-controlled study. BMC Public Health. 2009;9(1):184.
223. Cecchini M, Sassi F, Lauer JA, Lee YY, Guajardo-Barron V, Chisholm D. Tackling of
unhealthy diets, physical inactivity, and obesity: health effects and cost-effectiveness. The Lancet.
2010;376(9754):1775-84.
224. Diario El Tiempo. Comida chatarra en la mira del Gobierno. Diario El Tiempo. 2014
04/09/2014.
225. Powell LM, Chriqui JF, Khan T, Wada R, Chaloupka FJ. Assessing the potential effectiveness
of food and beverage taxes and subsidies for improving public health: a systematic review of prices,
demand and body weight outcomes. Obesity Reviews. 2013;14(2):110-28.
226. Listado de nacionalidades y pueblos indígenas del Ecuador [Internet]. [cited 03/01/2014].
Available from: http://www.siise.gob.ec/siiseweb/.
227. Cazar J, Astudillo J, de Azuay GP. Situación de salud de Nabón, provincia de Azuay y los
objetivos de desarrollo del milenio relacionados con la salud-2007. Situación de salud de Nabón,
provincia de Azuay y los objetivos de desarrollo del milenio relacionados con la salud-2007: OPS; 2006.
228. Prior D. Decolonising research: a shift toward reconciliation. Nursing Inquiry. 2007;14(2):162-
8.
List of references
167
229. Frison EA, Cherfas J, Hodgkin T. Agricultural biodiversity is essential for a sustainable
improvement in food and nutrition security. Sustainability. 2011;3(1):238-53.
230. Rothwell PM. External validity of randomised controlled trials:“to whom do the results of this
trial apply?”. The Lancet. 2005;365(9453):82-93.
231. Ministerio de Salud Pública del Ecuador. Unidad de Nutrición Quito-Ecuador [cited 2014
04/12/2014]. Available from: http://www.salud.gob.ec/unidad-de-nutricion/.
232. World Health Organization. Ecuador 2014 [cited 2014 04/12/2014]. Available from:
http://www.who.int/countries/ecu/en/.
233. Ioannidis JP, Evans SJ, Gøtzsche PC, O'neill RT, Altman DG, Schulz K, et al. Better reporting
of harms in randomized trials: an extension of the CONSORT statement. Annals of internal medicine.
2004;141(10):781-8.

168

169
Curriculum vitae

170
Curriculum vitae
171
Personal information:
Surname: Ochoa Avilés
Name: Angélica
Middle name: María
Place of birth: Cuenca-Ecuador
Date of birth: 23/01/1983
Mail address: Manuel Quiroga y Francisco Ascazubi, Edificio Olimpo, Cuenca-Ecuador
Phone: +593 (7) 4078381
E-mail: [email protected], [email protected]
Education
2006 M.D. Universidad de Cuenca, Cuenca-Ecuador
2010 Certificate on Didactics for Health Science. Universidad de Cuenca, Cuenca-Ecuador
Scientific contributions
International A1 publications
Andrade S, Lachat C, Ochoa-Avilés A, Verstraeten R, Huybregts L, Roberfroid D, et al. A school-based
intervention improves physical fitness in Ecuadorian adolescents: a cluster-randomized controlled trial.
International Journal of Behavioral Nutrition and Physical Activity. 2014;11(1):153.
Ochoa-Aviles A, Verstraeten R, Lachat C, Andrade S, Van Camp J, Donoso S, et al. Dietary intake
practices associated with cardiovascular risk in urban and rural Ecuadorian adolescents: a cross-sectional
study. BMC Public Health. 2014;14(1):939.
Andrade S, Ochoa-Aviles A, Lachat C, Escobar P, Verstraeten R, Van Camp J, et al. Physical fitness
among urban and rural Ecuadorian adolescents and its association with blood lipids: a cross sectional
study. BMC Pediatrics. 2014;14(1):106.
Verstraeten R, Van Royen K, Ochoa-Avilés A, Penafiel D, Holdsworth M, Donoso S, et al. A
Conceptual Framework for Healthy Eating Behavior in Ecuadorian Adolescents: A Qualitative Study.
PLOS ONE. 2014;9(1):e87183.

Curriculum vitae
172
Van Royen K, Verstraeten R, Andrade S, Ochoa-Avilés A, Donoso S, Maes L, et al. Factors Affecting
Physical Activity in Ecuadorian Adolescents: A Focus Group Study. Journal of physical activity &
health. 2014.
Verstraeten R, Lachat C, Ochoa-Avilés A, Hagströmer M, Huybregts L, Andrade S, et al. Predictors of
validity and reliability of a physical activity record in adolescents. BMC Public Health. 2013;13:1109.
Ochoa‐ Avilés A, Andrade S, Huynh T, Verstraeten R, Lachat C, Rojas R, et al. Prevalence and
socioeconomic differences of risk factors of cardiovascular disease in Ecuadorian adolescents. Pediatric
Obesity. 2012;7(4):274-83.
Books
Verstraeten R and Ochoa-Avilés A. Educational tool-kit on physical activity and nutrition to promote
health in school-going adolescents aged 11-15 years old)
Oral and poster presentation in international conferences
“Validity of physical activity diary in assessing sedentary activity among Ecuadorian adolescents.” II
World Congress of Public Health Nutrition. Oporto-Portugal, September 2010, Poster.
“Pilot study to develop a food composition database for a Southern region of Ecuador.” 9th International
Food Data Conference. Norwich-England. December 2011. Poster
“Asociación entre el sobrepeso y obesidad con la aptitud física (EUROFIT) y el nivel socioeconómico
en alumnos de 8º a 10 º grado de educación básica. Cuenca- Ecuador (2008-2009).” Expomotricidad
2011. Universidad de Antioquia, Medellín-Colombia. November 2011. Oral presentation
“Symposium Challenges and Perspectives on School-Based Obesity Prevention Programmes in Low-
And Middle-Income Countries, A School-Based Health Promotion Intervention in Ecuadorian
Adolescents: A Process Evaluation.” The Annual Meeting of the International Society for Behavioral
Nutrition and Physical Activity. Ghent-Belgium. May 2013, Oral presentation
“Physical fitness performance in adolescents from an urban and a rural area of Ecuador.” The Annual
Meeting of the International Society for Behavioral Nutrition and Physical Activity. Ghent, Belgium.
May 2013. Poster
“Results from a structural equation analysis on factors influencing eating behaviours in Ecuadorian
adolescents." The Annual meeting of the International Society for Behavioral Nutrition and Physical
Activity. San Diego-California-USA. May 2014. Oral presentation