UNIVERSIDAD TÉCNICA DEL NORTE -...
16
UNIVERSIDAD TÉCNICA DEL NORTE FACULTAD DE INGENIERÍA EN CIENCIAS APLICADAS CARRERA DE INGENIERÍA EN MECATRÓNICA INFORME TÉCNICO “SISTEMA AUTOMATIZADO ALIMENTADO CON ENERGÍA FOTOVOLTAICA PARA EL CONTROL DE NIVEL Y RECAMBIOS DE AGUA EN ESTANQUES DESTINADOS AL CULTIVO DE TILAPIA MEJORANDO LA SANIDAD ACUICOLA” AUTOR: DARÍO JAVIER LAGOS YÉPEZ DIRECTOR: ING. ZAMIR MERA IBARRA – ECUADOR 2015
Transcript of UNIVERSIDAD TÉCNICA DEL NORTE -...
UNIVERSIDAD TÉCNICA DEL NORTE
FACULTAD DE INGENIERÍA EN CIENCIAS APLICADAS
CARRERA DE INGENIERÍA EN MECATRÓNICA
INFORME TÉCNICO
“SISTEMA AUTOMATIZADO ALIMENTADO CON ENERGÍA FOTOVOLTAICA
PARA EL CONTROL DE NIVEL Y RECAMBIOS DE AGUA EN ESTANQUES
DESTINADOS AL CULTIVO DE TILAPIA MEJORANDO LA SANIDAD
ACUICOLA”
AUTOR: DARÍO JAVIER LAGOS YÉPEZ
DIRECTOR: ING. ZAMIR MERA
IBARRA – ECUADOR
2015

1
SISTEMA AUTOMATIZADO ALIMENTADO CON
ENERGÍA FOTOVOLTAICA PARA EL CONTROL DE NIVEL
Y RECAMBIOS DE AGUA DE EN ESTANQUES DESTINADOS
AL CULTIVO DE LA TILAPIA
Darío LAGOS1, Zamir MERA
2
1Darío Lagos, egresado de la carrera de Ingeniería en Mecatrónica de la Universidad Técnica del Norte, Ibarra - Ecuador, ([email protected]) 2Zamir Mera, profesor en la Universidad Técnica del Norte, Ibarra - Ecuador, ([email protected])
Resumen 2. Sistema Fotovoltaico
Este documento describe el sistema automatizado
que controla los recambios de agua de los
estanques cada determinado tiempo configurado
previamente, ó en función de la temperatura si
este sobrepasa el límite predefinido. Para los
recambios de agua, el sistema controla el giro de
las válvulas de salida y entrada en función de los
niveles de agua y en función de los dispositivos
que indican la posición de las válvulas. El
sistema automatizado cuenta con energía
producida por un sistema fotovoltaico.
Palabras Clave: Control nivel, Control
Temperatura, Energía Solar.
2.1 Análisis previo para el diseño
En los sistemas fotovoltaicos el inicio es saber
con cuanta energía solar se dispone en la zona que
se va a instalar el sistema, basándose en datos de
radiación solar y realizando una estimación de la
radiación solar.
En el caso del sector del Carchi nos ubicamos en el
cuadrante de coordenadas de latitud 0 y longitud -
78, hay una base de datos anual de una
investigación que CONELEC realizó para esta
actividad. Tenemos como dato que en este
cuadrante hay una alta insolación global anual en el
peor mes de 4.235 Kw*h/m2*d
1.Introducción
En la actualidad el cultivo de la tilapia es
realizado sin ningún tipo de control produciendo
enfermedades originados por algunos factores,
primero por no contar con un recambio aceptable
de agua en los estanques de producción por lo que
es importante mantener el hábitat del pez
apropiado para su mejor desarrollo con los
recambios de agua, manteniendo los niveles de
oxigeno adecuados, también es importante la
temperatura porque afecta directamente el
ambiente en el que se desarrolla.
2
2.2 Demanda energética La cantidad de energía utilizada para el
funcionamiento de todo el sistema fotovoltaico.
Tabla 1
Consumo de energía total DC
Elemento Energía
Consumida (W h /día)
Motores DC 0.8964
Circuitos con µC 6.43
Circuito con relés 0.1
Pantalla TD Logo 18.72
Módulo DM8 33.6
Módulo AM2 RTD 11.52
Interruptores de Nivel 0.2
Energía total
consumida 71,37
El total de la demanda energética en el cual está
incluido las pérdidas de cada elemento
(controlador de carga, batería, etc.) es de 92.8 Wh
/ día.
2.3 Dimensionamiento de los elementos
Determinación de la carga en Ah/día
𝐶𝑡 = 𝐸𝑎𝑐𝑢/𝑉𝑎𝑐𝑢 (1)
Dimensionamiento de la batería
𝐶𝐵 = (𝐿 ∗ 𝑁)/𝑃𝑑 (2)
Dimensionamiento de los paneles
𝑁𝑇 = 𝐸/(𝑃𝑚𝑝𝑝 ∗ 𝐻. 𝑆.𝑃. ∗ 𝑃𝑅) (3)
Dimensionamiento del controlador de carga
𝐼𝑚𝑎𝑥𝐶 = 𝑁𝑝𝑝 ∗ 𝐼𝑐𝑐 (4)
Tabla 2
Elementos fotovoltaicos
Elementos Información
Batería 42, 45 Ah
Controlador de carga 10 A
Panel solar 12V / 50 W
Tabla 3
Elementos de protección
Elementos Información
Fusible 20A
Breaker principal 10A
Breaker Panel Solar 6 A
Los valores de algunos elementos tuvieron que ser
aproximados a las capacidades que tiene el
fabricante o que haya en el mercado.
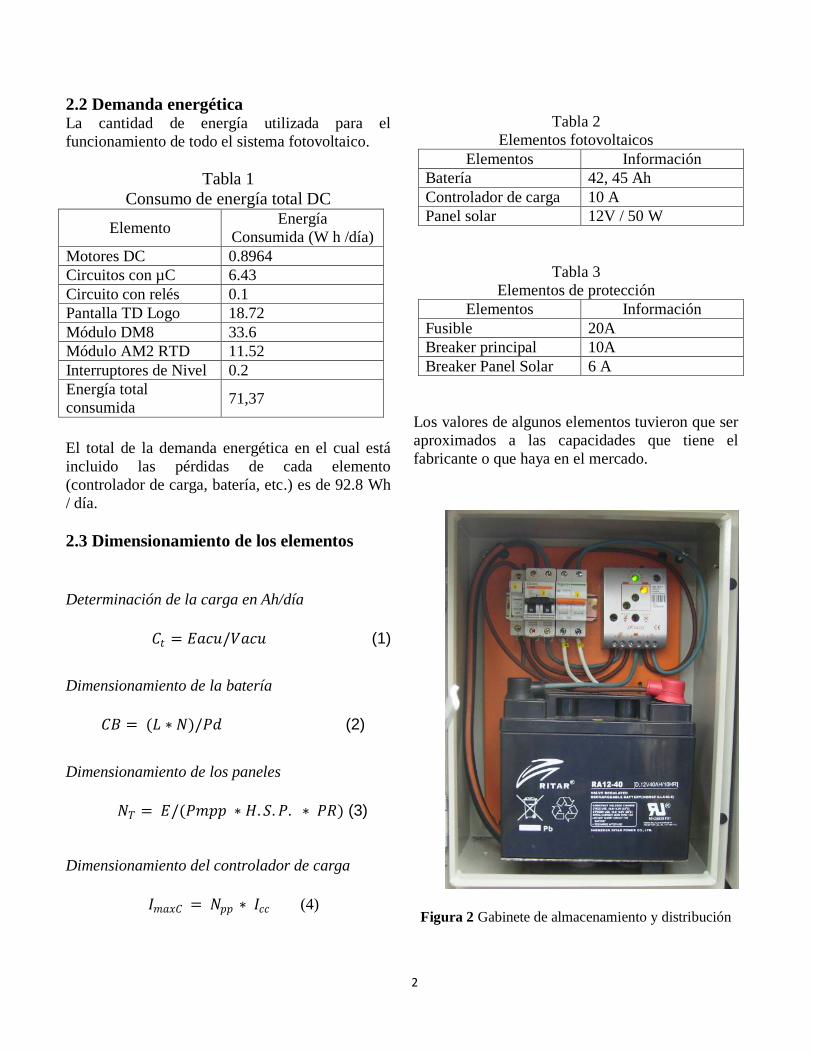
Figura 2 Gabinete de almacenamiento y distribución
3
3. Diseño de collarín de la válvula y
reductor El control de la válvula se realiza con la
utilización de una adaptación que permite acoplar
el motor, el encoder y reductor con la válvula
manual.
Figura 3Diseño de adaptación y sus elementos
Mediante un torquímetro se obtuvo de manera
experimental el momento de rotación aproximado
de 4Nm.
3.1 Dimensionamiento del reductor
Tabla 4
Características de elementos del reductor
Elemento Característica
Engranaje 43 dientes
Piñón 9 dientes
Diámetro de engranaje 80mm
Diámetro de piñón 24 mm
Índice de transmisión
𝑖 = 𝑑𝑏 / 𝑑𝑎 (5)
Torque de salida
𝑇𝑚𝑜𝑡𝑜𝑟 ∗ 𝑖 = 𝑇𝑟𝑢𝑒𝑑𝑎 𝑐𝑜𝑛𝑑𝑢𝑐𝑖𝑑𝑎 (6)
Fuerza tangencial transmitida
𝐹𝑡 =60𝑃
2𝜋𝑅𝑛 (7)
Tabla 5
Magnitudes calculadas del reductor
Información Valor
Fuerza tangencial
transmitida 365.85N
Torque de salida 14.63Nm
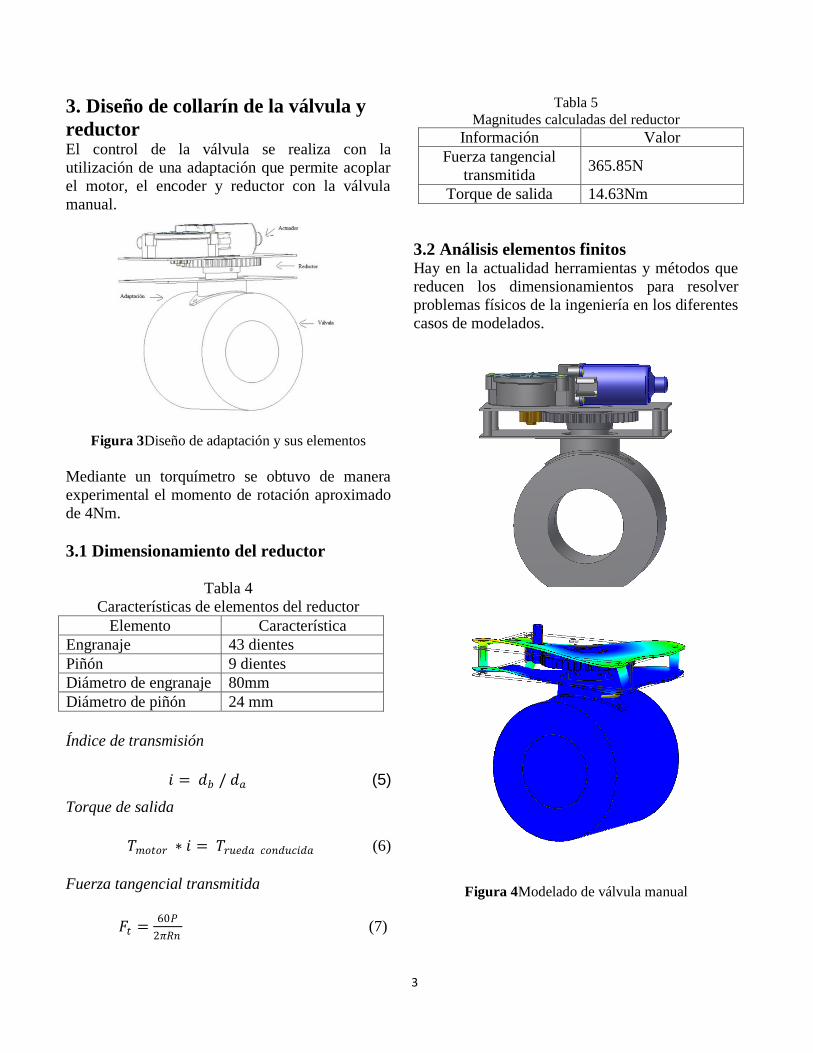
3.2 Análisis elementos finitos Hay en la actualidad herramientas y métodos que
reducen los dimensionamientos para resolver
problemas físicos de la ingeniería en los diferentes
casos de modelados.
Figura 4Modelado de válvula manual
4
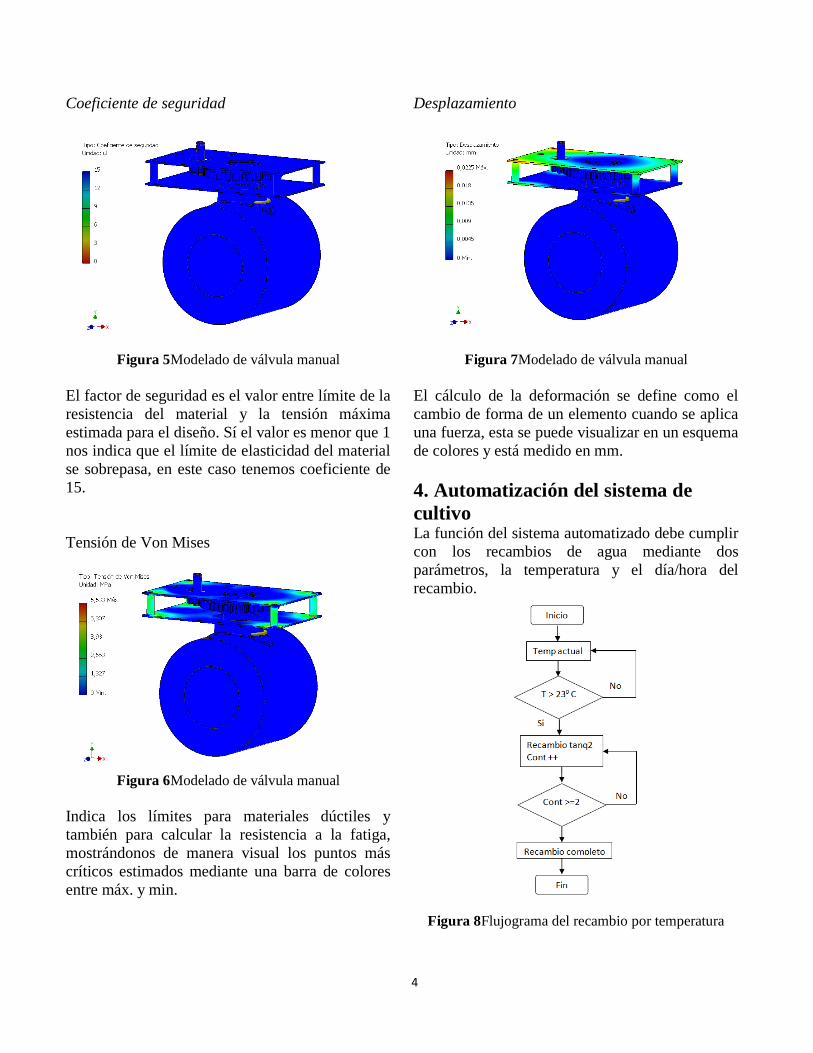
Coeficiente de seguridad
Figura 5Modelado de válvula manual
El factor de seguridad es el valor entre límite de la
resistencia del material y la tensión máxima
estimada para el diseño. Sí el valor es menor que 1
nos indica que el límite de elasticidad del material
se sobrepasa, en este caso tenemos coeficiente de
15.
Tensión de Von Mises
Figura 6Modelado de válvula manual
Indica los límites para materiales dúctiles y
también para calcular la resistencia a la fatiga,
mostrándonos de manera visual los puntos más
críticos estimados mediante una barra de colores
entre máx. y min.
Desplazamiento
Figura 7Modelado de válvula manual
El cálculo de la deformación se define como el
cambio de forma de un elemento cuando se aplica
una fuerza, esta se puede visualizar en un esquema
de colores y está medido en mm.
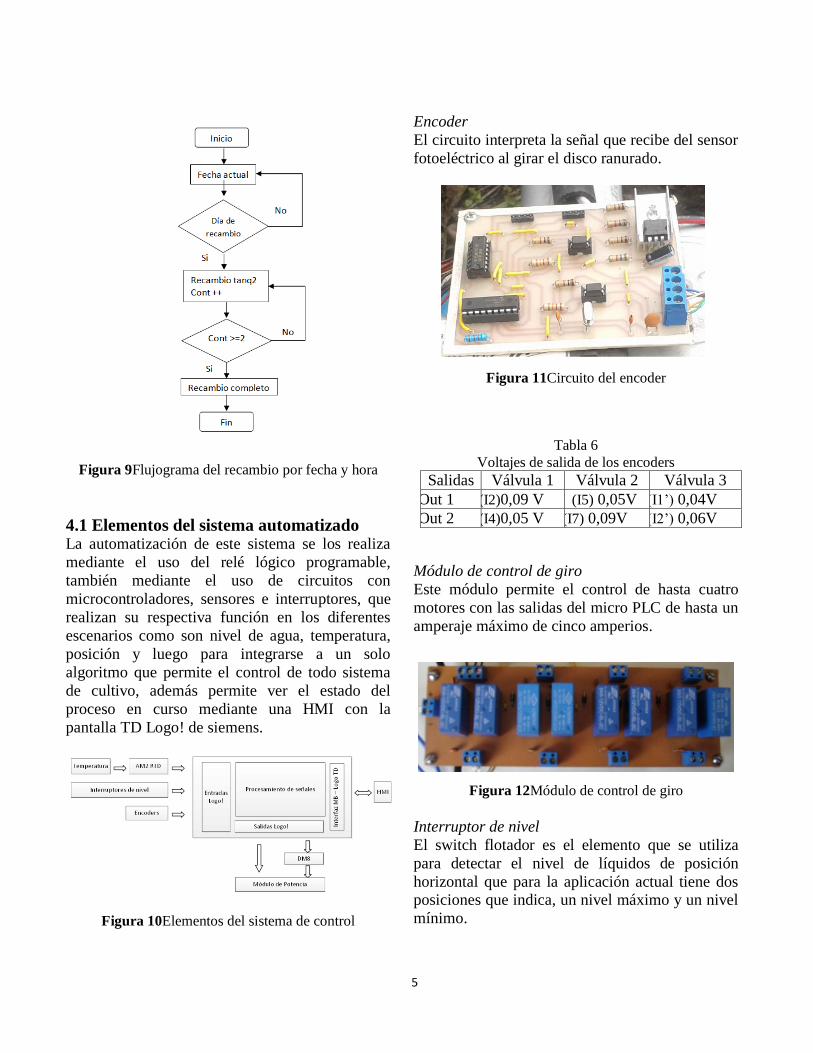
4. Automatización del sistema de
cultivo La función del sistema automatizado debe cumplir
con los recambios de agua mediante dos
parámetros, la temperatura y el día/hora del
recambio.
Figura 8Flujograma del recambio por temperatura
5
Figura 9Flujograma del recambio por fecha y hora
4.1 Elementos del sistema automatizado La automatización de este sistema se los realiza
mediante el uso del relé lógico programable,
también mediante el uso de circuitos con
microcontroladores, sensores e interruptores, que
realizan su respectiva función en los diferentes
escenarios como son nivel de agua, temperatura,
posición y luego para integrarse a un solo
algoritmo que permite el control de todo sistema
de cultivo, además permite ver el estado del
proceso en curso mediante una HMI con la
pantalla TD Logo! de siemens.
Figura 10Elementos del sistema de control
Encoder
El circuito interpreta la señal que recibe del sensor
fotoeléctrico al girar el disco ranurado.
Figura 11Circuito del encoder
Tabla 6
Voltajes de salida de los encoders
Salidas Válvula 1 Válvula 2 Válvula 3
Out 1 (I2)0,09 V (I5) 0,05V (I1’) 0,04V
Out 2 (I4)0,05 V (I7) 0,09V (I2’) 0,06V
Módulo de control de giro
Este módulo permite el control de hasta cuatro
motores con las salidas del micro PLC de hasta un
amperaje máximo de cinco amperios.
Figura 12Módulo de control de giro
Interruptor de nivel
El switch flotador es el elemento que se utiliza
para detectar el nivel de líquidos de posición
horizontal que para la aplicación actual tiene dos posiciones que indica, un nivel máximo y un nivel
mínimo.

6
Figura 13Interruptor flotador
Gabinetes de la instalación
En la instalación están el gabinete uno en donde
están los equipos de almacenamiento y
distribución de energía y sus protecciones, en el
gabinete dos en donde están las protecciones para
los elementos de control (micro PLC logo, módulo
de control de giro, módulos de ampliación),
además cuenta con una HMI y pulsadores de
inicio y paro de emergencia.
Figura14Instalaciones del sistema automatizado
HMI con pantalla TD Logo
En la pantalla podemos verificar la temperatura
actual a la que se encuentra el estanque, los días y
hora en que se va a realizar el recambio.
Figura 15Estado de Estanque 1
Figura 16Estado de estanque 2
Figura 17Temperatura actual estanque 2
Figura 18Días y hora del recambio automático
7
5. Conclusiones El sistema fotovoltaico permite poner en marcha
el control de recambios automático sin necesidad
de tendidos eléctricos, ni transformadores.
Además tiene la posibilidad de ampliación para
suministrar más energía.
El reductor es una solución más económica y
eficiente para este tipo de aplicaciones sencillas
que adaptadas a las válvulas permiten ahorrar
recursos y mejorar procesos.
El interruptor de nivel es la mejor opción para este
tipo de aplicación ya que al momento de medir el
nivel con las perturbaciones en el agua no hay
variaciones en la señal de salida
El encoder diseñado para detectar la posición de la
válvula entre 00 y 90
0 puede ser ampliado para
más precisión mediante la variación del programa.
El TD Logo! nos permite dar el seguimiento del
proceso de manera que no sea necesario la
inspección in-situ de toda el área en donde está el
sistema automatizado cada vez que se necesite
revisar el estado del proceso (temperatura).
El relé lógico programable permite el control de
cuatro motores pero si es necesario el control de
más válvulas, únicamente se amplía el programa y
se añade un módulo de ampliación con salidas de
relé.
6. Agradecimiento Agradezco a toda mi familia, amigos que
siempre han sido mi fortaleza y mi guía.
Referencias
[1] COLLAGUAZO,G.
“SistemasMicroprocesados”.
[2] García, M. “Energía solar fotovoltaica y
cooperación al desarrollo”. España: IEPALA
editorial. 1999.
[3] Jütz H., Scharkus E. &Lobert R. “Tablas
para la industria metalúrgica”. España:
Reverté. 1984.
[4] Díaz T. & Carmona G. “Instalaciones
solares fotovoltaicas”. Madrid: McGraw-
Hill. 2010.
[5] Siemens. (2003). Logo! Manual. Recuperado
de
https://cache.automation.siemens.com/dnl/zQ
/zQ1ODg5AAAA_16527461_HB/Logo_s.pd
f
[6] Atmospheric Science Data Center. Surface
meteorology and Solar Energy. Recuperado
de
https://eosweb.larc.nasa.gov/cgibin/sse/retscr
een.cgi?email=rets%40nrcan.gc.ca&step=1&
lat=0&lon=-78&submit=Submit
[7] CIE. (2008, 08). Atlas solar del Ecuador.
Recuperado de
http://www.conelec.gob.ec/archivos_articulo/
Atlas.pdf
[8] Lovshll. (2005, 08, 05). Raceway cultura of
tilapia. Auburn University. Recuperado de
http://www.ag.auburn.edu/fish/image_gallery
/details.php?image_id=1298
[9] Joe Holz. (02, 08). Kasco Marine Aerators in
Intensive Tilapia Farming. Kasco.
Recuperado de
http://www.kascomarine.com/kasco-marine-
aerators-in-intensive-tilapia-farming/
TECHNICAL UNIVERSITY OF NORTH
FACULTY OF ENGINNERING APPLIED SCIENCE
MECHATRONICS ENGINNERING CAREER
TECHNICAL REPORT
“AUTOMATED SYSTEM FED BY PHOTOVOLTAIC ENERGY FOR THE
CONTROL OF LEVEL AND RECHANGES OF WATER IN PONDS DESTINED
TOTHE CULTURE OF TILAPIA IMPROVINGTHEHEALTH ACUACULTURE”
AUTHOR: DARÍO JAVIER LAGOS YÉPEZ
DIRECTOR: ING. ZAMIR MERA
IBARRA – ECUADOR
2015
1
AUTOMATED SYSTEM FED BY PHOTOVOLTAIC
ENERGY FOR THE CONTROL OF LEVEL AND
RECHANGES OF WATER IN PONDS DESTINED TO THE
CULTURE OF TILAPIA IMPROVING THE HEALTH
ACUACULTURE
Darío LAGOS3, Zamir MERA
4
3Darío Lagos, graduate of the mechatronics enginnering career of the technical university of north, Ibarra - Ecuador, ([email protected]) 4ZamirMera, teacher in the technical university of north, Ibarra - Ecuador, ([email protected])
Abstract 2. Photovoltaic system
This document describes the automated system
constructed for controlling replacement of pond
water every determined time configured
previously or in function on temperature if exceed
the predefined limit. For the replacement of pond
water control valve position the system controls
the rotation of the outlet and in let valves
according to the water levels and function devices
indicating the position of the valves. The
automated system has its energy produced by a
photovoltaic system.
Key words: Level control, Temperature control,
Sun energy.
2.1 Previous analysis for design
In the photovoltaics systems, the start is knowing
how much solar energy is available in the area that
is to install the system, based on solar radiation data
and making an estimate of the solar radiation.
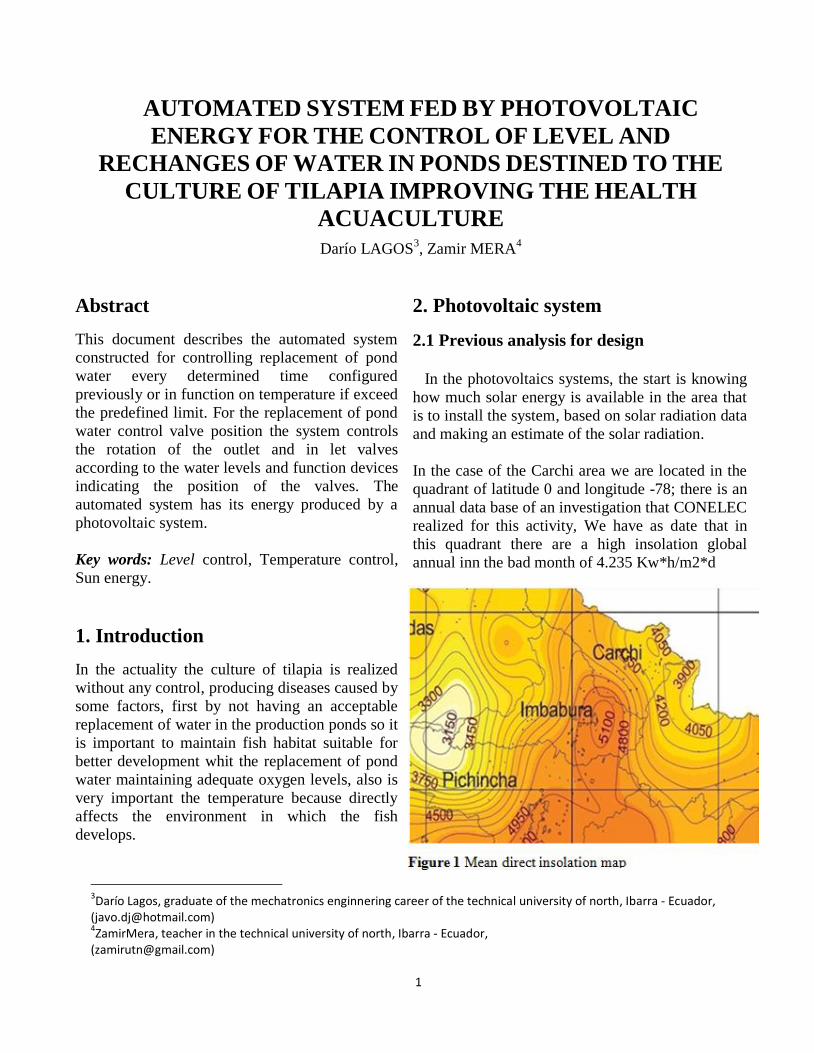
In the case of the Carchi area we are located in the
quadrant of latitude 0 and longitude -78; there is an
annual data base of an investigation that CONELEC
realized for this activity, We have as date that in
this quadrant there are a high insolation global
annual inn the bad month of 4.235 Kw*h/m2*d
1. Introduction
In the actuality the culture of tilapia is realized
without any control, producing diseases caused by
some factors, first by not having an acceptable
replacement of water in the production ponds so it
is important to maintain fish habitat suitable for
better development whit the replacement of pond
water maintaining adequate oxygen levels, also is
very important the temperature because directly
affects the environment in which the fish
develops.
2
2.2 Energy demand The quantity of energy used for the operation of
the all system.
Table 1
Total energy dc consumption
Element Energy
Consumed (W h /día)
DC Motor 0.8964
Circuit swith µC 6.43
Circuit with relay 0.1
Logo text display 18.72
Module DM8 33.6
Module AM2 RTD 11.52
Switch of level 0.2
Energy total consumed 71,37
The total of energy demand included the electrical
losses of each element (Charge controller, battery,
etc) is 92.8 Wh / day.
2.3 Dimensioning of the elements
Dimensioning of the charge in Ah/day
𝐶𝑡 = 𝐸𝑎𝑐𝑢/𝑉𝑎𝑐𝑢 (1)
Dimensioning of the battery
𝐶𝐵 = (𝐿 ∗ 𝑁)/𝑃𝑑 (2)
Dimensioning of the solar panel
𝑁𝑇 = 𝐸/(𝑃𝑚𝑝𝑝 ∗ 𝐻. 𝑆.𝑃. ∗ 𝑃𝑅) (3)
Dimensioning of the Charge controller
𝐼𝑚𝑎𝑥𝐶 = 𝑁𝑝𝑝 ∗ 𝐼𝑐𝑐 (4)
Table 2
Elemets photovoltaics
Table 3
Elements of protection
Elements Information
Fuse 20A
Main breaker 10A
Breaker Solar Panel 6 A
The values of some elements had to be
approximated to the capability that has the
manufacturer, or market.
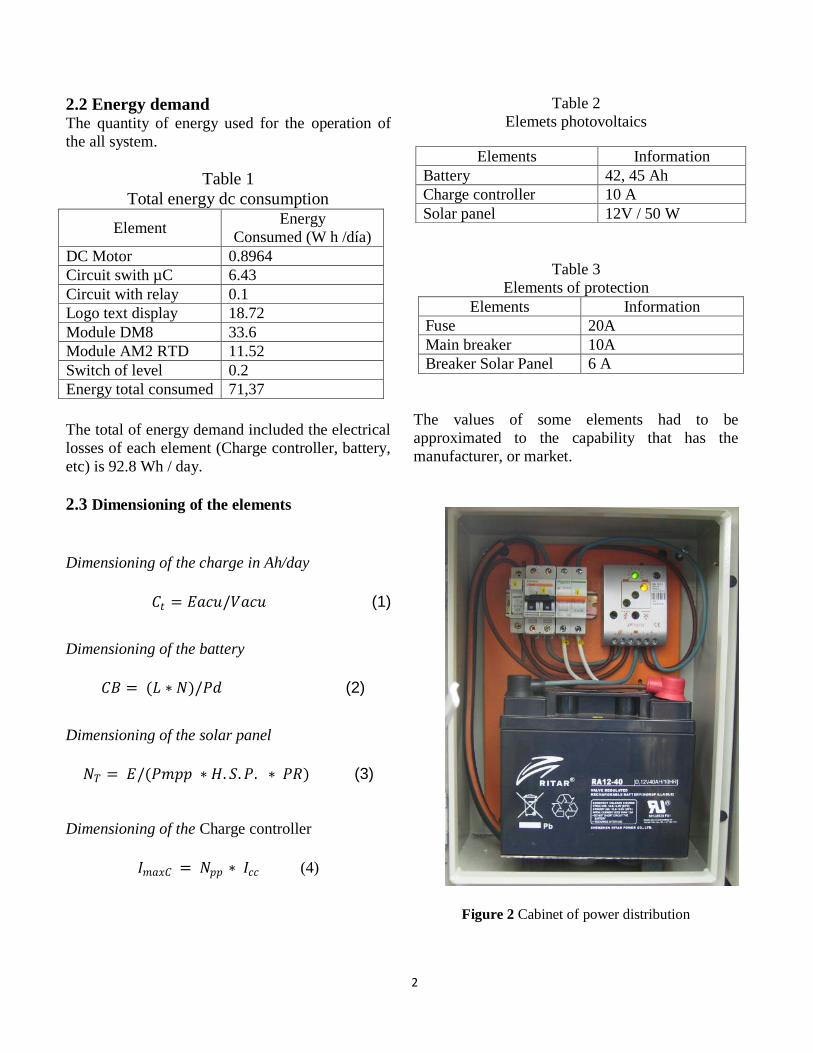
Figure 2 Cabinet of power distribution
Elements Information
Battery 42, 45 Ah
Charge controller 10 A
Solar panel 12V / 50 W
3
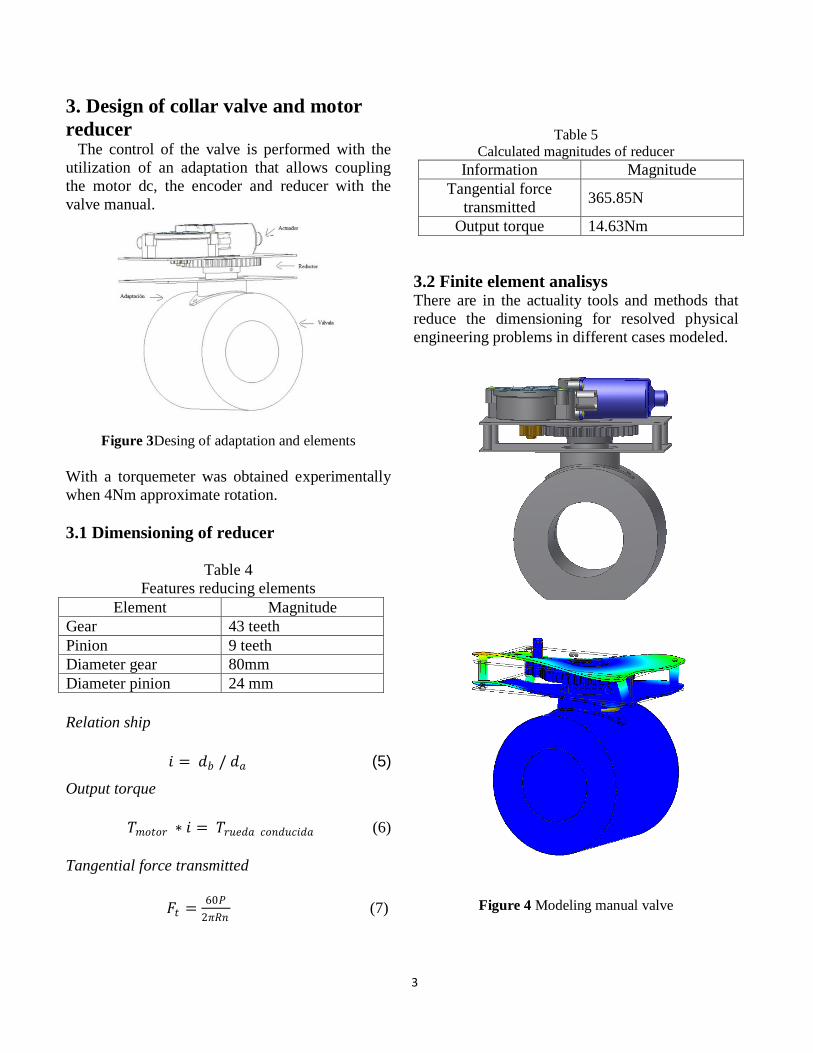
3. Design of collar valve and motor
reducer The control of the valve is performed with the
utilization of an adaptation that allows coupling
the motor dc, the encoder and reducer with the
valve manual.
Figure 3Desing of adaptation and elements
With a torquemeter was obtained experimentally
when 4Nm approximate rotation.
3.1 Dimensioning of reducer
Table 4
Features reducing elements
Element Magnitude
Gear 43 teeth
Pinion 9 teeth
Diameter gear 80mm
Diameter pinion 24 mm
Relation ship
𝑖 = 𝑑𝑏 / 𝑑𝑎 (5)
Output torque
𝑇𝑚𝑜𝑡𝑜𝑟 ∗ 𝑖 = 𝑇𝑟𝑢𝑒𝑑𝑎 𝑐𝑜𝑛𝑑𝑢𝑐𝑖𝑑𝑎 (6)
Tangential force transmitted
𝐹𝑡 =60𝑃
2𝜋𝑅𝑛 (7)
Table 5
Calculated magnitudes of reducer
Information Magnitude
Tangential force
transmitted 365.85N
Output torque 14.63Nm
3.2 Finite element analisys There are in the actuality tools and methods that
reduce the dimensioning for resolved physical
engineering problems in different cases modeled.
Figure 4 Modeling manual valve
4
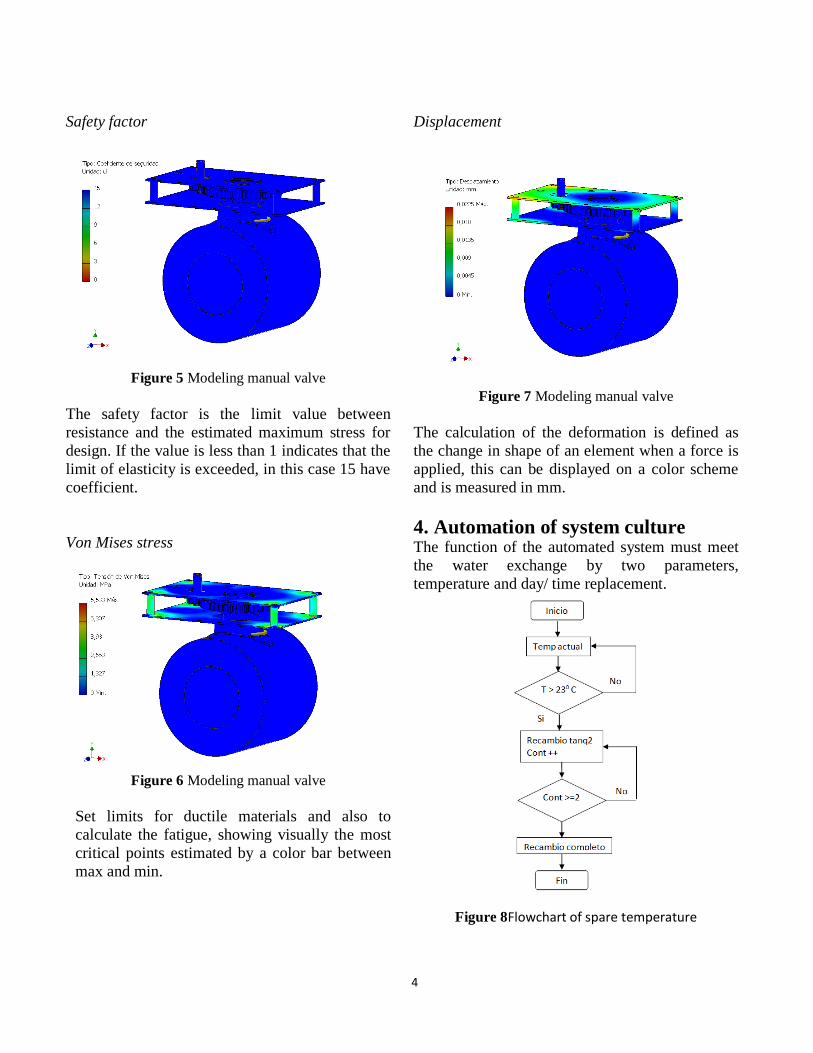
Safety factor
Figure 5 Modeling manual valve
The safety factor is the limit value between
resistance and the estimated maximum stress for
design. If the value is less than 1 indicates that the
limit of elasticity is exceeded, in this case 15 have
coefficient.
Von Mises stress
Figure 6 Modeling manual valve
Set limits for ductile materials and also to
calculate the fatigue, showing visually the most
critical points estimated by a color bar between
max and min.
Displacement
Figure 7 Modeling manual valve
The calculation of the deformation is defined as
the change in shape of an element when a force is
applied, this can be displayed on a color scheme
and is measured in mm.
4. Automation of system culture The function of the automated system must meet
the water exchange by two parameters,
temperature and day/ time replacement.
Figure 8Flowchart of spare temperature
5
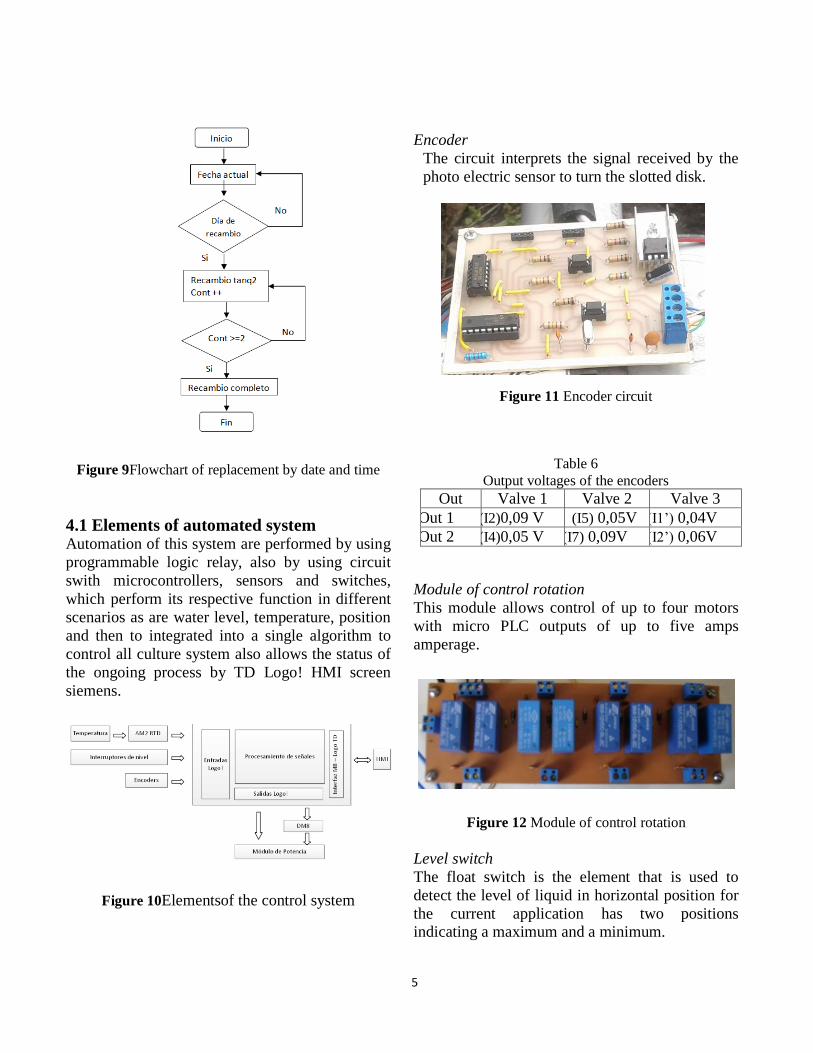
Figure 9Flowchart of replacement by date and time
4.1 Elements of automated system Automation of this system are performed by using
programmable logic relay, also by using circuit
swith microcontrollers, sensors and switches,
which perform its respective function in different
scenarios as are water level, temperature, position
and then to integrated into a single algorithm to
control all culture system also allows the status of
the ongoing process by TD Logo! HMI screen
siemens.
Figure 10Elementsof the control system
Encoder
The circuit interprets the signal received by the
photo electric sensor to turn the slotted disk.
Figure 11 Encoder circuit
Table 6
Output voltages of the encoders
Out Valve 1 Valve 2 Valve 3
Out 1 (I2)0,09 V (I5) 0,05V (I1’) 0,04V
Out 2 (I4)0,05 V (I7) 0,09V (I2’) 0,06V
Module of control rotation
This module allows control of up to four motors
with micro PLC outputs of up to five amps
amperage.
Figure 12 Module of control rotation
Level switch
The float switch is the element that is used to
detect the level of liquid in horizontal position for
the current application has two positions indicating a maximum and a minimum.

6
Figure 13float switch
Cabinets of the installation
When installing the cabinet one where teams
storage and distribution of energy and its
protections are in the cabine two where are the
protections for the control elements (micro PLC
logo, rotation control module, expansion modules
are), also has a keypad and buttons start and
emergency stop.
Figure 14Facilitiesautomated system
HMI with TD Logo
On the screen you can check the current
temperature at which the pond is, days and time
that is going to make the parts.
Figure 15 Tank 1 status
Figure 16 Tank 2 status
Figure 17 Temperature Tank 2
Figure 18 Day y hour of automatic replacement
7
5. Conclusions
The photovoltaic system can implement
automatic control parts without power lines or
transformers. It also has the scalability to provide
more energy.
The gearbox is a more economical and
efficient solution for this type of simple
applications that valve adapted to saving
resources and improving processes.
The level switch is the best choice for this
type of application because when measuring the
level disturbances in the water no variations in
the output signal
The encoder designed to detect the position of
the valve between 00 and 90
0 can be extended to
more precisely by varying the program.
The TD Logo! allows us to monitor the
process so that the in-situ inspection of the entire
area is not necessary where the automated
system every time you need to check the status
of the process (temperature) is.
The programmable logic relay allows control
of four engines but more control valve is
necessary, only the program expands and adds
expansion module with relay outputs.
6. Gratitude I thank to all the people that with your help, direct
and indirect made possible that this objective is
reached over adversity.
References
[10] COLLAGUAZO,G.
“SistemasMicroprocesados”.
[11] García, M. “Energía solar fotovoltaica y
cooperación al desarrollo”. España: IEPALA
editorial. 1999.
[12] Jütz H., Scharkus E. &Lobert R. “Tables
para la industria metalúrgica”. España:
Reverté. 1984.
[13] Díaz T. & Carmona G. “Instalaciones
solares fotovoltaicas”. Madrid: McGraw-
Hill. 2010.
[14] Siemens. (2003). Logo! Manual.
Recuperado de
https://cache.automation.siemens.com/dnl/zQ
/zQ1ODg5AAAA_16527461_HB/Logo_s.pd
f
[15] Atmospheric Science Data Center.
Surface meteorology and Solar Energy.
Recuperado de
https://eosweb.larc.nasa.gov/cgibin/sse/retscr
een.cgi?email=rets%40nrcan.gc.ca&step=1&
lat=0&lon=-78&submit=Submit
[16] CIE. (2008, 08). Atlas solar del Ecuador.
Recuperado de
http://www.conelec.gob.ec/archivos_articulo/
Atlas.pdf
[17] Lovshll. (2005, 08, 05). Raceway cultura
of tilapia. Auburn University. Recuperado de
http://www.ag.auburn.edu/fish/image_gallery
/details.php?image_id=1298
[18] Joe Holz. (02, 08). Kasco Marine
Aerators in Intensive Tilapia Farming.
Kasco. Recuperado de
http://www.kascomarine.com/kasco-marine-
aerators-in-intensive-tilapia-farming/