


Idiomas
Páginas
Jurídico

Logo
complementario
Aplicaciones y distintos usos del agua reutilizada:
Tecnologias especificas
Frank Rogalla
Director de Innovacion y Tecnologia
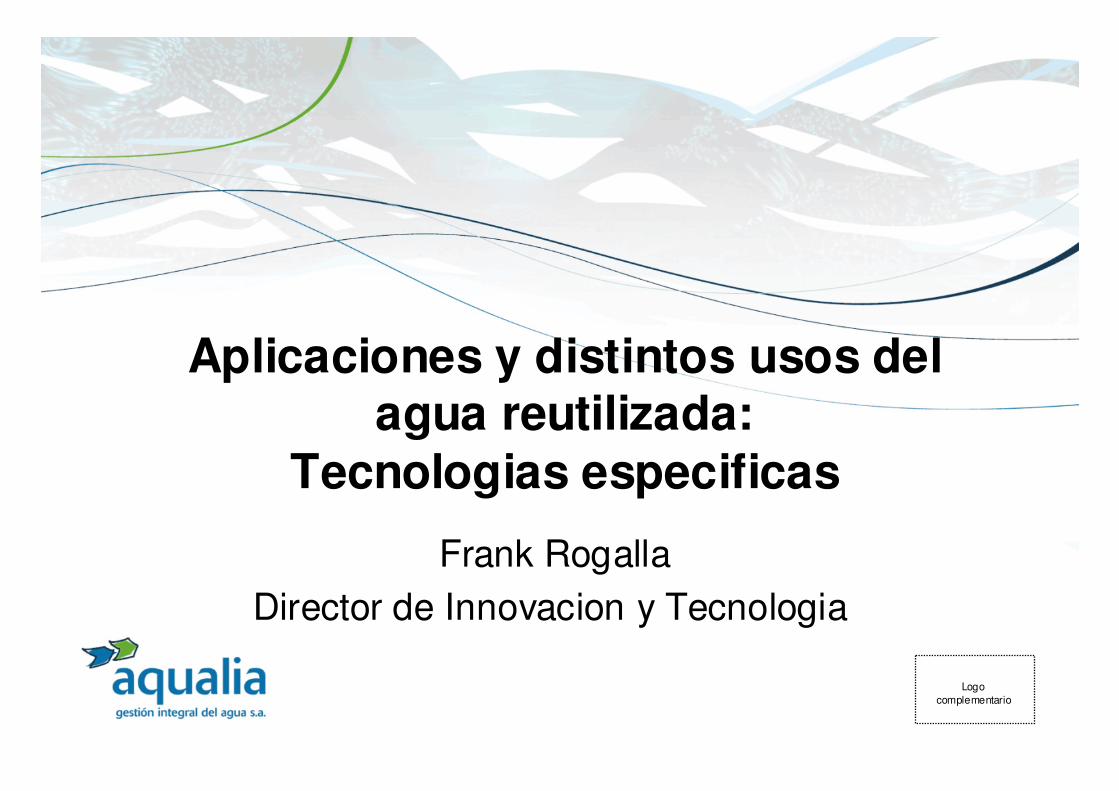
Summary
• Energy Use of SWRO
• Driver for Water Reuse
• Quality Requirements
• Treatment Options
• Examples of Reuse Plants
• Conclusion
• UK average energy use for conventional drinking water :
– 0.7 kwh/m3 for drinking water
– 0.8 kwh/m3 for wastewater
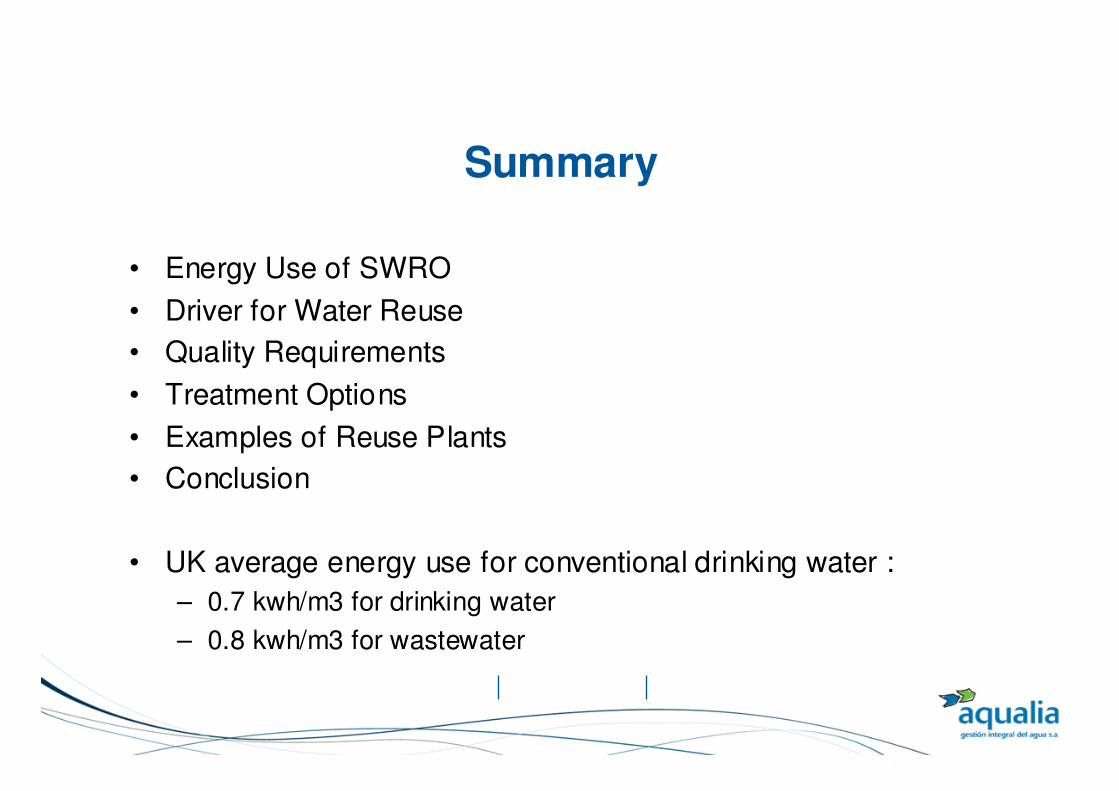
Typical Seawater RO process Typical Energy Consumption:
~10 …14 kWh/kgal = 2.6 … 3.7 kwh/m3
60 to 80%
~ 10%

Minimum energy required for SWRO (c) (d)
Constituent Conc (mg/L)
Molarity Osm. P. (atm)
Ca2+ 400 0.010 0.24
K+ 380 0.010 0.24
Mg2+ 1272 0.052 1.28
Na+ 10561 0.459 11.24
Si4+ 15 0.001 0.01
Sr2+ 8.1 0.000 0.00
Br-2+ 65 0.001 0.02
Cl 18980 0.535 13.10
SO42 2758 0.029 0.70
HCO3 142 0.002 0.06
F 1.3 0.000 0.00
B- 4.6 0.000 0.01
Total 34587 1.1 26.9
Minimum applied
P > 393 psi / 2.7 Mpa
for reverse osmosis to occur
Min work required for 1L water:
P*V = 2.7 MPa * 1L =
2.7 MPa-L =0.75 Whr
approximately
0.75 kWhr/m3 or
Theoretical minimum energy
27 bar (2.7 Mpa, 393 psi) atm/K L0821 .0'
'
=
=
=
R
Molarity M
TMR π
SWRO Energy Use
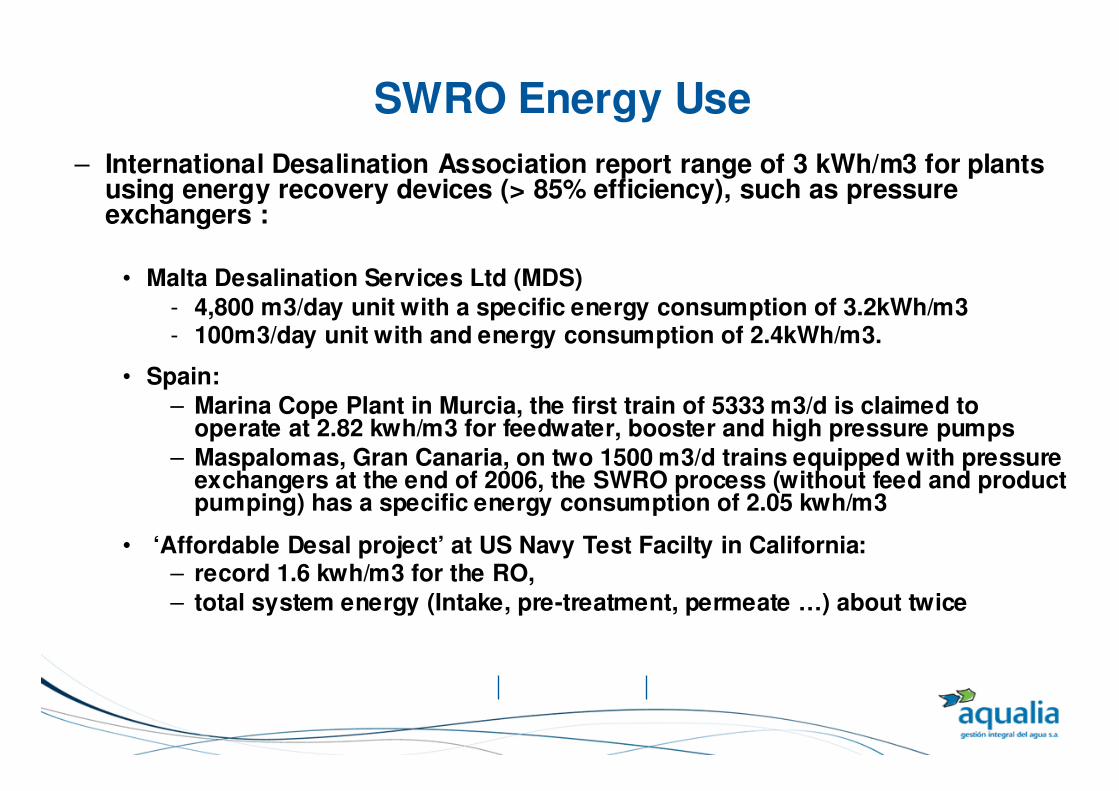
– International Desalination Association report range of 3 kWh/m3 for plants using energy recovery devices (> 85% efficiency), such as pressure exchangers :
• Malta Desalination Services Ltd (MDS) - 4,800 m3/day unit with a specific energy consumption of 3.2kWh/m3 - 100m3/day unit with and energy consumption of 2.4kWh/m3.
• Spain: – Marina Cope Plant in Murcia, the first train of 5333 m3/d is claimed to
operate at 2.82 kwh/m3 for feedwater, booster and high pressure pumps – Maspalomas, Gran Canaria, on two 1500 m3/d trains equipped with pressure
exchangers at the end of 2006, the SWRO process (without feed and product pumping) has a specific energy consumption of 2.05 kwh/m3
• ‘Affordable Desal project’ at US Navy Test Facilty in California: – record 1.6 kwh/m3 for the RO, – total system energy (Intake, pre-treatment, permeate …) about twice

Large scale desalination using renewable energy?
• Indirect use of renewable energy for SWRO implemented at Perth, Australia
• 145 000 m3/d SWRO requires 185 GWh/yr
• Energy purchased from wind farm ( at Emu Downs 300 km N on Shore)
• Electricity generated at wind farm transmitted to the local power grid
• Desalination facility draws energy from it
• Emu Downs maintains 48 turbines, while the energy required for desalination generated by 35 turbines

Perth SWRO and Wind Farm
145 000 m3/d / 24 x 4 kwh/m3 = 24 MW
48 turbines = 80 MW

• Nanotechnology
• Forward Osmosis
• Renewable energy
On the horizon …
nanotubes
Wave energy

Ways to improve energy efficiency of RO
• Modifications to RO system design
• Improvements in membrane elements
• Other considerations – Flux, Fouling, Pumps
• Several innovations applied on large scale
– Singapore-Tuas SWRO
• 4.2 kwh/m3 (6.5 kgCO2/m3)
– Singapore NEWater Reuse
• < 1 kwh/m3 (1.5 kgCO2/m3)
Desalinated Water Cost:
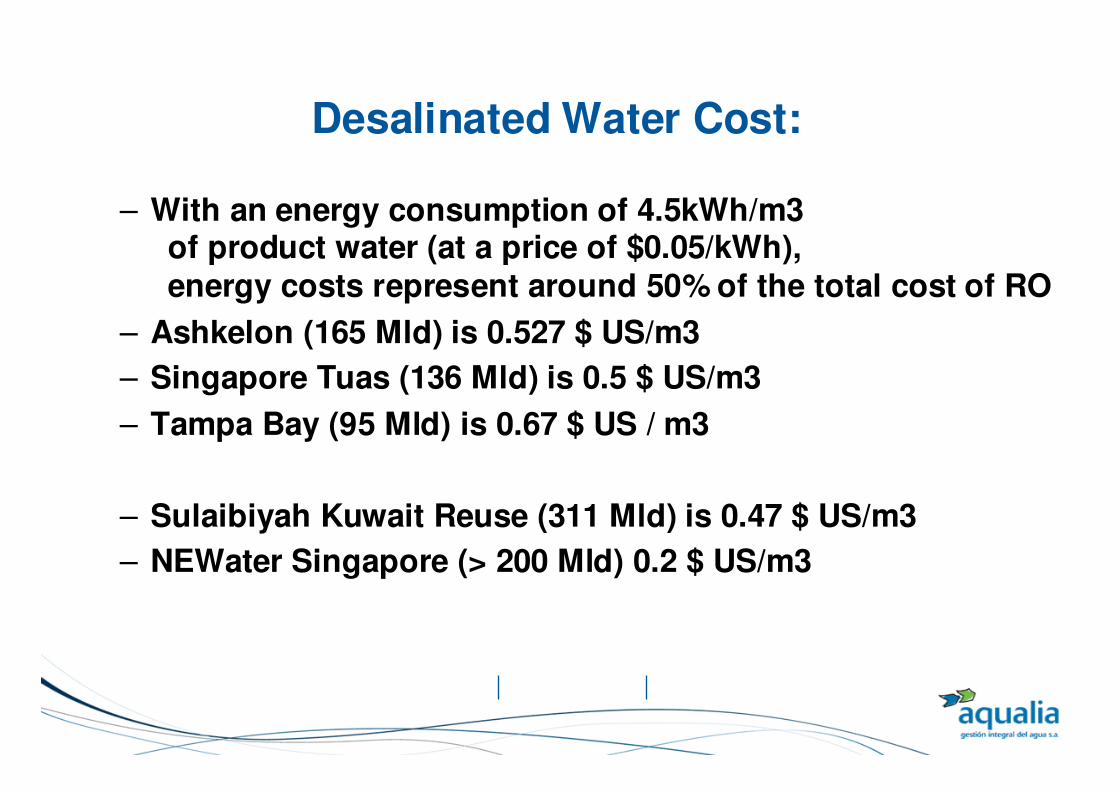
– With an energy consumption of 4.5kWh/m3 of product water (at a price of $0.05/kWh), energy costs represent around 50% of the total cost of RO
– Ashkelon (165 Mld) is 0.527 $ US/m3
– Singapore Tuas (136 Mld) is 0.5 $ US/m3
– Tampa Bay (95 Mld) is 0.67 $ US / m3
– Sulaibiyah Kuwait Reuse (311 Mld) is 0.47 $ US/m3
– NEWater Singapore (> 200 Mld) 0.2 $ US/m3

Questions?
Kuwait Sulaibiya 375.000 m³/d
Orange Cty, CA Wyoming
Ground Water Replenishment System (GWRS)
330.000 m³/d
Nevada Queensland, AUS Utah
Western Corridor Recycled Water Project (WCRWP)
250.000 m³/d
Singapore Colorado
NEWater 578.000 m³/d
California LA, CA West Basin Projects 11.000 m³/d
Phoenix, AZ Ari zona New Mexico Scottsdale Water Campus 72.000 m³/d

Queensland, Australia:
Seven Year Drought Results in Water Shortage
50% capacity
20% capacity

Brisbane, Queensland, Australia: Western Corridor Recycled Water Project (WCRWP)
AWTP Product Distributed
via New 200-km Pipeline
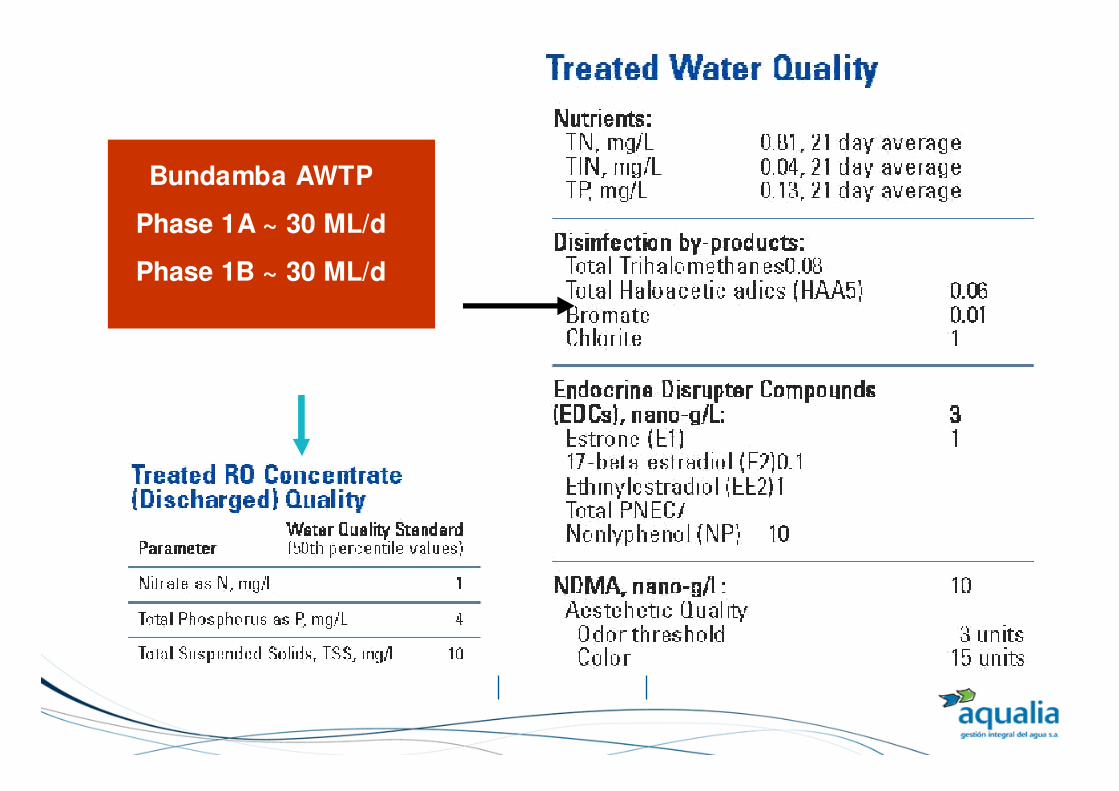
Bundamba AWTP
Phase 1A ~ 30 ML/d
Phase 1B ~ 30 ML/d

Bundamba Advanced WTP – Flow Schematic
Sodium Bisulfite and Antiscalant Lime, Carbon Dioxide, NaOCl Disinfection (NH4 + NaOCl)
Diurnal Flow Ferric EQ/storage Pre-Treatment MF RO UV/H2O2
Secondary Effluent
Treated Water Storage
Polymer
Reject To
Gravity ROC Treatment
Thickener
RO
H2O2 MF
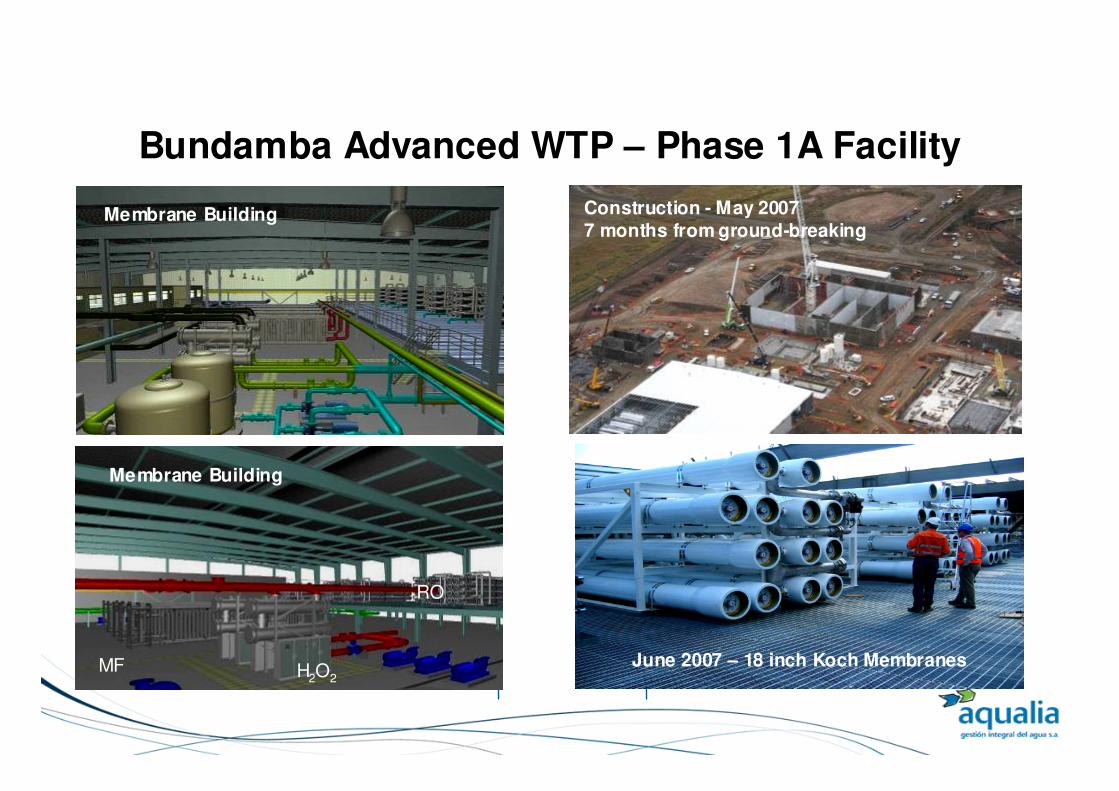
Bundamba Advanced WTP – Phase 1A Facility
Construction - May 2007 7 months from ground-breaking
June 2007 – 18 inch Koch Membranes
Membrane Building
Membrane Building

Water Delivered to Swanbank on August 27, 2007!

EDAR Haría (Lanzarote): Ampliación de una depuradora existente,
y disminución de la conductividad para uso agrícola.
• Puesta en Servicio: 2002
• Capacidad: 400 m3/día
• Destino del agua: Riego, previa desalinización por Osmosis inversa
• Entrada: DBO5 500 mg/l; S.S. 400 mg/l NTK 48 mg/l
• PROCESO:
• Pretratamiento: Tamizado 1mm, Desarenado – desengrasado
• Biológico: Volumen 200 m3; Aireación Aireadores sumergibles
• Membranas: 44 módulos Zenon ZeeGem 500
• Osmosis Inversa: Prefiltros de cartucho seguido de bastidor de ósmosis
• Espesamiento fangos: Gravedad

E.D.A.R. HARIA (LANZAROTE)
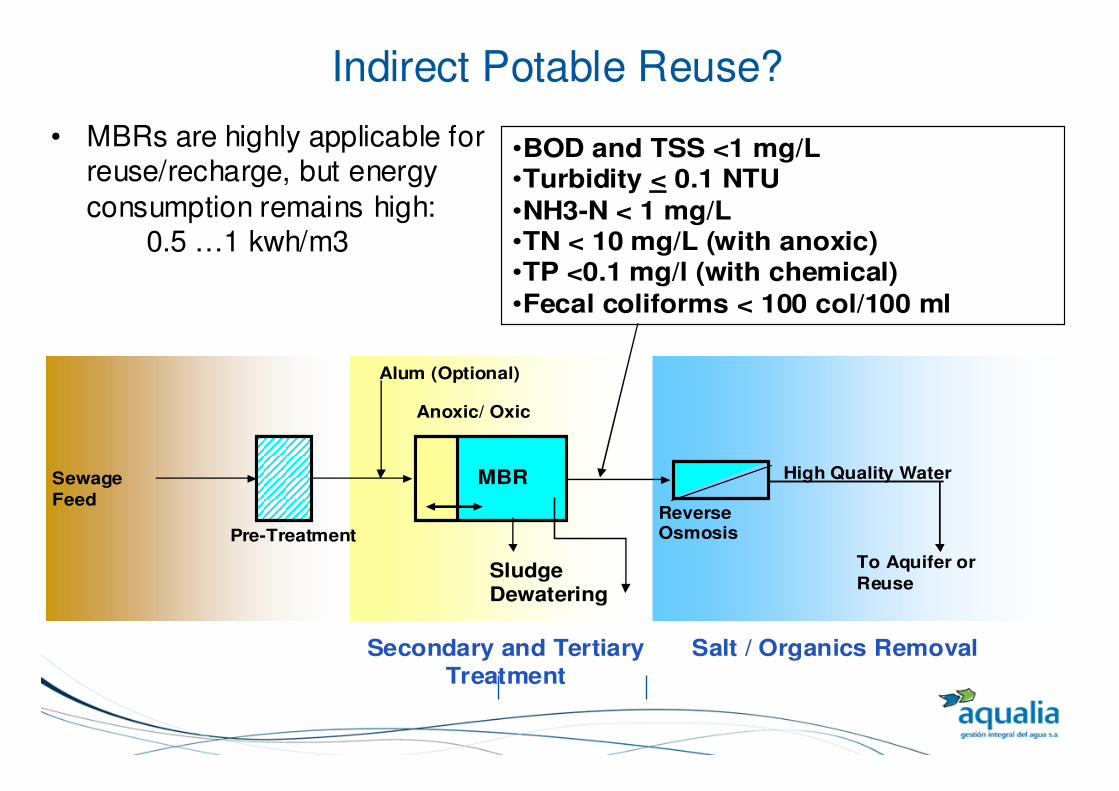
Indirect Potable Reuse?
• MBRs are highly applicable for reuse/recharge, but energy
consumption remains high: 0.5 …1 kwh/m3
High Quality Water MBR
To Aquifer or
Reuse
Alum (Optional)
Anoxic/ Oxic
Sludge Dewatering
Pre-Treatment
Sewage
Feed Reverse Osmosis
Salt / Organics Removal Secondary and Tertiary Treatment
•BOD and TSS <1 mg/L •Turbidity < 0.1 NTU
•NH3-N < 1 mg/L •TN < 10 mg/L (with anoxic) •TP <0.1 mg/l (with chemical)
•Fecal coliforms < 100 col/100 ml

PLANAS FIBRA HUECA
PROCESO MBR – TIPOS DE MEMBRANAS
Mayor superficie requerida (Utilización de zona
de membranas como zona del proceso)
Menor superficie requerida
Menor complejidad de operación. Lavados poco
frecuentes.
Mayor complejidad de operación, requiere lavados
continuos.
Concentraciones óptimas de trabajo 10.000 –
12.000 mg/l
Concentraciones óptimas de trabajo 8.000 mg/l
Tamizado previo de 3 mm o inferior Requiere tamizado previo de 1mm o inferior
Tamaño de poro 0,4 micras Tamaño poro 0,04 micras
Mayor energía de agitaciónMenor energía de agitación

PLANTA PILOTO


EDAR ILLESCAS (Toledo)
• Obras de depuración de las aguas residuales de la Urbanización Señorío de acuerdo a las siguientes premisas:
• Puesta en Servicio: • Población • Caudal
• DBO5 entrada • S.S. entrada • NTK entrada • P entrada • Temperatura agua residual
2.007 5.000 Hab 1250 m3/día
250 mg/l 300 mg/l 40 mg/l 10 mg/l 14 ºC
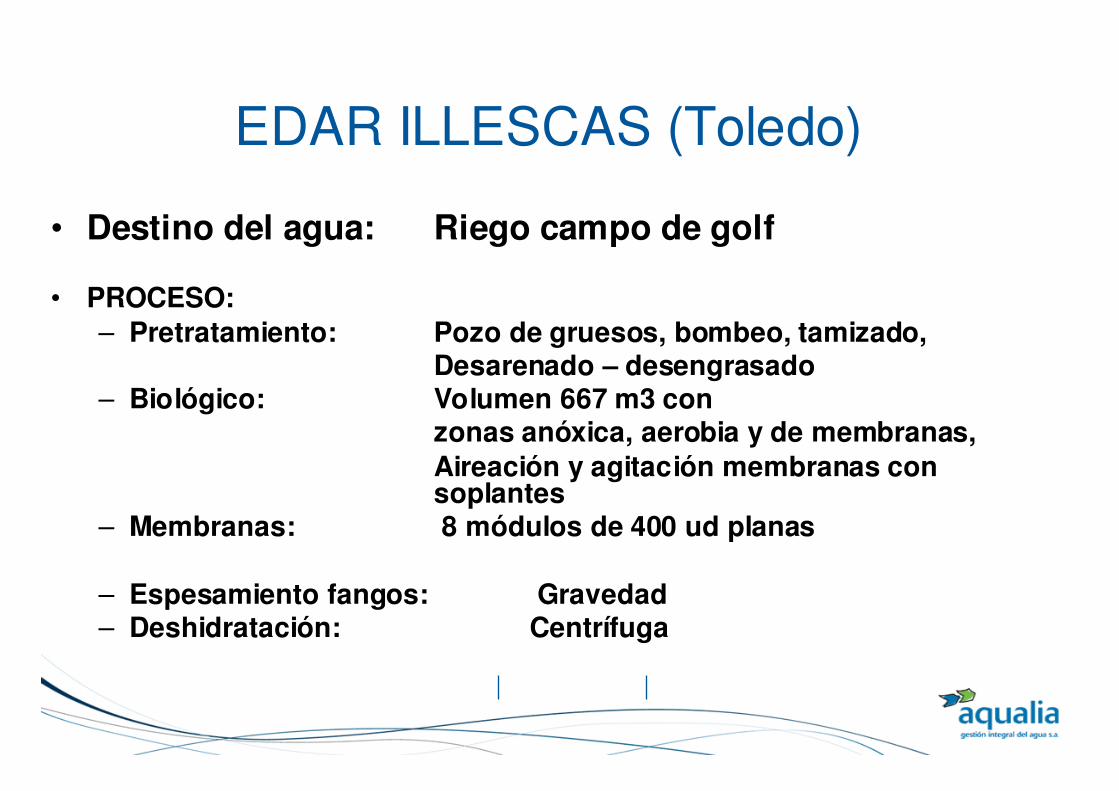
EDAR ILLESCAS (Toledo)
• Destino del agua: Riego campo de golf
• PROCESO:
– Pretratamiento: Pozo de gruesos, bombeo, tamizado, Desarenado – desengrasado
– Biológico: Volumen 667 m3 con zonas anóxica, aerobia y de membranas,
Aireación y agitación membranas con soplantes
– Membranas: 8 módulos de 400 ud planas
– Espesamiento fangos: Gravedad – Deshidratación: Centrífuga

EDAR ILLESCAS (TOLEDO)

EDAR ILLESCAS (Toledo)
CARACTERISTICAS DEL AGUA TRATADA
• DBO5 salida
• S.S. salida
• NT salida
• P salida
• Turbidez salida
• Temperatura agua
• Eschericia Coli
5 mg/l
10 mg/l
10 mg/l
2 mg/l
2 NTU
14 ºC
200 UCF/100 ml

Energy Consumption in Aerobic MBR
Plant Capacity
PE
MBR
Type
Start-up
Year
kWh/m3 Kwh/1000 gal
Marktranstaedt, D 12 000 Zenon 2001 0.8 – 1.5 300 570
Monheim, D 9 700 Zenon 2003 1 380
Brescia, I 46 000 Zenon 2003 0.85 320
Seelscheid, D 11 000 Kubota 2004 0.9 – 1.7 340 - 650
Nordkanal, D 80 000 Zenon 2004 0.9 340
Varsseveld, NL 23 000 Zenon 2005 0.9 340
Traverse City, CND 140 000 Zenon 2005 0.5* 190*
Ulu Pandan, Singapore 115 000 Zenon 2006 0.55 210**
CAS + MF 0.3… 0.4 115
*Membrane System Only, add Aeration Energy with Alpha-Value of 0.5
**Settled Sewage, Low MLSS, Stable Flow, High Temperatures

PROCESO IFAS
“INTEGRATED FIXED ACTIVATED SLUDGE”
Mayor inversión y
menor coste de operación
Utiliza difusores de burbuja fina
Menor energía de agitación
Menor superficie específica
Soporte fijo sujeto al fondo
Soporte fijo
Menor inversión y
mayor coste de operación
Difusores de burbuja gruesa
Mayor energía de agitación
Mayor superficie específica
(permite mayor reducción de volumen)
Soporte suspendido en el reactor
Soporte movil

MBBR or IFAS: Mobile Media (Anox Kaldnes-process)

EDAR TARRASA (BARCELONA)
• Planta existente: EDAR con tratamiento primario y biológico, con 60.000 m3/día de capacidad en el tratamiento biológico.
• Ampliación: Ampliación a 75.000 m3/día incluido eliminación de nutrientes
• Necesidades: Nuevo decantador (No hay sitio) y necesidad de duplicar el
biológico
• Problemas: No hay espacio para ampliación, limitado por ferrocarril y río
• Solución: Combinación de tecnología de membranas e IFAS.

Construcción de una línea con
capacidad para 15.000 m3/día
(incluyendo eliminación de
nutrientes con membranas (MBR)
Parada de una de las líneas
existentes, construcción de zonas
anóxicas e instalación de nuevos
difusores y de soporte IFAS en
zonas aerobias
Misma operación con cada una de
las otras tres líneas
Modificaciones de decantadores
secundarios (cambio de puente
radial a diametral)
Construcción de nuevo edificio de
producción de aire

Planta con capacidad para 90.000 m3/día.
15.000 m3/día en proceso MBR con calidad apta para su reutilización en riego de campo de golf (Concentraciones de
MLSS en balsa 7.000 mg/l, membranas de fibra hueca ZENON
75.000 m3/día en proceso IFAS, con concentraciones de biomasa
(adherida y en suspension) de 8.000 mg/l en zona aerobia.

Influent
Conventional Activated Sludge vs Integrated Anaerobic & Aerobic Treatment
Preliminary Treatment
Primary
Sedimentation
Tank
Effluent
l
S dg
Disposal
Dewatering
lishing
retsegiD
Activated
S udge
lu e
Thickener
Biogas
Anaerobic
Process
Biogas
EffluentAerobic Po
Dewatering
Sludge Disposal
Waste sludge
Disintegration of Sewage Sludge
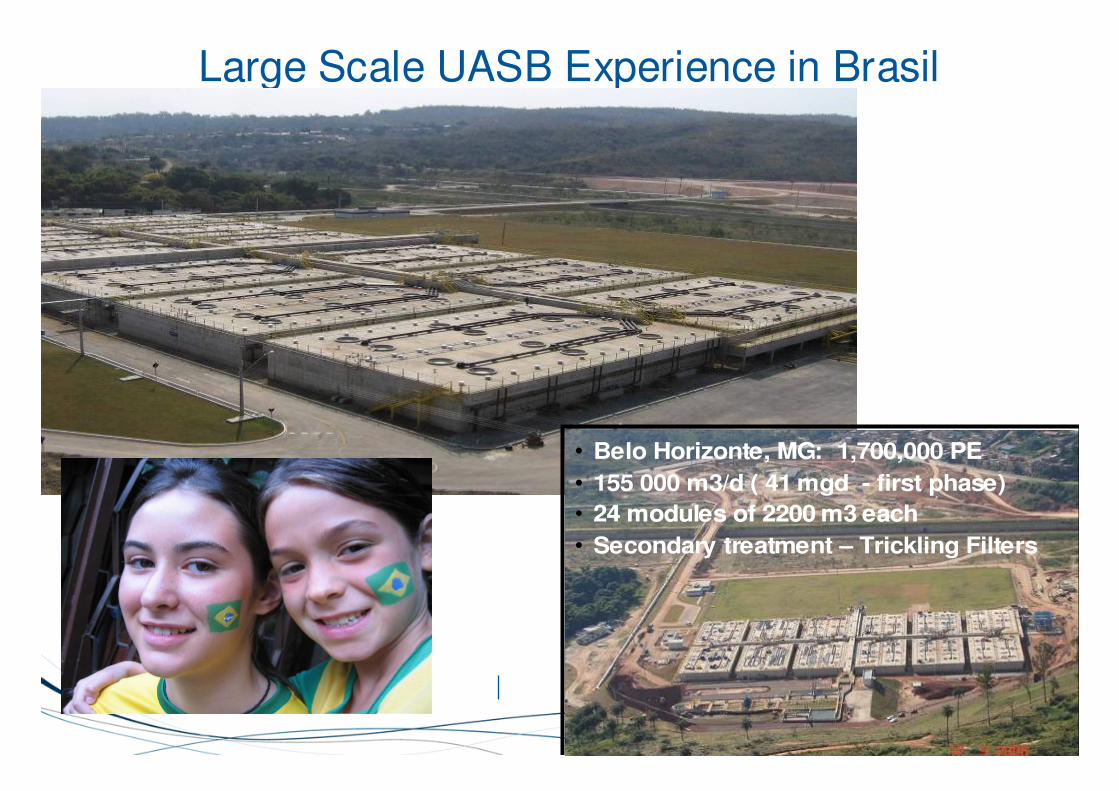
Large Scale UASB Experience in Brasil
• Belo Horizonte, MG: 1,700,000 PE
• 155 000 m3/d ( 41 mgd - first phase)
•• 24 modules of 2200 m3 each24 modules of 2200 m3 each
• Secondary treatment – Trickling Filters

UASB Full-Scale Experience
48,000 m48,000 m33 Curitiba (Curitiba (AtubaAtuba SulSul)) 24 modules of 2000 m3 each24 modules of 2000 m3 each
• Campinas, SP
• 48 000 m3/d ( 13 mgd)
• UASB + Activated Sludge + DAF

et
Country Volume Vup FIDHRT ECOD EBOD ETSS
m3 m/h #/m2h % % %
Colombia 64 0.67 -6 65 79 76
India* 1200 0.75 1.936 74 75 75
Temp
°°°°C±±±±25
20-30
Brazil 120 0.3-0.9 -5-15 60 70 70
Colombia 6600 0.77 1.75.2 70 - -
18-30±±±±25
Brazil 67.5 - 27 74 80 87
India 3380 0.77 26 63 66 73
16-23
18-26
India 11200 0.75 26 61 48 51
Brazil 810 0.52 2.259.7 67 - 61
26-29
30
Average 0.69 1.98 67 70 707.0
Wiegant 2001 WST 44:107; Seghezzo et al 1998 Biores. Tech. 65:175; Kalogo & Vestraete 1999. World J. Micr. Biotech. 15:523; Florencio
al. 2001. WST 44:71
Full Scale UASB Performance With Domestic Wastewater

Example Energy Balance (300 mg BOD/l)
Parameter Unit Anaerobic Primary CEPT
Biogas
production
m3 CH4 /m3 0.15 0.07 0.08
Electrical
Generation
kWh/m3 0.34 0.17 0.18
Oxidation
Energy
kWh/m3 0.16 0.32 0.16
Net Energy
Prod./Deficit
kWh/m3 + 0.18 - 0.15 +0.02
Solids Yield mg/l 90 184 194

Ajman WWTP (UAE)
Unit 2015
Population PE 255 000
Avg. flow M3/d 49 000
BOD/TSS Kg/d 15 300
Required average effluent quality: 10 mg/l for BOD and TSS
Irrigation : 200 FC/100 ml

Ajman Acceptance Test: Effluent Quality
5
10
15
20
25
30
35
40
24/06
/200
8 01/
07/2
008
08/0
7/20
08
15/0
7/20
08
22/07
/200
8 29/
07/2
008
05/0
8/20
08
12/0
8/20
08
19/0
8/20
08
26/0
8/20
08
Flow m3/d
TSS mg/l
BOD mg/l
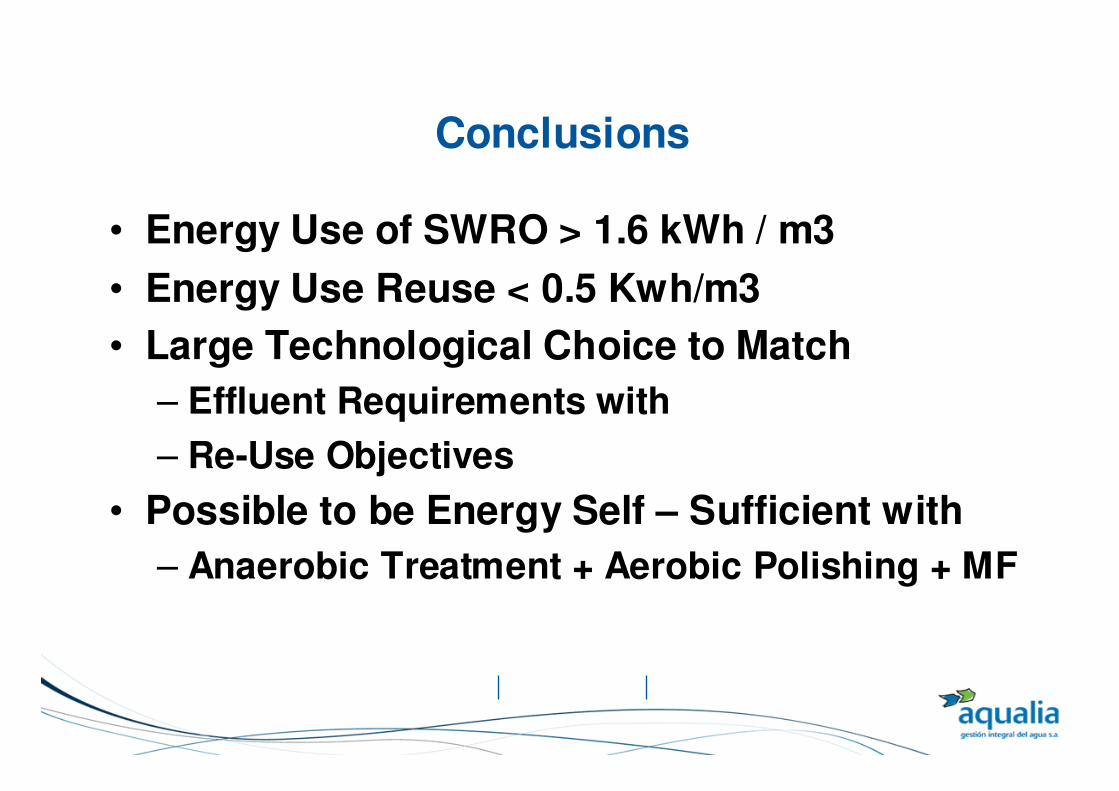
Conclusions
• Energy Use of SWRO > 1.6 kWh / m3
• Energy Use Reuse < 0.5 Kwh/m3
• Large Technological Choice to Match
– Effluent Requirements with
– Re-Use Objectives
• Possible to be Energy Self – Sufficient with
– Anaerobic Treatment + Aerobic Polishing + MF
Top Related