

Idiomas
Páginas
Jurídico


Universidade de Aveiro
2013
Departamento de Química
Armando José Cerejo
Caseiro
Análise do Proteoma e Peptidoma Salivar na
Diabetes Mellitus Tipo 1
Salivary Proteomics and Peptidomics of Type 1
Diabetes Mellitus

Universidade de Aveiro
2013
Departamento de Química
Armando José Cerejo
Caseiro
Análise do Proteoma e Peptidoma Salivar na
Diabetes Mellitus Tipo 1
Salivary Proteomics and Peptidomics of Type 1
Diabetes Mellitus
Tese apresentada à Universidade de Aveiro para cumprimento dos requisitos necessários à obtenção do grau de Doutor em Bioquímica, realizada sob a orientação científica do Doutor Francisco Manuel Lemos Amado, Professor associado da Universidade de Aveiro e do Doutor Rui Miguel Pinheiro Vitorino, Investigador auxiliar da Universidade de Aveiro.
Apoio financeiro da FCT e do FSE no âmbito do III Quadro Comunitário de Apoio através da bolsa SFRH/BD/30124/2006 e do projeto PTDC/QUI/72683/2006.


To my parents and sister


o júri
presidente Doutor António Manuel Melo de Sousa Pereira Professor Catedrático da Universidade de Aveiro
Doutora Maria Helena Raposo Fernandes Professora Catedrática da Faculdade de Medicina Dentária da Universidade do Porto
Doutor Massimo Castagnola Professor Ordinário di prima fáscia do Instituto di Biochimica Clinica Facoltá di Medicina da Università Cattolica di Roma
Doutor Francisco Manuel Lemos Amado Professor Associado da Universidade de Aveiro
Doutor José Luís Martinez Capelo Professor Auxiliar da Faculdade de Ciências e Tecnologia da Universidade Nova de Lisboa
Doutor Rui Miguel Pinheiro Vitorino Investigador Auxiliar da Universidade de Aveiro


agradecimentos
It is a great pleasure to express my deepest gratitude to my supervisors, Professor Francisco Amado and Doctor Rui Vitorino, for introducing to me the fascinating world of clinical proteomics.
I’m thankful to Professor Francisco Amado, whose expertise and knowledge helped me to growing up in science. I have also greatly enjoyed the inspiring conversations with him about culture, politician and education. Thanks for sharing your knowledge and your way of see the life.
I’m forever thankful to Doctor Rui Vitorino for his valuable advice during the long laboratory journeys. I will always remember his support and guidance throughout the work, as well as the enthusiastic ideas and new insights and goals to pursue. Thanks for all valuable tips and tricks to overcome laboratory difficulties.
I am also very grateful to Professor Rita Ferreira, for his support and help during this work, and for the confidence and encouraging words transmitted.
I owe my warm thanks to colleagues from Chemistry Department of Aveiro University, Alexandre Ferreira, Ana Isabel Padrão, André Silva, Catarina Ramos, Claúdia Simões, Conceição Fonseca, Cristina Barros, Elizabete Maciel, Gina Gonçalves, João Costa, Renata Silva, Renato Alves, Sofia Guedes, Susana Aveiro and Zita Cotrim.
To professors António Barros, António José Calado, Rosário Domingues, Pedro Domingues and Doctor Luisa Helguero, for their help and enthusiastic attitude towards this research.
I am grateful to medicine doctors Amélia Pereira, Rosário Marinheiro and specially Claúdio Quintaneiro from the internal medicine service of Hospital Distrital da Figueira da Foz for their collaboration.
I address my gratitude to Professor José Alberto Duarte and the members of his laboratory, Daniel Gonçalves, Hélder Fonseca and Celeste Resende, who made me feel always welcome.
I would like to acknowledge all members of College of Health Technology of Coimbra, specially my colleagues from Department of Clinical Analysis and Public Health, Ana Valado, António Gabriel, Fernando Mendes, Henrique Santos and Nádia Osório. Thanks for the support and motivation. I also like to thank the inspiration transmitted by my students.
My sincere thanks to Hospital de Santo André - Leiria, in special to my colleagues from Clinical Pathology laboratory and Blood Bank, who have supported and encouraged me throughout my work.
To Miguel and Maria for has been my adoptive family during these last years.
And at last but not certainly the least, to all of my friends, and in very special way to my family, lovely parents and sister, for their understanding and continuous support during my life.

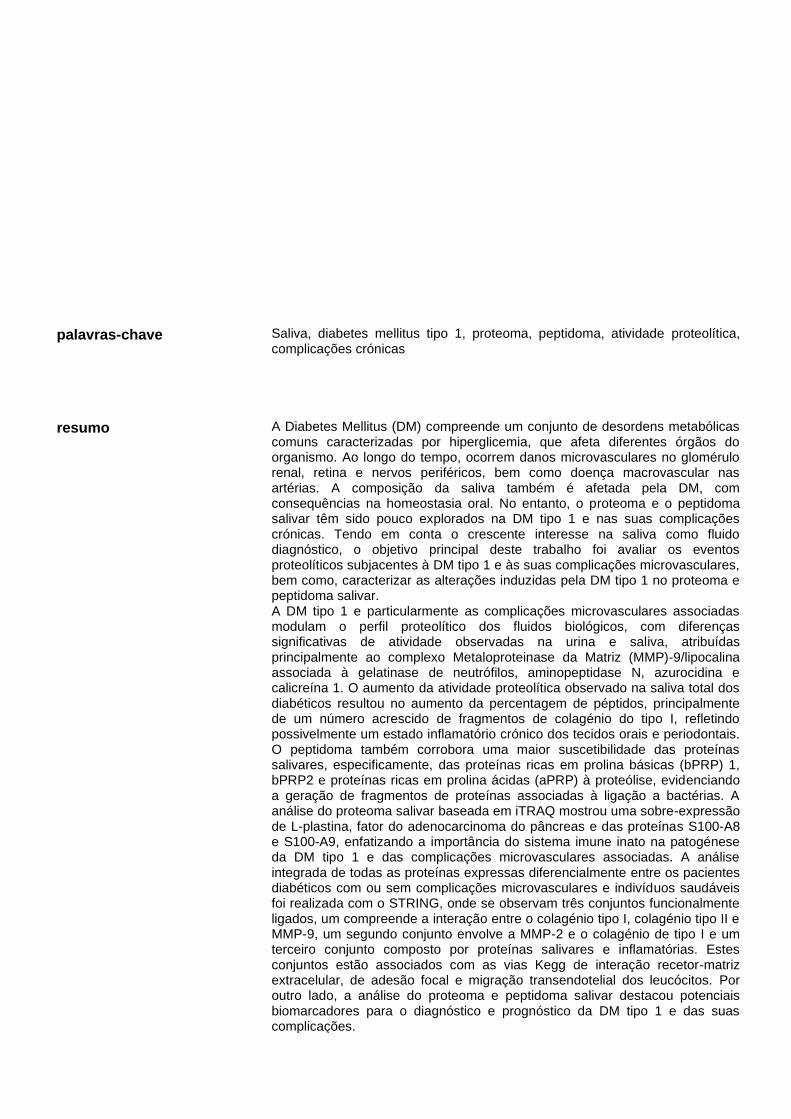
palavras-chave
Saliva, diabetes mellitus tipo 1, proteoma, peptidoma, atividade proteolítica, complicações crónicas
resumo
A Diabetes Mellitus (DM) compreende um conjunto de desordens metabólicas comuns caracterizadas por hiperglicemia, que afeta diferentes órgãos do organismo. Ao longo do tempo, ocorrem danos microvasculares no glomérulo renal, retina e nervos periféricos, bem como doença macrovascular nas artérias. A composição da saliva também é afetada pela DM, com consequências na homeostasia oral. No entanto, o proteoma e o peptidoma salivar têm sido pouco explorados na DM tipo 1 e nas suas complicações crónicas. Tendo em conta o crescente interesse na saliva como fluido diagnóstico, o objetivo principal deste trabalho foi avaliar os eventos proteolíticos subjacentes à DM tipo 1 e às suas complicações microvasculares, bem como, caracterizar as alterações induzidas pela DM tipo 1 no proteoma e peptidoma salivar. A DM tipo 1 e particularmente as complicações microvasculares associadas modulam o perfil proteolítico dos fluidos biológicos, com diferenças significativas de atividade observadas na urina e saliva, atribuídas principalmente ao complexo Metaloproteinase da Matriz (MMP)-9/lipocalina associada à gelatinase de neutrófilos, aminopeptidase N, azurocidina e calicreína 1. O aumento da atividade proteolítica observado na saliva total dos diabéticos resultou no aumento da percentagem de péptidos, principalmente de um número acrescido de fragmentos de colagénio do tipo I, refletindo possivelmente um estado inflamatório crónico dos tecidos orais e periodontais. O peptidoma também corrobora uma maior suscetibilidade das proteínas salivares, especificamente, das proteínas ricas em prolina básicas (bPRP) 1, bPRP2 e proteínas ricas em prolina ácidas (aPRP) à proteólise, evidenciando a geração de fragmentos de proteínas associadas à ligação a bactérias. A análise do proteoma salivar baseada em iTRAQ mostrou uma sobre-expressão de L-plastina, fator do adenocarcinoma do pâncreas e das proteínas S100-A8 e S100-A9, enfatizando a importância do sistema imune inato na patogénese da DM tipo 1 e das complicações microvasculares associadas. A análise integrada de todas as proteínas expressas diferencialmente entre os pacientes diabéticos com ou sem complicações microvasculares e indivíduos saudáveis foi realizada com o STRING, onde se observam três conjuntos funcionalmente ligados, um compreende a interação entre o colagénio tipo I, colagénio tipo II e MMP-9, um segundo conjunto envolve a MMP-2 e o colagénio de tipo I e um terceiro conjunto composto por proteínas salivares e inflamatórias. Estes conjuntos estão associados com as vias Kegg de interação recetor-matriz extracelular, de adesão focal e migração transendotelial dos leucócitos. Por outro lado, a análise do proteoma e peptidoma salivar destacou potenciais biomarcadores para o diagnóstico e prognóstico da DM tipo 1 e das suas complicações.

keywords
Saliva, type 1 diabetes mellitus, proteome, peptidome, proteolytic activity, chronic complications
abstract
Diabetes Mellitus (DM) comprises a set of common metabolic disorders that share the phenotype of hyperglycemia, which affect many different organ systems in the body. Over time, DM-specific microvascular disease in renal glomerulus, retina and peripheral nerves occurs, as well as macrovascular pathology in arteries. The composition of saliva is also affected by DM with consequences in the oral homeostasis; however, the salivary proteome and even more the peptidome has been quite unexplored in type 1 DM and related chronic complications. Taking into account the growing interest in saliva as diagnosis fluid, the main goal of this thesis was to disclose the proteolytic events underlying type 1 DM and related microvascular complications as well as to characterize DM-induced alterations in salivary proteome and peptidome. Type 1 DM and particularly the associated microvascular complications modulates biofluids’ proteolytic profile, with significant activity differences noticed for urine and saliva mainly attributed to Matrix Metalloproteinase (MMP)-9/neutrophil gelatinase-associated lipocalin complex, aminopeptidase N, azurocidin and kallikrein 1. The higher proteolytic activity noticed in whole saliva of diabetics leads to an increase in the percentage of peptides, mainly consisting of an augmented number of collagen type I fragments, possibly reflecting a chronic inflammatory state of oral and periodontal tissues. Moreover, peptidome data also support a diabetes-related higher susceptibility of salivary proteins, namely basic proline-rich protein (bPRP) 1, bPRP2 and acidic proline-rich proteins (aPRP) to proteolysis evidencing the generation of protein fragments associated with bacterial attachment. iTRAQ-based salivary proteome profiling evidenced an overexpression of L-plastin, pancreatic adenocarcinoma factor, protein S100-A8 and S100-A9, emphasizing the importance of the innate immune system in the pathogenesis of type 1 diabetes mellitus and related microvascular complications. The integrative analysis of all different expressed proteins performed with STRING shows three clusters functionally connected, one comprehending collagen types I and II interaction and MMP-9, a second involving MMP-2 and collagen type I, and a third cluster compreending salivary proteins and inflammatory proteins. These clusters are associated with the Kegg pathways extracellular matrix-receptor interaction, focal adhesion, and leukocyte transendothelial migration. In addition, the salivary proteome and peptidome analysis highlighted potential biomarkers for the diagnosis and prognosis of type 1 diabetes mellitus and related complications.

i
I - TABLE OF CONTENTS
II - List of figures .......................................................................................................... iii
III - List of tables .......................................................................................................... vii
IV - Abbreviations ......................................................................................................... xi
Chapter I ......................................................................................................................... 1
General Introduction ................................................................................................... 3
1. Diabetes Mellitus: definition, epidemiologics and diagnosis .................................... 3
1.1. Type 1 DM: pathogenesis, clinical onset and related chronic complications ........ 5
1.2. Proteomics and peptidomics of biofluids for DM characterization ........................ 7
1.3. Saliva as diagnostic fluid ....................................................................................12
1.3.1. Saliva’s protein profile vs. physiological role .................................................12
1.3.2. Proteome profiling of saliva ..........................................................................15
1.3.3. Salivary proteomics and peptidomics in clinical diagnosis ............................20
1. 4. Aplication of salivary proteomics and peptidomics to DM ...................................25
Aims ............................................................................................................................31
Chapter II - Experimental work .................................................................................33
Study I - Salivary peptidome in type 1 diabetes mellitus ...............................................35
Study II - Protease profiling of different biofluids in type 1 diabetes mellitus .................49
Study III - Salivary proteome and peptidome profiling in type 1 diabetes mellitus using a
quantitative approach ...................................................................................................59
Chapter III .......................................................................................................................89
General Discussion ......................................................................................................91
Chapter IV .......................................................................................................................99
Conclusions ................................................................................................................ 101
References ................................................................................................................... 103
Apendix - Supplementary Data ................................................................................... 129
Study I - Salivary peptidome in type 1 diabetes mellitus ............................................. 131
Study II - Protease profiling of different biofluids in type 1 diabetes mellitus ............... 175
Study III - Salivary proteome and peptidome profiling in type 1 diabetes mellitus using a
quantitative approach ................................................................................................. 177


i


iii
II - LIST OF FIGURES
Chapter I
Figure 1: Illustration of major salivary protein constituents and their functional role in oral
cavity health. ....................................................................................................................13
Figure 2: Schematic representation of human salivary glands anatomy and acinar
structure. ..........................................................................................................................14
Figure 3: Flowchart of the common strategies used for saliva proteome/peptidome
characterization. ..............................................................................................................16
Chapter II
Study I
Figure 1: Percentage of saliva peptides to total protein content. .....................................38
Figure 2: Total identified peptide frequency distribution among type 1 diabetes patients
and control individuals. ...................................................................................................40
Figure 3: Number of type I collagen alpha 1 chain fragments identified...........................42
Figure 4: Partial least squares – discriminant analysis scores scatter plot (t[1] vs. t[2]) for
the terminal C frequencies; R2X[1] = 22% and R2y[1] = 97%. ...........................................45
Figure 5: Partial least squares – discriminant analysis scores scatter plot (t[1] vs. t[2]) for
the terminal N frequencies; R2X[1] = 19% and R2y[1] = 94%. ..........................................45
Figure 6: (A) Representative zymography for type 1 diabetes patients and control
individuals (Ctrl); (B) An overlap of the average whole-gel lane optical density traces for
type 1 diabetes patients (red) and Ctrl (green); (C) Optical density measurements of
proteolytic bands 4 and 8. ................................................................................................46
Figure 7: Representative slot blot analysis and optical density measurements for MMP-9
in type 1 diabetes patients and controls. ..........................................................................46
Study II
Figure 1: (A) Representative zymography for healthy individuals and an overlap of the
average whole-gel lane OD traces for serum (S), saliva (Sa) and urine (U); (B)
Representative zymography for S, Sa and U developed in a buffer with 10 mm EDTA; (C)
Representative zymography for S, Sa and U developed in a buffer with 5 mm PMSF….. 53

iv
Figure 2: (A) Representative zymography for serum samples of T1D patients with
nephropathy and retinopathy (A), with retinopathy (B), without chronic complications (C)
and controls (D); (B) An overlap of the average whole-gel lane OD traces for A, B, C and
D serum samples; (C) Optical density measurements of proteolytic bands S1 and S3… . 54
Figure 3: (A) Representative zymography for saliva samples of T1D patients with
nephropathy and retinopathy (A), with retinopathy (B), without chronic complications (C)
and controls (D); (B) An overlap of the average whole-gel lane OD traces for A, B, C and
D saliva samples; (C) Optical density measurements of proteolytic bands Sa6, Sa7 and
Sa9; (D) Western blot analysis for MMP-2 and MMP-9 expression in saliva samples.. .... 55
Figure 4: (A) Representative zymography for urine samples of T1D patients with
nephropathy and retinopathy (A), with retinopathy (B), without chronic complications (C)
and controls (D); (B) An overlap of the average whole-gel lane OD traces for A, B, C and
D urine samples; (C) Optical density measurements of urine proteolytic bands U3, U4, U5
and U7 in samples of T1D patients with nephropathy and retinopathy (A), with retinopathy
(B), without chronic complications (C) and controls (D). .. ............................................... 55
Figure 5: Representative slot blot analysis and optical density measurements for MMP-2
and MMP-9 in urine and saliva samples of T1D patients with nephropathy and retinopathy
(A), with retinopathy (B), without chronic complications (C) and controls (D). .. ............... 56
Study III
Figure 1: Comparison of the log ratio of the relative intensity of the significantly regulated
salivary proteins among groups (T1D-R+N/Ctrl; T1D-R/Ctrl and T1D/Ctrl). ..................... 70
Figure 2: Protein interaction network generated with Intact [56] and visualized with
Cytoscape (v2.8.3) consisting of 266 proteins connected by 334 protein-protein
interactions. Major clusters of interacting proteins include those involved in defense,
inflammation and response to wounding. Green nodes represent upregulated proteins and
red nodes downregulated ones in the saliva of subjects with type 1 diabetes. ................. 72
Figure 3: Slot-blot analysis of salivary cystatin S (A), deleted in malignant brain tumors 1
protein (B) amylase (C) and histatin 1 (D). Serum C-reactive protein immunoblotting is
presented in (E). Values are presented as mean ± standard deviation of data retrieved
from the analysis of individual samples per group. Representative immunoblot images are
presented above the corresponding histograms. . ........................................................... 74
Figure 4: Venn diagram representing the distribution of identified peptides per group
(T1D-R+N, T1D-R, T1D and Ctrl) evidencing the overlapped and unique peptides. ........ 76
Figure 5: bPRP1 and aPRP main sequences evidencing the location of the unique
peptides identified in all groups (light blue) and only in diabetics (dark blue). .................. 77

v
Chapter III
Figure 1: STRING protein network that integrate all data retrieved from the three
experimental studies and shows protein-protein interactions, evidencing three clusters:
one cluster comprehending collagen type II, collagen type I subunits interaction and MMP-
9 (blue nodes); a second cluster involving MMP-2 and collagen type I (yellow nodes); and
a third cluster comprehending salivary and inflammatory proteins (red nodes). .. .............97
Apendix - Supplementary Data
Paper III
Supplementary Figure S1: Comparison of obtained individual ratio values (log2) for
significantly expressed proteins (p<0.05) between two independent iTRAQ experiments:
T1D-R+N/Ctrl; T1D-R/Ctrl and T1D/Ctrl. ........................................................................ 224
Supplementary Figure S2: Distribution of differentially regulated proteins according to
their molecular function (A) and to biological process (B) based on gene ontology
annotation. ..................................................................................................................... 224
Supplementary Figure S3: This figure shows all DM-regulated GLay clusters of the
protein-protein interaction network. ................................................................................ 225
Supplementary Figure S4: MALDI-MS/MS spectra of peptide 60AGDGNQNDGPQ
QGPPQQGGQQQ81 from PRH2-1 with a m/z of 2204.94, corresponding to the
replacement of Asp by Asn in the peptide position 7. ..................................................... 226
Supplementary Figure S5: Comparative slot-blot analysis of whole saliva glycoproteins
(A) and phosphoproteins (B) among groups using specific staining methods (Emerald
ProQ and Diamond ProQ, respectively). Representative immunoblot images are
presented above the corresponding histograms. ............................................................ 226
Supplementary Figure S6: Comparison of the log ratio of the relative intensity of the
significantly regulated bPRP1 peptides among groups (T1D-R+N/Ctrl; T1D-R/Ctrl and
T1D/Ctrl). ....................................................................................................................... 227
Supplementary Figure S7: Comparison of the log ratio of the relative intensity of the
significantly regulated bPRP2 peptides among groups (T1D-R+N/Ctrl; T1D-R/Ctrl and
T1D/Ctrl). ....................................................................................................................... 228
Supplementary Figure S8: Comparison of the log ratio of the relative intensity of the
significantly regulated bPRP3 peptides among groups (T1D-R+N/Ctrl; T1D-R/Ctrl and
T1D/Ctrl). ....................................................................................................................... 229
vi
Supplementary Figure S9: Comparison of the log ratio of the relative intensity of the
significantly regulated aPRP peptides among groups (T1D-R+N/Ctrl; T1D-R/Ctrl and
T1D/Ctrl)........................................................................................................................ 230

vii
III - LIST OF TABLES
Chapter II
Study I
Table 1: Contingency table for N-terminal cleavage site differences in identified salivary
gland secreted peptides between patients and controls.. ................................................ 39
Table 2: Contingency table for C-terminal cleavage site differences in identified salivary
gland secreted peptides between patients and controls. ................................................. 41
Table 3: Contingency table for N-terminal cleavage site differences in identified
nonsalivary gland secreted peptides between patients and controls. .............................. 43
Table 4: Contingency table for C-terminal cleavage site differences in identified
nonsalivary gland secreted peptides between patients and controls.. ............................. 44
Table 5: Most important motifs identified by PLS-DA models. ........................................ 45
Study II
Table 1: Proteases identified in saliva (Sa), urine (U) and serum (S) by western blot and
mass spectrometry. ........................................................................................................ 54
Study III
Table 1: Demographic and clinical characteristics of the subjects enrolled in this study. .64
Table 2: Distribution of the identified peptides per group and protein class according to
their relative abundance. Data is presented as mean ± STD. ...........................................75
Table 3: Peptides presented in significantly different levels between groups identified
based on iTRAQ analysis. Data is presented as mean ± STD. ........................................78
Apendix – Supplementary Data
Paper I
Supplemental Table 1: List of proteins that correspond to the identified peptides in all
subjects. ........................................................................................................................ 131
Supplemental Table 2: List of most frequent identified peptides. .................................. 138
viii
Supplemental Table 3: Contingency table for N-terminal of identified peptides in controls.
...................................................................................................................................... 139
Supplemental Table 4: Contingency table for C-terminal of identified peptides in controls.
...................................................................................................................................... 140
Supplemental Table 5: Contingency table for N-terminal of identified peptides in diabetic
patients. ........................................................................................................................ 141
Supplemental Table 6: Contingency table for C-terminal of identified peptides in diabetic
patients. ........................................................................................................................ 142
Supplemental Table 7: Cleavage site frequency for N-terminal of identified SGP. ....... 143
Supplemental Table 8: Cleavage site frequency for C-terminal of identified SGP. ....... 147
Supplemental Table 9: Cleavage site frequency for N-terminal of identified NSGP. .... 151
Supplemental Table 10: Cleavage site frequency for C-terminal of identified NSGP. .. 160
Supplemental Table 11: Contingency table for N-terminal of identified SGP in controls.
...................................................................................................................................... 166
Supplemental Table 12: Contingency table for C-terminal of identified SGP in controls.
...................................................................................................................................... 167
Supplemental Table 13: Contingency table for N-terminal of identified SGP in diabetic
patients. ........................................................................................................................ 168
Supplemental Table 14: Contingency table for C-terminal of identified SGP in diabetic
patients. ........................................................................................................................ 169
Supplemental Table 15: Contingency table for N-terminal of identified NSGP in controls.
...................................................................................................................................... 170
Supplemental Table 16: Contingency table for C-terminal of identified NSGP in controls.
...................................................................................................................................... 171
Supplemental Table 17: Contingency table for N-terminal of identified NSGP in diabetic
patients. ........................................................................................................................ 172
Supplemental Table 18: Contingency table for C-terminal of identified NSGP in diabetic
patients. ........................................................................................................................ 173
Supplemental Table 19: MS/MS data of cathepsin D identification. ............................. 174
ix
Paper II
Supplementary table 1: Demographic and clinical characteristics of subjects. ............. 175
Paper III
Supplementary table S1: Proteins differentially regulated between T1D-R+N/Ctrl; T1D-
R/Ctrl and T1D/Ctrl (Protscore refers to ProteinPilot score). .......................................... 177
Supplementary table S2: List of all salivary peptides identified using LC-MS/MS. ....... 178
Supplementary table S3: Salivary peptides identified in all groups, common to all DM-
related groups and exclusive to T1D-R+N, T1D-R, T1D and Ctrl. .................................. 201
Supplementary table S4: Number of amino acid residues in P1 and P1′ positions for the
identified salivary peptides per group and protein class. ................................................ 215
Supplementary table S5: Distribution of the identified peptides presenting Gln->pyro-Glu
at N-term and phosphorylation per group. Data is presented as mean ± STD. ............... 218
Supplementary table S6: Salivary peptides differentially regulated between T1D-
R+N/Ctrl; T1D-R/Ctrl and T1D/Ctrl (Conf refers to confidence level of Protscore from
ProteinPilot; ∆Mass in Da). ............................................................................................ 219

x
xi
IV - ABBREVIATIONS
1-DE One-dimensional gel electrophoresis
1D-LC One-dimensional liquid chromatography
2D-DIGE Two-dimensional difference gel electrophoresis
2-DE Two-dimensional gel electrophoresis
2D-LC Two-dimensional liquid chromatography
AAI Anti-insulin antibodies
ACN Acetonitrile
AGEs Advanced glycation end products
AMY1A Alpha-amylase 1
apo Apolipoprotein
aPRP Salivary acidic proline-rich phosphoprotein 1/2
BPI bactericidal/permeability-increasing protein-like 1
bPRP Basic salivary proline-rich protein
CBB Coomassie brilliant blue
CDK2 Cyclin-dependent kinase 2
CHAPS 3-[(3-cholamidopropyl)-dimethylammonio]-1-propane sulfonate
CID Collision-induced dissociation
CRP C-reactive protein
CZE Capillary zone electrophoresis
DM Diabetes mellitus
ELISA Enzyme-linked immunosorbent assay
ESI Electrospray ionization
FA Formic acid
GAD65 anti-glutamic acid decarboxylase
GAPDH Glyceraldehyde-3-phosphate
GDF9 Growth differentiation factor-9
GeLC In-gel tryptic digestion followed by liquid chromatography
HbA1c Glycated haemoglobin
HDL High-density lipoprotein
HILIC Hidrophilic interaction chromatography
HLA Histocompatibility leukocyte antigen
HNC Head and neck cancer
HPLC High-performance liquid chromatography
ICA Islet cell antibody
ICAT Isotope coded affinity tags
IEF Isoelectric focusing
IgG Immunoglobulin G
IL Interleukin
iTRAQ Isobaric tagging for relative and absolute protein quantification
kDa Kilodalton
LC Liquid chromatography
xii
LCAT Lecithin-cholesterol acyltransferase
LRP1 Low density lipoprotein receptor-related protein 1
MALDI Matrix-assisted laser desorption/ionization
MBL Mannan-binding lectin
MMP Matrix metalloproteinase
MMTS S-methyl methanethiosulfonate
MRP8/14 Myeloid-Related Protein-8/14 complex
MS Mass spectrometry
MS/MS Tandem mass spectrometry
MUC Mucin
MudPIT Mutidimensional protein identification technology
MW Molecular weight
N Nephropathy
NF-kB Nuclear factor-κB
NGAL Neutrophil gelatinase-associated lipocalin
NSGP Nonsalivary gland secreted peptides
OD Optical density
PAGE Polyacrylamide gel electrophoresis
PAUF Pancreatic adenocarcinoma upregulated factor
PFF Peptide fragment fingerprinting
pI Isoelectric point
PIgR Polymeric immunoglobulin receptor
PLS-DA Partial least squares - discriminant analysis
PLUNC palate, lung and nasal epithelium associated protein
PMF Peptide mass fingerprinting
PMSF Phenylmethylsulfonyl fluoride
PRDX3 Thioredoxin-dependent peroxide reductase
PRG Proline-rich glycoprotein
PROL4 Proline-rich protein 4
PRPs Proline-rich proteins
PTMs Post-translational modifications
R Retinopathy
RIF1 Rap1-interacting-factor-1
RP-RP Two-dimensional reverse-phase
SCX Strong cation exchange
SDS Sodium dodecyl sulphate
SGP Salivary gland secreted peptides
SILAC Stable isotope labeling by amino acids in cell culture
SILAP Stable isotope labeled proteome
SLPI Secretory leukocyte protease inhibitor
SMR3B Submaxillary gland androgen regulated protein 3B
SOD2 Superoxide dismutase 2
SS Sjögren's syndrome
STD Standard deviation
xiii
T1D Type 1 diabetic
TBS Tris buffered saline
TBS-T TBS-Tween
TCEP Tris(2-carboxyethyl) phosphine
TEA Triethylamine
TEAB Triethyl ammonium bicarbonate
TFA Trifluoroacetic acid
TLR Toll-like receptor
TOF Time-of-flight
TP53 Tumor protein 53
Tris Tris(hydroxymethyl) aminomethane
UV Ultraviolet
VCAM Vascular cell adhesion molecule
WHO World health organization
ZnT8 Anti-zinc transporter 8
α-CHCA α-cyano-4-hydroxycinnamic acid


CHAPTER I GENERAL INTRODUCTION


3
GENERAL INTRODUCTION
1. Diabetes Mellitus: definition, epidemiologics and diagnosis
Diabetes Mellitus (DM) comprises a set of common metabolic disorders that share the
phenotype of hyperglycemia with disturbances of carbohydrates, fat and protein
metabolism (WHO 1999; Assoc 2012). There are distinct types of DM caused by a
complex interplay of genetic factors, environmental and lifestyle. According to the etiology
of DM, the causes that contribute to hyperglycemia may include reduction in insulin
secretion, resistance to its action, or both (Deshpande et al. 2008; Guideline 2009). The
majority of DM cases belong to two etiopathogenic categories, designated as type 1 and
type 2. Diabetes Mellitus can also occur during pregnancy, classified as gestational
diabetes, corresponding to any degree of glucose intolerance, documented for the first
time during pregnancy (WHO 1999; Assoc 2012). There are other specific types of
diabetes, caused by genetic defects that affect the function of pancreatic β cells or insulin,
pancreas disease or drugs (Deshpande et al. 2008; Fraser 2009; Assoc 2012; Ghazarian
et al. 2012).
In the first category, type 1 DM, the origin of pathology is an absolute deficiency of insulin
secretion, resulting from pancreatic β cells destruction, being the insulin therapy essential
to ensure the survival of patients. In most cases, the destruction of the cells is produced
by an autoimmune mechanism and is designated as autoimmune type 1 DM (Ghazarian
et al. 2012). However, in some cases is not possible to document the associated etiology,
being classified as idiopathic type 1 DM (Deshpande et al. 2008; Guideline 2009).
In the more prevalent category, type 2 DM, the combination of resistance to insulin action
with an inadequate secretory compensatory response is the cause of pathology (Assoc
2012). In type 2 DM, the level of hyperglycemia is high enough to cause pathological
functional changes in various target tissues and can occur over a long period of time
before disease’s detection and in the absence of clinical symptoms (WHO 1999; Assoc
2012). During this asymptomatic period, it is possible to monitor changes in carbohydrates
metabolism by testing the fasting plasma glucose or after an overload with oral glucose
(Mayor 2007; Deshpande et al. 2008; Guideline 2009; Surampudi et al. 2009).
The prevalence of DM varies in the different regions of the world, though with a gradual
growth, mainly in the age group over 45 years (Deshpande et al. 2008; Chan et al. 2009;
4
Grant et al. 2009; Borchers et al. 2010). In the last two decades it was observed an
increased incidence of diabetes, which is expected to continue in the next years due to
the rise of obesity, physical inactivity and aging of the population (Grant et al. 2009;
Whiting et al. 2011; Hummel et al. 2012; Lam et al. 2012). According to the International
Diabetes Federation, in 2011 approximately 366 million people in the world had diabetes,
being predicted to increase to about 552 million in 2030 (Whiting et al. 2011). The
prevalence of diabetes in the Portuguese population was estimated to be 11.7% in 2009
by the study PREVADIAB-2009 (Gardete-Correia et al. 2010). This study points to the
existence of 905,035 diabetic subjects with ages between 20 and 79 years in Portugal,
with significant differences between men and women, with a prevalence of 14.2% and
9.5%, respectively (Gardete-Correia et al. 2010). Moreover, the percentage of
undiagnosed diabetes was estimated to be approximately 5.1% in 2009 (Gardete-Correia
et al. 2010), further supporting the conviction of a growing trend of the prevalence of
diabetes in Portugal (Rodrigues et al. 1992; Macedo et al. 2003; Duarte-Ramos et al.
2006).
The clinical diagnosis of diabetes is often suggested by the presence of symptoms such
as: polydipsia and polyuria, recurrent infections, unexplained weight loss and, in severe
cases, lethargy and coma (Kasper et al. 2005). In patients with classic symptoms of
hyperglycemia or hyperglycemic crisis, an unequivocal hyperglycemia establishes the
diagnosis (random plasma glucose above 200 mg/dl) (Kasper et al. 2005; Assoc 2012).
According to the World Health Organization there are other three criteria for the diagnosis
of DM: glycated hemoglobin (HbA1c) ≥ 6.5% performed in a certified laboratory using a
standardized assay; fasting plasma glucose ≥ 126 mg/dl with a fasting of at least 8 hours
or a 2-h plasma glucose ≥ 200mg during an oral glucose tolerance test. However, in the
absence of unequivocal hyperglycemia, these criteria must be confirmed by repeated
testing (Assoc 2012).
In terms of chronic glycemia evaluation, the widely used marker is HbA1c, reflecting
average blood glucose levels over a 2- to 3-month period of time (Assoc 2012). The
advantages of HbA1c are not limited to the convenience of non-fasting, but essentially as
a standard biomarker in the adequacy of glycemic management, presenting a well
correlation of test values with the development of both microvascular and, to a lesser
extent, macrovascular complications (Assoc 2012).
In order to effectively treat DM, it is also important the differential diagnosis of type 1
versus type 2 (Assoc 2012). In this sense, biomarkers like C-peptide levels, islet
5
autoantibodies and genetic tests contribute to a reliable clinical diagnosis (Assoc 2012;
Nokoff et al. 2012), The correct classification of the disease also helps to identify the
possible etiologies and to develop specific prevention for type 1DM (Rewers 2012).
1.1. Type 1 DM: pathogenesis, clinical onset and related chronic
complications
Type 1 DM, formerly known as juvenile-onset or insulin-dependent diabetes, comprises
about 5-10% of the subjects with diabetes and results from an autoimmune destruction of
pancreatic β cells (van Belle et al. 2011; Assoc 2012). This serious condition is the most
common metabolic disease in children (Maahs et al. 2010; Gan et al. 2012).
Autoantibodies are currently the best biomarkers of type 1 DM (Dang et al. 2011) and
approximately 85-90% of individuals at diagnosis present one or more markers of
pancreatic islets β-cells autoimmune destruction. These markers include anti-insulin
autoantibodies (AAI), anti-islets of Langerhans (Islet Cell Antibody-ICA), anti-glutamic acid
decarboxylase (GAD65), anti-zinc transporter 8 (ZnT8) and anti-tyrosine phosphatases
insulinoma antigen IA-2 and IA-2β (Wilkin et al. 1985; Goldstein et al. 2003; Orban et al.
2009; Tsirogianni et al. 2009; Sorensen et al. 2012). The rate of pancreatic β-cells
destruction is quite variable, being faster in newborns and children and slower in adults
(Assoc 2012).
Type 1 DM is associated with genetic as well as environmental factors that could play an
important role in triggering β-cells autoimmunity (Assoc 2012; Gan et al. 2012). Studies
carried out in different ethnic groups suggest that type 1 DM-related genetic susceptibility
is associated with the presence of certain major histocompatibility antigens
(Histocompatibility Leukocyte Antigen - HLA). HLA-DR3 and HLA-DR4 haplotypes were
detected in 90 to 95% of European Caucasians subjects with type 1 DM (Wang et al.
2007; Orban et al. 2009; Qu et al. 2009; van Belle et al. 2011). Nevertheless, only few
subjects with apparent genetic predisposition really end up getting type 1 DM and the
increase prevalence noticed in several developed countries cannot be explained by
genetics. Given the incapacity of genetic factors to predict alone the development of the
disease, environmental factors such as viral infections, diet, cow milk during childhood,
food toxins, drugs, stress or vitamin D deficiency are potentially involved (Akerblom et al.
1998; Gan et al. 2012; Phlips et al. 2012). There are still some forms of type 1 DM with
unknown etiology, being more prevalent in Africa and Asia. In these cases, patients have
a permanent insulinopenia and tendency to ketoacidosis, not showing, however, any

6
evidence of an autoimmune process, (McLarty et al. 1990; Deshpande et al. 2008; Assoc
2012).
The most common clinical manifestation of the disease is ketoacidosis, especially in
children and adolescents. Some patients present modest fasting hyperglycemia that
rapidly evolves to severe hyperglycemia and ketoacidosis in the presence of a stress
situation like an infection (Assoc 2012). Certain individuals, mostly adults, keep a residual
β-cell function for many years, enough to prevent episodes of ketoacidosis. In a later
stage of the disease, with the reduction of insulin secretion confirmed by low or
undetectable plasma levels of C-peptide, these patients probably will become insulin
dependent and at risk for ketoacidosis (Assoc 2012; Sorensen et al. 2012).
Type 1 DM can affect many different organ systems in the body and, over time, is
characterized by the development of diabetes-specific microvascular pathology in renal
glomerulus, retina and peripheral nerves, as well as macrovascular pathology in arteries
(Deshpande et al. 2008). As consequence of the microvascular damage, diabetes is the
major cause of end-stage renal disease and new blindness in people with age between
20-74 years (Pyram et al. 2012). The diabetic neuropathy affects over 60% of subjects
leading to urinary incontinence, gastroparesis, nocturnal diarrhea and erectile dysfunction
(Sperling 2003). The combination of extremity arterial disease and neuropathy in diabetes
accounts for 50% of all nontraumatic amputations in the United States (Sperling 2003).
Subjects with diabetes are in a greater risk for developing cardiovascular complications
and their life expectancy is about 7-10 years shorter (Ruderman et al. 1992; Brown et al.
2010). Several epidemiological studies in type 1 DM show a strong relationship,
continuous but not linear, between blood glucose levels and the risk of chronic
complications development (Shamoon et al. 1993; Brown et al. 2010).
Diabetic retinopathy, a major microvascular complication, is a multifactorial disease of the
retina that presents an extremely complex pathogenesis, involving several types of cells
and molecules (Ola et al. 2012; Zhang et al. 2012). Diabetic retinopathy is observed in
approximately 13% of the patients with less than 5 years of disease, increasing up to 90%
after 10-15 years of disease (Sperling 2003). Diabetic nephropathy is the leading cause of
kidney disease, affecting approximately 40% of diabetic patients (Sperling 2003). This
pathology has been categorized into stages based on the values of urinary albumin
excretion: microalbuminuria and macroalbuminuria (Gross et al. 2005). Urinary albumin
excretion is the main employed clinical marker of diabetic nephropathy stage and
progression and play a key role in the long-term evaluation of diabetic patients (Gross et
7
al. 2005). Although microalbuminuria has been recognized as an early indicator of diabetic
nephropathy, it is not a completely reliable index of renal histology (Sperling 2003). The
presence of albuminuria might not be always indicative of diabetic nephropathy and some
patients presenting significant glomerular mesangial matrix expansion in the absence of
albuminuria (Messent et al. 1992; Caramori et al. 2000; Molitch et al. 2004). Moreover,
urinary albumin excretion may be reversibly affected by glycemic control, hypertension,
exercise, congestive heart failure or urinary tract infections (Caramori et al. 2000).
1.2. Proteomics and peptidomics of biofluids for DM characterization
In recent years there has been a huge development in the field of protein identification
and characterization in complex biological samples. The platforms for proteome and
peptidome analysis have advanced over the last few years, driven by the technologic
development, being translated in a substantial increase in the number of studies focused
in the proteome/peptidome analysis of biofluids (Schrader et al. 2001; Ramstrom et al.
2004; Crameri 2005; Soloviev et al. 2005; Albalat et al. 2011). While the term proteomics
has been used to state the analysis of proteins expressed by organisms, the relatively
recent concept, peptidomics, defines the comprehensive analysis of small peptides and
polypeptides of a biological sample (peptidome), unexplored by proteomics analysis
(Baggerman et al. 2004; Amado et al. 2005; Menschaert et al. 2010; Gao et al. 2011).
The application of proteomics and peptidomics on clinically relevant problems (e.g.
cancer, diabetes and kidney disease) is commonly called clinical proteomics/peptidomics.
The continuous development of mass spectrometry (MS)-based thecnologies and
platforms that enable a better characterization of proteome and peptidome greatly
contributed to an increase in biomarker discovery. Indeed, in the last 15 years over a
thousand biomarkers have been published (Rao et al. 2007; Matt et al. 2008; Borrebaeck
2012), which reflect the consequences of pathophysiological conditions in the production
and metabolism of proteins and peptides in human cells and tissues that are detectable in
bodily fluids (Schrader et al. 2001). The great diversity of peptides with clinical interest in
living systems has led to the rapid development of peptidomics, contributing to the
discovery of new therapeutic targets and biomarkers. Specific peptide classes as
antimicrobial ones or related to metabolic diseases such as diabetes and obesity are
increasingly in focus (Brockmann et al. 2009; Brown et al. 2009; Quintana et al. 2009; Wei
et al. 2009; Westman-Brinkmalm et al. 2009). The main objective of clinical-omics is
convert the information provided by massive protein/peptide profiling in clinical aplications,
with expected profit in early diagnosis of disease, monitorization of treatments,
8
identification of novel terapeutic targets and prediction of disease outcome or response to
treament (Celis et al. 2008; Rodriguez-Suarez et al. 2012). A valuable advantage of
clinical proteomics is the possibility of providing non-invasive biomarkers by the analysis
of easily accessible body fluids such as blood, urine or saliva (Apweiler et al. 2009;
Rodriguez-Suarez et al. 2012). The search for subclinical disease biomarkers as well as
for chronic complications risk prediction driven by proteomic approaches resulted in the
identification of more than 300 up- or downregulated distinct proteins in different fluids
from DM patients (Kuzuya et al. 2002; Padrao et al. 2012).
Serum or plasma is considered the first choice of specimen given its fullness of biological
information and relatively easy collection. Nevertheless, the hight complexity of serum and
plasma samples, as well as the large dynamic range of protein concentrations require
sample pretreatment in order to explore the low abundant proteins (Zhi et al. 2010). In
spite of these analytical challenges, proteomics of blood-derived fluids resulted in the
identification of many type 1 DM potential biomarkers (Molitch et al. 2004; Metz et al.
2008; McGuire et al. 2010; Overgaard et al. 2010; Overgaard et al. 2010; Vitorino et al.
2010; Rewers 2012). However, as recently reviewed (Padrao et al. 2012), from the
identified DM-modulated proteins on plasma samples, only apolipoprotein (apo)-1, apoA-
2, apoB-100, apoC-1, apoC-3, apoE, beta-2-glycoprotein 1 and clusterin were validated
as biomarkers for type 1 diabetes and related complications (Padrao et al. 2012).
Interstingly, serum protein profiling retrieved, as potential specific markers to type 1 DM,
adiponectin, amyloid A protein, haptoglobin, insulin-like growth factor binding protein 2,
myeloperoxidase, transforming growth factor beta. Several proteins like C-Reactive
Protein (CRP), alpha-2-macroglobulin, coagulation factor IX, glyceraldehyde-3-phosphate
dehydrogenase (GAPDH), myocilin, peroxiredoxin-2, thyroxine-binding globulin and von
Willebrand factor were pointed as potential biomarkers for the both types of DM (Padrao
et al. 2012).
Other studies focused on the prediction of type 1 DM-related chronic complications like
nephropathy and retinopathy were performed in blood-derived samples. The search for
new biomarkers to predict the risk of diabetic nephropathy conducted by Overgaard et al.
(2010) using a SELDI-TOF-MS approach resulted in the identification of 16 peak clusters,
assigned as transthyretin, apolipoprotein A1, apolipoprotein C1 and cystatin C. The same
cohort analyzed with an iTRAQ-based approach enabled the identification of 112 proteins,
with apoA-2, B, C3, D and E as key nodes in the top-rated ingenuity network, after
interactive pathway analysis. These biomarkers have potential to be used as progression
9
clinical markers in the treatment and monitoring of diabetic nephropathy, but further
validation with a longitudinal study is needed (Overgaard et al. 2010).
A recent comprehensive study integrating multiple state-of-the-art proteomic technologies
was developed by Zhi et al. (2011) with the aim of systematically assess the proteome
profile associated with type 1 DM. This work enabled the identification of 21 differentially
expressed serum proteins between diabetic subjects and controls, implicated in
inflammation, oxidation, metabolic regulation, and autoimmunity. From these proteins,
adiponectin, insulin-like growth factor binding protein 2, serum amyloid protein A, CRP,
myeloperoxidase, and transforming growth factor beta were further validated by two
different imunoassays in a large data set (Zhi et al. 2011). Ahn et al. (2006), using
immunoproteomic technology, identified 20 human retinal protein spots that were
antigenic in patients with diabetic retinopathy. The observed autoantibodies to aldolase C,
creatine kinase B, phosphoglycerate kinase 1 and carbonic anhydrase II were specific to
subjects with diabetic retinopathy. More recently, Sasongko et al. (2011) used a cross-
sectional study of 224 diabetic patients to assess the serum levels of apoA-1 and apoB
and verified that the content of apoA-1 and the apoB-to-apoA-1 ratio were associated with
diabetic retinopathy severity, independently of sex, age and risk factors.
In biomedical research, urinary proteomics is performed with the aim of identify new tools
for diagnosis and monitoring of kidney and non-kidney diseases (Merchant et al. 2010;
Lapolla et al. 2011; Padrao et al. 2012). The large array of proteins present in urine,
reflect not only kidney and urogenital tract physiology as well as systemic changes, given
the contribution of plasma proteins to urine through glomerular filtration or leakage and
tubular secretion (Lescuyer et al. 2007; Hubel et al. 2011). In the last years, several
biomarkers for urinary tract, blader and prostate cancer, as well as predictors of renal
function and diabetic nephropathy progression were identified in urine (Merchant et al.
2009; Hubel et al. 2011). The non-invasive collection, the reduced proteolytic activity in
comparison with blood and the possibility of obtain large quantities of sample made urine
an atractive fluid for clinical proteomics (Hubel et al. 2011). However, its non-
homogeneous composition, the protein concentration dependance on disease state and
the presence of high concentrations of urea and salts limit the proteomic analysis of urine
proteome (Lescuyer et al. 2007; Hubel et al. 2011).
The urinary proteome in DM has been studied using different proteomic approaches and
several biomarkers were identified (e.g. orosomucoid, beta-2-microglobulin, epithelial-
cadherin, IgG, ubiquitin, zinc-alpha-2-glycoprotein, albumin, haptoglobin, retinol binding
10
protein 4, transthyretin and alpha-1-antitrypsin) associated with distinct molecular
functions like immune, cell adhesion, response to stimulus, transport and signal pathways
(Padrao et al. 2012). Although most of the studies have been performed in type 2 DM,
some research works have been conducted in subjects with type 1 DM (Rossing et al.
2008; Merchant et al. 2009; Thrailkill et al. 2009; Schlatzer et al. 2012; Soggiu et al. 2012;
Zurbig et al. 2012). With the purpose of identify distinctive molecular features in urine
samples that might correlate to type 1 DM complications, Soggiu et al. (2012) analyzed
diabetic patients with normo- and microalbuminuria, using high resolution 2-DE and LC-
MS/MS analysis. Data obtained revealed lower levels of Tamm-Horsfall urinary
glycoprotein, apoA-1, apoE, alpha-2 thiol proteinase inhibitor and human CD59 and higher
protein representations for alpha-1-microglobulin, zinc-alpha-2-glycoprotein, alpha-1B-
glycoprotein and retinol binding protein 4, providing evidences of urine proteins potentially
exploitable as putative prognostic biomarkers (Soggiu et al. 2012).
An attempt to identify urinary proteins implicated in proteinuria pathophysiology was
developed by Thrailkill et al. (2009). An SDS-PAGE hyphenated with LC–MS/MS platform
was used to compare the urine proteome from healthy nondiabetic individuals, subjects
with type 1 DM with normoalbuminuria and subjects with type 1 DM and microalbuminuria.
The significantly increase of megalin and cubilin, two endocytic receptors involved in the
reuptake of filtered albumin in kidney proximal tubule cells, seem to contribute to the
albuminuria detected in these patients (Thrailkill et al. 2009). With the same purpose,
Merchant et al. (2009) conducted a LC-MALDI-TOF approach focused on DM-related
renal function decline. A decrease in the fragments of collagen alpha 1(IV) and alpha 1(V)
and tenascin-X and an increase of fragments of inositol pentakisphosphate 2-kinase, zona
occludens 3, and FAT tumor suppressor 2 was observed. The higher expression of
inositol pentakisphosphate 2-kinase was confirmed in renal biopsies from type 1 DM
patients with early nephropathy, being suggested as predictor of diabetic nephropathy
progression (Merchant et al. 2009).
Rossing et al. (2008) developed a capillary zone electrophoresis (CZE)-MS approach
involving 305 individuals to discriminate urinary biomarkers for diabetes, diabetic
nephropathy and nondiabetic proteinuric renal diseases. A selection of 40 biomarkers,
including collagen type I and uromodulin fragments, distinguished subjects with diabetes
from healthy individuals with 89% sensitivity and 91% specificity. Furthermore, a panel of
65 urinary biomarkers allowed the discrimination of patients with diabetic nephropathy
from patients with other chronic renal diseases with 81% sensitivity and 91% specificity.

11
Other fluids are also attractive for biomarker discovery namelly ocular ones (tears,
aqueous humor and vitreous), considering the minimally invasive procedure for sample
collection and the potential clinical application to ocular diseases or other conditions like
diabetic retinopathy (Garcia-Ramirez et al. 2007; Acera et al. 2012; Kim et al. 2012;
Srinivasan et al. 2012). In the last years several promisor biomarkers for diabetic
retinopathy and potential therapeutic targets like apoA-1, apoH, complement C3,
complement C4b, complement factor B, retinol-binding protein 3 and zinc-alpha-2-
glycoprotein were identified and validated in ocular fluids from type 1 DM subjects (Padrao
et al. 2012). ApoA-1 and apoH proteins were identified by 2D-DIGE-MS/MS and validated
with western blot in vitreous fluid as biomarkers of proliferative diabetic retinopathy (Gao
et al. 2008; Simo et al. 2008). Tears have also been used to extend the knowledge about
the pathophysiology of retinopathy in type 1 DM (Csosz et al. 2012; Kim et al. 2012). Kim
et al. (2012) and Csosz et al. (2012) investigated the protein profile in subjects with non
proliferative retinopathy, with DM without retinopathy and healthy volunteers and reported
disease-related upregulated proteins Dj-1 protein and beta-2-microglobulin.
In the latest years, saliva has attracted widespread interest as a diagnostic fluid (Greabu
et al. 2009; Pink et al. 2009; Farnaud et al. 2010; Bartoszewicz et al. 2011; Castagnola et
al. 2011; Malamud 2011; Pfaffe et al. 2011). The recent advancements in salivary
proteomics hold special promise in the disclose of novel biomarkers and therapeutic
targets (Hardt et al. 2005; Al-Tarawneh et al. 2011). Indeed, the application of proteomic
technologies pave the way to new potential salivary biomarkers of oral and systemic
diseases as dental and gingival pathology, salivary gland disease, Sjögren syndrome,
diabetes, head and neck carcinoma, breast and gastric cancers, sclerosis and psychiatric
and neurological diseases (Greabu et al. 2009; Pink et al. 2009; Rao et al. 2009; Cabras
et al. 2010; Al-Tarawneh et al. 2011; Castagnola et al. 2011; Border et al. 2012).
However, little emphasis has been given to salivary proteome and peptidome analysis in
DM, especially in type 1 (Hirtz et al. 2006; Cabras et al. 2010). The growing importance of
quantitative proteomic approaches for clinical applications has been increasingly
recognized, aiming to provide the screening of non-physiological levels of certain proteins
and/or peptides that might reflect pathological conditions (Castagnola et al. 2011). No
other studies are known that quantitatively evaluate the saliva proteome and peptidome
changes related with type 1 DM and related chronic complications to this pathological
condition.

12
1.3. Saliva as diagnostic fluid
Saliva is a singular fluid and the interest in its use as auxiliary means of diagnosis has
grown exponentially in recent years. An increasing number of drugs, hormones and
antibodies can be measured with reliability in saliva (Dodds et al. 2005). Nowadays, the
analysis of saliva is used in the diagnosis of oral diseases (Siudikiene et al. 2008; Levine
2011), infections, cancer (Dowling et al. 2008; Schaaij-Visser et al. 2010), hereditary
(Cabras et al. 2010), autoimmune (Giusti et al. 2007; Baldini et al. 2008) and endocrine
diseases (Sundsten et al. 2009; Overgaard et al. 2010).
Saliva is easy to collect and its non-invasive nature makes it an attractive alternative to
blood tests. Compared with blood sampling, saliva collection reduces the discomfort,
anxiety and simplifies the collection of samples in series. The analysis of saliva can offers
an approach with a good cost-effectiveness to screening diseases in large populations, as
well as use in children and the elderly, where the blood harvest presents further
complications. Additionally, saliva tests are more secure than those in blood, relatively to
contamination risk of the laboratory professionals (Kaufman et al. 2002; Streckfus et al.
2002; Castagnola et al. 2011).
1.3.1. Saliva’s protein profile vs. physiological role
Saliva is a unique complex mixture of glycoproteins, enzymes, hormones and growth
factors that plays important physiological functions (Figure 1) (Ghafouri et al. 2003; Aps et
al. 2005; Walz et al. 2006). The protective properties of saliva include lubrication
functions, initiation of digestion, anti-microbial protection, secretion of antibodies,
protection against mechanical and chemical properties and hydration of the oral cavity,
oropharynx and esophagus mucous membranes (Aps et al. 2005; Farnaud et al. 2010).
The physiological relevance of saliva is unambiguously evidenced in individuals with
xerostomy, resulting in the decreased salivary flow, severe tooth decay, opportunistic
microorganisms infection and oral pain (Gorr et al. 2005).
Saliva is secreted by salivary glands, composed by three major pairs (submandibular,
parotid and sublingual) (Figure 2), numerous small glands distributed by the tongue,
palate, oral and labial mucosa (Aps et al. 2005; Sun et al. 2008). These glands produce a
high volume of saliva in relation to its size, being the maximum amount produced
approximately 1 ml/min/g of glandular tissue. Globally, salivary glands are responsible for
daily production of about 800 to 1500 ml of saliva (Ellis 1991; Aps et al. 2005; Melvin et al.
2005; Moore et al. 2010).

13
Figure 1: Illustration of major salivary protein constituents and their functional role in oral cavity health.

14
Human salivary glands are present under the form of a branched structure, with terminal
secretory structures (acini) and ducts. Small ducts conduct saliva from the acini and
converge to progressively larger ducts until reach the oral cavity (Ellis 1991; Moore et al.
2010). The main types of salivary gland acinar cells are mucous and serous. The
distribution of these cells differs depending on the salivary gland (Figure 2). Acinar cells
comprise about 90% of the gland and synthesize and secrete the majority of salivary
proteins (Ellis 1991).
Figure 2: Schematic representation of human salivary glands anatomy and acinar structure.
Parotid glands are the largest salivary glands, located close to the external auditory
pavilion, more precisely between the jaw branch and the mastoid. Parotid is a serous
gland, composed of spherical shape serous acini, formed by serous cells. (Ellis 1991;
Moore et al. 2010). Submandibular glands present a U shape and are located under the
mandible. This gland is a mixed type gland, presenting both acini composed by serous
cells (80%) and mucous cells (20%) (Ellis 1991; Moore et al. 2010).The sublingual glands
are located at the floor of the mouth and consist mostly of mucous acini capped with
serous demilunes, being therefore categorized as a mucous gland. (Ellis 1991; Moore et
al. 2010). There are still about 500 to 1000 minor salivary glands located throughout the
oral cavity, distributed by the lip and mouth mucosa, tongue and palate (Ellis 1991; Moore
et al. 2010). Acinar cells secrete more than 85% of saliva proteins, not being negligible the

15
contribution of glandular duct cells, responsible for secretion of proteins with important
biological functions such as growth factors, immunoglobulins and kallikreins (Vitorino et al.
2004; Amado et al. 2005; Esser et al. 2008; Castagnola et al. 2011).
Besides salivary gland secretions, other sources contributes to whole saliva proteome
namely serum filtrate, gingival crevicular fluid, bacteria and bacterial products, viruses,
fungi, desquamated cells from oral epithelium and food debris (Vitorino et al. 2004;
Amado et al. 2005; Dodds et al. 2005; Esser et al. 2008). A distinctive characteristic of
saliva in comparison with traditional biofluids is the fact that 20-30% of all identified
peptides belong to the main salivary peptide classes, namely statherin, PRPs, histatins
and SMR3B (Amado et al. 2012).
Despite the unknown biological function of several salivary proteins, the role of PRPs is
clearly associated to oral health. Lactoferrin, in conjunction with peroxidase, is a potent
inhibitor of cariogenic bacteria system (Aps et al. 2005). Statherin, another characteristic
salivary protein, allows saliva to keep their state oversaturated of calcium and phosphate
salts, contributing to the maintenance of an intact dentition and inhibiting spontaneous
precipitation of calcium phosphate. The salivary histidine-rich proteins, histatins, are small
proteins with anti-fungal activity (Vitorino et al. 2004; Dodds et al. 2005; Vitorino et al.
2006) (Figure 1). Saliva is also composed by high molecular weight glycoproteins, the
mucins, which are important organic components of this fluid. Mucins present a high
degree of glycosylation and hydration potential, able to prevent dehydration and provide
the necessary lubrication of oral cavity. These glycoproteins are either involved in toxins
binding and bacteria agglutination, being important components of the acquired pellicle
(Dodds et al. 2005; Vitorino et al. 2007) (Figure 1). Although bacteria are commonly
referred as part of saliva, bacterial proteins identification in saliva is limited, being only
possible when multidimensional approaches are used in saliva (Vitorino et al. 2012).
1.3.2. Proteome profiling of saliva
In the last decade, the combination of advanced MS-based technologies with the
development of bioinformatics tools, enabled an important progress in disclosing the
complete salivary proteome and peptidome using proteomics (Amado et al. 2012). These
advances enhanced saliva potential as a diagnostic fluid not only for oral pathologies, but
also for systemic diseases (Samaranayake 2007; Castagnola et al. 2011; Malamud 2011).
There are several proteomics approaches applied to the study of biological fluids, but the
proteome cannot be resolved completely using a single proteomic technology. The

16
analysis of high complexity samples as saliva requires previous fractionation steps and
the combination of multiples techniques to analyze and cover a large spectrum of the
proteome (Figure 3). The reduction of sample complexity is necessary because the high
abundant proteins can mask the detection of the lower abundant ones (Rodriguez-Suarez
et al. 2012). In protein analysis the most common methods used are one- and two-
dimensional gel electrophoresis (1-DE and 2-DE), one- and two-dimensional liquid
chromatography (1D-LC and 2D-LC), coupled with MS (Guo et al. 2007; Matt et al. 2008;
Issaq et al. 2009). Hyphenated techniques, 2-DE-MS and HPLC-MS, allow the
identification of a large number of proteins in complex mixtures, becoming the most used
tools in proteomics (Watso et al. 2007).
Figure 3: Flowchart of the common strategies used for saliva proteome/peptidome characterization.
The 2-DE, one of the first tools used in proteomics, introduced by O'Farrell and Klose
(1975), remains an useful and actual platform for the separation of complex mixtures of
proteins in greater number of fractions than traditional 1-DE. In the first dimension, the
isoelectric focusing (IEF), the separation of proteins is based on their native charge, while
in the second dimension, SDS-PAGE, are separated by molecular weight (MW). The
17
result is a set of spots to which can be assigned specific X and Y coordinates, unlike
protein bands obtained in one-dimensional techniques. Each spot of the gel contains one
or a very small number of proteins, depending on the complexity of the sample. Thus,
thousands of proteins can be separated in a single gel, allowing the determination of the
pI values, MW and relative abundance. Another aspect of 2-DE is the ability to separate
proteins based on the presence of post-translational modifications (PTMs) (Klose 1975;
O'Farrell 1975; Issaq et al. 2009). This technique has been applied to saliva, being
generally employed for biomarker discovery, namely of oral (dental caries, gingivitis and
periodontitis) (Vitorino et al. 2006; Hu et al. 2008; Wu et al. 2009; Goncalves et al. 2011)
and systemic diseases (Sjögren syndrome, Rheumatoid arthritis, oral squamous cell
carcinoma and DM) (Ferrary et al. 2002; Hirtz et al. 2006; Giusti et al. 2010; Baldini et al.
2011) as well as to evaluate specific conditions like smoking (Jessie et al. 2010) or
orosensory stimulation (Lorenz et al. 2011) effects on saliva proteome. As main
disadvantage, this technique present limitations on its applicability to high or very low
molecular weigh separated proteins, to hydrophobic membrane proteins and to low
abundance proteins that fail to be detected. (Matt et al. 2008; Rodriguez-Suarez et al.
2012). Accordingly to Bland et al. (2010) to obtain reliable and confident data with 2-DE
several replicates per sample are required to achieve a coefficient variation ranging
between 20–30%. More recently, an improvement in 2-DE, applying fluorescent labels to
samples, named two dimensional difference gel electrophoresis (2D-DIGE), allowing the
analysis of two or three marked protein samples in the same gel, reducing gel-to-gel
variation and increasing reproducibility (Unlu et al. 1997; Tonge et al. 2001; Beckett
2012). This strategy enabled the evaluation of salivary protein profiles among head and
neck squamous cell (Dowling et al. 2008), breast (Streckfus et al. 2012) and lung (Xiao et
al. 2012) cancer patients.
In the last decade, other methods for separating proteins have been exploited in
proteomics and most of the quantitative proteomic studies moved from 2-DE technology to
gel-free approaches (Neverova et al. 2005; Rodriguez-Suarez et al. 2012). Many involve
liquid chromatography technologies (1D-LC and 2D-LC) that use solid- and liquid-phase
media to separate protein or their peptides fragments (Guo et al. 2007; Matt et al. 2008).
1D-LC can be used to separate proteins according to their molecular mass, isoelectric
point or hydrophobicity. In 2D-LC, proteins are separated in the first dimension by
isoelectric point and in second dimension by hydrophobicity, thereby increasing the extent
of protein fractionation compared with 1D-LC (Guo et al. 2007; Matt et al. 2008). Liquid
Chromatography (LC) technologies help to reduce sample complexity, being a common
18
strategy the use of a preparative chromatography previous to LC-MS/MS analysis
(Rodriguez-Suarez et al. 2012). The use of peptide strong cation exchange (SCX), 2D
reversed phase–reversed phase (RP-RP) chromatography or hydrophilic interaction
chromatography (HILIC) enables the sample fractionation and increase substantially
proteome coverage (Rodriguez-Suarez et al. 2012). The combination of successive
chromatographic steps has been termed multidimensional protein identification technology
(MudPIT) and increase the dynamic range of protein identification (Chiou et al. 2011).
The most common method of MS-based proteomics is conducted by the digestion of
protein mixture in short peptides (Zhou et al. 2008). The analysis of the resulting
fragments by MS leads to protein identification and allows partial sequencing of target
protein, as well as evaluates the presence of PTMs (Tanaka et al. 2009). This approach,
referred as bottom-up, includes three strategies for protein identification: peptide mass
fingerprinting (PMF), peptide fragment fingerprinting (PFF) and de novo sequencing
(Tanaka et al. 2009). In the case of PMF, the m/z ratio obtained for each peptide after
enzymatic or chemical digestion is accurately measured and compared with all theoretical
masses present in databases obtained by in silico proteolytic digestion (Henzel et al.
2003). The confidence level in protein identification is extremely dependent on the
correlation between the mass detected and the theoretical mass (Dakna et al. 2009). In
the identification by PFF precursor’s peptides are selected and subject to tandem mass
spectrometry (MS/MS). The most commonly used activation method in MS/MS of peptides
is energetic collisions with a neutral target gas, commonly referred as collision-induced
dissociation (CID) (Zhou et al. 2008). According to the peptide fragmentation model, the
resulting fragments are compared with the theoretical masses obtained in silico (Amado et
al. 2005; Watso et al. 2007). The progress observed in protein identification and
characterization is close related with mass spectrometers evolution (Chen 2008; Xia et al.
2008; Amoresano et al. 2009; Gelpi 2009). The analysis of proteins/peptides by MS
produces a considerable amount of data, being necessary the use of bioinformatics
(Canas et al. 2006). There are several programs able to perform the analysis, of which are
examples SEQUEST (Sadygov et al. 2004) and MASCOT (Perkins et al. 1999). These
programs are powerful search engines that correlate uninterpreted MS spectra of peptides
with amino acid sequences from protein and nucleotide databases to identify proteins.
(Canas et al. 2006; Dakna et al. 2009).
Recently, the development of mass spectrometric methods has not only the aim of protein
identification, but also the quantification, enabling the comparison of the relative levels of
protein expression between two or more different samples (Huzarewich et al. 2010; Xie et
19
al. 2011). Application of LC-MS-based quantitative proteomics has become increasingly
applied due to capabilities for proteome coverage and methods precision and accuracy
(Quintana et al. 2009; Wei et al. 2009; Westman-Brinkmalm et al. 2009; Huzarewich et al.
2010; Chiou et al. 2011; Xie et al. 2011; Rodriguez-Suarez et al. 2012). The most
common strategy for relative and absolute quantification, known as bottom-up or shotgun
proteomics, relies on protein digestion followed by a fractionation, a critical process to
avoid the identification of only a portion of the proteins present, the higher abundant
(McCormack et al. 1997; Becker et al. 2011; Rodriguez-Suarez et al. 2012). The strategy
of labeling peptides with isotopes enables this methodology for differential expression,
comparing samples by labeling them separately with molecular tags containing light or
heavy isotopes (Huzarewich et al. 2010; Becker et al. 2011). The method known as
Isotope Coded Affinity Tags (ICAT) relies on thiol specific reaction and provide
quantitative information based on the ratios between heavy and light peptides (Chen
2008; Washburn 2011). Another approach relies in the incorporation of the heavy or light
oxygen isotopes during proteolysis, referred as 16O/18O labeling, which allows quantitative
comparison between two samples (Yao et al. 2001). This approach has been refined by
Ross et al. (2004) with the development of Isobaric Tagging for Relative and Absolute
Protein Quantification (iTRAQ) (Ross et al. 2004; Becker et al. 2011). iTRAQ method
enables simultaneous determination of both the identity and relative abundances of
peptide pairs using a peptide-fragmentation-based data analysis (Ross et al. 2004;
Rodriguez-Suarez et al. 2012). This methodology provides a multiplex assay that is ideally
suited for relative quantification and biomarker applications (Huzarewich et al. 2010;
Rodriguez-Suarez et al. 2012) and a 8-plex kit has been commercialized by AB SCIEX
Instruments (Rodriguez-Suarez et al. 2012). The strategy of isotopic labeling expanded
with the application of different isotope-labeled reactants (Julka et al. 2004). Another
method, the stable isotope labeling by amino acids in cell culture (SILAC), involves the in
vivo metabolic labeling of a cell line or a small organism with isotope-labeled amino acids
(Ong et al. 2002). This method present limitations related with the metabolic nature of the
labeling, fact that pave the way to the development of a novel strategy for biomarker
discovery, the Stable Isotope Labeled Proteome (SILAP) method (Shah et al. 2009; Yu et
al. 2009). As an alternative to isotope labeling methods for protein quantification were
developed label free methods, based on comparison of the normalized intensities of MS
signal (Wang et al. 2003; Wiener et al. 2004) or on the frequency of identifications
(Bondarenko et al. 2002; Liu et al. 2004). Label free LC-MS-based strategies also enable
relative quantification of peptides by direct evaluation of peaks intensity and area

20
(Bondarenko et al. 2002). After an initial resistance, the validity of label free methods has
been demonstrated and they become widely accepted (Becker et al. 2011). However, the
experimental error resultant from run to run variations in LC and ion suppression should
be taken in account (Rodriguez-Suarez et al. 2012).
1.3.3. Salivary proteomics and peptidomics in clinical diagnosis
Taking advantage of the methodologies referred above, a complete catalogue of the
salivary proteome has been created, including its classification according to their parotid
or submandibular/sublingual origins (Spielmann et al. 2011). Qualitative and quantitative
proteomic approaches that contribute to a high-throughput analysis of saliva proteome
and peptidome are relevant to harness the potential of saliva diagnostic and prognostic
value (Granger et al. 2007; Hu et al. 2007; Castagnola et al. 2011; Pfaffe et al. 2011;
Brinkmann et al. 2012). According to Spielmann et al. (2011) the systematic study of all
salivary secretory proteome components, PTMs, protein complexes and its classification
is an initial key step for saliva to be used for clinical applications. Information related to the
effect of diurnal variation on saliva composition (Hardt et al. 2005) as well as the
evaluation of glandular secretions contribution (Bandhakavi et al. 2011) were assessed
using stable isotope labeling quantitative approaches. So far, more than 3000 different
proteins (Hu et al. 2005; Xie et al. 2005; Denny et al. 2008; Bandhakavi et al. 2009; Yan et
al. 2009) and 2000 peptide species were identified (Huq et al. 2007; Schipper et al. 2007;
Helmerhorst et al. 2008; Huang et al. 2009; Lucchi et al. 2009; Vitorino et al. 2009; Amado
et al. 2010; Morzel et al. 2012).
Several studies aiming biomarker discovery in saliva have been performed in the last
years, highlighting the growing importance of salivary proteomics and peptidomics in
clinical diagnosis (Spielmann et al. 2011; Al Kawas et al. 2012; Amado et al. 2012; Liu et
al. 2012). Saliva proteome analysis in several pathological conditions such as bleeding
oral cavity, caries, oral lichen planus, periodontitis, Sjögren’s syndrome, systemic
sclerosis, graft versus host disease, oral cavity cancer, head and neck cancer (HNC),
breast cancer, gastric cancer, type 1 DM and type 2 DM was reviewed by Al-Tarawneh et
al. (2011) and 180 differentially expressed proteins were identified.
In an initial phase, salivary diagnostic approaches have been developed to monitor oral
diseases such as caries risk, gingival and periodontal diseases (Al-Tarawneh et al. 2011;
Spielmann et al. 2011; Amado et al. 2012). Vitorino et al. (2006) applied a proteomic
approach to evaluate the influence of salivary protein composition on in vitro dental
pellicle formation and its possible correlation with dental caries. The study involved the
21
comparison of caries free and caries susceptible subject’s, being observed differences in
the levels of acidic PRPs, lipocalin and cystatins (S and SN). The higher levels of
cystatins, physiological inhibitors of cathepsins, found in caries-free subjects suggest that
inhibition of proteolytic events on other salivary proteins may indirectly provide tooth
protection as well as the higher levels of the phosphorylated acidic PRPs 1/2 in caries-free
subjects. Preza et al. (2009) conducted a study in parotid saliva aiming to evaluate if
glandular functional status could be associated with the presence of root caries in elderly
and identified 14 biomarkers. Despite of the inter-individual variations in protein patterns,
parotid function tends to change upon aging, with implications for dental caries activity.
Proteomic analyses become an important tool to discover potential markers of gingivitis
and/or periodontitis like alpha-2-macroglobulin, alpha-1-antitripsin, elastase and albumin
(Fabian et al. 2007; Fabian et al. 2008). Other proteins levels like immunoglobulin,
molecular chaperone Hsp70, cystatin S, salivary amylase, calprotectin, histatins,
lysozyme, lactoferrine, defensins, peroxidases, PRPs and mucins could present a
predictive value for the evolution of gingivitis to periodontitis (Fabian et al. 2008).
Gonçalves et al. (2011) compared the proteomic profile of whole saliva from gingivitis
patients and healthy controls and observed that gingival inflammation was associated with
increased levels of albumin, hemoglobin, immunoglobulin peptides and keratins. Salivary
cystatin levels appeared to be more abundant in healthy subjects. A study conducted by
Ito et al. (2008) evaluated the amounts of antimicrobial proteins (cystatins and lysozyme)
in periodontitis. Saliva from patients with periodontal disease presented lower levels of
cystatin and lysozyme in comparison to the healthy group, being suggested as potential
biomarkers for periodontitis development. Wu et al. (2009) compared the proteomic profile
of whole unstimulated saliva of subjects with aggressive periodontitis versus control
group. The levels of serum albumin, immunoglobulin gamma2 chain C region,
immunoglobulin alpha2 chain C region, vitamin D-binding protein, salivary alpha-amylase
and zinc-alpha2 glycoprotein were increased in patients, whereas lactotransferrin,
elongation factor 2, 14-3-3 sigma, short palate, lung and nasal epithelium carcinoma-
associated protein 2 precursor and carbonic anhydrase VI were decreased.
Sjögren’s syndrome (SS) is a systemic autoimmune disease, manifested by severe
impairment of exocrine gland function and focal mononuclear cell infiltrates within the
lacrimal and salivary glands (Delaleu et al. 2005). Baldini et al. (2007) evaluated the
salivary composition of SS patients in comparison to a control group and observed a
different protein pattern characterized by a remarkable decrease in carbonic anhydrase VI

22
levels as well as set of differentially expressed proteins related to acute and chronic
inflammation and/or involved in oxidative stress injury.
A proteomic approach conducted by Peluso et al. (2007) evaluated modifications of
salivary peptides in patients with SS before and after pilocarpine treatment. The
administration of this parasympathomimetic drug in adult patients restored the levels of
several salivary proteins. The authors also reported an increased level of alpha-defensin 1
and beta-defensin 2 in patients, suggesting them as potential markers of oral inflammation
in SS patients. Fleissig et al. (2009) studied the salivary protein profile of human
unstimulated whole saliva and showed protein expression differences in SS patients
compared to healthy subjects. Baldini et al. (2011) conducted a study aiming to refine the
diagnostic power of a panel of potential salivary biomarkers described in primary SS with
respect to both healthy volunteers and pathological controls. The results showed 15
differently expressed proteins, namely alpha-amylases precursor, carbonic anhydrase VI,
β-2 microglobulin, GAPDH, epidermal fatty acid binding protein and immunoglobulin k light
chain between healthy subjects and non-SS pathological controls. The authors concluded
that saliva might represent a novel milieu for the discovery of candidate biomarkers for
primary SS diagnosis, and deepen knowledge on the pathophysiology underlying
glandular and systemic autoimmune disorders.
Research on salivary biomarkers revealed potential tools for oral cavity cancer diagnosis
(Lima et al. 2010) as well as for the detection of malignant tumors that are remote from
the oral cavity (Bigler et al. 2009). In respect to oral cancer detection, Hu et al. (2008)
discovered and validated a discriminatory panel comprising mac-2 binding protein,
myeloid-related protein 14, CD59 and catalase with a clinical accuracy greater than 90%.
In oral squamous cell carcinoma patients saliva was also detected a higher concentration
of interleukin (IL)-8 (St John et al. 2004). De Jong et al. (2010) used advanced MS-based
quantitative approach for saliva proteome profiling in oral cancer and proposed salivary
actin and myosin abundances to distinguish oral lesion types. Contucci et al. (2005)
reported a sensible reduction of the statherin level in the saliva of patients with
precancerous and cancerous lesions of the oral cavity compared with healthy subjects.
The results of Pickering et al. (2007) demonstrate the potential utility of salivary
endothelin-1 levels to monitor patients at risk for oral squamous cell carcinoma.
According to Li et al. (2004) the analysis of HNC patients’ saliva enables the diagnosis
with 91% precision, with great importance in early diagnosis and treatment success. The
detection of HNC in all stages is possible evaluating salivary levels of CD44 protein

23
(Franzmann et al. 2005). Ohshiro et al. (2007) observed a differentially protein expression
between HNC patients and healthy subjects saliva. The authors reported the absence of
common salivary cystatin S, parotid secretory factor and poly-4-hydrolase beta-subunit
proteins and the presence of alpha-1-B-glycoprotein and complement factor B proteins in
patients affected by HNC. Dowling et al. (2008) reported significantly increased levels of
beta fibrin (2.77-fold), S100 calcium binding protein (5.35-fold), transferrin (3.37-fold),
immunoglobulin heavy chain constant region gamma (3.28 fold) and cofilin-1 (6.42 fold) in
HNC patients saliva. The authors also observed a significant decrease of transthyretin
(2.92 fold) in patients in comparison with controls.
Saliva has already been analyzed with the purpose of breast cancer diagnosis (Streckfus
et al. 2008; Streckfus et al. 2012). Streckfus et al. (2008) identified 49 proteins that
discriminate healthy patients from those with breast cancer. Salivary protein analysis also
enables the differentiation of breast tumors malignity (Lima et al. 2010). In another
approach, Wu et al. (2009) proposed a screening method for gastric cancer in saliva,
based in the significant differences observed in the mass to charge ratio (m/z) peaks of
proteins with 1472.78 Da, 2936.49 Da, 6556.81 Da and 7081.17 Da, between patients
and healthy subjects.
A critical analysis of differentially expressed salivary proteins among distinct pathologies
evidenced, for instance, that cystatin SA-III was upregulated in pathologies like bleeding
oral cavity, SS and breast cancer, being a non-specific disease biomarker (Al-Tarawneh
et al. 2011). The downregulated expression of acidic PRP-1 was observed in SS and type
1 DM. The expression of alpha-amylase seems disease dependent, being upregulated in
SS, dental caries and periodontitis and downregulated in type 1 DM (Al-Tarawneh et al.
2011). Amado et al. (2012) evaluated the differentially expressed salivary proteins in the
presence of pathophysiological conditions and performed an interaction analysis using
Cytoscape for network visualization. Clusters were generated based on disease-
modulated protein levels and the methodology used for protein separation and
identification, and no clear association between a specific protein and a disease was
observed. The authors reported that several proteins like cystatin S, cystatin C, amylase,
defensins and statherin seem to be similarly modulated by diseases like dental caries,
periodontitis, SS, HNC and diabetes.
The systematic analysis of salivary peptidome might provide new insights in clinical
diagnosis and in the characterization of some pathophysiological conditions. The
24
proteolytic fragmentation pattern could also contribute to this objective, being seen as a
“fingerprint” of the physiological status (Amado et al. 2012).
Several saliva peptidome profiling approaches aiming unraveling novel potential
biomarkers for pathologies like autism, caries and oral diseases, HNC and diabetes have
been developed (Castagnola et al. 2008; Huang et al. 2009; Cabras et al. 2010; Vitorino
et al. 2010; Zhang et al. 2012). Castagnola et al. (2008) performed a comparative analysis
to evaluate salivary phospopeptidome in autistic patients. In particular, the
phosphorylation level of statherin, histatin 1 and acid PRPs was significantly lower in a
sub-group of autistic patients. The authors argue that these results provide a clue
regarding some potential molecular events at the basis of the disease, namely the relation
of hypo-phosphorylation of salivary peptides to possible asynchronies in the
phosphorylation of proteins involved in the development of central nervous system.
Rudney et al. (2009) performed a comparative study of patients grouped accordingly to
the clinical outcome evaluated by the levels of caries, supragingival plaque, total
streptococci and Tannerella forsythensis. Statherin and truncated cystatin S levels
showed significant inverse correlations with caries and all the microbiological variables
and may be potential risk indicators for the development of caries and other oral diseases.
Inzitari et al. (2006) detected various fragments and derivatives of statherin and P-B
peptide in human saliva and suggested that these salivary peptides are subjected to post-
translational proteolytic cleavages. This discovery could be related with physiological
processes of oral and dental microenviroment and might be relevant for oral cavity
defense from different pathogens and for the modulation of oral flora growth. Amado et al.
(2012) evaluated salivary peptidome of 10 patients with HNC and identified 1,834
fragments belonging to 289 unique proteins. From these, 158 were only identified in HNC
patients, mostly involved in gene expression regulation, extracellular matrix organization
and tissue development.
25
1.4. Aplication of salivary proteomics and peptidomics to DM
Although there is no consensus about the changes in the composition of saliva induced by
DM, an increased concentration of glucose, peroxidase, potassium, calcium, total protein,
amylase, immunoglobulin, lactoferrin, myeloperoxidase, albumin and advanced glycation
end products (AGEs) has been described (Ben-Aryeh et al. 1988; Sreebny et al. 1992;
Ben-Aryeh et al. 1993; Yavuzyilmaz et al. 1996; Yoon et al. 2004). A decrease in salivary
flow, (related or not with symptoms of xerostomia), content in sialic acid, pH, levels of
magnesium and zinc was also reported (Banoczy et al. 1987; Ben-Aryeh et al. 1988;
Anderson et al. 1993; Yavuzyilmaz et al. 1996; Belce et al. 2000; Mata et al. 2004;
Caldeira et al. 2005). These biochemical changes in saliva of diabetics are not only
related to a dysfunction of the salivary glands secretion, but also with structural and
morphological modifications (Lotti et al. 1988; Caldeira et al. 2005). These changes in the
inorganic and organic composition of salivary secretions may explain the higher
susceptibility to oral infections, as well as dental and periodontal diseases accompanied
by problems in healing. Indeed, it has been described in DM patients a higher prevalence
and severity of periodontal disease. A frequent complaint among diabetics is xerostomia,
which is strongly associated with a reduced salivary flow and other oral symptoms
(Sreebny et al. 1992; Ben-Aryeh et al. 1993).
Qualitative and quantitative proteomic approaches have been developed to better
characterize DM-modulated salivary proteome and peptidome, particularly in type 2 DM
(Rao et al. 2009; Border et al. 2012; Chan et al. 2012). Rao et al. (2009) using 2D-LC-
MS/MS identified 487 proteins in saliva of type 2 DM patients, of which 65 proteins were
increased greater than 2-fold in patients in comparison to healthy subjects. Altered
expressed proteins were associated with metabolic and immune pathways, and from
these alpha-2 macroglobulin, alpha-1-antitrypsin, cystatin C and transthyretin were
upregulated in DM. The authors further validated the proteomic approach assessing the
levels of alpha-2 macroglobulin, alpha-1-antitrypsin, cystatin C, transthyretin and salivary
alpha-amylase by western blotting and ELISA (Rao et al. 2009).
Chan et al. (2012) conducted a study involving the comparison of saliva 2-DE profiles of
type 2 DM subjects with periodontitis and with healthy periodontium. The comparative
analysis showed 7 proteins with significant differential expression. Actin-related protein,
carbonic anhydrase VI, IL-1 receptor antagonist and polymeric immunoglobulin receptor
were downregulated while immunoglobulin J chain, leukocyte elastase inhibitor and
plastin-2 were upregulated in saliva of diabetic patients with periodontitis. The authors

26
concluded that these proteins are involved in the physiological response towards
periodontitis with potential application as biomarkers for the prediction of type 2 diabetic
patients in risk of periodontitis development.
Using label-free quantitative approach, Border et al. (2012) explored the proteome profile
of saliva and found 96 peptides corresponding to 52 proteins differentially expressed
between type 2 DM diabetic edentulous patients and controls. Some diabetes-related
inflammatory biomarkers including GAPDH and serum amyloid A were increased in
diabetic subjects in opposition to decreased levels of amylase, palate, lung and nasal
epithelium associated protein (PLUNC) and serotransferrin. In contrast with previous
works (Rao et al. 2009; Chan et al. 2012), salivary carbonic anhydrase VI, alpha-2-
macroglobulin, PLUNC and uteroglobin were identified in lower levels in diabetic patients
(Border et al. 2012). The authors argue that despite this exploratory study further
validation in a larger population is required to evaluate the potential use of these
differentially expressed proteins as diabetes biomarkers (Border et al. 2012).
Regarding the evaluation of type 1 DM salivary proteome and peptidome, very few studies
are known. Hirtz et al. (2006) used 2-DE-MALDI-TOF/MS to compare the salivary
proteomes of poorly controlled type 1 diabetic patients and controls and identified 23
proteins modulated by the disease. Most of those proteins were underexpressed and
corresponded to isoforms of alpha-amylase (14), isoforms of acidic PRPs (3), isoforms of
salivary cystatin SA-1 (3) and to prolactin inducible protein. Two isoforms of
serotransferrin, known to be implicated in the oral anti-inflammatory process were
overexpressed in patients, suggesting that this pathological condition induces a decrease
of non-immunological defense of oral cavity. Cabras et al. (2010) analyzed the
composition of the acid soluble fraction of whole saliva by RP-HPLC-ESI-MS in children
and adolescents with DM and compared to sex- and age-matched control subjects. The
results showed significant lower levels of statherin, SMR3B and histatins, while the
concentration of alpha-defensins 1, 2 and 4, S100A9 and several small peptides were
increased. This pioneer study highlighted the impairment of salivary peptides involved in
the safeguard of the oral cavity in children with type 1 DM that may contribute to the major
incidence of dental and periodontal diseases in these patients. The low concentration of
P-C (aPRP103-169) peptide was accompanied by high levels of some of its fragments,
fact that could be explained by an increased salivary proteolytic activity.
In overall, the potential of saliva for biomarker discovery to DM, namely type 1, and
related complications is quite unexplored being proteomic and peptidomics approaches

27
promisor’s tools to achieve this goal. Such efforts will promote a deeper knowledge about
saliva proteome/peptidome adaptability and the ongoing development of salivary-based
diagnosis with clinical advantageous outcomes.

28

29
CHAPTER I AIMS

30

31
AIMS
Taking into account the growing interest in saliva as diagnosis fluid namely for type 1 DM,
the general goal of the present thesis was to characterize type 1 DM-induced alterations
in salivary proteome and peptidome, with the perspective of improving understanding of
the pathophysiology of the disease and unraveling novel potential biomarkers, mainly for
DM-related microvascular complications. To accomplish this, specific purposes were
outlined in the original research articles (Studies I, II and III) that comprise chapter II:
i) to characterize type 1 diabetes-induced alterations in the salivary peptidome aiming to
find prospective biomarkers for type 1 DM oral health evaluation and to investigate the
extent and mode of salivary proteolysis, as well as identify the potential proteases
responsible for the oral health alterations in patients (Study I).
ii) to disclose the proteolytic events underlying type 1 DM and related microvascular
complications by performing a straightforward screening of the proteases presents in the
bodily fluids saliva, serum and urine (Study II).
iii) to evaluate the effect of long-term type 1 DM and related microvascular complications
on salivary proteome and peptidome with iTRAQ-based quantitative approach, aiming to
identify potential protein and peptide targets for disease diagnosis (Study III).
List of original studies:
Study I - Caseiro A, Vitorino R, Barros AS, Ferreira R, Calheiros-Lobo MJ, Carvalho D, et
al. Salivary peptidome in type 1 diabetes mellitus. Biomedical Chromatography.
2012;26(5):571-82.
Study II - Caseiro A, Ferreira R, Quintaneiro C, Pereira A, Marinheiro R, Vitorino R, et al.
Protease profiling of different biofluids in type 1 diabetes mellitus. Clinical Biochemistry.
2012;45(18):1613-9.
Study III - Caseiro A, Ferreira R, Quintaneiro C, Pereira A, Marinheiro R, Vitorino R, et al.
Salivary proteome and peptidome profiling in type 1 diabetes mellitus using a quantitative
approach (Under review in Journal of Proteome Research).

32

33
CHAPTER II - EXPERIMENTAL WORK

34
35
STUDY I -
SALIVARY PEPTIDOME IN TYPE 1 DIABETES MELLITUS

36

37

38

39
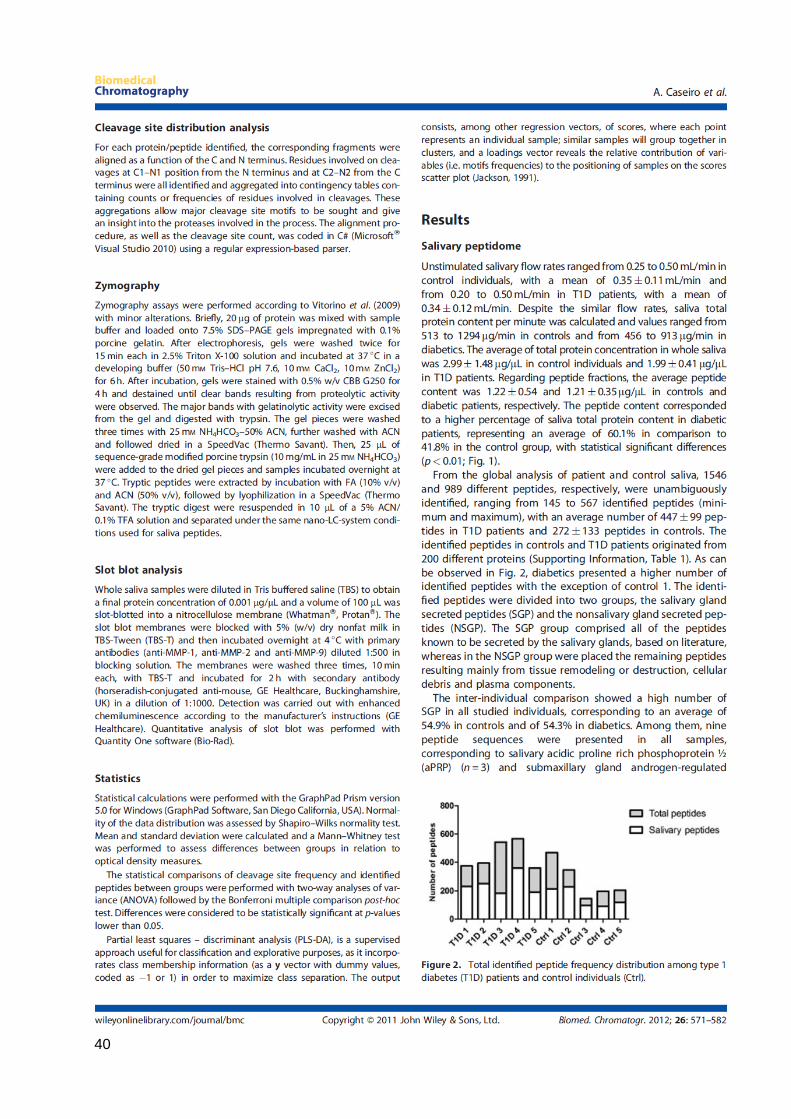
40

41

42

43

44

45
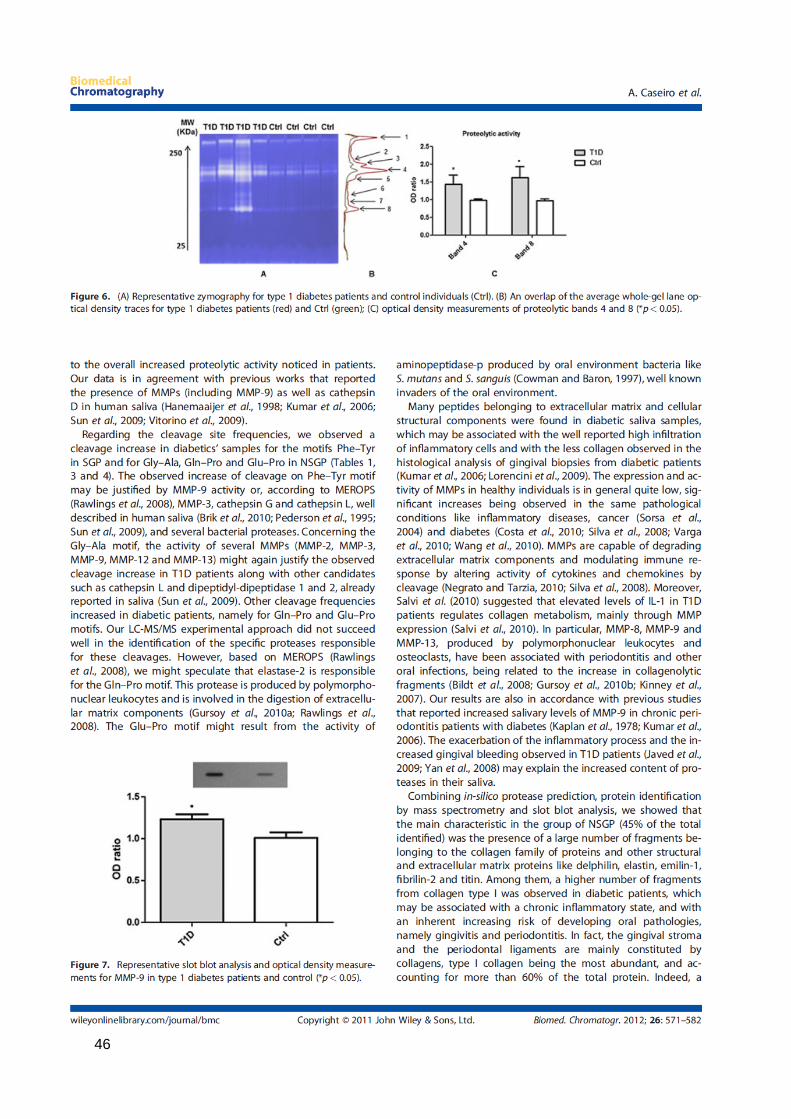
46
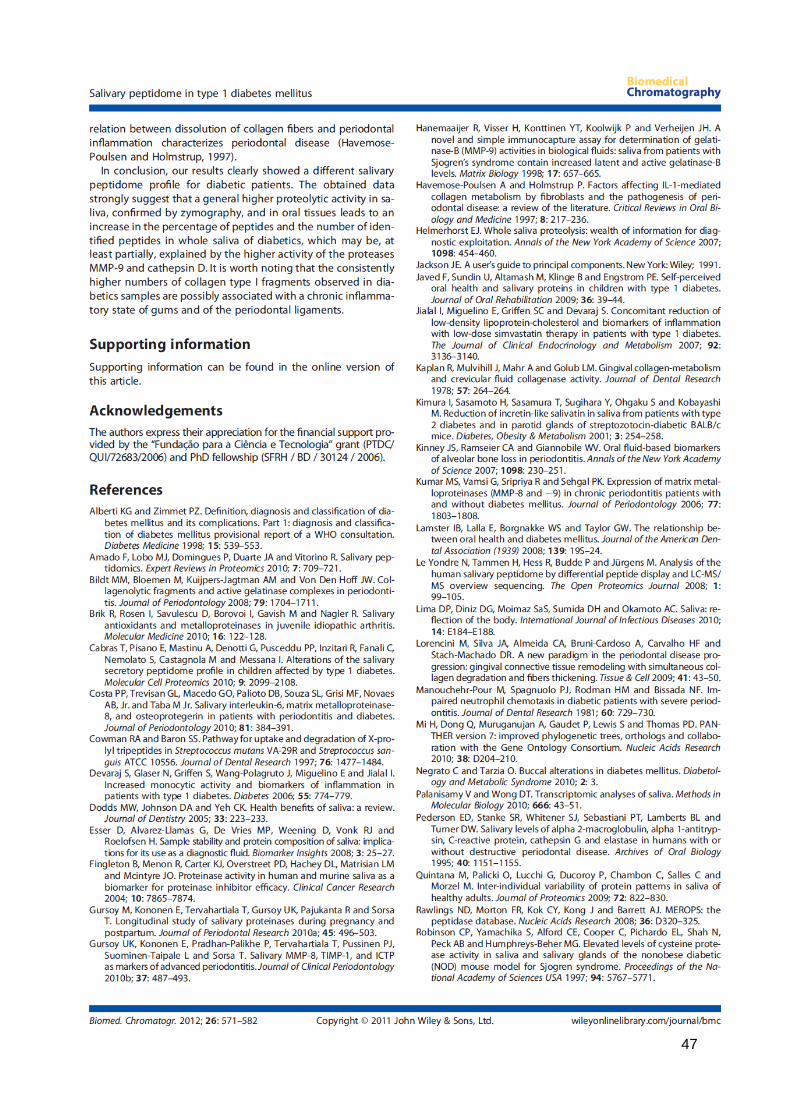
47
48

49
STUDY II -
PROTEASE PROFILING OF DIFFERENT BIOFLUIDS IN TYPE 1 DIABETES MELLITUS

50
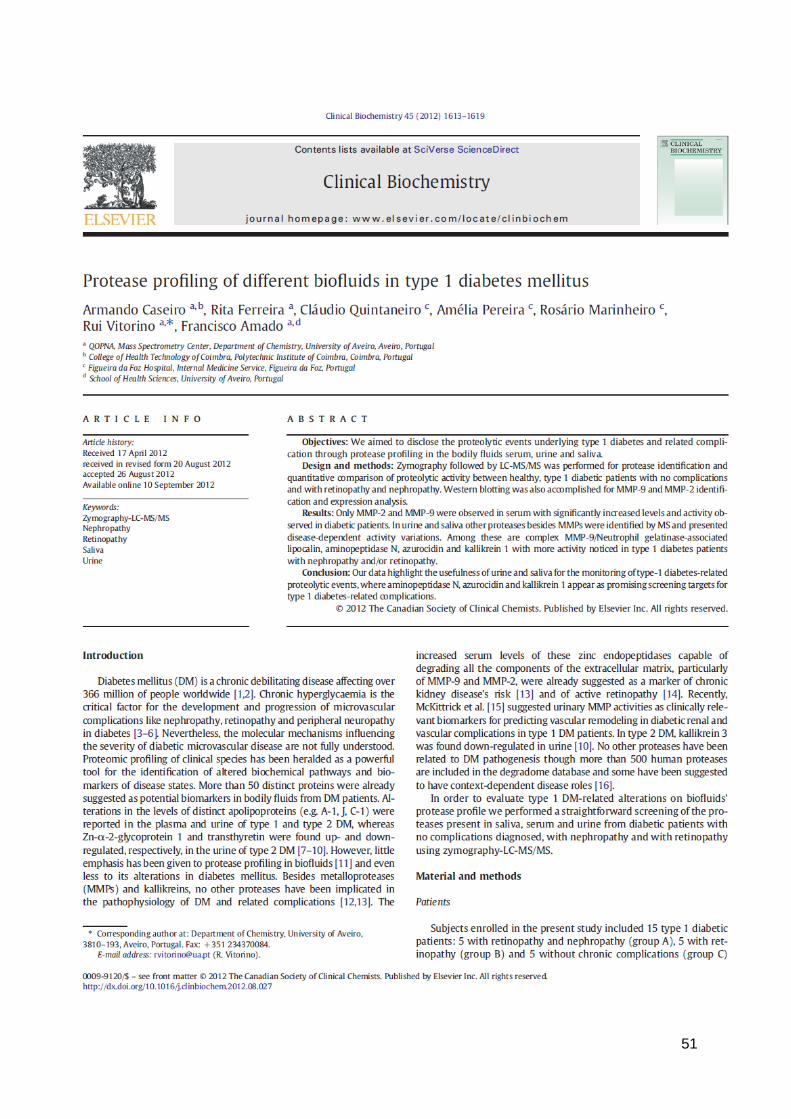
51
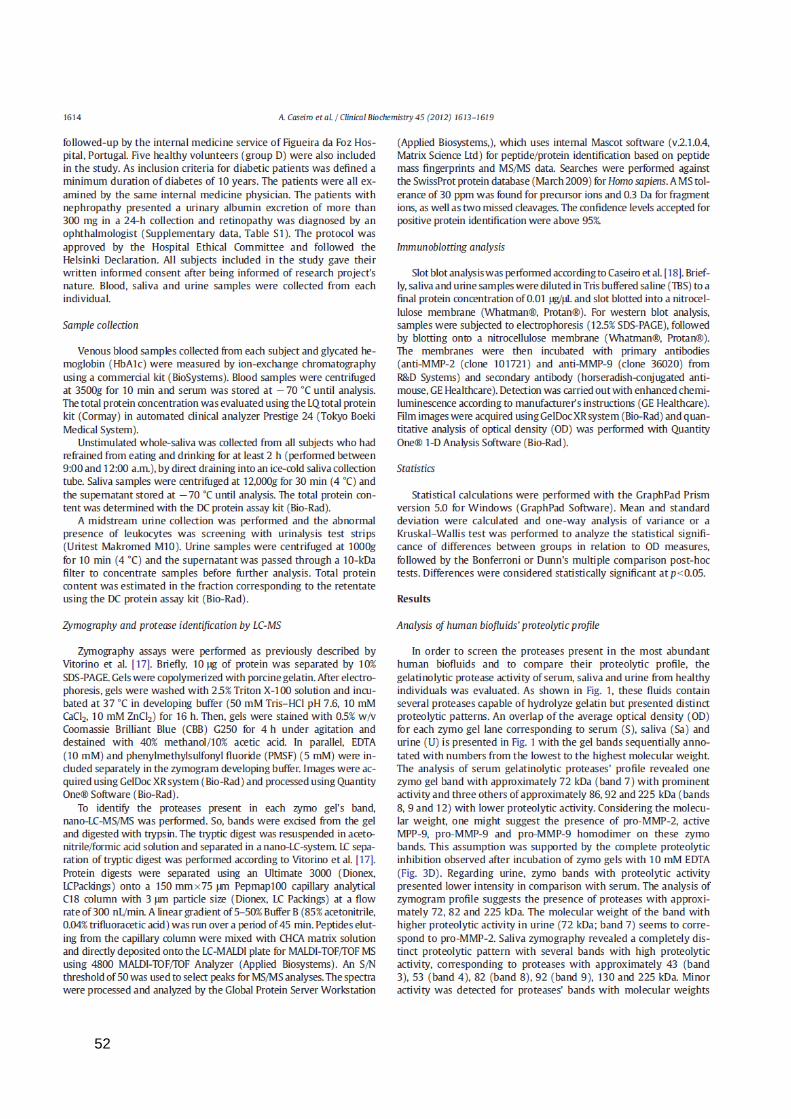
52
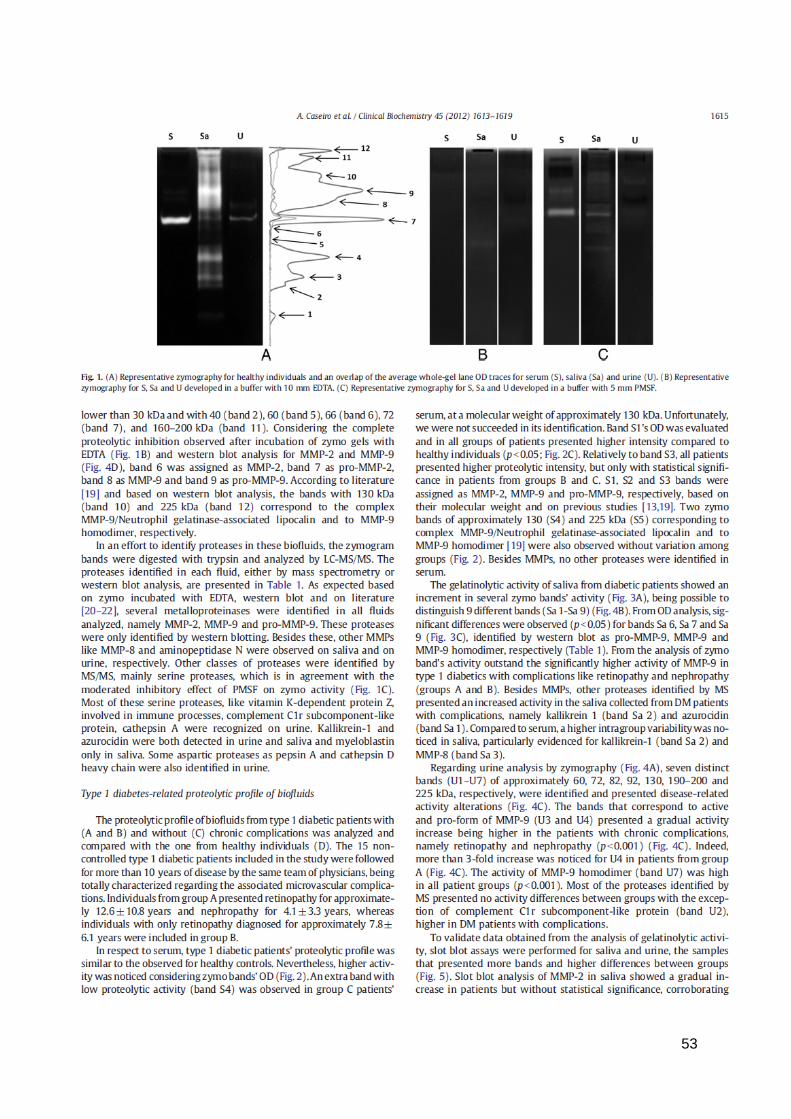
53
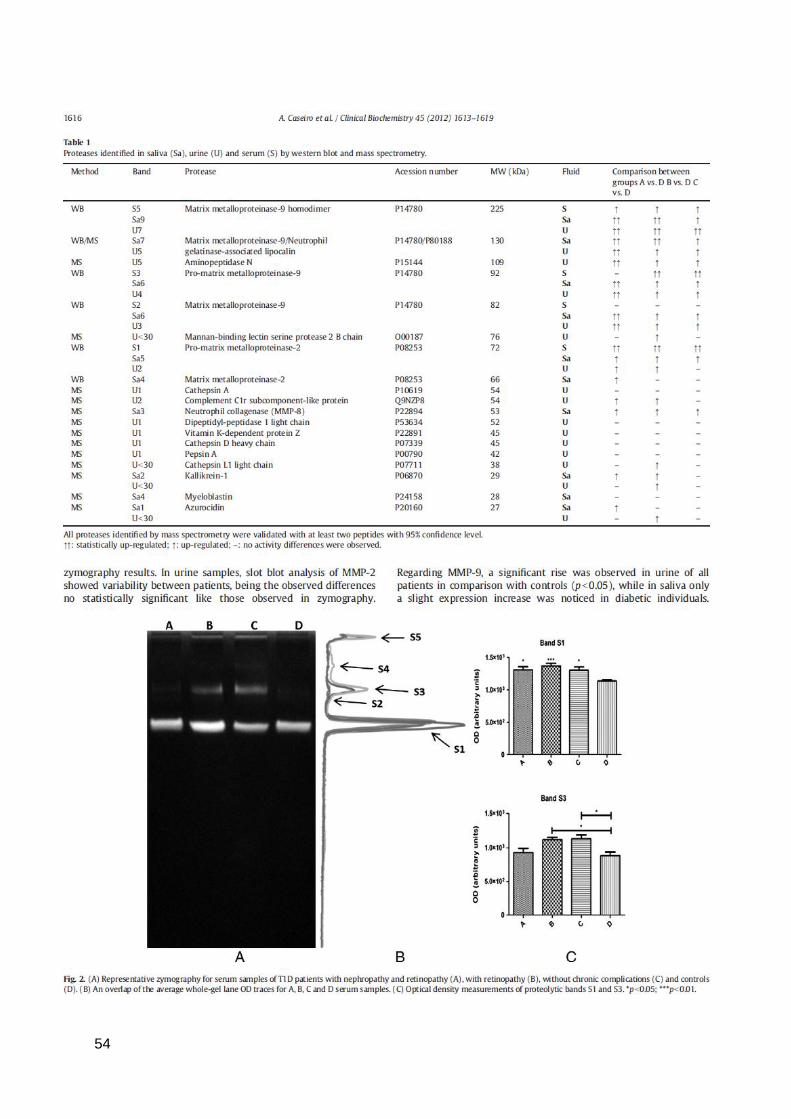
54

55

56

57

58
59
STUDY III -
SALIVARY PROTEOME AND PEPTIDOME PROFILING
IN TYPE 1 DIABETES MELLITUS USING A QUANTITATIVE APPROACH

60
61
Salivary proteome and peptidome profiling in type 1 diabetes mellitus using
a quantitative approach
Armando Caseiro1,2, Rita Ferreira1, Ana Padrão1, Cláudio Quintaneiro3, Amélia Pereira3,
Rosário Marinheiro3, Rui Vitorino1, Francisco Amado1,4
1 QOPNA, Mass spectrometry center, Department of Chemistry, University of Aveiro,
Portugal
2 College of Health Technology of Coimbra, Polytechnic Institute of Coimbra, Coimbra,
Portugal.
3 Figueira da Foz Hospital, Internal Medicine Service, Portugal
4 School of Health Sciences, University of Aveiro, Portugal
Correspondence, Rui Vitorino
Address: Department of Chemistry, University of Aveiro, 3810-193, Aveiro, Portugal
E-mail: [email protected]
Fax: +351234370084
Running title: Salivary proteomics and peptidomics in diabetes
Keywords: Quantitation, LC-MS/MS, nephropathy, retinopathy, saliva
Under review in Journal of Proteome Research
62
Abstract
In the present study we applied iTRAQ-based quantitative approach to explore the
salivary proteome and peptidome profile in selected subjects with type 1 diabetes, with
and without microvascular complications, aiming to identify disease-related markers. From
a total of 434 distinct proteins, bactericidal/permeability-increasing protein-like 1 and
pancreatic adenocarcinoma upregulated factor were found in higher levels in the saliva of
all patients while increased content of other proteins like alpha-2-macroglobulin, defensin
alpha 3 neutrophil-specific, leukocyte elastase inhibitor, matrix metalloproteinase-9,
neutrophil elastase, plastin-2, protein S100-A8 and protein S100-A9 were related with
microvascular complications as retinopathy and nephropathy. Protein-protein interaction
network analysis suggests the functional clusters defense, inflammation and response to
wounding as the most significantly associated with type 1 diabetes pathogenesis.
Peptidome data not only support a diabetes-related higher susceptibility of salivary
proteins to proteolysis (mainly of aPRP, bPRP1 and bPRP2) but also evidenced an
increased content of some specific protein fragments known to be related with bacterial
attachment and the accumulation of phosphopeptides involved in tooth protection.
In overall, the salivary protein and peptide profile highlights the importance of the innate
immune system in the pathogenesis of type 1 diabetes mellitus and related complications.
This study provides an integrated perspective of salivary proteome and peptidome that
should be further explored in future studies targeting specific disease markers.
63
Introduction
In recent years, saliva has attracted widespread interest as a diagnostic fluid [1-7].
Salivary composition generally reflects the health status of an individual or disease
susceptibility for oral and systemic pathologies. The advantages of saliva in comparison
with other bodily fluids for diagnostic purposes are given by its accessibility, noninvasive
and easy collection. The recent advancements in proteomic technologies hold special
promise in the use of saliva to explore novel biomarkers and therapeutic targets [8, 9].
Indeed, new potential diagnostic salivary markers of oral and systemic diseases as dental
and gingival pathology, salivary gland disease, Sjögren syndrome, diabetes, head and
neck carcinoma, breast and gastric cancers, sclerosis and psychiatric and neurological
diseases have been proposed based on proteomic approaches [3, 6-8, 10-12].
Nevertheless, little emphasis has been given to salivary proteome analysis in subjects
with diabetes, namely in type 1 diabetes mellitus (DM) [11, 13] and no study is known that
quantitatively evaluated the saliva proteome and peptidome changes related with this
pathological condition. The importance of quantitative proteomics has been increasingly
recognized aiming to provide useful information for clinical applications once it screens
non-physiological levels of certain proteins and/or peptides that may reflect pathological
conditions [3].
In order to evaluate the effect of more than 12 years of type 1 DM and related
complications on their salivary proteome and peptidome, we performed a iTRAQ analysis
using pooled saliva samples collected from four groups of individuals (subjects with no
diagnosed diabetes-related complications; with nephropathy and retinopathy; with
retinopathy; and healthy individuals) to identify potential protein and peptide targets for
disease diagnosis. The results obtained highlight the involvement of an inflammatory and
immune system response in the pathogenesis of type 1 DM, with higher amounts of
proteins like alpha-2-macroglobulin, MMP-9, S100A8 and S100A9 found in the saliva of
patients with microvascular complications. Salivary peptidome data not only support a
DM-related higher susceptibility of salivary proteins to proteolysis but also evidence an
increased content of some specific protein fragments known to be related with bacterial
attachment and the accumulation of phosphopeptides that seem to be involved in tooth
protection against erosion, more frequent in subjects with diabetes.
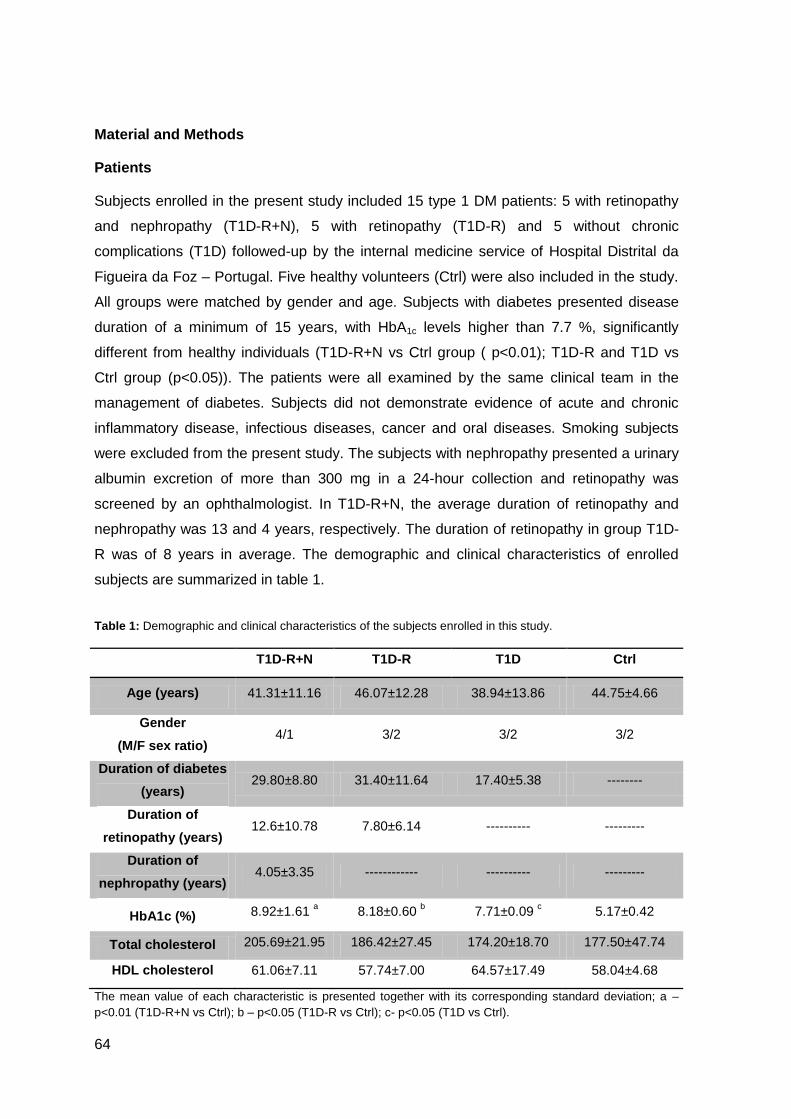
64
Material and Methods
Patients
Subjects enrolled in the present study included 15 type 1 DM patients: 5 with retinopathy
and nephropathy (T1D-R+N), 5 with retinopathy (T1D-R) and 5 without chronic
complications (T1D) followed-up by the internal medicine service of Hospital Distrital da
Figueira da Foz – Portugal. Five healthy volunteers (Ctrl) were also included in the study.
All groups were matched by gender and age. Subjects with diabetes presented disease
duration of a minimum of 15 years, with HbA1c levels higher than 7.7 %, significantly
different from healthy individuals (T1D-R+N vs Ctrl group ( p<0.01); T1D-R and T1D vs
Ctrl group (p<0.05)). The patients were all examined by the same clinical team in the
management of diabetes. Subjects did not demonstrate evidence of acute and chronic
inflammatory disease, infectious diseases, cancer and oral diseases. Smoking subjects
were excluded from the present study. The subjects with nephropathy presented a urinary
albumin excretion of more than 300 mg in a 24-hour collection and retinopathy was
screened by an ophthalmologist. In T1D-R+N, the average duration of retinopathy and
nephropathy was 13 and 4 years, respectively. The duration of retinopathy in group T1D-
R was of 8 years in average. The demographic and clinical characteristics of enrolled
subjects are summarized in table 1.
Table 1: Demographic and clinical characteristics of the subjects enrolled in this study.
T1D-R+N T1D-R T1D Ctrl
Age (years) 41.31±11.16 46.07±12.28 38.94±13.86 44.75±4.66
Gender
(M/F sex ratio) 4/1 3/2 3/2 3/2
Duration of diabetes
(years) 29.80±8.80 31.40±11.64 17.40±5.38 --------
Duration of
retinopathy (years) 12.6±10.78 7.80±6.14 ---------- ---------
Duration of
nephropathy (years) 4.05±3.35 ------------ ---------- ---------
HbA1c (%) 8.92±1.61 a 8.18±0.60
b 7.71±0.09
c 5.17±0.42
Total cholesterol 205.69±21.95 186.42±27.45 174.20±18.70 177.50±47.74
HDL cholesterol 61.06±7.11 57.74±7.00 64.57±17.49 58.04±4.68
The mean value of each characteristic is presented together with its corresponding standard deviation; a –
p<0.01 (T1D-R+N vs Ctrl); b – p<0.05 (T1D-R vs Ctrl); c- p<0.05 (T1D vs Ctrl).
65
The present study was approved by the Hospital Ethical Committee and followed the
Helsinki Declaration. All subjects included in the study gave their written informed consent
after being informed of the research project’s nature. Saliva and blood samples were
collected from each individual.
Sample collection
Unstimulated whole-saliva was collected from all subjects who had refrained from eating
and drinking for at least 2 hours (performed between 9:00 and 12:00 a.m.), by direct
draining into an ice-cold saliva collection tube. The sample collection time and volume
were registered for each individual. Saliva samples were prepared according to Vitorino et
al. [14]. Briefly, saliva was mixed with solubilization buffer (7 M urea, 2 M thiourea, 1 %
(w/v) CHAPS, 1 % Triton X-100) in the proportion of 2:1. The mixture was sonicated (2
cycles of 5 s each) and then centrifuged at 12000 g for 30 min at 4ºC. The supernatant
was stored at -70 ºC until analysis. The total protein content was estimated using the DC
protein assay kit (Bio-Rad, Hercules, CA.).
Digestion of salivary proteins
For iTRAQ analysis, salivary pools were prepared for each experimental group. Each
saliva pool was prepared using equal amounts of total protein from each individual per
group. The volume of sample pools was normalized for trypsin digestion. Aliquots of 100
μg of protein were analyzed in duplicate. An in-solution digestion was performed for
iTRAQ labeling according to the protocol provided by the manufacturer (Applied
Biosystems, Foster City, CA). Two independent runs were carried out. Briefly, proteins
were reduced, alkylated and digested. Samples were mixed with triethyl ammonium
bicarbonate buffer (TEAB) (1 M, pH 8.5) and RapiGest (Waters) to a final concentration of
0.5 M and 0.1 %, respectively and then reduced with 50 mM tris(2-carboxyethyl)
phosphine (TCEP) for 1 h at 37 ºC and alkylated with 10 mM S-Methyl
methanethiosulfonate (MMTS) for 10 min at room temperature. The aliquots were
digested with trypsin (Promega, Madison, WI, USA) at a protein-to-enzyme ratio of 10:1 at
37 ºC overnight and then dried in a Speed-Vac (Thermo Savant, NY, USA).
Peptide labeling with iTRAQs
After protein digestion, the extracted peptides were labeled with iTRAQ reagents (4-plex)
according to the manufacturer’s instructions (Applied Biosystems, Foster City, CA).
Briefly, one vial of iTRAQ reagent, previously dissolved in 70 µl of ethanol, was added to
each aliquot and incubated for two hours at room temperature. The reaction was stopped

66
by adding water and the labeled digests corresponding to each of the four 4-plex
experiments were combined and dried in the Speed-Vac (Thermo Savant, NY, USA).
Peptide separation by multidimensional LC
The tryptic labeled digests were separated by a multidimensional approach based on a
first dimension with high pH reverse-phase and a second dimension with the acidic
reverse-phase system as previously described [14]. In the first dimension, sample loading
was performed at 200 µL/min with buffers (A) 72 mM TEA, 52 mM acetic acid in H2O, pH
10 and (B) 72 mM TEA, 52 mM acetic acid in acetonitrile (ACN), pH 10 (98 % A: 2 % B).
After 5 min of sample loading and washing, peptide fractionation was performed with
linear gradient to 50 % B over 35 min followed by a 100 % B step. Sixteen fractions were
collected, evaporated, and resuspended in 2 % ACN and 0.1 % trifluoracetic acid (TFA).
Collected fractions were separated using an Ultimate 3000 (Dionex, LCPackings,
Sunnyvale, CA) onto a 150 mm × 75 µm Pepmap100 capillary analytical C18 column with
3 µm particle size (Dionex, LC Packings) at a flow rate of 300 nL/min. The mobile phases
A and B were 2 % ACN 0.1 % TFA in water and 95 % ACN, 0.045 % TFA, respectively.
The gradient started at 10 min and ramped to 60 % B till 50 min and 100 % B at 55 min
and retained 100 % B till 65 min. The chromatographic separation was monitored at 214
nm using a UV detector (Dionex/LC Packings) equipped with a 3 nL flow cell. The
peptides eluting from the column were mixed with a continuous flow of matrix solution
(270 nL/min, 2 mg/mL α-CHCA in 70 % ACN/0.3 % TFA and internal standard Glu-Fib at
15 ftmol) in a fractions microcollector (Probot, Dionex/LC Packings) and directly deposited
onto the LC-MALDI plates at 12 s intervals for each spot (150 nL/fraction). For every
chromatographic run, a total of 208 fractions were collected.
Separation of endogenous salivary peptides
Salivary endogenous peptides were extracted as previously described [15]. To 200 µL of
supernantant obtained in sample collection section, ice-cold acetone was added drop by
drop in the proportion of 9:1. After agitation on ice for 1 h, the mixture was centrifuged at
19000 g for 15 min. The supernatant containing peptides were separated and saved for
subsequent analysis. The pellet was resuspended in 200 µL ACN /12 mM HCl, incubated
during 1 h on ice under agitation and centrifuged again at 19000 g for 15 min. The
obtained supernatant was added to the previous one and dried in a Speed Vac for
subsequent analysis.
67
Protein ID and quantification
MALDI-TOF/TOF MS analysis was performed using a 4800 MALDI-TOF/TOF Analyzer
(Applied Biosystems, Foster City, CA), as described by Vitorino et al [14]. A S/N threshold
of 50 was used to select peaks for MS/MS analyses. A fragmentation voltage of 2 kV was
used throughout the automated runs. The spectra were processed and analyzed by the
ProteinPilot software (v4.0 AB Sciex, USA), which uses paragon algorithm for
protein/peptide identification based on MS/MS data. Searches were performed against the
SwissProt protein database (release date 01012011) for Homo sapiens. Default search
parameters were used: specifying trypsin as the digestion enzyme, fixed modification of
methylathion on cysteine residue and iTRAQ 4Plex, biological modification with emphasis
on phosphorylation and urea denaturation as the variable modification setting. The mass
tolerances for precursor and fragments were default values for ProteinPilot®. The cut-off
score value for protein identification with ProteinPilot® was a ProteoScore of 1.3 (95%
confidence). The false discovery rate at this cut off level is lower than 5%.
Data was normalized for loading error by bias correction, which is an algorithm in
ProteinPilot that corrects for unequal mixing when combining the labeled samples of one
experiment. It does so by calculating the median protein ratio for all proteins reported in
each sample, adjusted to unity and assigning an autobias factor to it. Nevertheless, the
quantification results were reviewed manually for all proteins found to be differentially
expressed (iTRAQ ratio>1.3 or<0.7 according to Vitorino et al. [16]).
Immunoblotting analysis
Slot blot analysis were performed according to Caseiro et al. [17] with slight modifications.
In brief, saliva samples were diluted in Tris buffered saline (TBS) to a final protein
concentration of 0.01 µg/µL and a volume of 100 µL was slot-blotted into a nitrocellulose
membrane (Hybond-ECL; Amersham Pharmacia Biotech, Buckinghamshire, UK). The
membranes were blocked with 5 % (w/v) dry non-fat milk in TBS-Tween (TBS-T) and then
incubated overnight at 4ºC with the primary antibodies anti-deleted in malignant brain
tumors 1 protein (Rabbit anti-deleted in malignant brain tumors, P4856Rb, EiAab,
Gentaur, Kampenhout, Belgium), anti-cystatin S (Rabbit anti-cystatin S polyclonal
antibody, ab58515, Abcam, Cambridge, UK), anti-histatin 1 (Rabbit anti-histatin 1
polyclonal antibody, ab81089, Abcam, Cambrige, UK) and anti-C-reactive protein (Rabbit
anti-C-reactive protein monoclonal antibody, ab32412, Abcam, Cambrige, UK) diluted
1:500 in blocking solution and anti-amylase (Rabbit anti-amylase polyclonal antibody,

68
A8273, Sigma, St. Louis, USA) diluted 1:1000 in blocking solution. The membranes were
washed three times, ten minutes each, with TBS-T and incubated two hours with
secondary antibody (horseradish-conjugated anti-mouse, GE Healthcare,
Buckinghamshire, UK) in a dilution of 1:10000. Detection was carried out with enhanced
chemiluminescence according to manufacturer’s instructions (GE Healthcare). Film
images were acquired using GelDoc XR system (Bio-Rad, Hercules, CA.) and quantitative
analysis of optical density (OD) was performed with Quantity One® 1-D Analysis Software
(Bio-Rad, Hercules, CA.).
Statistics
Statistical calculations were performed with the GraphPad Prism version 5.0 for Windows
(GraphPad Software, San Diego California, USA). Mean and standard deviation were
calculated and a Kruskal-Wallis test was performed to analyze the statistical significance
of differences between groups in relation to OD measures, followed by Dunn's multiple
comparison post-hoc test. Differences were considered statistically significant at p values
lower than 0.05.

69
Results
Saliva proteome profiling
The merge of two datasets obtained from LC independent runs resulted in the
identification of 3834 peptides when based on peptide identifications with ProteinPilot
score higher than 1.3 (confidence level of 95 %) and a false discovery rate (FDR) lower
than 5 %. In overall, 443 distinct proteins were identified, most of which assigned as
presenting catalytic activity (22.6 %) involved in protein binding (30.9 %) and structural
molecule activity (17.8 %) according to PANTHER classification system
(http://www.pantherdb.org). The mean percent peptide coverage for the complete panel of
proteins was 33.7 % (±22.9) with a range of 1.3 % to 89.2 % of coverage. The
reproducibility of the experiment was evaluated, and the correlation coefficient was higher
than 0.94 in all groups (Supplementary figure S1). Forty four percent of the identified
proteins are from different annotated sources besides saliva, like serum and squamous
cells.
The relative quantitation of saliva proteins among the four groups (diabetics with no
diagnosed complications (T1D), with retinopathy (T1D-R), with retinopathy and
nephropathy (T1D-R+N) and healthy individuals (Ctrl)) was firstly evaluated using pools to
identify potential protein targets for subsequent confirmation using antibody-based
methodologies in all individuals included in the present study. iTRAQ data was analyzed
as pairwise ratios: T1D-R+N against the Ctrl (iTRAQ113/iTRAQ116), the T1D+R against
the Ctrl (iTRAQ114/iTRAQ116) and the T1D against Ctrl (iTRAQ115/iTRAQ116).
Following data analysis, 26 protein candidates (6 % of all identified proteins) were found
differentially expressed (p<0.05) in diabetics’ saliva (T1D-R+N, T1D-R and T1D)
compared with control samples (Ctrl) (Supplementary table S1). Figure 1 illustrates the
comparison of the log ratio of the relative intensity (T1D-R+N /Ctrl; T1D-R/Ctrl and
T1D/Ctrl) to better visualize the salivary proteins differentially modulated by type 1 DM
and related complications. As can be depicted from this figure, specific proteins were
detected in high levels in all DM patient groups, like bactericidal/permeability-increasing
protein-like 1 and pancreatic adenocarcinoma upregulated factor. Other proteins were
only found overexpressed in T1D-R+N group, such as alpha-2-macroglobulin, defensin
alpha 3 neutrophil-specific, leukocyte elastase inhibitor, matrix metalloproteinase-9 and
neutrophil elastase. Proteins like L-plastin variant (fragment), plastin-2, protein S100-A8
and protein S100-A9 were detected in higher levels in the saliva of DM patients with
chronic complications (T1D-R+N and T1D-R), though in increased amounts in T1D-R+N
patients.
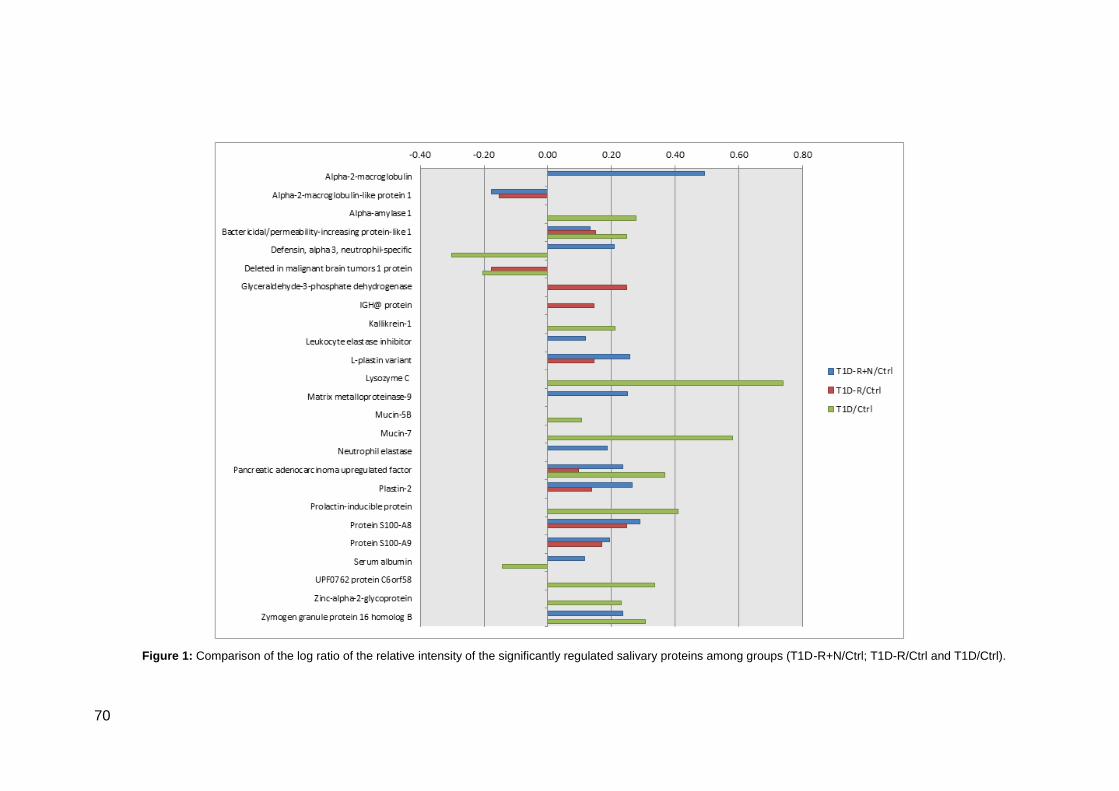
70
Figure 1: Comparison of the log ratio of the relative intensity of the significantly regulated salivary proteins among groups (T1D-R+N/Ctrl; T1D-R/Ctrl and T1D/Ctrl).
71
Looking to the molecular functions and the associated biological processes of these
differentially expressed proteins, according to PANTHER (Supplementary figure S2), it
can be noticed that the majority are involved in metabolic pathways (23.3 %) and in the
immune response (23.3 %). Proteins related to cellular and developmental processes
comprise 16.7 % and 3.3 %, respectively, of all DM-modulated salivary proteins. Clusters
like cell communication (13.3 %), cellular component organization (3.3 %), response to
stimulus (16.7 %) and transport (11.1 %) were also among the ones responsive to DM.
An integrated analysis of all proteins found in different levels among groups was
performed with Cytoscape (v2.8.3). The protein-protein interaction network presented in
figure 2 was imported from Intact (http://www.ebi.ac.uk/intact/) and contains 266 proteins
and 334 protein-protein interactions. These proteins are distributed in ten clusters
(Supplementary figure S3), one of which including a downregulated protein, agglutinin
(DMBT1), known to interact with proteins involved in proliferation (PARD6B and
CDK5RAP3). To identify the relevant biological pathways that were altered in type 1 DM,
BiNGO [18] was used to find GO biological pathway and molecular function terms that
were enriched among the differentially expressed proteins in the network. In total 576
biological pathway terms and 65 molecular function terms are annotated in association
with the differentially expressed proteins. Regarding biological pathways, the most
significant ones modulated by type 1 DM are defense, inflammation and response to
wounding. Protein binding is the most significant molecular functions found altered in
diabetics. Considering the disease-related downregulated proteins, it can be noticed that
the majority are involved in binding to bacteria surface.
There are some interactions centered in the overexpressed proteins that are evidenced.
For instance, increased levels of alpha-2-macroglobulin seem to be related with
alterations in lipid metabolism as evidenced by protein-protein interactions with LCAT,
LRP1, leptin and ApoE. This protein is also associated with inflammation as evidenced by
its interaction with cytokines as IL-1B and proteins from SERPIN family. The clusters
centered in the inflammatory S100 proteins interact with adhesion proteins as VCAM,
signaling proteins, namely from the NF-kB pathway, MAP kinase or GTPase mediated
signal transduction, and with proteins involved in the regulation of proliferation (e.g. RIF1,
CDK2, TP53, GDF9). These S100 proteins are also known to interact with proteins from
bacteria and virus as for example glycoprotein B from the human herpesvirus 5. A clear
association of the overexpressed PAUF with Toll-like receptors can also be depicted from
figure 2. Mostly of the salivary proteins are included in a protein-protein interaction cluster
centered in Mucins and amylase.

72
Figure 2: Protein interaction network generated with Intact [56] and visualized with Cytoscape (v2.8.3) consisting of 266 proteins connected by 334 protein-protein interactions.
Major clusters of interacting proteins include those involved in defense, inflammation and response to wounding. Green nodes represent upregulated proteins and red nodes
downregulated ones in the saliva of subjects with type 1 diabetes.
73
MUC7, MUC5B and AMY1A interact with statherin, histatins and PRPs. Redox proteins as
SOD2 and PRDX3 are also included in this cluster.
For the validation of iTRAQ experiments, immunoblotting analysis of target proteins was
performed in individual samples. In this sense, cystatin S, deleted in malignant brain
tumors 1 protein and amylase expression were evaluated in triplicate in all saliva samples
(from the 15 patients and 5 controls; Figure 3) and data obtained highlight the same
tendency observed with iTRAQ analysis. Cystatin S did not present statistical differences
between groups as well as in iTRAQ experiment and deleted in malignant brain tumors 1
protein showed DM-related lower values, corroborating iTRAQ data. Increased levels of
amylase were observed, in accordance with iTRAQ data, though more significant in T1D-
R. C-reactive protein was evaluated in serum samples from the same individuals to
screen the inflammatory status. As can be seen in figure 3, significantly higher levels of
this inflammatory protein were observed in diabetics with retinopathy and nephropathy.
Saliva peptidome profiling
Saliva contains several protein species of low molecular weight, comprising around 20–
30% of the total secreted proteins [19], which contributes to the oral cavity homeostasis.
From the LC-MS/MS analysis of endogenous salivary peptides, 794 different sequences
from the main salivary protein classes (bPRP1, bPRP2, bPRP3, bPRP4, histatin 1,
histatin 3, aPRP, MUC7, PIgR, statherin, SMR3B (P-B peptide) and PROL4) were
identified (Supplementary table S2), being aPRP1, bPRP1 and bPRP2 the most
representative ones. The distribution of the identified peptides by patient groups can be
depicted in figure 4. An average of 270 ± 26 peptides was identified per group and from
these 182 peptides were common to all groups, 48 were exclusively identified in healthy
individuals, 58 in T1D-R+N, 49 in T1D-R and 69 in T1D (Supplementary table S3).
Comparing the distribution among groups (Table 2), an increase of bPRP2 was observed
in T1D-R+N group in relation to Ctrl (51.50 ± 8.49 vs. 36.25 ± 5.30, p<0.05) and a
decrease of aPRP peptides in all diabetic patient groups (T1D-R+N, T1D-R and T1D;
p<0.05, p<0.001 and p<0.001, respectively). Looking to the unique peptides identified in
each group, a predominance of bPRP1 peptides was notorious in diabetics while a higher
number of aPRP and statherin unique peptides were noticed in healthy individuals. The
alignment of those unique peptides in the main protein sequences evidenced an
enrichment of N-terminal peptides from bPRP1 and C-terminal peptides from aPRP in
subjects with diabetes (Figure 5). Moreover, the cleavage site motifs were annotated
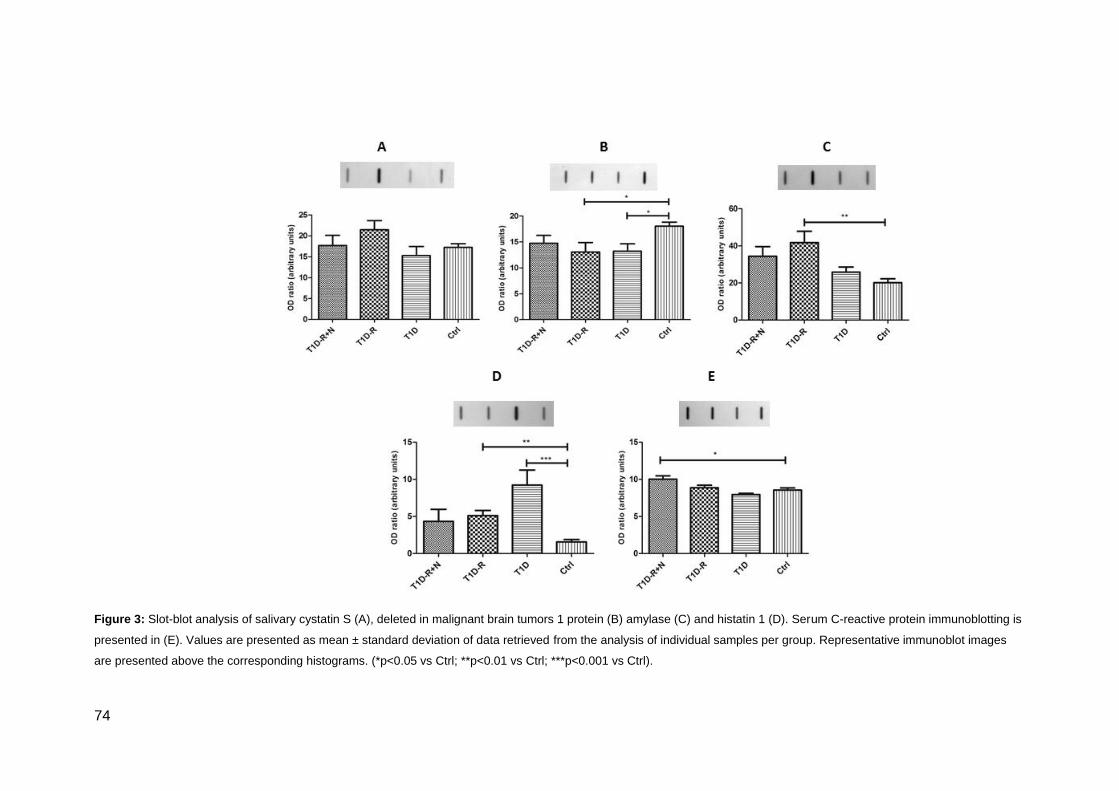
74
Figure 3: Slot-blot analysis of salivary cystatin S (A), deleted in malignant brain tumors 1 protein (B) amylase (C) and histatin 1 (D). Serum C-reactive protein immunoblotting is
presented in (E). Values are presented as mean ± standard deviation of data retrieved from the analysis of individual samples per group. Representative immunoblot images
are presented above the corresponding histograms. (*p<0.05 vs Ctrl; **p<0.01 vs Ctrl; ***p<0.001 vs Ctrl).

75
Table 2: Distribution of the identified peptides per group and protein class according to their relative abundance. Data is presented as mean ± STD.
T1D-R+N T1D-R T1D Ctrl
Basic salivary proline-rich protein 1 (bPRP1) 55.25±11.67 47.50±16.26 55.25±7.42 42.50±4.24
Basic salivary proline-rich protein 2 (bPRP2) 51.50±8.49 35.50±11.31 47.25±7.42 36.25±5.30
Basic salivary proline-rich protein 3 (bPRP3) 15.75±2.47 14.25±4.60 15.75±1.06 19.50±2.83
Basic salivary proline-rich protein 4 (bPRP4) 25.00±4.24 13.00±6.36 10.75±0.35 18.75±1.77
Histatin 1 13.75±6.72 19.00±9.90 12.75±0.35 12.75±1.06
Histatin 3 5.75±0.35 7.25±1.77 10.75±5.30 2.00±1.41
Mucin-7 (MUC7) 8.00±0.71 4.25±1.06 7.50±4.95 7.00±0.71
Polymeric immunoglobulin receptor (PIgR) 1.25±0.35 1.00±0.00 2.75±1.77 1.75±0.35
Proline-rich protein 4 (PROL4) 1.50±0.71 0.75±1.06 0.25±0.35 1.75±1.06
Salivary acidic proline-rich phosphoprotein 1/2 (aPRP) 65.50±13.44 51.25±18.74 56.25±11.67 81.75±10.25
Statherin 27.25±8.13 19.75±9.55 20.25±3.18 30.25±1.06
Submaxillary gland androgen-regulated protein 3B (SMR3B) 29.25±12.37 26.25±8.84 18.25±7.42 29.00±5.66
Total 299.00±69.30 239.75±83.79 257.75±36.42 283.25±21.57
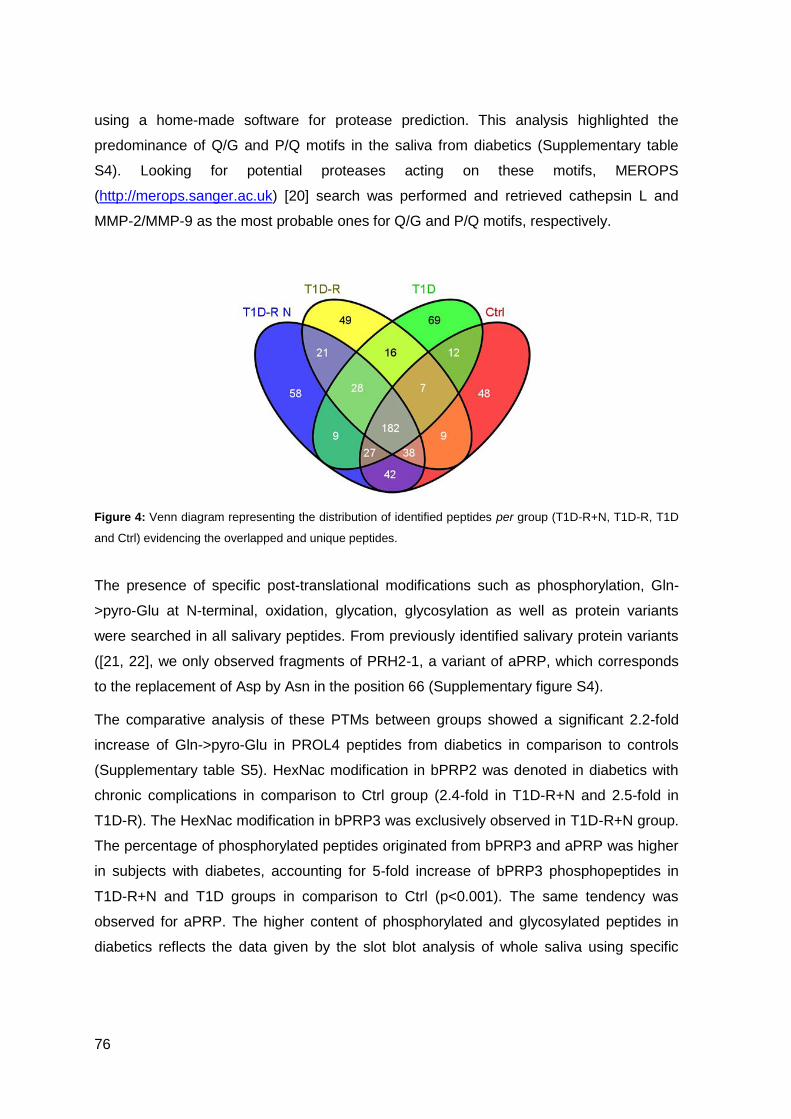
76
using a home-made software for protease prediction. This analysis highlighted the
predominance of Q/G and P/Q motifs in the saliva from diabetics (Supplementary table
S4). Looking for potential proteases acting on these motifs, MEROPS
(http://merops.sanger.ac.uk) [20] search was performed and retrieved cathepsin L and
MMP-2/MMP-9 as the most probable ones for Q/G and P/Q motifs, respectively.
Figure 4: Venn diagram representing the distribution of identified peptides per group (T1D-R+N, T1D-R, T1D
and Ctrl) evidencing the overlapped and unique peptides.
The presence of specific post-translational modifications such as phosphorylation, Gln-
>pyro-Glu at N-terminal, oxidation, glycation, glycosylation as well as protein variants
were searched in all salivary peptides. From previously identified salivary protein variants
([21, 22], we only observed fragments of PRH2-1, a variant of aPRP, which corresponds
to the replacement of Asp by Asn in the position 66 (Supplementary figure S4).
The comparative analysis of these PTMs between groups showed a significant 2.2-fold
increase of Gln->pyro-Glu in PROL4 peptides from diabetics in comparison to controls
(Supplementary table S5). HexNac modification in bPRP2 was denoted in diabetics with
chronic complications in comparison to Ctrl group (2.4-fold in T1D-R+N and 2.5-fold in
T1D-R). The HexNac modification in bPRP3 was exclusively observed in T1D-R+N group.
The percentage of phosphorylated peptides originated from bPRP3 and aPRP was higher
in subjects with diabetes, accounting for 5-fold increase of bPRP3 phosphopeptides in
T1D-R+N and T1D groups in comparison to Ctrl (p<0.001). The same tendency was
observed for aPRP. The higher content of phosphorylated and glycosylated peptides in
diabetics reflects the data given by the slot blot analysis of whole saliva using specific

77
staining methods (Diamond ProQ and Emerald ProQ, respectively) for these modifications
(Supplementary figure S5).
In order to evaluate the impact of DM in saliva peptidome, we performed a comparative
iTRAQ-based analysis of identified peptides between patients with and without chronic
complications and controls (Supplementary figures S6-S9). From all identified peptides
above-referred, 99 presented differences among groups (Supplementary table S6). From
these, fragments of histatin 1 presented higher levels in T1D and T1D-R. This tendency
was also observed by immunoblotting for intact histatin 1 (figure 3D). Statistical
significance was observed for 5 distinct peptides (Table 3). For instance, the peptides
originated from bPRP3 (289GPPPPPQGGRPHRPPQGQPPQ309 and
297GRPHRPPQGQPPQ309) were observed in higher levels in T1D group (p<0.01) whereas
the peptide 297GRPHRPPQGQPPQ309 was only found in increased amount in group T1D-
R group (p<0.05). The peptide 148GPPPQGGRPQGPPQGQSPQ166 from aPRP was
detected in higher levels in patients groups T1D-R and T1D (p<0.001,
Figure 5).
Figure 5: bPRP1 and aPRP main sequences evidencing the location of the unique peptides identified in all
groups (light blue) and only in diabetics (dark blue).

78
Table 3: Peptides presented in significantly different levels between groups identified based on iTRAQ analysis. Data is presented as mean ±STD.
# T1D-R+N, T1D-R and T1D vs Ctrl (p<0.001);
£T1D-R+N vs Ctrl (p<0.05);
¥ T1D vs Ctrl (p<0.01);
Ω T1D-R vs Ctrl (p<0.01);
ǂ T1D vs Ctrl (p<0.05);
ϕ T1D-R vs
Ctrl (p<0.001); ɷT1D vs Ctrl (p<0.05).
Name Conf Sequence ∆Mass Theor m/z T1D-R+N
/Ctrl
T1D-R
/Ctrl
T1D
/Ctrl
Basic salivary proline-rich protein 1 (bPRP1) or basic
salivary proline-rich protein 2 (bPRP2)
98 GPPPQGGNKPQGPPPPGKPQ 0.02 2844.62 5.92±0.03
# 6.58±0.02
# 6.64±0.06
#
99 GPPQQEGNNPQGPPPPAGGNPQQPQ 0.05 2792.37 4.54±0.02
£ 1.17±0.00 2.18±0.02
Basic salivary proline-rich protein 3 (bPRP3)
96 GRPHRPPQGQPPQ 0.00 1755.97 1.41±0.01 1.37±0.00 5.25±0.05
¥
99 GPPPPPQGGRPHRPPQGQPPQ 0.07 2483.33 1.68±0.01 6.50±0.02
Ω 6.77±0.06
ǂ
Salivary acidic proline-rich phosphoprotein 1/2 (aPRP)
96 GPPPQGGRPQGPPQGQSPQ -0.02 2171.13 2.10±0.01 11.17±0.03
ϕ 12.61±0.11
ɷ

79
Discussion
To the best of our knowledge, the present study represents the first attempt to determine
salivary protein profile alterations in type 1 diabetes mellitus using iTRAQ experiment. The
objective of this approach was to compare salivary proteome and peptidome profiles
among diabetics (with and without chronic complications) and healthy individuals (control
group). Only clinically characterized subjects with type 1 diabetes, with a history of more
than 12 years of disease and grouped according to DM-related complications, were
selected by physicians for the present study. No other systemic and oral diseases were
clinically evident. All subjects with diabetes presented significantly augmented HbA1c
levels in comparison to the control group, being these differences higher in patients with
retinopathy and nephropathy despiting not significant differences of diabetes duration
(Table 1).
From the comparative analysis of saliva proteome performed by LC-MS/MS with iTRAQs,
several proteins were identified that could potentially be used to distinguish individuals
with type 1 DM as well as the ones with chronic complications associated with this
disease. According to PANTHER, the majority of them are involved in metabolic (23.3 %)
and immune response (23.3 %) processes, which corroborates the nature of the
pathology, e.g. a metabolic disorder accompanied with inflammation [23]. This phenotype
was further corroborated by protein-protein interaction network analysis of differentially
expressed proteins performed with Cytoscape. This analysis highlighted the functional
clusters defense, inflammation and response to wounding as the most relevantly
modulated by type 1 DM. These findings are in accordance with data retrieved from the
integrative analysis of diabetes mellitus-related proteome alterations of biofluids, which
suggests the involvement of immune and cellular processes independently of the fluid
analyzed [24].
The significant upregulation of bactericidal/permeability-increasing protein-like 1 (BPI) and
Pancreatic adenocarcinoma factor (PAUF) in the saliva of all diabetics clearly suggest the
activation of the immune system in type 1 DM. BPI is an essential component of the
innate immune system with bacteriostatic and bactericidal effects against gram-negative
bacteria through lipopolysaccharides binding [25, 26], whereas PAUF is an endogenous
ligand of Toll-like receptor 2 (TLR2) and Toll-like receptor 4 (TLR4) [27]. TLR2 ligand
stimulation induces nuclear translocation of nuclear factor-B through MyD88-dependent
intracellular signaling pathway, modulating gene transcription and, consequently,
inflammatory cytokine production [28]. The inflammatory response seems more

80
exacerbated in patients with retinopathy and nephropathy considering the high salivary
levels of alpha-2-macroglobulin, defensin alpha 3 neutrophil-specific, leukocyte elastase
inhibitor, matrix metalloproteinase-9 and neutrophil elastase. The protease inhibitor alpha-
2-macroglobulin and the leukocyte elastase inhibitor were previously reported, based on
proteomic data, as being upregulated in the saliva of diabetics but with type 2 DM [12].
Increased levels of alpha-2-macroglobulin were also observed in serum samples from
diabetics with complications [29, 30]. The involvement of the naturally occurring inhibitor
of neutrophil proteases identified in this study was previously described in several human
inflammatory diseases [31]. Chan et al. [32] also found an association between the
salivary levels of this protein and periodontitis in subjects with type 2 diabetes.
Nevertheless, this correlation was not supported by data obtained from Zhou et al. [33].
Despite the increased levels of these protease inhibitors detected in the saliva of
diabetics, higher content (e.g. MMP-9; Supplementary table S2) and activity of MMPs [34-
37], and of neutrophil elastase, which activity is known to be regulated by leukocyte
elastase inhibitor [38], have been reported.
Other molecular players of the inflammatory process were found in higher content in the
saliva of diabetics, particularly in the ones with complications. The upregulation of the
actin bundling protein L-plastin was previously described in subjects with type 2 diabetes
[32] and in non-diabetic individuals with periodontitis [39]. The possible association with
periodontitis was not corroborated by Grant et al. [40] that found lower levels of L-plastin
in healthy volunteers with gingivitis. The higher content of S100-A8 and S100-A9
observed in diabetics suggests that in these patients occurs the formation of the
heterodimer known as Myeloid-Related Protein-8/14 (MRP8/14), which binds to the
receptor for advanced glycation end products and TLR4, mediating intracellular
inflammatory signaling transduction [41-43]. Elevated MRP8/14 complex plasma levels
was already suggested as a prediction factor for increased risk of cardiovascular events
[44] and were associated with inflammatory diseases, especially rheumatoid arthritis [45].
Cabras et al. [11] also reported higher levels of S100A9 in the saliva of type 1 diabetic
children in comparison with sex and age-matched healthy subjects. But more than a
relation with type 1 diabetes per se, our data suggest an association between increased
salivary content of MRP8/14 and microvascular complications, which were not described
before and could be used in the future in the monitoring of diabetes-related chronic
complications.
Together with the analysis of salivary proteome, peptidome profiling might give new
insights of the effect of type 1 DM and related chronic complications on oral cavity
81
homeostasis and consequent physiological impairment. In this sense, a straightforward
analysis of low molecular weight salivary peptides (<5 KDa) was performed using an
iTRAQ experiment for quantitative comparison of peptidome profiles. In overall, a higher
content of peptide fragments from the main salivary protein classes, mainly from aPRP,
bPRP1 and bPRP2, was observed in subjects with diabetes (Table 2), which seems to be
related with the higher proteolytic activity previously reported in the saliva of diabetics [23,
36, 37, 46], being PRP classes the most susceptible ones [46, 47]. Moreover, the
predominance of KPQ motif in acidic and basic PRPs [46] might be attributed to a
glutamine endoprotease not yet identified, which could be originated from the oral
microbiome [48]. However, among the proteases modulated by the disease we identified
by iTRAQ analysis MMP-9 as being overexpressed. This data was also corroborated by
MEROPS [20] search of more prevalent cleavage sites (Supplementary table S4). The
higher activity of MMP-9 as well as of other MMPs was already reported in the saliva of
subjects with type 1 diabetes [36, 49]. Protein-protein interaction network analysis also
highlight a correlation between the higher levels of MUC and salivary peptides, mainly
statherin, histatins and PRPs (Figure 2), suggesting an attempt to maintain the oral
homeostasis.
The analysis of the unique peptides in each group evidenced an enrichment of N-terminal
peptides from bPRP1 and C-terminal peptides from aPRP in diabetics. Although bPRP
role in oral cavity are not well characterized, in the case of aPRP, the C-terminal peptide
(148GPPPQGGRPQGPPQGQSPQ166) is known to be associated with bacterial attachment
via PQ segments to tooth surface, avoiding bacterial binding [50]. The elevated levels of
this peptide together with the high content of BPI detected in the saliva of diabetics might
be seen as a protective mechanism against bacterial infection that predispose to tooth
demineralization [51, 52]. The elevated content of these peptide fragments was also
paralleled by increased proteolytic activity observed in children with diabetes, as
previously observed by Cabras et al. [11]. According to these authors, the low
concentration of the intact P-C peptide associated with high levels of its fragments
suggests the impairment of oral cavity safeguard given by salivary peptides. A different
tendency was observed for histatin 1 in the saliva of adult subjects (with approximately 40-
years old), with DM-related higher content of intact and fragments of this salivary peptide.
In order to get a deep perspective of the peptidome dynamics, other post-translational
modifications besides proteolysis were analyzed. Data obtained points to a functional
impact of phosphorylation and glycosylation (Supplementary table S5). From those
prevalent phosphopeptides, no significant expression differences were detected among

82
groups using iTRAQ analysis; however, a higher number of phosphopeptides was
detected in the saliva of diabetics. In fact, the phosphorylation of serine residues in PRPs,
sthaterin and histatin 1 has been associated with the acquired enamel pellicle formation
and, consequently, with the participation in the remineralization process, having a
protective effect against tooth erosion [53, 54]. A similar trend was also observed for
HexNAc modification in bPRPs, which is in agreement with our previous findings for head
and neck cancer where a predominance of this modification was detected [21].
Furthermore, the higher levels of HexNac modification might also reflect the O-
GlcNAcylation observed during diabetes that might act as an autoprotective alarm or
stress response [55]. This data is in agreement with the increased expression of pro-
inflammatory mediators observed in the saliva of subjects with diabetes, particularly in the
ones with chronic complications (Figure 1).
Conclusion
Data from the present study highlight the potential use of saliva as a diagnostic fluid for
the monitoring of diabetes and related microvascular complications. Salivary proteome
evidenced an overexpression of the endogenous regulators of TLR, MRP8/14 and PAUF,
affecting myeloid MyD88-dependent activation of NF-B and tumor necrosis factor-alpha
expression, in the saliva of subjects with diabetes-related retinopathy and nephropathy,
pointing to the importance of the innate immune system in the pathogenesis of DM-related
complications.
Peptidome data not only supported the DM-related higher susceptibility of salivary
proteins to proteolysis but also evidenced an increased content of some specific protein
fragments known to be related with bacterial attachment and the accumulation of
phosphopeptides that seem to be involved in tooth protection against erosion. Particularly,
the proteolytic fragments from bPRP1, bPRP2 and aPRP might be seen as a hallmark of
the disease pathogenesis with potential use for its monitoring. Future studies should be
undertaken to disclose the functional role of these salivary peptides under different
pathophysiological conditions aiming to define disease-specific biomarkers.
Acknowledgment
This work was supported by Portuguese Foundation for Science and Technology (FCT)
[grant numbers PEst-C/QUI/UI0062/2011, PTDC/QUI/72683/2006].
The authors have declared no conflict of interest
83
Bibliography
[1] Pfaffe T, Cooper-White J, Beyerlein P, Kostner K, Punyadeera C. Diagnostic potential
of saliva: current state and future applications. Clin Chem. 2011;57:675-87.
[2] Malamud D. Saliva as a diagnostic fluid. Dental clinics of North America. 2011;55:159-
78.
[3] Castagnola M, Picciotti PM, Messana I, Fanali C, Fiorita A, Cabras T, et al. Potential
applications of human saliva as diagnostic fluid. Acta Otorhinolaryngol Ital. 2011;31:347-
57.
[4] Bartoszewicz ZP, Kondracka A. [Saliva as an alternative diagnostic material in
determination of hormone--advantages and limitations]. Wiad Lek. 2011;64:113-7.
[5] Farnaud SJ, Kosti O, Getting SJ, Renshaw D. Saliva: physiology and diagnostic
potential in health and disease. TheScientificWorldJournal. 2010;10:434-56.
[6] Pink R, Simek J, Vondrakova J, Faber E, Michl P, Pazdera J, et al. Saliva as a
diagnostic medium. Biomedical papers of the Medical Faculty of the University Palacky,
Olomouc, Czechoslovakia. 2009;153:103-10.
[7] Greabu M, Battino M, Mohora M, Totan A, Didilescu A, Spinu T, et al. Saliva--a
diagnostic window to the body, both in health and in disease. Journal of medicine and life.
2009;2:124-32.
[8] Al-Tarawneh SK, Border MB, Dibble CF, Bencharit S. Defining Salivary Biomarkers
Using Mass Spectrometry-Based Proteomics: A Systematic Review. Omics. 2011;15:353-
61.
[9] Hardt M, Witkowska HE, Webb S, Thomas LR, Dixon SE, Hall SC, et al. Assessing the
effects of diurnal variation on the composition of human parotid saliva: quantitative
analysis of native peptides using iTRAQ reagents. Anal Chem. 2005;77:4947-54.
[10] Border MB, Schwartz S, Carlson J, Dibble CF, Kohltfarber H, Offenbacher S, et al.
Exploring salivary proteomes in edentulous patients with type 2 diabetes. Molecular
bioSystems. 2012;8:1304-10.
[11] Cabras T, Pisano E, Mastinu A, Denotti G, Pusceddu PP, Inzitari R, et al. Alterations
of the salivary secretory peptidome profile in children affected by type 1 diabetes. Mol Cell
Proteomics. 2010;9:2099-108.

84
[12] Rao PV, Reddy AP, Lu X, Dasari S, Krishnaprasad A, Biggs E, et al. Proteomic
identification of salivary biomarkers of type-2 diabetes. J Proteome Res. 2009;8:239-45.
[13] Hirtz C, Chevalier, F., Sommerer, N., Raingeard, I., Bringer, J.,, Rossignol M, et al.
Salivary protein profiling in type I diabetes using two-dimensional electrophoresis and
mass spectrometry. Clin Proteomics. 2006:117-28.
[14] Vitorino R, Guedes S, Manadas B, Ferreira R, Amado F. Toward a standardized
saliva proteome analysis methodology. J Proteomics. 2012;75:5140-65.
[15] Vitorino R, Barros AS, Caseiro A, Ferreira R, Amado F. Evaluation of different
extraction procedures for salivary peptide analysis. Talanta. 2012;94:209-15.
[16] Vitorino R, Guedes S, Manadas B, Ferreira R, Amado F. Toward a standardized
saliva proteome analysis methodology. Journal of proteomics. 2012.
[17] Caseiro A, Vitorino R, Barros AS, Ferreira R, Calheiros-Lobo MJ, Carvalho D, et al.
Salivary peptidome in type 1 diabetes mellitus. Biomed Chromatogr. 2011.
[18] Maere S. BiNGO: a Cytoscape plugin to assess overrepresentation of Gene Ontology
categories in Biological Networks. Bioinformatics. 2005;21:3448-9.
[19] Amado FM, Vitorino RM, Domingues PM, Lobo MJ, Duarte JA. Analysis of the human
saliva proteome. Expert Rev Proteomics. 2005;2:521-39.
[20] Rawlings ND, Barrett AJ, Bateman A. MEROPS: the database of proteolytic
enzymes, their substrates and inhibitors. Nucleic acids research. 2012;40:D343-50.
[21] Vitorino R, Alves R, Barros A, Caseiro A, Ferreira R, Lobo MC, et al. Finding new
posttranslational modifications in salivary proline-rich proteins. Proteomics. 2010;10:3732-
42.
[22] Oppenheim FG, Salih E, Siqueira WL, Zhang W, Helmerhorst EJ. Salivary proteome
and its genetic polymorphisms. Ann N Y Acad Sci. 2007;1098:22-50.
[23] Llaurado G, Gallart L, Tirado R, Megia A, Simon I, Caixas A, et al. Insulin resistance,
low-grade inflammation and type 1 diabetes mellitus. Acta diabetologica. 2012;49:33-9.
[24] Padrao AI, Ferreira R, Vitorino R, Amado F. Proteome-base biomarkers in Diabetes
Mellitus: progress on biofluids' protein profiling using mass spectrometry. Proteomics Clin
Appl. 2012.

85
[25] Schultz H, Hume J, Zhang de S, Gioannini TL, Weiss JP. A novel role for the
bactericidal/permeability increasing protein in interactions of gram-negative bacterial outer
membrane blebs with dendritic cells. J Immunol. 2007;179:2477-84.
[26] Calafat J, Janssen H, Knol EF, Malm J, Egesten A. The bactericidal/permeability-
increasing protein (BPI) is membrane-associated in azurophil granules of human
neutrophils, and relocation occurs upon cellular activation. APMIS : acta pathologica,
microbiologica, et immunologica Scandinavica. 2000;108:201-8.
[27] Park HD, Lee Y, Oh YK, Jung JG, Park YW, Myung K, et al. Pancreatic
adenocarcinoma upregulated factor promotes metastasis by regulating TLR/CXCR4
activation. Oncogene. 2011;30:201-11.
[28] Oliveira-Nascimento L, Massari P, Wetzler LM. The Role of TLR2 in Infection and
Immunity. Frontiers in immunology. 2012;3:79.
[29] Turecky L, Kupcova V, Szantova M. [Alpha 2-macroglobulin in the blood of patients
with diabetes mellitus]. Bratislavske lekarske listy. 1999;100:25-7.
[30] Ceriello A, Giugliano D, Quatraro A, Stante A, Dello Russo P, Torella R. Increased
alpha 2-macroglobulin in diabetes: a hyperglycemia related phenomenon associated with
reduced antithrombin III activity. Acta diabetologica latina. 1989;26:147-54.
[31] Remold-O'Donnell E, Chin J, Alberts M. Sequence and molecular characterization of
human monocyte/neutrophil elastase inhibitor. Proceedings of the National Academy of
Sciences of the United States of America. 1992;89:5635-9.
[32] Chan HH, Rahim ZH, Jessie K, Hashim OH, Taiyeb-Ali TB. Salivary proteins
associated with periodontitis in patients with type 2 diabetes mellitus. International journal
of molecular sciences. 2012;13:4642-54.
[33] Zhou M, Meng HX. [The change of secretory leukocyte protease inhibitor and its
correlation with elastase in the development of periodontal inflammation]. Chinese journal
of stomatology. 2011;46:581-5.
[34] Shiau MY, Tsai ST, Tsai KJ, Haung ML, Hsu YT, Chang YH. Increased circulatory
MMP-2 and MMP-9 levels and activities in patients with type 1 diabetes mellitus. The
Mount Sinai journal of medicine, New York. 2006;73:1024-8.
[35] Maxwell PR, Timms PM, Chandran S, Gordon D. Peripheral blood level alterations of
TIMP-1, MMP-2 and MMP-9 in patients with type 1 diabetes. Diabetic medicine : a journal
of the British Diabetic Association. 2001;18:777-80.
86
[36] Caseiro A, Vitorino R, Barros AS, Ferreira R, Calheiros-Lobo MJ, Carvalho D, et al.
Salivary peptidome in type 1 diabetes mellitus. Biomed Chromatogr. 2012;26:571-82.
[37] Caseiro A, Ferreira R, Quintaneiro C, Pereira A, Marinheiro R, Vitorino R, et al.
Protease profiling of different biofluids in type 1 diabetes mellitus. Clinical biochemistry.
[38] Piwowar A, Knapik-Kordecka M, Warwas M. Concentration of leukocyte elastase in
plasma and polymorphonuclear neutrophil extracts in type 2 diabetes. Clinical chemistry
and laboratory medicine : CCLM / FESCC. 2000;38:1257-61.
[39] Bostanci N, Heywood W, Mills K, Parkar M, Nibali L, Donos N. Application of label-
free absolute quantitative proteomics in human gingival crevicular fluid by LC/MS E
(gingival exudatome). J Proteome Res. 2010;9:2191-9.
[40] Grant MM, Creese AJ, Barr G, Ling MR, Scott AE, Matthews JB, et al. Proteomic
analysis of a noninvasive human model of acute inflammation and its resolution: the
twenty-one day gingivitis model. Journal of proteome research. 2010;9:4732-44.
[41] Croce K, Gao H, Wang Y, Mooroka T, Sakuma M, Shi C, et al. Myeloid-related
protein-8/14 is critical for the biological response to vascular injury. Circulation.
2009;120:427-36.
[42] Schafer BW, Heizmann CW. The S100 family of EF-hand calcium-binding proteins:
functions and pathology. Trends in biochemical sciences. 1996;21:134-40.
[43] Xu YD, Yin LM, Wang Y, Wei Y, Yang YQ. [S100A8 protein in inflammation]. Sheng li
xue bao : [Acta physiologica Sinica]. 2012;64:231-7.
[44] Morrow DA, Wang Y, Croce K, Sakuma M, Sabatine MS, Gao H, et al. Myeloid-
related protein 8/14 and the risk of cardiovascular death or myocardial infarction after an
acute coronary syndrome in the Pravastatin or Atorvastatin Evaluation and Infection
Therapy: Thrombolysis in Myocardial Infarction (PROVE IT-TIMI 22) trial. American heart
journal. 2008;155:49-55.
[45] Hammer HB, Odegard S, Syversen SW, Landewe R, van der Heijde D, Uhlig T, et al.
Calprotectin (a major S100 leucocyte protein) predicts 10-year radiographic progression in
patients with rheumatoid arthritis. Annals of the rheumatic diseases. 2010;69:150-4.
[46] Helmerhorst EJ, Sun X, Salih E, Oppenheim FG. Identification of Lys-Pro-Gln as a
novel cleavage site specificity of saliva-associated proteases. J Biol Chem.
2008;283:19957-66.

87
[47] Inzitari R, Cabras T, Rossetti DV, Fanali C, Vitali A, Pellegrini M, et al. Detection in
human saliva of different statherin and P-B fragments and derivatives. Proteomics.
2006;6:6370-9.
[48] Potempa J, Banbula A, Travis J. Role of bacterial proteinases in matrix destruction
and modulation of host responses. Periodontology 2000. 2000;24:153-92.
[49] Caseiro A, Ferreira R, Quintaneiro C, Pereira A, Marinheiro R, Vitorino R, et al.
Protease profiling of different biofluids in type 1 diabetes mellitus. Clinical biochemistry.
2012.
[50] Gibbons RJ, Hay DI, Schlesinger DH. Delineation of a segment of adsorbed salivary
acidic proline-rich proteins which promotes adhesion of Streptococcus gordonii to apatitic
surfaces. Infection and immunity. 1991;59:2948-54.
[51] Huang CM, Torpey JW, Liu YT, Chen YR, Williams KE, Komives EA, et al. A peptide
with a ProGln C terminus in the human saliva peptidome exerts bactericidal activity
against Propionibacterium acnes. Antimicrob Agents Chemother. 2008;52:1834-6.
[52] Levine M. Susceptibility to dental caries and the salivary proline-rich proteins.
International journal of dentistry. 2011;2011:953412.
[53] Vitorino R, Calheiros-Lobo MJ, Duarte JA, Domingues PM, Amado FM. Peptide
profile of human acquired enamel pellicle using MALDI tandem MS. J Sep Sci.
2008;31:523-37.
[54] Siqueira WL, Oppenheim FG. Small molecular weight proteins/peptides present in the
in vivo formed human acquired enamel pellicle. Arch Oral Biol. 2009;54:437-44.
[55] Ngoh GA, Facundo HT, Zafir A, Jones SP. O-GlcNAc signaling in the cardiovascular
system. Circ Res. 2010;107:171-85.
[56] Kerrien S, Aranda B, Breuza L, Bridge A, Broackes-Carter F, Chen C, et al. The
IntAct molecular interaction database in 2012. Nucleic Acids Res. 2012;40:D841-6.

88

89
CHAPTER III
GENERAL DISCUSSION

90
91
GENERAL DISCUSSION
Proteomic approaches have enabled the discovery of several potential biomarkers in
biofluids. More recently focus has been given to saliva proteome analysis in oral and
systemic diseases (Spielmann et al. 2011; Al Kawas et al. 2012; Amado et al. 2012; Liu et
al. 2012). Nevertheless, little emphasis has been given to salivary proteome alterations
induced by type 1 DM, and even less to salivary peptidome. For instance, Hirtz et al.
(2006) evaluated the salivary proteome of poorly controlled type 1 DM patients and
identified 23 proteins differentially expressed. Most of these proteins were
underexpressed like isoforms of alpha-amylase, acidic PRPs, cystatin SA-1 and prolactin
inducible protein. Two isoforms of serotransferrin, implicated in oral anti-inflammatory
process were overexpressed, suggesting a disease-induced decrease of non-
immunological defense in oral cavity. Cabras et al. (2010) highlighted the impairment of
salivary peptides involved in the safeguard of the oral cavity in children with type 1 DM.
These patients showed significant lower levels of statherin, SMR3B, aPRP103-169 and
histatins and higher concentration of alpha-defensins 1, 2 and 4, S100A9. An additional
important finding was the higher levels of aPRP103-169 fragments. These results could
be explained by an increased salivary proteolytic activity in type 1 DM oral environment.
Proteolysis plays a central role in pathophysiological events, being the proteases mainly
involved in inflammatory processes and host defenses (Korkmaz et al. 2012). The
increased serum levels of the zinc endopeptidases, particularly of MMP-2 and MMP-9,
were already suggested as a marker of chronic kidney disease’s risk (Gharagozlian et al.
2009) and of active retinopathy (Golubnitschaja et al. 2005).
In order to disclose the proteases involved in type 1 DM pathogenesis, we performed a
straightforward profiling in the biofluids saliva, serum and urine from patients with no
complications diagnosed, with nephropathy and with retinopathy using zymography-LC-
MS/MS (Study II). From this characterization, the most outstanding disease-related
proteolytic alterations were detected in urine and saliva. Serum exhibited less zymo bands
in comparison to the other fluids and among the detected bands only the assigned by
western blotting as MMP-2 and MMP-9 presented significant higher levels in patients with
retinopathy and nephropathy, as previously reported (Thrailkill et al. 2007; Gharagozlian
et al. 2009). In saliva and urine more zymo bands were observed and a higher number of
proteases were identified and related with immune functions and biological events such as
cell proliferation, secretion, invasion and angiogenesis. More distinct proteases were
identified in urine than in saliva. Among the identified proteases modulated by DM

92
identified in urine samples were MMP-8, MMP-9, pro-MMP-9 NGAL/MMP-9,
aminopeptidase N (APN), complement C1r subcomponent-like protein, kallikrein-1 and
azurocidin. APN is a multifunctional enzyme related with immune system (Luan et al.
2007) and the significantly higher activity levels of this protease observed in diabetics with
retinopathy and nephropathy, corroborating the results previously reported by Mitic et al.
(2008) that observed a significantly higher activity of this protease in the urine from type 1
diabetic patients with microalbuminuria. Complement C1r subcomponent-like protein is a
serine-type endopeptidase, highly expressed in kidney, but its physiological function
remains to be determined. This protease may provide a novel means for the formation of
the classical pathway C3/C5 convertase (Ligoudistianou et al. 2005). Kallikrein-1 and
azurocidin were both identified in urine and saliva, with higher activity levels observed in
DM patients with retinopathy and/or nephropathy. Azurocidin, a neutrophil granule-derived
antibacterial and monocyte- and fibroblast-specific chemotactic glycoprotein was
previously described as a promising biomarker in gingival crevicular fluid for the
development of early diagnosis of periodontitis (Choi et al. 2011).
Disease-related increase activity and expression of MMPs was also observed in saliva
and urine of type 1 DM patients. MMPs are involved in extracellular matrix vascular
remodeling and their higher activity in the urine was previously suggested to predict
vascular remodeling in type 1 DM renal and other vascular complications (McKittrick et al.
2011). More than MMP-9 per se, the complex involving this protease and neutrophil
gelatinase-associated lipocalin (NGAL/MMP-9) was also proposed by Kim et al. (2012) as
an earlier marker of nephropathy. In our study, NGAL/MMP-9 complex did not appear as a
specific marker of nephropathy but instead of type 1 diabetes since it was present in
higher levels in the urine of diabetics with and without complications. The overexpression
of MMP-2 and MMP-8 was only detected in the saliva of diabetics, with significant higher
levels of MMP-2 only noticed in patients with retinopathy and nephropathy. Increased
levels of salivary MMP-8 were previously associated with type 2 DM-related advanced
periodontitis (Collin et al. 2000).
Although present in low amounts, MMPs can produce a high number of protein fragments,
modifying not only proteins but also their products yielding a characteristic peptide
signature. In order to identify a potential association between type 1 DM-related higher
proteolysis and peptidome profile, LC-MS/MS analysis of saliva was performed (Study I).
Peptidome profiling of this biofluid evidenced several fragments of type I collagen as a
result of disease-related increased proteolytic activity. Despite of the high intra- and inter-
individual qualitative and quantitative diversity of the salivary peptidome (Le Yondre et al.

93
2008; Quintana et al. 2009; Vitorino et al. 2009), diabetic subjects showed an overall
higher amount of protein fragments corroborated by higher intensity bands in zymography
analysis. It was possible to identify MMP-9 and cathepsin D in zymo band with higher
activity. Nevertheless, one may not forget the contribution of other proteases, as identified
in study II, to the overall increased proteolytic activity noticed in diabetics. The observation
of a consistent salivary protein degradation pattern in DM patients can pave the way for
exploiting this feature for diagnosis purposes, being seen as an “fingerprint” of the
pathophysiological status (Helmerhorst 2007; Amado et al. 2012). Serum peptidome
analysis already allowed distinguishing metastatic thyroid carcinoma from cancer-free
controls based only on its profile (Villanueva et al. 2008). Several saliva peptidome
profiling approaches have been applied to pathologies like autism, caries and other oral
diseases, HNC and diabetes (Castagnola et al. 2008; Huang et al. 2009; Cabras et al.
2010; Vitorino et al. 2010; Zhang et al. 2012). In study I, we not only characterized type 1
DM salivary peptidome but also the major protein cleavage sites were established in order
to investigate potential proteases responsible for oral health alterations. Regarding the
cleavage site frequencies, the motifs Phe-Tyr in salivary gland secreted peptides (SGP),
Gly-Ala, Gln-Pro and Glu-Pro in nonsalivary gland secreted peptides (NSGP) were the
more prevalent ones in diabetics. The increased cleavage observed in Phe-Tyr motif may
be justified by disease-related increase of MMP-9 activity observed in both studies I and II
or, according to MEROPS (Rawlings et al. 2008) to MMP-3, cathepsin G and cathepsin L,
well described in human saliva (Pederson et al. 1995; Sun et al. 2009; Brik et al. 2010)
and to several bacterial proteases. Concerning the Gly-Ala motif, the activity of MMP-2
and MMP-9 observed in study II might again justify the observed cleavage increase in
type 1 DM patients along with other candidates such as MMP-3, MMP-12, MMP-13,
cathepsin L and dipeptidyl-dipeptidase 1 and 2, already reported in saliva (Sun et al.
2009).
Many peptides from the extracellular matrix and cellular structural components were also
found in diabetics’ saliva samples, which may be associated with the infiltration of
inflammatory cells and with the less collagen observed in the histological analysis of
gingival biopsies from diabetic patients (Kumar et al. 2006; Lorencini et al. 2009). A higher
number of fragments from type I collagen was observed in diabetic patients, which may be
associated with a chronic inflammatory state, and with an inherent increasing risk of
developing oral pathologies, namely gingivitis and periodontitis (Edwards et al. 2008;
Orbak et al. 2008; Tanwir et al. 2009). MMPs are capable of degrading extracellular matrix
components and to modulate immune response by altering activity of cytokines and

94
chemokines by cleavage (Silva et al. 2008; Negrato et al. 2010). Moreover, Salvi et al.
(2010) suggested that elevated levels of IL-1 in type 1 DM patients regulates collagen
metabolism, mainly through MMPs expression. In particular, MMP-8 and MMP-9 identified
in study II, produced by polymorphonuclear leukocytes and osteoclasts, have been
associated to periodontitis and other oral infections, being related with the increase of
collagenolytic fragments (Kinney et al. 2007; Bildt et al. 2008; Gursoy et al. 2010). Data
from study I is also in accordance with the significantly higher expression of MMP-9
observed in study III and with previous studies that reported increased salivary levels of
this MMP in DM-related chronic periodontitis (Kaplan et al. 1978; Kumar et al. 2006).
While the biomarkers for DM diagnosis are well established (Assoc 2012) providing a
good foundation for disease diagnosis, the available indicators that enable to predict the
development of DM and its related chronic complications are clearly unsatisfactory
(Padrao et al. 2012). So, the identification of DM-related biomarkers, especially targeted
to the early diagnosis of DM chronic complications would be valuable for the prevention of
disease occurrence and progression (Kuzuya et al. 2002). For the screen of non-
physiological levels of certain proteins and/or peptides that may reflect pathological
conditions quantitative proteomics has been increasingly recognized (Castagnola et al.
2011). With this in mind, study III was performed to determine salivary proteome and
peptidome profiles among diabetics (with and without chronic complications) and healthy
individuals using an iTRAQ-based experimental approach.
From the comparative analysis of saliva proteome, several proteins were identified as
potential markers to distinguish individuals with type 1 DM as well as the ones with
chronic complications associated with this disease. The majority of differentially expressed
proteins are involved in metabolic (23.3 %) and immune response (23.3 %) processes,
which corroborates the nature of the pathology, e.g. a metabolic disorder accompanied
with inflammation (Llaurado et al. 2012). The significant upregulation of
bactericidal/permeability-increasing protein-like 1 (BPI) and pancreatic adenocarcinoma
factor (PAUF) in the saliva of diabetics suggests the activation of the immune system in
type 1 DM. Moreover, the DM-related inflammatory response seems more exacerbated in
patients with microvascular complications considering the high salivary levels of alpha-2-
macroglobulin, defensin alpha 3 neutrophil-specific, leukocyte elastase inhibitor, matrix
metalloproteinase-9 and neutrophil elastase. Other molecular players of the inflammatory
process like actin bundling protein L-plastin, S100-A8 and S100-A9 were found in higher
content in the saliva of diabetics, particularly in the ones with chronic complications. The
upregulation of L-plastin was previously described in subjects with type 2 DM (Chan et al.
95
2012). The higher content of S100-A8 and S100-A9 observed in diabetics suggests that in
these patients occurs the formation of the heterodimer known as Myeloid-Related Protein-
8/14 (MRP8/14), which binds to the receptor for advanced glycation end products and
Toll-like receptor 4, mediating intracellular inflammatory signaling transduction (Schafer et
al. 1996; Croce et al. 2009; Xu et al. 2012). Increased levels of MRP8/14 complex in
plasma were suggested as a prediction factor for increased risk of cardiovascular events
(Morrow et al. 2008) and associated with inflammatory diseases, especially rheumatoid
arthritis (Hammer et al. 2010). Data from study III suggest an association between
increased salivary content of MRP8/14 and microvascular complications, which were not
described before and could be used in the future in the monitoring of DM-related chronic
complications.
Salivary peptidome profiling was also performed in study III aiming to add new insights on
the effect of type 1 DM (Study I) and related chronic complications (Study III) on oral
cavity homeostasis and consequent physiological impairment. A straightforward analysis
of low molecular weight salivary peptides was performed using an iTRAQ experiment for
quantitative comparison of peptidome profiles. Overall, a higher content of peptide
fragments from the main salivary protein classes, mainly from aPRP, bPRP1 and bPRP2,
was observed in subjects with diabetes, which seems to be related with the higher
proteolytic activity reported in saliva, namely of MMP-9 (Studies I and II). This data was
also corroborated by MEROPS search (Rawlings et al. 2012), considering the more
prevalent cleavage sites. The analysis of the unique peptides in each study group
evidenced an enrichment of N-terminal peptides from bPRP1 and C-terminal peptides
from aPRP in diabetics. The elevated content of aPRP peptide fragments (P-C) was
previously reported in type 1 diabetic childrens (Cabras et al. 2010). Although bPRP’s role
in oral cavity is not well characterized, in the case of aPRP, the C-terminal peptide
(148GPPPQGGRPQGPPQGQSPQ166) is known to be associated with bacterial attachment
to tooth surface, avoiding bacterial binding (Gibbons et al. 1991). The elevated levels of
both aPRP C-terminal peptide and BPI observed in the saliva of diabetics might be seen
as a protective mechanism against bacterial infection that predisposes to tooth
demineralization (Huang et al. 2008; Levine 2011).
In order to get a deeper perspective of the salivary peptidome dynamics, other post-
translation modifications besides proteolysis were analyzed. Data obtained points to a
functional impact of phosphorylation and glycosylation, being detected a higher number of
phosphopeptides and HexNAc modification in bPRPs in diabetics. Regarding the most
prevalent phosphopeptides, no significant expression differences were detected. In fact,
96
phosphorylation of PRPs, sthaterin and histatin 1 has been associated with the acquired
enamel pellicle formation and, consequently, with the participation in the remineralization
process, having a protective effect against tooth erosion (Vitorino et al. 2008; Siqueira et
al. 2009). In respect to the higher levels of HexNac modification those might reflect the O-
GlcNAcylation observed in diabetes (Ngoh et al. 2010).
In order to integrate all data retrieved from the three experimental studies, mainly focused
on saliva proteome and peptidome alterations induced by type 1 DM and related
complications, a protein network was constructed with STRING (Szklarczyk et al. 2011).
Figure 1 illustrates protein-protein interactions, upon querying the database with the
participating 77 identified proteins (Studies I-III). Three clusters (presented with distinct
colors in figure 1) are evidenced and are tightly connected to the functional modules: one
cluster comprehending collagen type II, collagen type I subunits interaction and MMP-9; a
second cluster involving MMP-2 and collagen type I; and a third cluster comprehending
salivary and inflammatory proteins. According to Kegg pathways, these clusters are
mainly associated to extracellular matrix-receptor interaction, focal adhesion, pathways in
cancer and leukocyte transendothelial migration.
Moreover, data from studies I-III corroborate the potential of saliva for biomarker discovery
in type 1 DM and related complications. The salivary proteome and even more the
peptidome have been quite unexplored in pathophysiological conditions. The
straightforward approach applied in our study highlights the potential of evaluating peptide
levels and PTMs to identify new peptide targets for type 1 DM diagnosis/monitoring.

97
Figure 1: STRING protein network that integrate all data retrieved from the three experimental studies and
shows protein-protein interactions, evidencing three clusters: one cluster comprehending collagen type II,
collagen type I subunits interaction and MMP-9 (blue nodes); a second cluster involving MMP-2 and collagen
type I (yellow nodes); and a third cluster comprehending salivary and inflammatory proteins (red nodes).

98

99
CHAPTER IV
CONCLUSIONS

100

101
CONCLUSIONS
Once characterized the alterations in salivary proteome and peptidome induced by type 1
DM and related microvascular complications, the following conclusions might be
envisioned:
i) Type 1 DM and particularly the associated microvascular complications
modulates biofluids’ proteolytic profile, with significant activity differences noticed for urine
and saliva with MMP-9/Neutrophil gelatinase-associated lipocalin, aminopeptidase N,
azurocidin and kallikrein 1 as promisors disease-related screening targets;
ii) The higher proteolytic activity noticed in whole saliva of diabetics leads to an
increase in the percentage of peptides, mainly consisting of an augmented number of
collagen type I fragments, possibly reflecting a chronic inflammatory state of oral and
periodontal tissues;
iii) Peptidome data support a diabetes-related higher susceptibility of salivary
proteins to proteolysis and evidenced an increased content of some specific protein
fragments associated with bacterial attachment and the accumulation of phosphopeptides
potentially involved in tooth protection; moreover, proteolytic fragments from bPRP1,
bPRP2 and aPRP might be seen as a hallmark of the disease pathogenesis with potential
use for its monitoring;
iv) Salivary proteome profiling evidenced an overexpression of L-plastin, PAUF
and MRP8/14, endogenous ligands of TLR2 and TLR4, proteins known to be involved in
inflammatory processes, in the saliva of subjects with diabetes-related retinopathy and
nephropathy.
Overall, the experimental studies presented in this thesis emphasize the importance of the
innate immune system in the pathogenesis of type 1 DM and related microvascular
complications and the relevance of proteolytic events that lead to an increased content of
endogenous peptides many with putative disease biomarker potential. An integrated
perspective of salivary proteome and peptidome is highlighted and open new avenues for
future studies focused in the evaluation of the early predictive value of the potential
biomarkers suggested for the diagnosis and prognosis of type 1 DM and related
complications. For the translation of those potential targets to clinics, a deeper high-
throughput analysis, in a large scale population, is required. Moreover, disclose the
functional role of the identified salivary peptides will contribute to a deeper knowledge in
pathophysiology of DM-related oral complications.

102

103
REFERENCES

104

105
REFERENCES
Acera, A. and E. Vecino (2012). "[The tear biomarkers, as source of information for the
ocular surface. the tears as mirror of the eye?]." Arch Soc Esp Oftalmol 87(6): 171-172.
Ahn, B. Y., E. S. Song, et al. (2006). "Identification of an anti-aldolase autoantibody as a
diagnostic marker for diabetic retinopathy by immunoproteomic analysis." Proteomics
6(4): 1200-1209.
Akerblom, H. K. and M. Knip (1998). "Putative environmental factors in Type 1 diabetes."
Diabetes Metab Rev 14(1): 31-67.
Al-Tarawneh, S. K., M. B. Border, et al. (2011). "Defining salivary biomarkers using mass
spectrometry-based proteomics: a systematic review." OMICS 15(6): 353-361.
Al-Tarawneh, S. K., M. B. Border, et al. (2011). "Defining Salivary Biomarkers Using Mass
Spectrometry-Based Proteomics: A Systematic Review." Omics-a Journal of Integrative
Biology 15(6): 353-361.
Al Kawas, S., Z. H. Rahim, et al. (2012). "Potential uses of human salivary protein and
peptide analysis in the diagnosis of disease." Arch Oral Biol 57(1): 1-9.
Albalat, A., H. Mischak, et al. (2011). "Clinical application of urinary
proteomics/peptidomics." Expert Rev Proteomics 8(5): 615-629.
Amado, F., M. J. Lobo, et al. (2010). "Salivary peptidomics." Expert Rev Proteomics 7(5):
709-721.
Amado, F. M., R. P. Ferreira, et al. (2012). "One decade of salivary proteomics: Current
approaches and outstanding challenges." Clin Biochem (Epub ahead of print).
Amado, F. M., R. M. Vitorino, et al. (2005). "Analysis of the human saliva proteome."
Expert Rev Proteomics 2(4): 521-539.
Amoresano, A., A. Carpentieri, et al. (2009). "Technical advances in proteomics mass
spectrometry: identification of post-translational modifications." Clin Chem Lab Med 47(6):
647-665.
Anderson, L. C., J. R. Garrett, et al. (1993). "In vivo secretory responses of submandibular
glands in streptozotocin-diabetic rats to sympathetic and parasympathetic nerve
stimulation." Cell Tissue Res 274(3): 559-566.

106
Aps, J. K. and L. C. Martens (2005). "Review: The physiology of saliva and transfer of
drugs into saliva." Forensic Sci Int 150(2-3): 119-131.
Apweiler, R., C. Aslanidis, et al. (2009). "Approaching clinical proteomics: current state
and future fields of application in fluid proteomics." Clin Chem Lab Med 47(6): 724-744.
Assoc, A. D. (2012). "Diagnosis and classification of diabetes mellitus." Diabetes Care 35
Suppl 1(1): S64-71.
Baggerman, G., P. Verleyen, et al. (2004). "Peptidomics." J Chromatogr B Analyt Technol
Biomed Life Sci 803(1): 3-16.
Baldini, C., L. Giusti, et al. (2008). "Proteomic analysis of the saliva: a clue for
understanding primary from secondary Sjogren's syndrome?" Autoimmun Rev 7(3): 185-
191.
Baldini, C., L. Giusti, et al. (2011). "Correspondence between salivary proteomic pattern
and clinical course in primary Sjogren syndrome and non-Hodgkin's lymphoma: a case
report." Journal of Translational Medicine 9: 188.
Baldini, C., L. Giusti, et al. (2011). "Proteomic analysis of saliva: a unique tool to
distinguish primary Sjogren's syndrome from secondary Sjogren's syndrome and other
sicca syndromes." Arthritis Res Ther 13(6): R194.
Bandhakavi, S., M. D. Stone, et al. (2009). "A dynamic range compression and three-
dimensional peptide fractionation analysis platform expands proteome coverage and the
diagnostic potential of whole saliva." J Proteome Res 8(12): 5590-5600.
Bandhakavi, S., S. K. Van Riper, et al. (2011). "Hexapeptide libraries for enhanced protein
PTM identification and relative abundance profiling in whole human saliva." J Proteome
Res 10(3): 1052-1061.
Banoczy, J., M. Albrecht, et al. (1987). "Salivary secretion rate, pH, lactobacilli and yeast
counts in diabetic women." Acta Diabetol Lat 24(3): 223-228.
Bartoszewicz, Z. P. and A. Kondracka (2011). "[Saliva as an alternative diagnostic
material in determination of hormone--advantages and limitations]." Wiad Lek 64(2): 113-
117.
Becker, C. H. and M. Bern (2011). "Recent developments in quantitative proteomics."
Mutat Res 722(2): 171-182.
Beckett, P. (2012). "The basics of 2D DIGE." Methods in molecular biology 854: 9-19.
107
Belce, A., E. Uslu, et al. (2000). "Evaluation of salivary sialic acid level and Cu-Zn
superoxide dismutase activity in type 1 diabetes mellitus." Tohoku J Exp Med 192(3): 219-
225.
Ben-Aryeh, H., M. Cohen, et al. (1988). "Salivary composition in diabetic patients." J
Diabet Complications 2(2): 96-99.
Ben-Aryeh, H., R. Serouya, et al. (1993). "Oral health and salivary composition in diabetic
patients." J Diabetes Complications 7(1): 57-62.
Bigler, L. R., C. F. Streckfus, et al. (2009). "Salivary biomarkers for the detection of
malignant tumors that are remote from the oral cavity." Clin Lab Med 29(1): 71-85.
Bildt, M. M., M. Bloemen, et al. (2008). "Collagenolytic fragments and active gelatinase
complexes in periodontitis." J Periodontol 79(9): 1704-1711.
Bland, A. M., M. G. Janech, et al. (2010). "Sources of variability among replicate samples
separated by two-dimensional gel electrophoresis." J Biomol Tech 21(1): 3-8.
Bondarenko, P. V., D. Chelius, et al. (2002). "Identification and relative quantitation of
protein mixtures by enzymatic digestion followed by capillary reversed-phase liquid
chromatography-tandem mass spectrometry." Anal Chem 74(18): 4741-4749.
Borchers, A. T., R. Uibo, et al. (2010). "The geoepidemiology of type 1 diabetes."
Autoimmun Rev 9(5): A355-365.
Border, M. B., S. Schwartz, et al. (2012). "Exploring salivary proteomes in edentulous
patients with type 2 diabetes." Mol Biosyst 8(4): 1304-1310.
Borrebaeck, C. A. (2012). "Viewpoints in clinical proteomics: When will proteomics deliver
clinically useful information?" Proteomics Clin Appl 6(7-8): 343-345.
Brik, R., I. Rosen, et al. (2010). "Salivary antioxidants and metalloproteinases in juvenile
idiopathic arthritis." Mol Med 16(3-4): 122-128.
Brinkmann, O., N. Spielmann, et al. (2012). "Salivary diagnostics: moving to the next
level." Dent Today 31(6): 54, 56-57; quiz 58-59.
Brockmann, A., S. P. Annangudi, et al. (2009). "Quantitative peptidomics reveal brain
peptide signatures of behavior." Proc Natl Acad Sci U S A 106(7): 2383-2388.
Brown, A., L. R. Reynolds, et al. (2010). "Intensive glycemic control and cardiovascular
disease: an update." Nat Rev Cardiol 7(7): 369-375.
108
Brown, S. E., A. Howard, et al. (2009). "A peptidomics study reveals the impressive
antimicrobial peptide arsenal of the wax moth Galleria mellonella." Insect Biochem Mol
Biol 39(11): 792-800.
Cabras, T., E. Pisano, et al. (2010). "Alterations of the salivary secretory peptidome profile
in children affected by type 1 diabetes." Mol Cell Proteomics 9(10): 2099-2108.
Caldeira, E. J., J. A. Camilli, et al. (2005). "Stereology and ultrastructure of the salivary
glands of diabetic Nod mice submitted to long-term insulin treatment." Anat Rec A Discov
Mol Cell Evol Biol 286(2): 930-937.
Canas, B., D. Lopez-Ferrer, et al. (2006). "Mass spectrometry technologies for
proteomics." Brief Funct Genomic Proteomic 4(4): 295-320.
Caramori, M. L., P. Fioretto, et al. (2000). "The need for early predictors of diabetic
nephropathy risk: is albumin excretion rate sufficient?" Diabetes 49(9): 1399-1408.
Castagnola, M., T. Cabras, et al. (2011). "Biotechnological implications of the salivary
proteome." Trends Biotechnol 29(8): 409-418.
Castagnola, M., I. Messana, et al. (2008). "Hypo-phosphorylation of salivary peptidome as
a clue to the molecular pathogenesis of autism spectrum disorders." J Proteome Res
7(12): 5327-5332.
Castagnola, M., P. M. Picciotti, et al. (2011). "Potential applications of human saliva as
diagnostic fluid." Acta Otorhinolaryngol Ital 31(6): 347-357.
Celis, J. E. and J. M. Moreira (2008). "Clinical proteomics." Mol Cell Proteomics 7(10):
1779.
Chan, H. H., Z. H. Rahim, et al. (2012). "Salivary proteins associated with periodontitis in
patients with type 2 diabetes mellitus." Int J Mol Sci 13(4): 4642-4654.
Chan, J. C., V. Malik, et al. (2009). "Diabetes in Asia: epidemiology, risk factors, and
pathophysiology." JAMA 301(20): 2129-2140.
Chen, C. H. (2008). "Review of a current role of mass spectrometry for proteome
research." Anal Chim Acta 624(1): 16-36.
Chiou, S. H. and C. Y. Wu (2011). "Clinical proteomics: current status, challenges, and
future perspectives." Kaohsiung J Med Sci 27(1): 1-14.
109
Choi, Y. J., S. H. Heo, et al. (2011). "Identification of azurocidin as a potential periodontitis
biomarker by a proteomic analysis of gingival crevicular fluid." Proteome Sci 9: 42.
Collin, H. L., T. Sorsa, et al. (2000). "Salivary matrix metalloproteinase (MMP-8) levels
and gelatinase (MMP-9) activities in patients with type 2 diabetes mellitus." J Periodontal
Res 35(5): 259-265.
Contucci, A. M., R. Inzitari, et al. (2005). "Statherin levels in saliva of patients with
precancerous and cancerous lesions of the oral cavity: a preliminary report." Oral Dis
11(2): 95-99.
Crameri, R. (2005). "The potential of proteomics and peptidomics for allergy and asthma
research." Allergy 60(10): 1227-1237.
Croce, K., H. Gao, et al. (2009). "Myeloid-related protein-8/14 is critical for the biological
response to vascular injury." Circulation 120(5): 427-436.
Csosz, E., P. Boross, et al. (2012). "Quantitative analysis of proteins in the tear fluid of
patients with diabetic retinopathy." J Proteomics 75(7): 2196-2204.
Dakna, M., Z. He, et al. (2009). "Technical, bioinformatical and statistical aspects of liquid
chromatography-mass spectrometry (LC-MS) and capillary electrophoresis-mass
spectrometry (CE-MS) based clinical proteomics: a critical assessment." J Chromatogr B
Analyt Technol Biomed Life Sci 877(13): 1250-1258.
Dang, M., J. Rockell, et al. (2011). "Human Type 1 Diabetes Is Associated with T Cell
Autoimmunity to Zinc Transporter 8." J Immunol 186(10): 6056-6063.
de Jong, E. P., H. Xie, et al. (2010). "Quantitative proteomics reveals myosin and actin as
promising saliva biomarkers for distinguishing pre-malignant and malignant oral lesions."
PLoS One 5(6): e11148.
Delaleu, N., R. Jonsson, et al. (2005). "Sjogren's syndrome." Eur J Oral Sci 113(2): 101-
113.
Denny, P., F. K. Hagen, et al. (2008). "The Proteomes of Human Parotid and
Submandibular/Sublingual Gland Salivas Collected as the Ductal Secretions." J Proteome
Res.
Deshpande, A. D., M. Harris-Hayes, et al. (2008). "Epidemiology of diabetes and
diabetes-related complications." Phys Ther 88(11): 1254-1264.
110
Dodds, M. W., D. A. Johnson, et al. (2005). "Health benefits of saliva: a review." J Dent
33(3): 223-233.
Dowling, P., R. Wormald, et al. (2008). "Analysis of the saliva proteome from patients with
head and neck squamous cell carcinoma reveals differences in abundance levels of
proteins associated with tumour progression and metastasis." J Proteomics 71(2): 168-
175.
Dowling, P., R. Wormald, et al. (2008). "Analysis of the saliva proteome from patients with
head and neck squamous cell carcinoma reveals differences in abundance levels of
proteins associated with tumour progression and metastasis." J Proteomics 71(2): 168-
175.
Duarte-Ramos, F. and J. Cabrita (2006). "Using a pharmaco-epidemiological approach to
estimate diabetes type 2 prevalence in Portugal." Pharmacoepidemiol Drug Saf 15(4):
269-274.
Edwards, E. and L. Goodner (2008). "Oral health and diabetes." Tenn Med 101(7): 50-51.
Ellis, A., Gnepp (1991). Surgical Pathology of the Salivary Glands. Philadelphia, W. B.
Saunders Company.
Esser, D., G. Alvarez-Llamas, et al. (2008). "Sample Stability and Protein Composition of
Saliva: Implications for Its Use as a Diagnostic Fluid." Biomark Insights 3: 25-27.
Fabian, T. K., P. Fejerdy, et al. (2008). "Salivary Genomics, Transcriptomics and
Proteomics: The Emerging Concept of the Oral Ecosystem and their Use in the Early
Diagnosis of Cancer and other Diseases." Curr Genomics 9(1): 11-21.
Fabian, T. K., P. Fejerdy, et al. (2007). "Potential immunological functions of salivary
Hsp70 in mucosal and periodontal defense mechanisms." Arch Immunol Ther Exp
(Warsz) 55(2): 91-98.
Farnaud, S. J., O. Kosti, et al. (2010). "Saliva: physiology and diagnostic potential in
health and disease." ScientificWorldJournal 10: 434-456.
Ferrary, T., M. L. Pirpignani, et al. (2002). "Composition of saliva from children with
juvenile rheumatoid arthritis." J Dent Res 81: B18-B18.
Fleissig, Y., O. Deutsch, et al. (2009). "Different proteomic protein patterns in saliva of
Sjogren's syndrome patients." Oral Dis 15(1): 61-68.

111
Franzmann, E. J., E. P. Reategui, et al. (2005). "Salivary soluble CD44: a potential
molecular marker for head and neck cancer." Cancer Epidemiol Biomarkers Prev 14(3):
735-739.
Fraser, R. (2009). "Gestational diabetes mellitus: developments in diagnosis and
treatment." Womens Health (Lond Engl) 5(3): 263-268.
Gan, M. J., A. Albanese-O'Neill, et al. (2012). "Type 1 diabetes: current concepts in
epidemiology, pathophysiology, clinical care, and research." Curr Probl Pediatr Adolesc
Health Care 42(10): 269-291.
Gao, B. B., X. Chen, et al. (2008). "Characterization of the vitreous proteome in diabetes
without diabetic retinopathy and diabetes with proliferative diabetic retinopathy." J
Proteome Res 7(6): 2516-2525.
Gao, Y., L. Lin, et al. (2011). "Peptidome workflow of serum and urine samples for
biomarker discovery." Anal Methods 3(4): 773-779.
Garcia-Ramirez, M., F. Canals, et al. (2007). "Proteomic analysis of human vitreous fluid
by fluorescence-based difference gel electrophoresis (DIGE): a new strategy for
identifying potential candidates in the pathogenesis of proliferative diabetic retinopathy."
Diabetologia 50(6): 1294-1303.
Gardete-Correia, L., J. M. Boavida, et al. (2010). "First diabetes prevalence study in
Portugal: PREVADIAB study." Diabet Med 27(8): 879-881.
Gelpi, E. (2009). "From large analogical instruments to small digital black boxes: 40 years
of progress in mass spectrometry and its role in proteomics. Part II 1985-2000." J Mass
Spectrom 44(8): 1137-1161.
Ghafouri, B., C. Tagesson, et al. (2003). "Mapping of proteins in human saliva using two-
dimensional gel electrophoresis and peptide mass fingerprinting." Proteomics 3(6): 1003-
1015.
Gharagozlian, S., K. Svennevig, et al. (2009). "Matrix metalloproteinases in subjects with
type 1 diabetes." BMC Clin Pathol 9: 7.
Ghazarian, L., J. Diana, et al. (2012). "Prevention or acceleration of type 1 diabetes by
viruses." Cell Mol Life Sci (Epub ahead of print).

112
Gibbons, R. J., D. I. Hay, et al. (1991). "Delineation of a segment of adsorbed salivary
acidic proline-rich proteins which promotes adhesion of Streptococcus gordonii to apatitic
surfaces." Infect Immun 59(9): 2948-2954.
Giusti, L., C. Baldini, et al. (2007). "Proteome analysis of whole saliva: a new tool for
rheumatic diseases--the example of Sjogren's syndrome." Proteomics 7(10): 1634-1643.
Giusti, L., C. Baldini, et al. (2010). "Is GRP78/BiP a potential salivary biomarker in patients
with rheumatoid arthritis?" Proteomics Clin Appl 4(3): 315-324.
Goldstein, D. E., R. R. Little, et al. (2003). "Tests of glycemia in diabetes." Diabetes Care
26 Suppl 1: S106-108.
Golubnitschaja, O., A. Jaksche, et al. (2005). "Molecular imaging system for possible
prediction of active retinopathy in patients with Diabetes mellitus." Amino Acids 28(2):
229-237.
Goncalves, L. D., M. R. Soares, et al. (2011). "Analysis of the salivary proteome in
gingivitis patients." J Periodontal Res 46(5): 599-606.
Gorr, S. U., S. G. Venkatesh, et al. (2005). "Parotid secretory granules: crossroads of
secretory pathways and protein storage." J Dent Res 84(6): 500-509.
Granger, D. A., K. T. Kivlighan, et al. (2007). "Integration of salivary biomarkers into
developmental and behaviorally-oriented research: Problems and solutions for collecting
specimens." Physiol Behav 92(4): 583-590.
Grant, J. F., N. Hicks, et al. (2009). "Gender-specific epidemiology of diabetes: a
representative cross-sectional study." Int J Equity Health 8(1): 6.
Greabu, M., M. Battino, et al. (2009). "Saliva--a diagnostic window to the body, both in
health and in disease." J Med Life 2(2): 124-132.
Gross, J. L., M. J. de Azevedo, et al. (2005). "Diabetic nephropathy: diagnosis, prevention,
and treatment." Diabetes Care 28(1): 164-176.
Guideline (2009). "Diagnosis and classification of diabetes mellitus." Diabetes Care 32
Suppl 1: S62-67.
Guo, Y., Z. Fu, et al. (2007). "A proteomic primer for the clinician." Proc Am Thorac Soc
4(1): 9-17.

113
Gursoy, U. K., E. Kononen, et al. (2010). "Salivary MMP-8, TIMP-1, and ICTP as markers
of advanced periodontitis." J Clin Periodontol 37(6): 487-493.
Hammer, H. B., S. Odegard, et al. (2010). "Calprotectin (a major S100 leucocyte protein)
predicts 10-year radiographic progression in patients with rheumatoid arthritis." Ann
Rheum Dis 69(1): 150-154.
Hardt, M., H. E. Witkowska, et al. (2005). "Assessing the effects of diurnal variation on the
composition of human parotid saliva: quantitative analysis of native peptides using iTRAQ
reagents." Anal Chem 77(15): 4947-4954.
Helmerhorst, E. J. (2007). "Whole saliva proteolysis: wealth of information for diagnostic
exploitation." Ann N Y Acad Sci 1098: 454-460.
Helmerhorst, E. J., X. Sun, et al. (2008). "Identification of Lys-Pro-Gln as a novel cleavage
site specificity of saliva-associated proteases." J Biol Chem 283(29): 19957-19966.
Henzel, W. J., C. Watanabe, et al. (2003). "Protein identification: the origins of peptide
mass fingerprinting." J Am Soc Mass Spectrom 14(9): 931-942.
Hirtz, C., F. Chevalier, et al. (2006). "Salivary protein profiling in type I diabetes using two-
dimensional electrophoresis and mass spectrometry." Clin Proteomics 2(1): 117-127.
Hu, S., M. Arellano, et al. (2008). "Salivary proteomics for oral cancer biomarker
discovery." Clin Cancer Res 14(19): 6246-6252.
Hu, S., J. A. Loo, et al. (2007). "Human saliva proteome analysis and disease biomarker
discovery." Expert Rev Proteomics 4(4): 531-538.
Hu, S., Y. Xie, et al. (2005). "Large-scale identification of proteins in human salivary
proteome by liquid chromatography/mass spectrometry and two-dimensional gel
electrophoresis-mass spectrometry." Proteomics 5(6): 1714-1728.
Huang, C. M., J. W. Torpey, et al. (2008). "A peptide with a ProGln C terminus in the
human saliva peptidome exerts bactericidal activity against Propionibacterium acnes."
Antimicrob Agents Chemother 52(5): 1834-1836.
Huang, C. M. and W. Zhu (2009). "Profiling human saliva endogenous peptidome via a
high throughput MALDI-TOF-TOF mass spectrometry." Comb Chem High Throughput
Screen 12(5): 521-531.
Hubel, A., A. Aksan, et al. (2011). "State of the Art in Preservation of Fluid Biospecimens."
Biopreserv and Biobank 9(3): 237-244.
114
Hummel, K., K. K. McFann, et al. (2012). "The Increasing Onset of Type 1 Diabetes in
Children." J Pediatr 161(4): 652-657.
Huq, N. L., K. J. Cross, et al. (2007). "A review of the salivary proteome and peptidome
and saliva-derived peptide therapeutics." Int J Pept Res Ther 13(4): 547-564.
Huzarewich, R. L., C. G. Siemens, et al. (2010). "Application of "omics" to prion biomarker
discovery." J Biomed Biotechnol 2010: 613504.
Inzitari, R., T. Cabras, et al. (2006). "Detection in human saliva of different statherin and
P-B fragments and derivatives." Proteomics 6(23): 6370-6379.
Issaq, H. J. and J. Blonder (2009). "Electrophoresis and liquid chromatography/tandem
mass spectrometry in disease biomarker discovery." J Chromatogr B Analyt Technol
Biomed Life Sci 877(13): 1222-1228.
Ito, T., A. Komiya-Ito, et al. (2008). "Relationship between antimicrobial protein levels in
whole saliva and periodontitis." J Periodontol 79(2): 316-322.
Jessie, K., W. W. Pang, et al. (2010). "Proteomic analysis of whole human saliva detects
enhanced expression of interleukin-1 receptor antagonist, thioredoxin and lipocalin-1 in
cigarette smokers compared to non-smokers." Int J Mol Sci 11(11): 4488-4505.
Julka, S. and F. Regnier (2004). "Quantification in proteomics through stable isotope
coding: a review." J Proteome Res 3(3): 350-363.
Kaplan, R., J. Mulvihill, et al. (1978). "Gingival Collagen-Metabolism and Crevicular Fluid
Collagenase Activity." J Dent Res 57: 264-264.
Kasper, D. L. and T. R. Harrison (2005). Harrison's manual of medicine. New York,
McGraw-Hill Medical Pub. Division.
Kaufman, E. and I. B. Lamster (2002). "The diagnostic applications of saliva--a review."
Crit Rev Oral Biol Med 13(2): 197-212.
Kim, H. J., P. K. Kim, et al. (2012). "Comparison of tear proteins between healthy and
early diabetic retinopathy patients." Clin Biochem 45(1-2): 60-67.
Kim, S. S., S. H. Song, et al. (2012). "Clinical implication of urinary tubular markers in the
early stage of nephropathy with type 2 diabetic patients." Diabetes Res Clin Pract 97(2):
251-257.

115
Kinney, J. S., C. A. Ramseier, et al. (2007). "Oral fluid-based biomarkers of alveolar bone
loss in periodontitis." Ann N Y Acad Sci 1098: 230-251.
Klose, J. (1975). "Protein mapping by combined isoelectric focusing and electrophoresis
of mouse tissues. A novel approach to testing for induced point mutations in mammals."
Humangenetik 26(3): 231-243.
Korkmaz, B., S. Attucci, et al. (2012). "Measurement of neutrophil elastase, proteinase 3,
and cathepsin G activities using intramolecularly quenched fluorogenic substrates."
Methods Mol Biol 844: 125-138.
Kumar, M. S., G. Vamsi, et al. (2006). "Expression of matrix metalloproteinases (MMP-8
and -9) in chronic periodontitis patients with and without diabetes mellitus." J Periodontol
77(11): 1803-1808.
Kuzuya, T., S. Nakagawa, et al. (2002). "Report of the Committee on the classification and
diagnostic criteria of diabetes mellitus." Diabetes Res Clin Pract 55(1): 65-85.
Lam, D. W. and D. LeRoith (2012). "The worldwide diabetes epidemic." Curr Opin
Endocrinol Diabetes Obes 19(2): 93-96.
Lapolla, A., L. Molin, et al. (2011). "Urinary peptides as a diagnostic tool for renal failure
detected by matrix-assisted laser desorption/ionisation mass spectrometry: an evaluation
of their clinical significance." Eur J Mass Spectrom (Chichester, Eng) 17(3): 245-253.
Le Yondre, N., H. Tammen, et al. (2008). "Analysis of the Human Salivary Peptidome by
Differential Peptide Display and LC-MS/MS Overview Sequencing." Open Proteomics J 1:
99-105.
Lescuyer, P., D. Hochstrasser, et al. (2007). "How shall we use the proteomics toolbox for
biomarker discovery?" J Proteome Res 6(9): 3371-3376.
Levine, M. (2011). "Susceptibility to dental caries and the salivary proline-rich proteins."
Int J Dent 2011: 953412.
Li, Y., M. A. St John, et al. (2004). "Salivary transcriptome diagnostics for oral cancer
detection." Clin Cancer Res 10(24): 8442-8450.
Ligoudistianou, C., Y. Xu, et al. (2005). "A novel human complement-related protein, C1r-
like protease (C1r-LP), specifically cleaves pro-C1s." Biochem J 387(Pt 1): 165-173.
Lima, D. P., D. G. Diniz, et al. (2010). "Saliva: reflection of the body." Int J Infect Dis 14(3):
e184-188.

116
Liu, H., R. G. Sadygov, et al. (2004). "A model for random sampling and estimation of
relative protein abundance in shotgun proteomics." Anal Chem 76(14): 4193-4201.
Liu, J. and Y. Duan (2012). "Saliva: a potential media for disease diagnostics and
monitoring." Oral Oncol 48(7): 569-577.
Llaurado, G., L. Gallart, et al. (2012). "Insulin resistance, low-grade inflammation and type
1 diabetes mellitus." Acta Diabetol 49(1): 33-39.
Lorencini, M., J. A. Silva, et al. (2009). "A new paradigm in the periodontal disease
progression: gingival connective tissue remodeling with simultaneous collagen
degradation and fibers thickening." Tissue Cell 41(1): 43-50.
Lorenz, K., M. Bader, et al. (2011). "Orosensory stimulation effects on human saliva
proteome." J Agric Food Chem 59(18): 10219-10231.
Lotti, L. V. and A. R. Hand (1988). "Endocytosis of parotid salivary proteins by striated
duct cells in streptozotocin-diabetic rats." Anat Rec 221(4): 802-811.
Luan, Y. and W. Xu (2007). "The structure and main functions of aminopeptidase N." Curr
Med Chem 14(6): 639-647.
Lucchi, G., C. Chambon, et al. (2009). "Mass-Spectrometry Based Characterisation of
Infant Whole Saliva Peptidome." Int J Pept Res Ther 15(3): 177-185.
Maahs, D. M., N. A. West, et al. (2010). "Epidemiology of type 1 diabetes." Endocrinol
Metab Clin North Am 39(3): 481-497.
Macedo, A., Z. Jorge, et al. (2003). "Prevalence of Type 1 diabetes mellitus in Portugal,
1995-1999:cohort of young men." Diabet Med 20(5): 418-419.
Malamud, D. (2011). "Saliva as a diagnostic fluid." Dent Clin North Am 55(1): 159-178.
Mata, A. D., D. Marques, et al. (2004). "Effects of diabetes mellitus on salivary secretion
and its composition in the human." Mol Cell Biochem 261(1-2): 137-142.
Matt, P., Z. Fu, et al. (2008). "Biomarker discovery: proteome fractionation and separation
in biological samples." Physiol Genomics 33(1): 12-17.
Mayor, S. (2007). "International Diabetes Federation consensus on prevention of type 2
diabetes." Int J Clin Pract 61(10): 1773-1775.
117
McCormack, A. L., D. M. Schieltz, et al. (1997). "Direct analysis and identification of
proteins in mixtures by LC/MS/MS and database searching at the low-femtomole level."
Anal Chem 69(4): 767-776.
McGuire, J. N., S. Eising, et al. (2010). "Screening newborns for candidate biomarkers of
type 1 diabetes." Arch Physiol Biochem 116(4-5): 227-232.
McKittrick, I. B., Y. Bogaert, et al. (2011). "Urinary matrix metalloproteinase activities:
biomarkers for plaque angiogenesis and nephropathy in diabetes." Am J Physiol Renal
Physiol 301(6): F1326-1333.
McLarty, D. G., I. Athaide, et al. (1990). "Islet cell antibodies are not specifically
associated with insulin-dependent diabetes in Tanzanian Africans." Diabetes Res Clin
Pract 9(3): 219-224.
Melvin, J. E., D. Yule, et al. (2005). "Regulation of fluid and electrolyte secretion in salivary
gland acinar cells." Annu Rev Physiol 67: 445-469.
Menschaert, G., T. T. Vandekerckhove, et al. (2010). "Peptidomics coming of age: a
review of contributions from a bioinformatics angle." J Proteome Res 9(5): 2051-2061.
Merchant, M. L. and J. B. Klein (2010). "Proteomic discovery of diabetic nephropathy
biomarkers." Adv Chronic Kidney Dis 17(6): 480-486.
Merchant, M. L., B. A. Perkins, et al. (2009). "Urinary peptidome may predict renal
function decline in type 1 diabetes and microalbuminuria." J Am Soc Nephrol 20(9): 2065-
2074.
Messent, J. W., T. G. Elliott, et al. (1992). "Prognostic significance of microalbuminuria in
insulin-dependent diabetes mellitus: a twenty-three year follow-up study." Kidney Int 41(4):
836-839.
Metz, T. O., W. J. Qian, et al. (2008). "Application of proteomics in the discovery of
candidate protein biomarkers in a diabetes autoantibody standardization program sample
subset." J Proteome Res 7(2): 698-707.
Mitic, B., G. Lazarevic, et al. (2008). "Diagnostic value of the aminopeptidase N, N-acetyl-
beta-D-glucosaminidase and dipeptidylpeptidase IV in evaluating tubular dysfunction in
patients with glomerulopathies." Ren Fail 30(9): 896-903.
Molitch, M. E., R. A. DeFronzo, et al. (2004). "Nephropathy in diabetes." Diabetes Care 27
Suppl 1: S79-83.
118
Moore, K. L., A. F. Dalley, et al. (2010). Clinically oriented anatomy. Philadelphia, Wolters
Kluwer/Lippincott Williams & Wilkins.
Morrow, D. A., Y. Wang, et al. (2008). "Myeloid-related protein 8/14 and the risk of
cardiovascular death or myocardial infarction after an acute coronary syndrome in the
Pravastatin or Atorvastatin Evaluation and Infection Therapy: Thrombolysis in Myocardial
Infarction (PROVE IT-TIMI 22) trial." Am Heart J 155(1): 49-55.
Morzel, M., A. Jeannin, et al. (2012). "Human infant saliva peptidome is modified with age
and diet transition." J Proteomics 75(12): 3665-3673.
Negrato, C. and O. Tarzia (2010). "Buccal alterations in diabetes mellitus." Diabetol Metab
Syndr 2(1): 3.
Neverova, I. and J. E. Van Eyk (2005). "Role of chromatographic techniques in proteomic
analysis." J Chromatogr B Analyt Technol Biomed Life Sci 815(1-2): 51-63.
Ngoh, G. A., H. T. Facundo, et al. (2010). "O-GlcNAc signaling in the cardiovascular
system." Circ Res 107(2): 171-185.
Nokoff, N. J., M. Rewers, et al. (2012). "The interplay of autoimmunity and insulin
resistance in type 1 diabetes." Discov Med 13(69): 115-122.
O'Farrell, P. H. (1975). "High resolution two-dimensional electrophoresis of proteins." J
Biol Chem 250(10): 4007-4021.
Ohshiro, K., D. I. Rosenthal, et al. (2007). "Pre-analytic saliva processing affect proteomic
results and biomarker screening of head and neck squamous carcinoma." Int J Oncol
30(3): 743-749.
Ola, M. S., M. I. Nawaz, et al. (2012). "Recent advances in understanding the biochemical
and molecular mechanism of diabetic retinopathy." J Diabetes Complications 26(1): 56-64.
Ong, S. E., B. Blagoev, et al. (2002). "Stable isotope labeling by amino acids in cell
culture, SILAC, as a simple and accurate approach to expression proteomics." Mol Cell
Proteomics 1(5): 376-386.
Orbak, R., S. Simsek, et al. (2008). "The influence of type-1 diabetes mellitus on dentition
and oral health in children and adolescents." Yonsei Med J 49(3): 357-365.
Orban, T., J. M. Sosenko, et al. (2009). "Pancreatic Islet Autoantibodies as Predictors of
Type 1 Diabetes in the Diabetes Prevention Trial-Type 1 (DPT-1)." Diabetes Care.

119
Overgaard, A. J., H. G. Hansen, et al. (2010). "Plasma proteome analysis of patients with
type 1 diabetes with diabetic nephropathy." Proteome Sci 8: 4.
Overgaard, A. J., T. E. Thingholm, et al. (2010). "Quantitative iTRAQ-Based Proteomic
Identification of Candidate Biomarkers for Diabetic Nephropathy in Plasma of Type 1
Diabetic Patients." Clin Proteomics 6(4): 105-114.
Padrao, A. I., R. Ferreira, et al. (2012). "Proteome-base biomarkers in Diabetes Mellitus:
progress on biofluids' protein profiling using mass spectrometry." Proteomics Clin Appl
6(9-10): 447-466.
Pederson, E. D., S. R. Stanke, et al. (1995). "Salivary levels of alpha 2-macroglobulin,
alpha 1-antitrypsin, C-reactive protein, cathepsin G and elastase in humans with or
without destructive periodontal disease." Arch Oral Biol 40(12): 1151-1155.
Peluso, G., M. De Santis, et al. (2007). "Proteomic study of salivary peptides and proteins
in patients with Sjogren's syndrome before and after pilocarpine treatment." Arthritis
Rheum 56(7): 2216-2222.
Perkins, D. N., D. J. Pappin, et al. (1999). "Probability-based protein identification by
searching sequence databases using mass spectrometry data." Electrophoresis 20(18):
3551-3567.
Pfaffe, T., J. Cooper-White, et al. (2011). "Diagnostic potential of saliva: current state and
future applications." Clin Chem 57(5): 675-687.
Phlips, J. C. and R. P. Radermecker (2012). "[Type 1 diabetes: from genetic
predisposition to hypothetical environmental triggers]." Rev Med Liege 67(5-6): 319-325.
Pickering, V., R. C. Jordan, et al. (2007). "Elevated salivary endothelin levels in oral
cancer patients--a pilot study." Oral Oncol 43(1): 37-41.
Pink, R., J. Simek, et al. (2009). "Saliva as a diagnostic medium." Biomed Pap Med Fac
Univ Palacky Olomouc Czech Repub 153(2): 103-110.
Preza, D., B. Thiede, et al. (2009). "The proteome of the human parotid gland secretion in
elderly with and without root caries." Acta Odontol Scand 67(3): 161-169.
Pyram, R., A. Kansara, et al. (2012). "Chronic kidney disease and diabetes." Maturitas
71(2): 94-103.
Qu, H. Q. and C. Polychronakos (2009). "The effect of the MHC locus on autoantibodies
in type 1 diabetes." J Med Genet 46(7): 469-471.

120
Quintana, L. F., J. M. Campistol, et al. (2009). "Application of label-free quantitative
peptidomics for the identification of urinary biomarkers of kidney chronic allograft
dysfunction." Mol Cell Proteomics 8(7): 1658-1673.
Quintana, M., O. Palicki, et al. (2009). "Inter-individual variability of protein patterns in
saliva of healthy adults." J Proteomics 72(5): 822-830.
Ramstrom, M. and J. Bergquist (2004). "Miniaturized proteomics and peptidomics using
capillary liquid separation and high resolution mass spectrometry." FEBS Lett 567(1): 92-
95.
Rao, P. V., X. Lu, et al. (2007). "Proteomic identification of urinary biomarkers of diabetic
nephropathy." Diabetes Care 30(3): 629-637.
Rao, P. V., A. P. Reddy, et al. (2009). "Proteomic identification of salivary biomarkers of
type-2 diabetes." J Proteome Res 8(1): 239-245.
Rawlings, N. D., A. J. Barrett, et al. (2012). "MEROPS: the database of proteolytic
enzymes, their substrates and inhibitors." Nucleic Acids Res 40(Database issue): D343-
350.
Rawlings, N. D., F. R. Morton, et al. (2008). "MEROPS: the peptidase database." Nucleic
Acids Res 36(Database issue): D320-325.
Rewers, M. (2012). "Challenges in diagnosing type 1 diabetes in different populations."
Diabetes Metab J 36(2): 90-97.
Rodrigues, F. J. C., L. S. Moura, et al. (1992). " Incidence of childhood type 1 (insulin-
dependent) diabetes in Coimbra, Portugal, 1987–91." Diabetologia 35( [Suppl 1]: A130).
Rodriguez-Suarez, E. and A. D. Whetton (2012). "The application of quantification
techniques in proteomics for biomedical research." Mass Spectrom Rev 32(1): 1-26.
Ross, P. L., Y. N. Huang, et al. (2004). "Multiplexed protein quantitation in
Saccharomyces cerevisiae using amine-reactive isobaric tagging reagents." Mol Cell
Proteomics 3(12): 1154-1169.
Rossing, K., H. Mischak, et al. (2008). "Urinary proteomics in diabetes and CKD." J Am
Soc Nephrol 19(7): 1283-1290.
Ruderman, N. B., J. R. Williamson, et al. (1992). "Glucose and diabetic vascular disease."
FASEB J 6(11): 2905-2914.
121
Rudney, J. D., R. K. Staikov, et al. (2009). "Potential biomarkers of human salivary
function: a modified proteomic approach." Arch Oral Biol 54(1): 91-100.
Sadygov, R. G., D. Cociorva, et al. (2004). "Large-scale database searching using tandem
mass spectra: looking up the answer in the back of the book." Nat Methods 1(3): 195-202.
Salvi, G. E., L. M. Franco, et al. (2010). "Pro-inflammatory biomarkers during experimental
gingivitis in patients with type 1 diabetes mellitus: a proof-of-concept study." J Clin
Periodontol 37(1): 9-16.
Samaranayake, L. (2007). "Saliva as a diagnostic fluid." Int Dent J 57(5): 295-299.
Sasongko, M. B., T. Y. Wong, et al. (2011). "Serum apolipoprotein AI and B are stronger
biomarkers of diabetic retinopathy than traditional lipids." Diabetes Care 34(2): 474-479.
Schaaij-Visser, T. B., R. H. Brakenhoff, et al. (2010). "Protein biomarker discovery for
head and neck cancer." J Proteomics 73(10): 1790-1803.
Schafer, B. W. and C. W. Heizmann (1996). "The S100 family of EF-hand calcium-binding
proteins: functions and pathology." Trends Biochem Sci 21(4): 134-140.
Schipper, R., A. Loof, et al. (2007). "Salivary Protein/Peptide Profiling with SELDI-TOF-
MS." Ann N Y Acad Sci 1098(1): 498-503.
Schlatzer, D., D. M. Maahs, et al. (2012). "Novel urinary protein biomarkers predicting the
development of microalbuminuria and renal function decline in type 1 diabetes." Diabetes
Care 35(3): 549-555.
Schrader, M. and P. Schulz-Knappe (2001). "Peptidomics technologies for human body
fluids." Trends Biotechnol 19(10 Suppl): S55-60.
Shah, S. J., K. H. Yu, et al. (2009). "Identification and quantification of preterm birth
biomarkers in human cervicovaginal fluid by liquid chromatography/tandem mass
spectrometry." J Proteome Res 8(5): 2407-2417.
Shamoon, H., H. Duffy, et al. (1993). "The Effect of Intensive Treatment of Diabetes on
the Development and Progression of Long-Term Complications in Insulin-Dependent
Diabetes-Mellitus." N Engl J Med 329(14): 977-986.
Silva, J. A., M. Lorencini, et al. (2008). "The influence of type I diabetes mellitus on the
expression and activity of gelatinases (matrix metalloproteinases-2 and -9) in induced
periodontal disease." J Periodontal Res 43(1): 48-54.

122
Simo, R., M. Higuera, et al. (2008). "Elevation of apolipoprotein A-I and apolipoprotein H
levels in the vitreous fluid and overexpression in the retina of diabetic patients." Arch
Ophthalmol 126(8): 1076-1081.
Siqueira, W. L. and F. G. Oppenheim (2009). "Small molecular weight proteins/peptides
present in the in vivo formed human acquired enamel pellicle." Arch Oral Biol 54(5): 437-
444.
Siudikiene, J., V. Machiulskiene, et al. (2008). "Dental caries increments and related
factors in children with type 1 diabetes mellitus." Caries Res 42(5): 354-362.
Soggiu, A., C. Piras, et al. (2012). "A discovery-phase urine proteomics investigation in
type 1 diabetes." Acta Diabetol 49(6): 453-464.
Soloviev, M. and P. Finch (2005). "Peptidomics, current status." J Chromatogr B Analyt
Technol Biomed Life Sci 815(1-2): 11-24.
Sorensen, J. S., F. Vaziri-Sani, et al. (2012). "Islet autoantibodies and residual beta cell
function in type 1 diabetes children followed for 3-6 years." Diabetes Res Clin Pract 96(2):
204-210.
Sperling, M. (2003). Type 1 diabetes : etiology and treatment. Totowa, N.J., Humana
Press.
Spielmann, N. and D. T. Wong (2011). "Saliva: diagnostics and therapeutic perspectives."
Oral Dis 17(4): 345-354.
Sreebny, L. M., A. Yu, et al. (1992). "Xerostomia in diabetes mellitus." Diabetes Care
15(7): 900-904.
Srinivasan, S., M. Thangavelu, et al. (2012). "iTRAQ quantitative proteomics in the
analysis of tears in dry eye patients." Invest Ophthalmol Vis Sci 53(8): 5052-5059.
St John, M. A., Y. Li, et al. (2004). "Interleukin 6 and interleukin 8 as potential biomarkers
for oral cavity and oropharyngeal squamous cell carcinoma." Arch Otolaryngol Head Neck
Surg 130(8): 929-935.
Streckfus, C. F., D. Arreola, et al. (2012). "Salivary Protein Profiles among HER2/neu-
Receptor-Positive and -Negative Breast Cancer Patients: Support for Using Salivary
Protein Profiles for Modeling Breast Cancer Progression." J Oncol 2012: 413256.
Streckfus, C. F. and L. R. Bigler (2002). "Saliva as a diagnostic fluid." Oral Dis 8(2): 69-76.

123
Streckfus, C. F., O. Mayorga-Wark, et al. (2008). "Breast cancer related proteins are
present in saliva and are modulated secondary to ductal carcinoma in situ of the breast."
Cancer Invest 26(2): 159-167.
Sun, Q. F., Q. H. Sun, et al. (2008). "Differential gene expression profiles of normal
human parotid and submandibular glands." Oral Dis 14(6): 500-509.
Sun, X., E. Salih, et al. (2009). "Activity-based mass spectrometric characterization of
proteases and inhibitors in human saliva." Proteomics Clin Appl 3(7): 810-820.
Sundsten, T. and H. Ortsater (2009). "Proteomics in diabetes research." Mol Cell
Endocrinol 297(1-2): 93-103.
Surampudi, P. N., J. John-Kalarickal, et al. (2009). "Emerging concepts in the
pathophysiology of type 2 diabetes mellitus." Mt Sinai J Med 76(3): 216-226.
Szklarczyk, D., A. Franceschini, et al. (2011). "The STRING database in 2011: functional
interaction networks of proteins, globally integrated and scored." Nucleic Acids Res
39(Database issue): D561-568.
Tanaka, K., N. Tsugawa, et al. (2009). "A new rapid and comprehensive peptidome
analysis by one-step direct transfer technology for 1-D electrophoresis/MALDI mass
spectrometry." Biochem Biophys Res Commun 379(1): 110-114.
Tanwir, F., M. Altamash, et al. (2009). "Effect of diabetes on periodontal status of a
population with poor oral health." Acta Odontol Scand 67(3): 129-133.
Thrailkill, K. M., R. C. Bunn, et al. (2007). "Matrix metalloproteinase-2 dysregulation in
type 1 diabetes." Diabetes Care 30(9): 2321-2326.
Thrailkill, K. M., T. Nimmo, et al. (2009). "Microalbuminuria in type 1 diabetes is
associated with enhanced excretion of the endocytic multiligand receptors megalin and
cubilin." Diabetes Care 32(7): 1266-1268.
Tonge, R., J. Shaw, et al. (2001). "Validation and development of fluorescence two-
dimensional differential gel electrophoresis proteomics technology." Proteomics 1(3): 377-
396.
Tsirogianni, A., E. Pipi, et al. (2009). "Specificity of islet cell autoantibodies and
coexistence with other organ specific autoantibodies in type 1 diabetes mellitus."
Autoimmun Rev 8(8): 687-691.

124
Unlu, M., M. E. Morgan, et al. (1997). "Difference gel electrophoresis: a single gel method
for detecting changes in protein extracts." Electrophoresis 18(11): 2071-2077.
van Belle, T. L., K. T. Coppieters, et al. (2011). "Type 1 diabetes: etiology, immunology,
and therapeutic strategies." Physiol Rev 91(1): 79-118.
Villanueva, J., A. Nazarian, et al. (2008). "A sequence-specific exopeptidase activity test
(SSEAT) for "functional" biomarker discovery." Mol Cell Proteomics 7(3): 509-518.
Vitorino, R., R. Alves, et al. (2010). "Finding new posttranslational modifications in salivary
proline-rich proteins." Proteomics 10(20): 3732-3742.
Vitorino, R., R. Alves, et al. (2010). "Finding new posttranslational modifications in salivary
proline-rich proteins." Proteomics 10(20): 3732-3742.
Vitorino, R., A. Barros, et al. (2009). "Towards defining the whole salivary peptidome."
Proteomics Clin Appl 3(5): 528-540.
Vitorino, R., A. S. Barros, et al. (2012). "Evaluation of different extraction procedures for
salivary peptide analysis." Talanta 94: 209-215.
Vitorino, R., M. J. Calheiros-Lobo, et al. (2006). "Salivary clinical data and dental caries
susceptibility: is there a relationship?" Bull Group Int Rech Sci Stomatol Odontol 47(1): 27-
33.
Vitorino, R., M. J. Calheiros-Lobo, et al. (2008). "Peptide profile of human acquired
enamel pellicle using MALDI tandem MS." J Sep Sci 31(3): 523-537.
Vitorino, R., M. J. Calheiros-Lobo, et al. (2007). "Peptidomic analysis of human acquired
enamel pellicle." Biomed Chromatogr 21(11): 1107-1117.
Vitorino, R., S. de Morais Guedes, et al. (2006). "Two-dimensional electrophoresis study
of in vitro pellicle formation and dental caries susceptibility." Eur J Oral Sci 114(2): 147-
153.
Vitorino, R., M. J. Lobo, et al. (2004). "Identification of human whole saliva protein
components using proteomics." Proteomics 4(4): 1109-1115.
Walz, A., K. Stuhler, et al. (2006). "Proteome analysis of glandular parotid and
submandibular-sublingual saliva in comparison to whole human saliva by two-dimensional
gel electrophoresis." Proteomics 6(5): 1631-1639.

125
Wang, J. P., C. Zhang, et al. (2007). "[Relationship between autoantibodies and HLA-DQ
genotypes in patients with type 1 diabetes mellitus]." Zhonghua Yi Xue Za Zhi 87(34):
2380-2384.
Wang, W., H. Zhou, et al. (2003). "Quantification of proteins and metabolites by mass
spectrometry without isotopic labeling or spiked standards." Anal Chem 75(18): 4818-
4826.
Washburn, M. P. (2011). "Driving biochemical discovery with quantitative proteomics."
Trends Biochem Sci 36(3): 170-177.
Watso, J. T. and O. D. Sparkman (2007). Introduction to mass spectrometry:
instrumentation, applications, and strategies for data interpretation. West Sussex, Wiley.
Wei, X. and L. Li (2009). "Mass spectrometry-based proteomics and peptidomics for
biomarker discovery in neurodegenerative diseases." Int J Clin Exp Pathol 2(2): 132-148.
Westman-Brinkmalm, A., U. Ruetschi, et al. (2009). "Proteomics/peptidomics tools to find
CSF biomarkers for neurodegenerative diseases." Front Biosci 14: 1793-1806.
Whiting, D. R., L. Guariguata, et al. (2011). "IDF diabetes atlas: global estimates of the
prevalence of diabetes for 2011 and 2030." Diabetes Res Clin Pract 94(3): 311-321.
WHO (1999). "Definition, diagnosis and classification of diabetes mellitus and its
complications."
Wiener, M. C., J. R. Sachs, et al. (2004). "Differential mass spectrometry: a label-free LC-
MS method for finding significant differences in complex peptide and protein mixtures."
Anal Chem 76(20): 6085-6096.
Wilkin, T., P. J. Hoskins, et al. (1985). "Value of insulin autoantibodies as serum markers
for insulin-dependent diabetes mellitus." Lancet 1(8427): 480-481.
Wu, Y., R. Shu, et al. (2009). "Initial comparison of proteomic profiles of whole
unstimulated saliva obtained from generalized aggressive periodontitis patients and
healthy control subjects." J Periodontal Res 44(5): 636-644.
Wu, Z. Z., J. G. Wang, et al. (2009). "Diagnostic model of saliva protein finger print
analysis of patients with gastric cancer." World J Gastroenterol 15(7): 865-870.
Xia, Y. and S. A. McLuckey (2008). "Evolution of instrumentation for the study of gas-
phase ion/ion chemistry via mass spectrometry." J Am Soc Mass Spectrom 19(2): 173-
189.

126
Xiao, H., L. Zhang, et al. (2012). "Proteomic analysis of human saliva from lung cancer
patients using two-dimensional difference gel electrophoresis and mass spectrometry."
Mol Cell Proteomics 11(2): M111 012112.
Xie, F., T. Liu, et al. (2011). "Liquid chromatography-mass spectrometry-based
quantitative proteomics." J Biol Chem 286(29): 25443-25449.
Xie, H., N. L. Rhodus, et al. (2005). "A catalogue of human saliva proteins identified by
free flow electrophoresis-based peptide separation and tandem mass spectrometry." Mol
Cell Proteomics 4(11): 1826-1830.
Xu, Y. D., L. M. Yin, et al. (2012). "[S100A8 protein in inflammation]." Sheng Li Xue Bao
64(2): 231-237.
Yan, W., R. Apweiler, et al. (2009). "Systematic comparison of the human saliva and
plasma proteomes." Proteomics. Clin Appl 3(1): 116-134.
Yao, X., A. Freas, et al. (2001). "Proteolytic 18O labeling for comparative proteomics:
model studies with two serotypes of adenovirus." Anal Chem 73(13): 2836-2842.
Yavuzyilmaz, E., O. Yumak, et al. (1996). "The alterations of whole saliva constituents in
patients with diabetes mellitus." Aust Dent J 41(3): 193-197.
Yoon, M. S., V. Jankowski, et al. (2004). "Characterisation of advanced glycation
endproducts in saliva from patients with diabetes mellitus." Biochem Biophys Res
Commun 323(2): 377-381.
Yu, K. H., C. G. Barry, et al. (2009). "Stable isotope dilution multidimensional liquid
chromatography-tandem mass spectrometry for pancreatic cancer serum biomarker
discovery." J Proteome Res 8(3): 1565-1576.
Zhang, J., S. Zhou, et al. (2012). "Magnetic bead-based salivary peptidome profiling for
periodontal-orthodontic treatment." Proteome Sci 10(1): 63.
Zhang, L., B. Chen, et al. (2012). "Metabolic memory: mechanisms and implications for
diabetic retinopathy." Diabetes Res Clin Pract 96(3): 286-293.
Zhi, W., S. Purohit, et al. (2010). "Proteomic technologies for the discovery of type 1
diabetes biomarkers." J Diabetes Sci Technol 4(4): 993-1002.
Zhi, W., A. Sharma, et al. (2011). "Discovery and validation of serum protein changes in
type 1 diabetes patients using high throughput two dimensional liquid chromatography-
mass spectrometry and immunoassays." Mol Cell Proteomics 10(11): M111 012203.
127
Zhou, M. and T. Veenstra (2008). "Mass spectrometry: m/z 1983-2008." Biotechniques
44(5): 667-668, 670.
Zurbig, P., G. Jerums, et al. (2012). "Urinary Proteomics for Early Diagnosis in Diabetic
Nephropathy." Diabetes 61(12): 3304-3313.

128

129
APENDIX -
SUPPLEMENTARY DATA

130

131
STUDY I - SALIVARY PEPTIDOME IN TYPE 1 DIABETES MELLITUS
Supplemental Table 1: List of proteins that correspond to the identified peptides in all subjects.
Protein Name Accession Number Protein MW Protein PI
Acetylcholinesterase collagenic tail peptide OS=Homo sapiens GN=COLQ PE=1 SV=2 COLQ_HUMAN 47735,3086 8,42
Atherin OS=Homo sapiens GN=SAMD1 PE=1 SV=1 SAMD1_HUMAN 56017,7070 7,12
AT-rich interactive domain-containing protein 1B OS=Homo sapiens GN=ARID1B PE=1 SV=2 ARI1B_HUMAN 235973,8594 6,26
Basic proline-rich peptide P-E OS=Homo sapiens PE=1 SV=1 PRPE_HUMAN 6020,0801 11,74
Basic salivary proline-rich protein 1 OS=Homo sapiens GN=PRB1 PE=1 SV=2 PRP1_HUMAN 38522,6211 11,22
Basic salivary proline-rich protein 2 OS=Homo sapiens GN=PRB2 PE=1 SV=3 PRB2_HUMAN 40774,7695 11,63
Basic salivary proline-rich protein 3 OS=Homo sapiens GN=PRB3 PE=1 SV=1 PRB3_HUMAN 30917,5605 10,61
Basic salivary proline-rich protein 4 OS=Homo sapiens GN=PRB4 PE=1 SV=3 PRB4_HUMAN 31332,7793 10,52
BAT2 domain-containing protein 1 OS=Homo sapiens GN=BAT2D1 PE=1 SV=2 BA2D1_HUMAN 316843,6250 9,17
Choline kinase alpha OS=Homo sapiens GN=CHKA PE=1 SV=2 CHKA_HUMAN 52168,5313 6,16
Cleavage and polyadenylation specificity factor subunit 6 OS=Homo sapiens GN=CPSF6 PE=1 SV=2 CPSF6_HUMAN 59173,4219 6,66
Collagen alpha-1(I) chain OS=Homo sapiens GN=COL1A1 PE=1 SV=4 CO1A1_HUMAN 138826,5469 5,60
Collagen alpha-1(II) chain OS=Homo sapiens GN=COL2A1 PE=1 SV=3 CO2A1_HUMAN 141698,5000 6,58
Collagen alpha-1(III) chain OS=Homo sapiens GN=COL3A1 PE=1 SV=4 CO3A1_HUMAN 138478,9688 6,21
Collagen alpha-1(IV) chain OS=Homo sapiens GN=COL4A1 PE=1 SV=3 CO4A1_HUMAN 160514,0469 8,55
Collagen alpha-1(IX) chain OS=Homo sapiens GN=COL9A1 PE=1 SV=2 CO9A1_HUMAN 91798,4922 8,93
Collagen alpha-1(V) chain OS=Homo sapiens GN=COL5A1 PE=1 SV=3 CO5A1_HUMAN 183447,0469 4,94
Collagen alpha-1(VI) chain OS=Homo sapiens GN=COL6A1 PE=1 SV=3 CO6A1_HUMAN 108461,9844 5,26
Collagen alpha-1(VII) chain OS=Homo sapiens GN=COL7A1 PE=1 SV=2 CO7A1_HUMAN 295040,9375 5,95
Collagen alpha-1(VIII) chain OS=Homo sapiens GN=COL8A1 PE=2 SV=2 CO8A1_HUMAN 73317,1875 9,62
Collagen alpha-1(X) chain OS=Homo sapiens GN=COL10A1 PE=1 SV=2 COAA1_HUMAN 66116,7969 9,68
Collagen alpha-1(XI) chain OS=Homo sapiens GN=COL11A1 PE=1 SV=4 COBA1_HUMAN 180953,0000 5,06

132
Collagen alpha-1(XII) chain OS=Homo sapiens GN=COL12A1 PE=1 SV=2 COCA1_HUMAN 332939,5938 5,38
Collagen alpha-1(XIII) chain OS=Homo sapiens GN=COL13A1 PE=1 SV=1 CODA1_HUMAN 69906,6172 9,27
Collagen alpha-1(XIX) chain OS=Homo sapiens GN=COL19A1 PE=1 SV=3 COJA1_HUMAN 115149,3906 8,57
Collagen alpha-1(XV) chain OS=Homo sapiens GN=COL15A1 PE=1 SV=2 COFA1_HUMAN 141631,7031 4,89
Collagen alpha-1(XVI) chain OS=Homo sapiens GN=COL16A1 PE=1 SV=2 COGA1_HUMAN 157652,5469 8,14
Collagen alpha-1(XVII) chain OS=Homo sapiens GN=COL17A1 PE=1 SV=3 COHA1_HUMAN 150326,4844 8,89
Collagen alpha-1(XXII) chain OS=Homo sapiens GN=COL22A1 PE=1 SV=1 COMA1_HUMAN 161015,5469 6,88
Collagen alpha-1(XXV) chain OS=Homo sapiens GN=COL25A1 PE=1 SV=1 COPA1_HUMAN 64745,5117 8,80
Collagen alpha-1(XXVI) chain OS=Homo sapiens GN=EMID2 PE=2 SV=1 EMID2_HUMAN 45352,6211 7,02
Collagen alpha-1(XXVII) chain OS=Homo sapiens GN=COL27A1 PE=1 SV=1 CORA1_HUMAN 186776,0938 9,83
Collagen alpha-1(XXVII) chain OS=Homo sapiens GN=COL27A1 PE=1 SV=1 CORA1_HUMAN 186776,0938 9,83
Collagen alpha-1(XXVIII) chain OS=Homo sapiens GN=COL28A1 PE=2 SV=2 COSA1_HUMAN 116584,8594 6,10
Collagen alpha-2(I) chain OS=Homo sapiens GN=COL1A2 PE=1 SV=6 CO1A2_HUMAN 129209,4219 9,08
Collagen alpha-2(IV) chain OS=Homo sapiens GN=COL4A2 PE=1 SV=4 CO4A2_HUMAN 167448,6250 8,89
Collagen alpha-2(IX) chain OS=Homo sapiens GN=COL9A2 PE=1 SV=2 CO9A2_HUMAN 65090,9297 9,23
Collagen alpha-2(IX) chain OS=Homo sapiens GN=COL9A2 PE=1 SV=2 CO9A2_HUMAN 65090,9297 9,23
Collagen alpha-2(V) chain OS=Homo sapiens GN=COL5A2 PE=1 SV=3 CO5A2_HUMAN 144820,9688 6,07
Collagen alpha-2(VIII) chain OS=Homo sapiens GN=COL8A2 PE=1 SV=2 CO8A2_HUMAN 67202,3438 9,05
Collagen alpha-2(XI) chain OS=Homo sapiens GN=COL11A2 PE=1 SV=4 COBA2_HUMAN 171669,8438 5,89
Collagen alpha-3(IV) chain OS=Homo sapiens GN=COL4A3 PE=1 SV=3 CO4A3_HUMAN 161711,0625 9,28
Collagen alpha-3(IX) chain OS=Homo sapiens GN=COL9A3 PE=2 SV=2 CO9A3_HUMAN 63577,1211 7,57
Collagen alpha-3(V) chain OS=Homo sapiens GN=COL5A3 PE=1 SV=2 CO5A3_HUMAN 171946,7031 6,37
Collagen alpha-3(VI) chain OS=Homo sapiens GN=COL6A3 PE=1 SV=4 CO6A3_HUMAN 343452,7813 6,26
Collagen alpha-4(IV) chain OS=Homo sapiens GN=COL4A4 PE=1 SV=2 CO4A4_HUMAN 163895,3125 8,87
Collagen alpha-5(IV) chain OS=Homo sapiens GN=COL4A5 PE=1 SV=2 CO4A5_HUMAN 160942,9063 7,71
Collagen alpha-6(IV) chain OS=Homo sapiens GN=COL4A6 PE=2 SV=3 CO4A6_HUMAN 163704,2813 9,31
Collectin-12 OS=Homo sapiens GN=COLEC12 PE=1 SV=2 COL12_HUMAN 81474,6797 5,48
Complement C1q tumor necrosis factor-related protein 2 OS=Homo sapiens GN=C1QTNF2 PE=2 SV=1 C1QT2_HUMAN 29932,8809 9,04
Constitutive coactivator of PPAR-gamma-like protein 2 OS=Homo sapiens GN=FAM120C PE=2 SV=2 F120C_HUMAN 120499,5469 9,19
Corticotropin-lipotropin OS=Homo sapiens GN=POMC PE=1 SV=2 COLI_HUMAN 29405,3691 7,56
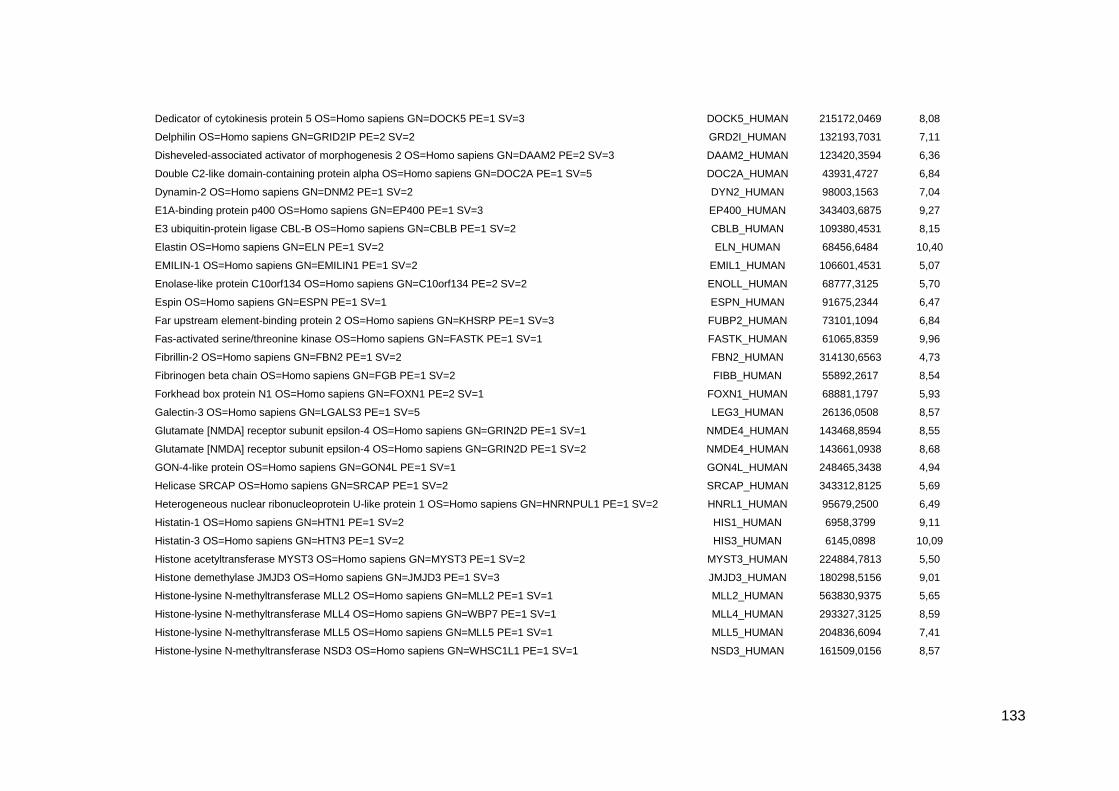
133
Dedicator of cytokinesis protein 5 OS=Homo sapiens GN=DOCK5 PE=1 SV=3 DOCK5_HUMAN 215172,0469 8,08
Delphilin OS=Homo sapiens GN=GRID2IP PE=2 SV=2 GRD2I_HUMAN 132193,7031 7,11
Disheveled-associated activator of morphogenesis 2 OS=Homo sapiens GN=DAAM2 PE=2 SV=3 DAAM2_HUMAN 123420,3594 6,36
Double C2-like domain-containing protein alpha OS=Homo sapiens GN=DOC2A PE=1 SV=5 DOC2A_HUMAN 43931,4727 6,84
Dynamin-2 OS=Homo sapiens GN=DNM2 PE=1 SV=2 DYN2_HUMAN 98003,1563 7,04
E1A-binding protein p400 OS=Homo sapiens GN=EP400 PE=1 SV=3 EP400_HUMAN 343403,6875 9,27
E3 ubiquitin-protein ligase CBL-B OS=Homo sapiens GN=CBLB PE=1 SV=2 CBLB_HUMAN 109380,4531 8,15
Elastin OS=Homo sapiens GN=ELN PE=1 SV=2 ELN_HUMAN 68456,6484 10,40
EMILIN-1 OS=Homo sapiens GN=EMILIN1 PE=1 SV=2 EMIL1_HUMAN 106601,4531 5,07
Enolase-like protein C10orf134 OS=Homo sapiens GN=C10orf134 PE=2 SV=2 ENOLL_HUMAN 68777,3125 5,70
Espin OS=Homo sapiens GN=ESPN PE=1 SV=1 ESPN_HUMAN 91675,2344 6,47
Far upstream element-binding protein 2 OS=Homo sapiens GN=KHSRP PE=1 SV=3 FUBP2_HUMAN 73101,1094 6,84
Fas-activated serine/threonine kinase OS=Homo sapiens GN=FASTK PE=1 SV=1 FASTK_HUMAN 61065,8359 9,96
Fibrillin-2 OS=Homo sapiens GN=FBN2 PE=1 SV=2 FBN2_HUMAN 314130,6563 4,73
Fibrinogen beta chain OS=Homo sapiens GN=FGB PE=1 SV=2 FIBB_HUMAN 55892,2617 8,54
Forkhead box protein N1 OS=Homo sapiens GN=FOXN1 PE=2 SV=1 FOXN1_HUMAN 68881,1797 5,93
Galectin-3 OS=Homo sapiens GN=LGALS3 PE=1 SV=5 LEG3_HUMAN 26136,0508 8,57
Glutamate [NMDA] receptor subunit epsilon-4 OS=Homo sapiens GN=GRIN2D PE=1 SV=1 NMDE4_HUMAN 143468,8594 8,55
Glutamate [NMDA] receptor subunit epsilon-4 OS=Homo sapiens GN=GRIN2D PE=1 SV=2 NMDE4_HUMAN 143661,0938 8,68
GON-4-like protein OS=Homo sapiens GN=GON4L PE=1 SV=1 GON4L_HUMAN 248465,3438 4,94
Helicase SRCAP OS=Homo sapiens GN=SRCAP PE=1 SV=2 SRCAP_HUMAN 343312,8125 5,69
Heterogeneous nuclear ribonucleoprotein U-like protein 1 OS=Homo sapiens GN=HNRNPUL1 PE=1 SV=2 HNRL1_HUMAN 95679,2500 6,49
Histatin-1 OS=Homo sapiens GN=HTN1 PE=1 SV=2 HIS1_HUMAN 6958,3799 9,11
Histatin-3 OS=Homo sapiens GN=HTN3 PE=1 SV=2 HIS3_HUMAN 6145,0898 10,09
Histone acetyltransferase MYST3 OS=Homo sapiens GN=MYST3 PE=1 SV=2 MYST3_HUMAN 224884,7813 5,50
Histone demethylase JMJD3 OS=Homo sapiens GN=JMJD3 PE=1 SV=3 JMJD3_HUMAN 180298,5156 9,01
Histone-lysine N-methyltransferase MLL2 OS=Homo sapiens GN=MLL2 PE=1 SV=1 MLL2_HUMAN 563830,9375 5,65
Histone-lysine N-methyltransferase MLL4 OS=Homo sapiens GN=WBP7 PE=1 SV=1 MLL4_HUMAN 293327,3125 8,59
Histone-lysine N-methyltransferase MLL5 OS=Homo sapiens GN=MLL5 PE=1 SV=1 MLL5_HUMAN 204836,6094 7,41
Histone-lysine N-methyltransferase NSD3 OS=Homo sapiens GN=WHSC1L1 PE=1 SV=1 NSD3_HUMAN 161509,0156 8,57

134
Histone-lysine N-methyltransferase SETD1A OS=Homo sapiens GN=SETD1A PE=1 SV=3 SET1A_HUMAN 185919,1406 5,07
Histone-lysine N-methyltransferase SETD1B OS=Homo sapiens GN=SETD1B PE=1 SV=2 SET1B_HUMAN 208599,4219 4,86
Homeobox protein CDX-2 OS=Homo sapiens GN=CDX2 PE=1 SV=2 CDX2_HUMAN 33488,9453 9,65
Homeobox protein Hox-A10 OS=Homo sapiens GN=HOXA10 PE=1 SV=2 HXA10_HUMAN 40510,7305 8,30
Host cell factor OS=Homo sapiens GN=HCFC1 PE=1 SV=2 HCFC1_HUMAN 208600,9688 7,32
Huntingtin OS=Homo sapiens GN=HTT PE=1 SV=1 HD_HUMAN 347638,8750 5,81
Insulinoma-associated protein 1 OS=Homo sapiens GN=INSM1 PE=2 SV=1 INSM1_HUMAN 52890,0195 9,19
Inverted formin-2 OS=Homo sapiens GN=INF2 PE=1 SV=2 INF2_HUMAN 135539,7344 5,26
IQ motif and SEC7 domain-containing protein 3 OS=Homo sapiens GN=IQSEC3 PE=2 SV=3 IQEC3_HUMAN 127541,4531 6,08
Iroquois-class homeodomain protein IRX-1 OS=Homo sapiens GN=IRX1 PE=1 SV=3 IRX1_HUMAN 49590,8398 5,78
Kelch-like protein 17 OS=Homo sapiens GN=KLHL17 PE=2 SV=1 KLH17_HUMAN 69830,1250 7,64
Ladybird homeobox corepressor 1-like protein OS=Homo sapiens GN=CORL2 PE=1 SV=2 CORL2_HUMAN 104170,2578 6,02
Large proline-rich protein BAT2 OS=Homo sapiens GN=BAT2 PE=1 SV=2 BAT2_HUMAN 228720,5781 9,49
LON peptidase N-terminal domain and RING finger protein 2 OS=Homo sapiens GN=LONRF2 PE=2 SV=2 LONF2_HUMAN 83584,3281 5,65
MAP kinase-activated protein kinase 2 OS=Homo sapiens GN=MAPKAPK2 PE=1 SV=1 MAPK2_HUMAN 45538,4844 8,87
Matrix metalloproteinase-15 OS=Homo sapiens GN=MMP15 PE=1 SV=1 MMP15_HUMAN 75759,0469 7,03
Mediator of RNA polymerase II transcription subunit 25 OS=Homo sapiens GN=MED25 PE=1 SV=2 MED25_HUMAN 78121,4219 8,61
Methyl-CpG-binding domain protein 6 OS=Homo sapiens GN=MBD6 PE=2 SV=2 MBD6_HUMAN 101138,4609 9,72
Mucin-7 OS=Homo sapiens GN=MUC7 PE=1 SV=1 MUC7_HUMAN 39146,6992 8,99
Multivesicular body subunit 12B OS=Homo sapiens GN=FAM125B PE=1 SV=2 F125B_HUMAN 35596,8359 8,42
Myocyte-specific enhancer factor 2A OS=Homo sapiens GN=MEF2A PE=1 SV=1 MEF2A_HUMAN 54777,1602 7,72
Myosin-Ie OS=Homo sapiens GN=MYO1E PE=1 SV=2 MYO1E_HUMAN 126981,9922 9,01
Neurogenic differentiation factor 2 OS=Homo sapiens GN=NEUROD2 PE=2 SV=2 NDF2_HUMAN 41335,3203 6,29
Neurogenic locus notch homolog protein 1 OS=Homo sapiens GN=NOTCH1 PE=1 SV=4 NOTC1_HUMAN 272320,7188 4,95
Neurogenic locus notch homolog protein 3 OS=Homo sapiens GN=NOTCH3 PE=1 SV=1 NOTC3_HUMAN 243496,1563 5,18
Peripheral-type benzodiazepine receptor-associated protein 1 OS=Homo sapiens GN=BZRAP1 PE=1 SV=2 RIMB1_HUMAN 199927,6719 5,05
PERQ amino acid-rich with GYF domain-containing protein 1 OS=Homo sapiens GN=GIGYF1 PE=1 SV=2 PERQ1_HUMAN 114531,1875 5,29
Pleckstrin homology domain-containing family G member 2 OS=Homo sapiens GN=PLEKHG2 PE=1 SV=2 PKHG2_HUMAN 147823,0469 5,57
Pogo transposable element with ZNF domain OS=Homo sapiens GN=POGZ PE=1 SV=2 POGZ_HUMAN 155244,6875 7,14
Polymeric immunoglobulin receptor OS=Homo sapiens GN=PIGR PE=1 SV=4 PIGR_HUMAN 83231,6484 5,58
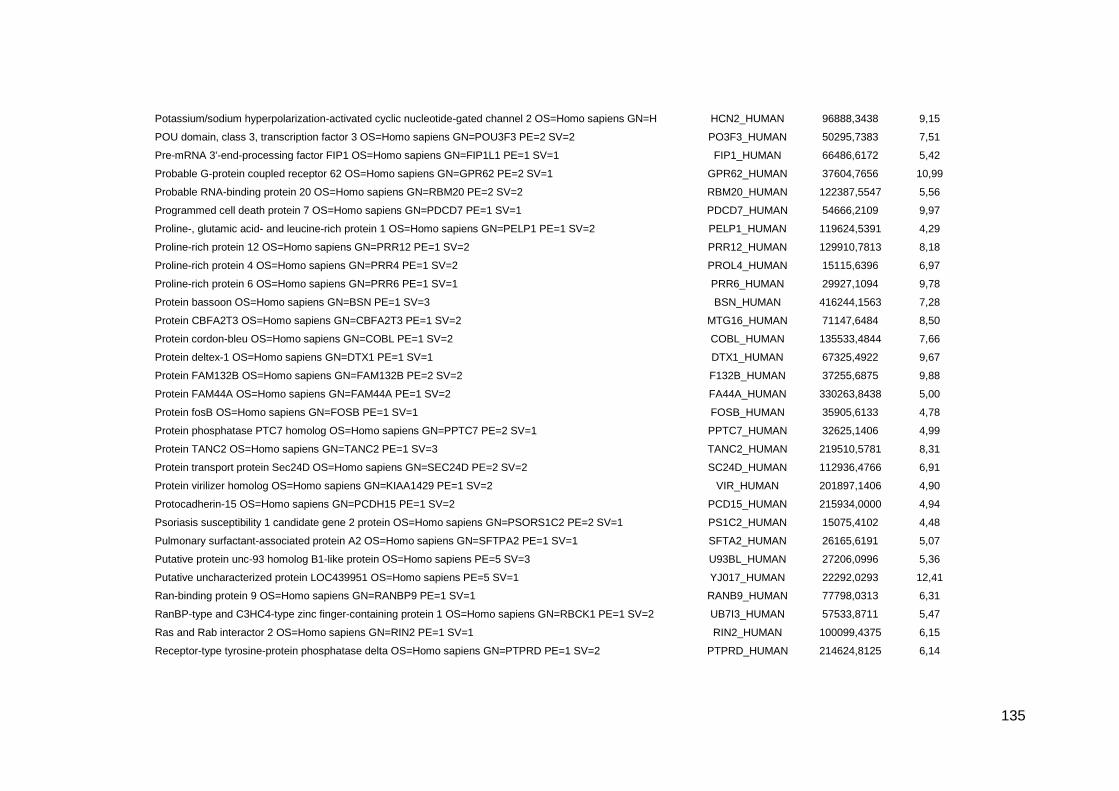
135
Potassium/sodium hyperpolarization-activated cyclic nucleotide-gated channel 2 OS=Homo sapiens GN=H HCN2_HUMAN 96888,3438 9,15
POU domain, class 3, transcription factor 3 OS=Homo sapiens GN=POU3F3 PE=2 SV=2 PO3F3_HUMAN 50295,7383 7,51
Pre-mRNA 3'-end-processing factor FIP1 OS=Homo sapiens GN=FIP1L1 PE=1 SV=1 FIP1_HUMAN 66486,6172 5,42
Probable G-protein coupled receptor 62 OS=Homo sapiens GN=GPR62 PE=2 SV=1 GPR62_HUMAN 37604,7656 10,99
Probable RNA-binding protein 20 OS=Homo sapiens GN=RBM20 PE=2 SV=2 RBM20_HUMAN 122387,5547 5,56
Programmed cell death protein 7 OS=Homo sapiens GN=PDCD7 PE=1 SV=1 PDCD7_HUMAN 54666,2109 9,97
Proline-, glutamic acid- and leucine-rich protein 1 OS=Homo sapiens GN=PELP1 PE=1 SV=2 PELP1_HUMAN 119624,5391 4,29
Proline-rich protein 12 OS=Homo sapiens GN=PRR12 PE=1 SV=2 PRR12_HUMAN 129910,7813 8,18
Proline-rich protein 4 OS=Homo sapiens GN=PRR4 PE=1 SV=2 PROL4_HUMAN 15115,6396 6,97
Proline-rich protein 6 OS=Homo sapiens GN=PRR6 PE=1 SV=1 PRR6_HUMAN 29927,1094 9,78
Protein bassoon OS=Homo sapiens GN=BSN PE=1 SV=3 BSN_HUMAN 416244,1563 7,28
Protein CBFA2T3 OS=Homo sapiens GN=CBFA2T3 PE=1 SV=2 MTG16_HUMAN 71147,6484 8,50
Protein cordon-bleu OS=Homo sapiens GN=COBL PE=1 SV=2 COBL_HUMAN 135533,4844 7,66
Protein deltex-1 OS=Homo sapiens GN=DTX1 PE=1 SV=1 DTX1_HUMAN 67325,4922 9,67
Protein FAM132B OS=Homo sapiens GN=FAM132B PE=2 SV=2 F132B_HUMAN 37255,6875 9,88
Protein FAM44A OS=Homo sapiens GN=FAM44A PE=1 SV=2 FA44A_HUMAN 330263,8438 5,00
Protein fosB OS=Homo sapiens GN=FOSB PE=1 SV=1 FOSB_HUMAN 35905,6133 4,78
Protein phosphatase PTC7 homolog OS=Homo sapiens GN=PPTC7 PE=2 SV=1 PPTC7_HUMAN 32625,1406 4,99
Protein TANC2 OS=Homo sapiens GN=TANC2 PE=1 SV=3 TANC2_HUMAN 219510,5781 8,31
Protein transport protein Sec24D OS=Homo sapiens GN=SEC24D PE=2 SV=2 SC24D_HUMAN 112936,4766 6,91
Protein virilizer homolog OS=Homo sapiens GN=KIAA1429 PE=1 SV=2 VIR_HUMAN 201897,1406 4,90
Protocadherin-15 OS=Homo sapiens GN=PCDH15 PE=1 SV=2 PCD15_HUMAN 215934,0000 4,94
Psoriasis susceptibility 1 candidate gene 2 protein OS=Homo sapiens GN=PSORS1C2 PE=2 SV=1 PS1C2_HUMAN 15075,4102 4,48
Pulmonary surfactant-associated protein A2 OS=Homo sapiens GN=SFTPA2 PE=1 SV=1 SFTA2_HUMAN 26165,6191 5,07
Putative protein unc-93 homolog B1-like protein OS=Homo sapiens PE=5 SV=3 U93BL_HUMAN 27206,0996 5,36
Putative uncharacterized protein LOC439951 OS=Homo sapiens PE=5 SV=1 YJ017_HUMAN 22292,0293 12,41
Ran-binding protein 9 OS=Homo sapiens GN=RANBP9 PE=1 SV=1 RANB9_HUMAN 77798,0313 6,31
RanBP-type and C3HC4-type zinc finger-containing protein 1 OS=Homo sapiens GN=RBCK1 PE=1 SV=2 UB7I3_HUMAN 57533,8711 5,47
Ras and Rab interactor 2 OS=Homo sapiens GN=RIN2 PE=1 SV=1 RIN2_HUMAN 100099,4375 6,15
Receptor-type tyrosine-protein phosphatase delta OS=Homo sapiens GN=PTPRD PE=1 SV=2 PTPRD_HUMAN 214624,8125 6,14

136
Regulator of telomere elongation helicase 1 OS=Homo sapiens GN=RTEL1 PE=2 SV=1 RTEL1_HUMAN 152277,9219 8,68
Retinal homeobox protein Rx OS=Homo sapiens GN=RAX PE=1 SV=1 RX_HUMAN 36781,8789 9,11
Retrotransposon-derived protein PEG10 OS=Homo sapiens GN=PEG10 PE=1 SV=2 PEG10_HUMAN 80122,1172 5,94
Rho GTPase-activating protein 17 OS=Homo sapiens GN=ARHGAP17 PE=1 SV=1 RHG17_HUMAN 95377,5078 7,23
RNA-binding protein 27 OS=Homo sapiens GN=RBM27 PE=1 SV=2 RBM27_HUMAN 118644,7500 9,24
RNA-binding protein 33 OS=Homo sapiens GN=RBM33 PE=1 SV=3 RBM33_HUMAN 129905,7500 6,45
Salivary acidic proline-rich phosphoprotein 1/2 OS=Homo sapiens GN=PRH1 PE=1 SV=2 PRPC_HUMAN 17006,2793 4,63
Sal-like protein 2 OS=Homo sapiens GN=SALL2 PE=1 SV=3 SALL2_HUMAN 105332,9297 5,92
SCO-spondin OS=Homo sapiens GN=SSPO PE=2 SV=1 SSPO_HUMAN 547136,0000 5,66
Serine/threonine-protein kinase LMTK3 OS=Homo sapiens GN=LMTK3 PE=2 SV=2 LMTK3_HUMAN 153565,7656 4,77
Serine/threonine-protein kinase WNK2 OS=Homo sapiens GN=WNK2 PE=1 SV=4 WNK2_HUMAN 242522,5469 5,79
SH3 and multiple ankyrin repeat domains protein 3 OS=Homo sapiens GN=SHANK3 PE=1 SV=2 SHAN3_HUMAN 186181,4844 9,13
SH3 and PX domain-containing protein 2B OS=Homo sapiens GN=SH3PXD2B PE=1 SV=3 SPD2B_HUMAN 101516,1094 8,82
SH3 domain-binding protein 2 OS=Homo sapiens GN=SH3BP2 PE=1 SV=2 3BP2_HUMAN 62204,1289 7,67
SLIT-ROBO Rho GTPase-activating protein 1 OS=Homo sapiens GN=SRGAP1 PE=1 SV=1 SRGP1_HUMAN 124186,3203 6,36
Spermatogenesis-associated protein 5-like protein 1 OS=Homo sapiens GN=SPATA5L1 PE=2 SV=1 SPA5L_HUMAN 80631,9375 8,29
Splicing factor 3B subunit 4 OS=Homo sapiens GN=SF3B4 PE=1 SV=1 SF3B4_HUMAN 44357,1602 8,54
Splicing factor, arginine/serine-rich 15 OS=Homo sapiens GN=SFRS15 PE=1 SV=3 SFR15_HUMAN 125790,4063 9,58
Splicing factor, proline- and glutamine-rich OS=Homo sapiens GN=SFPQ PE=1 SV=2 SFPQ_HUMAN 76101,7266 9,45
Statherin OS=Homo sapiens GN=STATH PE=1 SV=2 STAT_HUMAN 7299,6499 7,98
Stress-induced-phosphoprotein 1 OS=Homo sapiens GN=STIP1 PE=1 SV=1 STIP1_HUMAN 62599,4648 6,40
Submaxillary gland androgen-regulated protein 3B OS=Homo sapiens GN=SMR3B PE=1 SV=2 SMR3B_HUMAN 8182,2598 9,63
Synapsin-1 OS=Homo sapiens GN=SYN1 PE=1 SV=3 SYN1_HUMAN 74065,7188 9,84
T-box transcription factor TBX1 OS=Homo sapiens GN=TBX1 PE=1 SV=1 TBX1_HUMAN 43105,3398 8,37
Titin OS=Homo sapiens GN=TTN PE=1 SV=2 TITIN_HUMAN 3813809,5000 6,01
Transcription factor 20 OS=Homo sapiens GN=TCF20 PE=1 SV=3 TCF20_HUMAN 211639,0156 9,16
Transcription initiation factor TFIID subunit 6 OS=Homo sapiens GN=TAF6 PE=1 SV=1 TAF6_HUMAN 72623,0547 8,83
Transcriptional adapter 3-like OS=Homo sapiens GN=TADA3L PE=1 SV=1 TAD3L_HUMAN 48872,2617 5,90
Transcriptional-regulating factor 1 OS=Homo sapiens GN=TRERF1 PE=1 SV=1 TREF1_HUMAN 132172,7500 6,26
Transforming acidic coiled-coil-containing protein 3 OS=Homo sapiens GN=TACC3 PE=1 SV=1 TACC3_HUMAN 90303,7500 4,97

137
Tyrosine-protein kinase SgK223 OS=Homo sapiens GN=SGK223 PE=1 SV=2 SG223_HUMAN 149593,1094 6,76
Uncharacterized protein C12orf34 OS=Homo sapiens GN=C12orf34 PE=2 SV=1 CL034_HUMAN 46762,0469 9,20
Uncharacterized protein C2orf78 OS=Homo sapiens GN=C2orf78 PE=2 SV=2 CB078_HUMAN 96939,7656 9,11
Uncharacterized protein C4orf40 OS=Homo sapiens GN=C4orf40 PE=1 SV=1 CD040_HUMAN 22705,5391 4,82
Uncharacterized protein C6orf132 OS=Homo sapiens GN=C6orf132 PE=2 SV=3 CF132_HUMAN 124016,3203 9,46
Uncharacterized protein C9orf40 OS=Homo sapiens GN=C9orf40 PE=1 SV=1 CI040_HUMAN 21050,3789 4,89
Uncharacterized protein KIAA1522 OS=Homo sapiens GN=KIAA1522 PE=1 SV=2 K1522_HUMAN 107030,1094 9,75
Utrophin OS=Homo sapiens GN=UTRN PE=1 SV=2 UTRO_HUMAN 394219,3438 5,20
Voltage-dependent T-type calcium channel subunit alpha-1I OS=Homo sapiens GN=CACNA1I PE=1 SV=1 CAC1I_HUMAN 244942,8281 6,09
WAS/WASL-interacting protein family member 2 OS=Homo sapiens GN=WIPF2 PE=1 SV=1 WIPF2_HUMAN 46260,1719 10,93
WAS/WASL-interacting protein family member 3 OS=Homo sapiens GN=WIPF3 PE=2 SV=3 WIPF3_HUMAN 49317,9492 10,01
WD repeat-containing protein 33 OS=Homo sapiens GN=WDR33 PE=1 SV=2 WDR33_HUMAN 145799,2031 9,24
Wiskott-Aldrich syndrome protein family member 2 OS=Homo sapiens GN=WASF2 PE=1 SV=3 WASF2_HUMAN 54250,5391 5,38
Wiskott-Aldrich syndrome protein family member 3 OS=Homo sapiens GN=WASF3 PE=2 SV=2 WASF3_HUMAN 55258,7734 6,00
Wiskott-Aldrich syndrome protein OS=Homo sapiens GN=WAS PE=1 SV=4 WASP_HUMAN 52879,8594 6,18
WW domain-binding protein 11 OS=Homo sapiens GN=WBP11 PE=1 SV=1 WBP11_HUMAN 69953,9219 8,28
Xin actin-binding repeat-containing protein 1 OS=Homo sapiens GN=XIRP1 PE=1 SV=1 XIRP1_HUMAN 198439,0000 5,78
YLP motif-containing protein 1 OS=Homo sapiens GN=YLPM1 PE=1 SV=3 YLPM1_HUMAN 219847,5625 6,14
Zinc finger and BTB domain-containing protein 20 OS=Homo sapiens GN=ZBTB20 PE=2 SV=3 ZBT20_HUMAN 81032,3906 6,03
Zinc finger CCHC domain-containing protein 2 OS=Homo sapiens GN=ZCCHC2 PE=1 SV=6 ZCHC2_HUMAN 125857,8516 6,55
Zinc finger homeobox protein 2 OS=Homo sapiens GN=ZFHX2 PE=2 SV=2 ZFHX2_HUMAN 152005,8125 6,00
Zinc finger homeobox protein 3 OS=Homo sapiens GN=ZFHX3 PE=1 SV=2 ZFHX3_HUMAN 404165,4688 5,82
Zinc finger MIZ domain-containing protein 1 OS=Homo sapiens GN=ZMIZ1 PE=1 SV=3 ZMIZ1_HUMAN 115408,8828 7,09
Zinc finger protein 341 OS=Homo sapiens GN=ZNF341 PE=2 SV=2 ZN341_HUMAN 92668,7500 9,11
Zinc finger protein 469 OS=Homo sapiens GN=ZNF469 PE=1 SV=3 ZN469_HUMAN 409949,0938 7,88
Zinc finger protein 827 OS=Homo sapiens GN=ZNF827 PE=2 SV=1 ZN827_HUMAN 119089,9844 6,43
Zinc finger protein Eos OS=Homo sapiens GN=IKZF4 PE=1 SV=2 IKZF4_HUMAN 64065,2813 6,38
Zinc finger protein ZIC 5 OS=Homo sapiens GN=ZIC5 PE=1 SV=1 ZIC5_HUMAN 65807,8906 8,86

138
Supplemental Table 2: List of most frequent identified peptides.
Protein Name Peptide Sequence Individuals
(n=10)
Salivary acidic proline-rich phosphoprotein ½
GPPPPPPGKPQGPPPQGGRPQ 10
Salivary acidic proline-rich phosphoprotein ½
GPPQQGGHPPPPQGRPQ 10
Salivary acidic proline-rich phosphoprotein ½
GPPQQGGHPRPP 10
Submaxillary gland androgen-regulated protein 3B
FVPPPPPPPYGPGRIPPPPPAPY 10
Submaxillary gland androgen-regulated protein 3B
GPGRIPPPPPAPY 10
Submaxillary gland androgen-regulated protein 3B
GPGRIPPPPPAPYGPGIFPPPPPQP 10
Submaxillary gland androgen-regulated protein 3B
GPYPPGPLAPPQPF 10
Submaxillary gland androgen-regulated protein 3B
GPYPPGPLAPPQPFGPG 10
Submaxillary gland androgen-regulated protein 3B
RGPYPPGPLAPPQPF 10
Submaxillary gland androgen-regulated protein 3B
RIPPPPPAPY 8
Basic salivary proline-rich protein 1 GPPPPAGGNPQQPQAPPAGQPQGPPRPPQ 8
Basic salivary proline-rich protein 3 GPPPPPQGGRPH 8
Salivary acidic proline-rich phosphoprotein ½
GRPQGPPQQGGHQQ 8
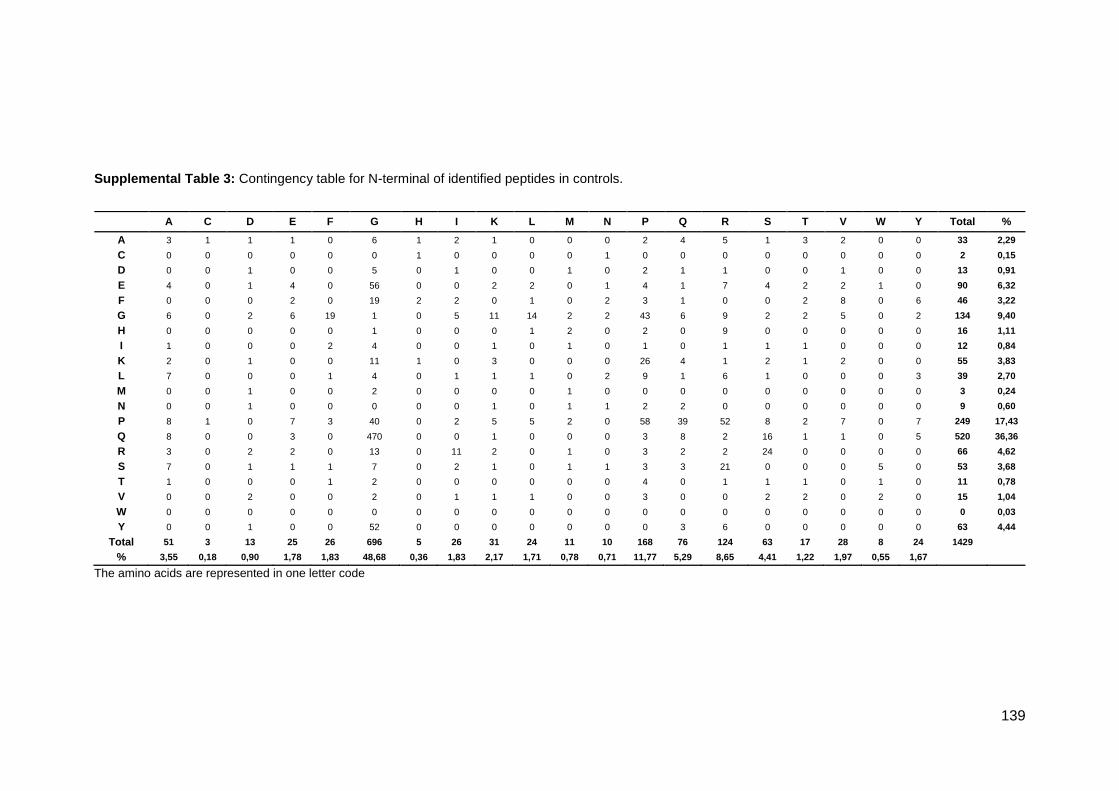
139
Supplemental Table 3: Contingency table for N-terminal of identified peptides in controls.
The amino acids are represented in one letter code
A C D E F G H I K L M N P Q R S T V W Y Total %
A 3 1 1 1 0 6 1 2 1 0 0 0 2 4 5 1 3 2 0 0 33 2,29
C 0 0 0 0 0 0 1 0 0 0 0 1 0 0 0 0 0 0 0 0 2 0,15
D 0 0 1 0 0 5 0 1 0 0 1 0 2 1 1 0 0 1 0 0 13 0,91
E 4 0 1 4 0 56 0 0 2 2 0 1 4 1 7 4 2 2 1 0 90 6,32
F 0 0 0 2 0 19 2 2 0 1 0 2 3 1 0 0 2 8 0 6 46 3,22
G 6 0 2 6 19 1 0 5 11 14 2 2 43 6 9 2 2 5 0 2 134 9,40
H 0 0 0 0 0 1 0 0 0 1 2 0 2 0 9 0 0 0 0 0 16 1,11
I 1 0 0 0 2 4 0 0 1 0 1 0 1 0 1 1 1 0 0 0 12 0,84
K 2 0 1 0 0 11 1 0 3 0 0 0 26 4 1 2 1 2 0 0 55 3,83
L 7 0 0 0 1 4 0 1 1 1 0 2 9 1 6 1 0 0 0 3 39 2,70
M 0 0 1 0 0 2 0 0 0 0 1 0 0 0 0 0 0 0 0 0 3 0,24
N 0 0 1 0 0 0 0 0 1 0 1 1 2 2 0 0 0 0 0 0 9 0,60
P 8 1 0 7 3 40 0 2 5 5 2 0 58 39 52 8 2 7 0 7 249 17,43
Q 8 0 0 3 0 470 0 0 1 0 0 0 3 8 2 16 1 1 0 5 520 36,36
R 3 0 2 2 0 13 0 11 2 0 1 0 3 2 2 24 0 0 0 0 66 4,62
S 7 0 1 1 1 7 0 2 1 0 1 1 3 3 21 0 0 0 5 0 53 3,68
T 1 0 0 0 1 2 0 0 0 0 0 0 4 0 1 1 1 0 1 0 11 0,78
V 0 0 2 0 0 2 0 1 1 1 0 0 3 0 0 2 2 0 2 0 15 1,04
W 0 0 0 0 0 0 0 0 0 0 0 0 0 0 0 0 0 0 0 0 0 0,03
Y 0 0 1 0 0 52 0 0 0 0 0 0 0 3 6 0 0 0 0 0 63 4,44
Total 51 3 13 25 26 696 5 26 31 24 11 10 168 76 124 63 17 28 8 24 1429
% 3,55 0,18 0,90 1,78 1,83 48,68 0,36 1,83 2,17 1,71 0,78 0,71 11,77 5,29 8,65 4,41 1,22 1,97 0,55 1,67
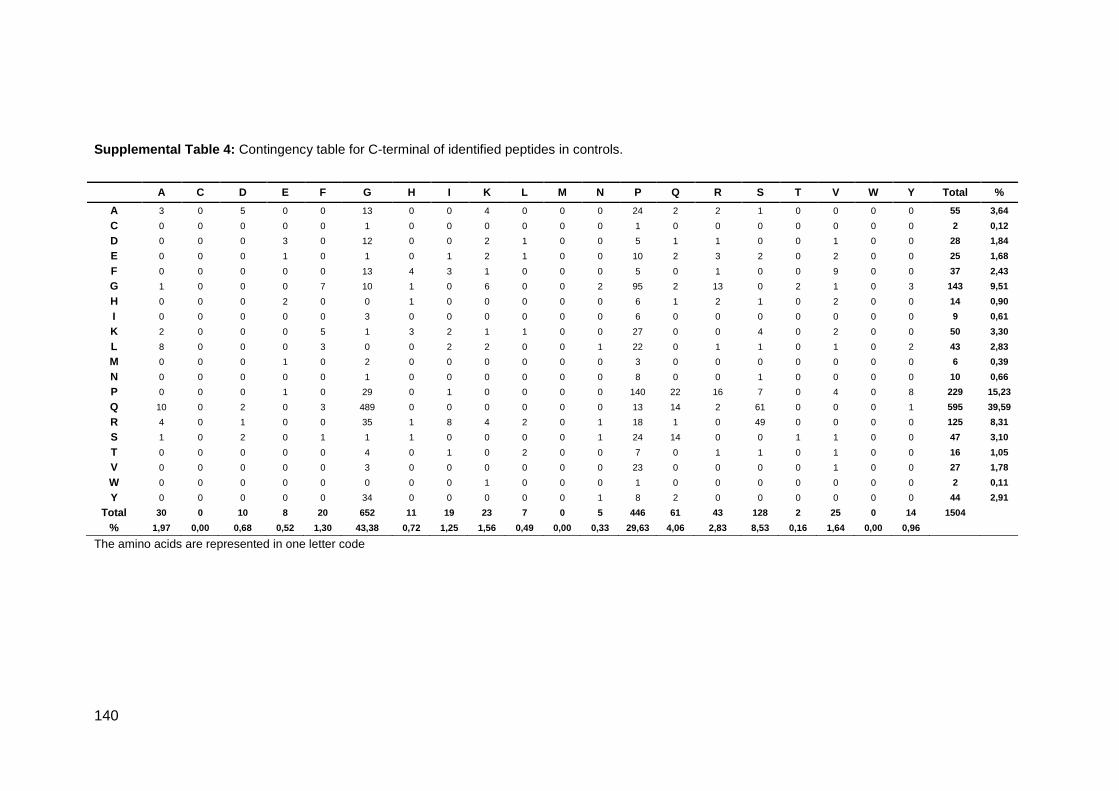
140
Supplemental Table 4: Contingency table for C-terminal of identified peptides in controls.
The amino acids are represented in one letter code
A C D E F G H I K L M N P Q R S T V W Y Total %
A 3 0 5 0 0 13 0 0 4 0 0 0 24 2 2 1 0 0 0 0 55 3,64
C 0 0 0 0 0 1 0 0 0 0 0 0 1 0 0 0 0 0 0 0 2 0,12
D 0 0 0 3 0 12 0 0 2 1 0 0 5 1 1 0 0 1 0 0 28 1,84
E 0 0 0 1 0 1 0 1 2 1 0 0 10 2 3 2 0 2 0 0 25 1,68
F 0 0 0 0 0 13 4 3 1 0 0 0 5 0 1 0 0 9 0 0 37 2,43
G 1 0 0 0 7 10 1 0 6 0 0 2 95 2 13 0 2 1 0 3 143 9,51
H 0 0 0 2 0 0 1 0 0 0 0 0 6 1 2 1 0 2 0 0 14 0,90
I 0 0 0 0 0 3 0 0 0 0 0 0 6 0 0 0 0 0 0 0 9 0,61
K 2 0 0 0 5 1 3 2 1 1 0 0 27 0 0 4 0 2 0 0 50 3,30
L 8 0 0 0 3 0 0 2 2 0 0 1 22 0 1 1 0 1 0 2 43 2,83
M 0 0 0 1 0 2 0 0 0 0 0 0 3 0 0 0 0 0 0 0 6 0,39
N 0 0 0 0 0 1 0 0 0 0 0 0 8 0 0 1 0 0 0 0 10 0,66
P 0 0 0 1 0 29 0 1 0 0 0 0 140 22 16 7 0 4 0 8 229 15,23
Q 10 0 2 0 3 489 0 0 0 0 0 0 13 14 2 61 0 0 0 1 595 39,59
R 4 0 1 0 0 35 1 8 4 2 0 1 18 1 0 49 0 0 0 0 125 8,31
S 1 0 2 0 1 1 1 0 0 0 0 1 24 14 0 0 1 1 0 0 47 3,10
T 0 0 0 0 0 4 0 1 0 2 0 0 7 0 1 1 0 1 0 0 16 1,05
V 0 0 0 0 0 3 0 0 0 0 0 0 23 0 0 0 0 1 0 0 27 1,78
W 0 0 0 0 0 0 0 0 1 0 0 0 1 0 0 0 0 0 0 0 2 0,11
Y 0 0 0 0 0 34 0 0 0 0 0 1 8 2 0 0 0 0 0 0 44 2,91
Total 30 0 10 8 20 652 11 19 23 7 0 5 446 61 43 128 2 25 0 14 1504
% 1,97 0,00 0,68 0,52 1,30 43,38 0,72 1,25 1,56 0,49 0,00 0,33 29,63 4,06 2,83 8,53 0,16 1,64 0,00 0,96
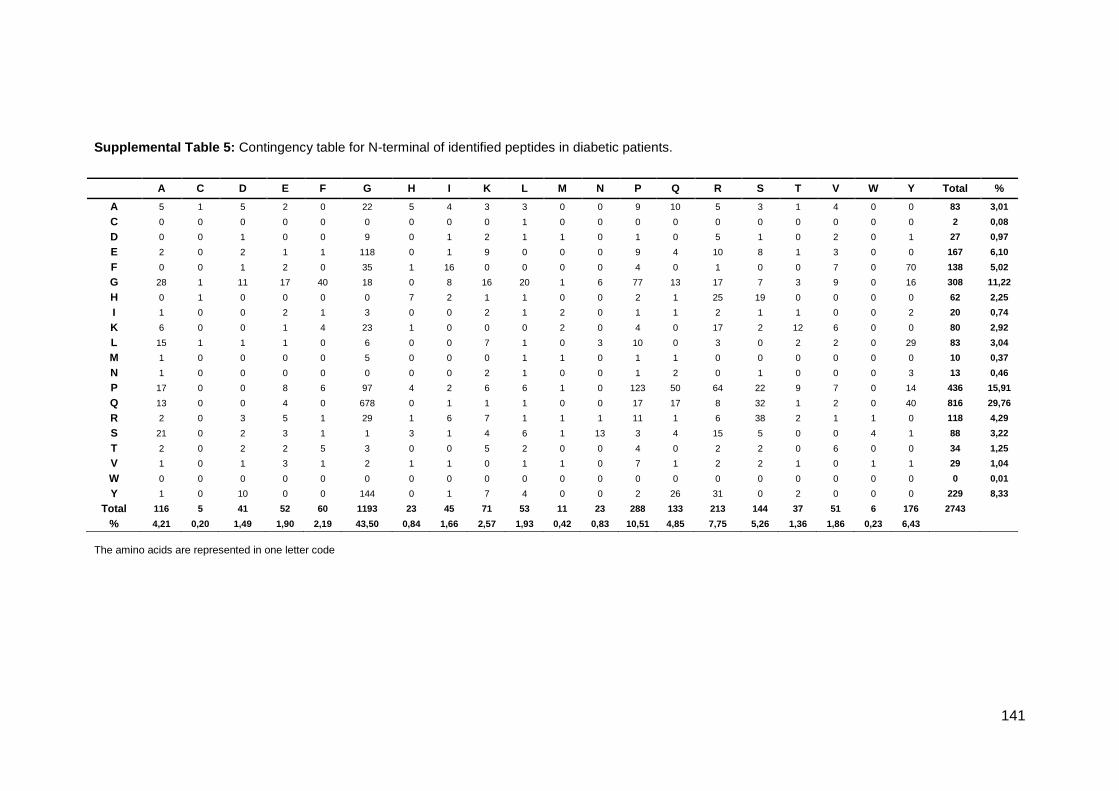
141
Supplemental Table 5: Contingency table for N-terminal of identified peptides in diabetic patients.
The amino acids are represented in one letter code
A C D E F G H I K L M N P Q R S T V W Y Total %
A 5 1 5 2 0 22 5 4 3 3 0 0 9 10 5 3 1 4 0 0 83 3,01
C 0 0 0 0 0 0 0 0 0 1 0 0 0 0 0 0 0 0 0 0 2 0,08
D 0 0 1 0 0 9 0 1 2 1 1 0 1 0 5 1 0 2 0 1 27 0,97
E 2 0 2 1 1 118 0 1 9 0 0 0 9 4 10 8 1 3 0 0 167 6,10
F 0 0 1 2 0 35 1 16 0 0 0 0 4 0 1 0 0 7 0 70 138 5,02
G 28 1 11 17 40 18 0 8 16 20 1 6 77 13 17 7 3 9 0 16 308 11,22
H 0 1 0 0 0 0 7 2 1 1 0 0 2 1 25 19 0 0 0 0 62 2,25
I 1 0 0 2 1 3 0 0 2 1 2 0 1 1 2 1 1 0 0 2 20 0,74
K 6 0 0 1 4 23 1 0 0 0 2 0 4 0 17 2 12 6 0 0 80 2,92
L 15 1 1 1 0 6 0 0 7 1 0 3 10 0 3 0 2 2 0 29 83 3,04
M 1 0 0 0 0 5 0 0 0 1 1 0 1 1 0 0 0 0 0 0 10 0,37
N 1 0 0 0 0 0 0 0 2 1 0 0 1 2 0 1 0 0 0 3 13 0,46
P 17 0 0 8 6 97 4 2 6 6 1 0 123 50 64 22 9 7 0 14 436 15,91
Q 13 0 0 4 0 678 0 1 1 1 0 0 17 17 8 32 1 2 0 40 816 29,76
R 2 0 3 5 1 29 1 6 7 1 1 1 11 1 6 38 2 1 1 0 118 4,29
S 21 0 2 3 1 1 3 1 4 6 1 13 3 4 15 5 0 0 4 1 88 3,22
T 2 0 2 2 5 3 0 0 5 2 0 0 4 0 2 2 0 6 0 0 34 1,25
V 1 0 1 3 1 2 1 1 0 1 1 0 7 1 2 2 1 0 1 1 29 1,04
W 0 0 0 0 0 0 0 0 0 0 0 0 0 0 0 0 0 0 0 0 0 0,01
Y 1 0 10 0 0 144 0 1 7 4 0 0 2 26 31 0 2 0 0 0 229 8,33
Total 116 5 41 52 60 1193 23 45 71 53 11 23 288 133 213 144 37 51 6 176 2743
% 4,21 0,20 1,49 1,90 2,19 43,50 0,84 1,66 2,57 1,93 0,42 0,83 10,51 4,85 7,75 5,26 1,36 1,86 0,23 6,43

142
Supplemental Table 6: Contingency table for C-terminal of identified peptides in diabetic patients.
The amino acids are represented in one letter code
A C D E F G H I K L M N P Q R S T V W Y Total %
A 7 0 15 0 0 22 2 0 10 0 0 0 45 0 0 2 0 1 0 0 105 3,54
C 0 0 0 0 0 0 0 0 1 0 0 0 1 0 0 0 0 0 0 0 2 0,08
D 1 0 0 4 0 10 0 13 0 0 0 0 3 0 3 7 1 3 0 0 45 1,51
E 0 0 0 6 0 1 1 0 16 1 0 4 41 4 4 0 0 1 2 0 81 2,73
F 0 0 0 2 0 36 32 7 0 6 0 0 21 0 0 0 0 4 0 7 116 3,93
G 2 0 1 0 11 15 2 1 8 3 0 1 165 2 26 0 1 2 0 10 250 8,45
H 0 0 0 18 5 0 24 0 0 0 0 0 10 0 10 22 0 4 0 1 94 3,17
I 0 0 4 0 0 6 0 0 0 1 0 1 10 1 0 0 0 0 0 0 25 0,85
K 2 0 0 0 39 2 40 0 1 0 0 3 46 0 6 12 0 4 0 0 156 5,26
L 12 0 0 0 0 1 3 1 1 2 0 2 59 0 1 2 0 1 0 20 106 3,59
M 0 0 1 0 0 1 0 0 2 0 0 0 0 0 0 0 1 0 0 0 6 0,19
N 0 0 0 0 0 0 0 0 1 0 0 1 7 2 0 0 0 2 0 0 13 0,43
P 5 1 0 1 0 57 3 1 3 3 0 1 281 33 28 11 0 10 0 15 452 15,28
Q 11 0 4 1 7 728 0 0 1 1 0 0 36 14 4 103 0 1 0 7 917 30,97
R 3 0 1 2 0 66 5 39 34 1 0 0 32 0 14 89 0 0 0 0 287 9,68
S 6 0 8 0 0 12 16 0 0 0 0 1 41 30 1 4 1 2 0 0 122 4,12
T 0 0 0 0 0 7 0 0 2 2 0 0 19 1 0 0 0 3 0 0 35 1,18
V 1 0 0 0 0 2 1 1 0 2 0 1 37 1 0 0 0 0 0 0 48 1,63
W 0 0 0 0 0 0 0 0 0 0 0 0 1 0 0 0 0 0 0 0 1 0,04
Y 0 0 0 0 0 82 0 0 1 0 0 0 6 11 0 0 0 0 0 0 100 3,38
Total 50 1 35 34 63 1048 129 65 82 23 0 16 860 100 97 252 4 40 2 60 2961
% 1,68 0,02 1,20 1,14 2,13 35,40 4,36 2,19 2,78 0,77 0,01 0,53 29,05 3,36 3,27 8,52 0,14 1,36 0,07 2,03
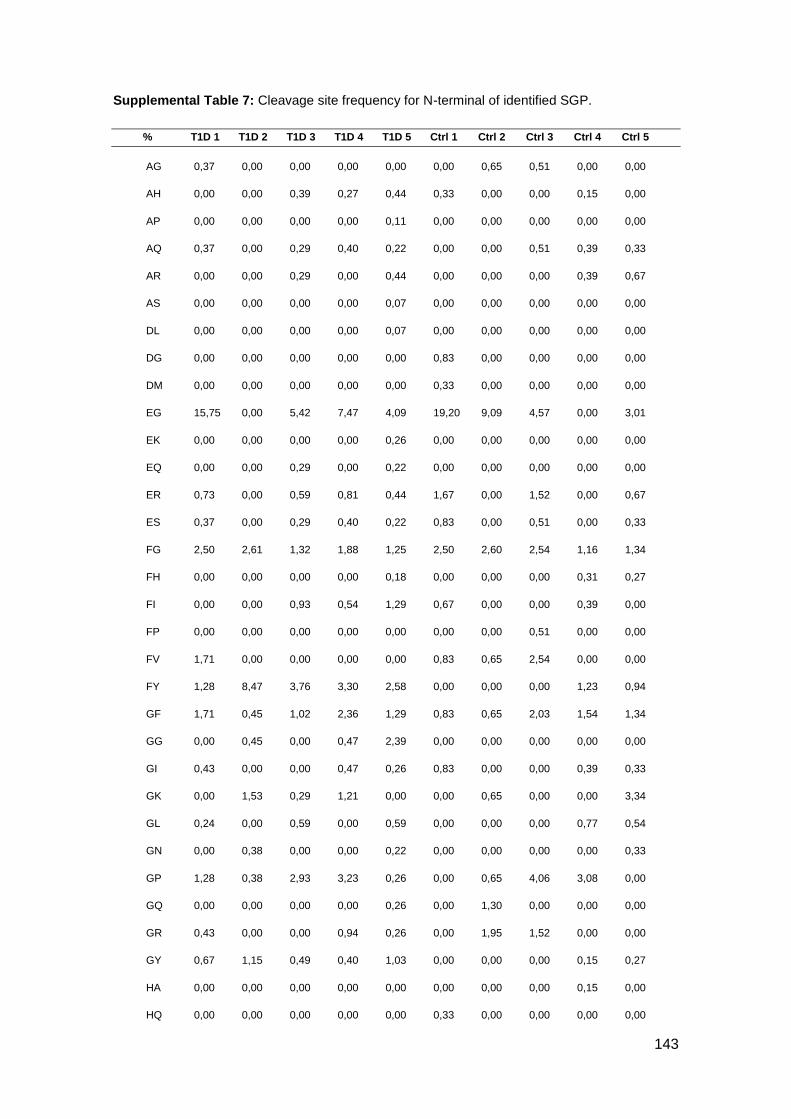
143
Supplemental Table 7: Cleavage site frequency for N-terminal of identified SGP.
% T1D 1 T1D 2 T1D 3 T1D 4 T1D 5 Ctrl 1 Ctrl 2 Ctrl 3 Ctrl 4 Ctrl 5
AG 0,37 0,00 0,00 0,00 0,00 0,00 0,65 0,51 0,00 0,00
AH 0,00 0,00 0,39 0,27 0,44 0,33 0,00 0,00 0,15 0,00
AP 0,00 0,00 0,00 0,00 0,11 0,00 0,00 0,00 0,00 0,00
AQ 0,37 0,00 0,29 0,40 0,22 0,00 0,00 0,51 0,39 0,33
AR 0,00 0,00 0,29 0,00 0,44 0,00 0,00 0,00 0,39 0,67
AS 0,00 0,00 0,00 0,00 0,07 0,00 0,00 0,00 0,00 0,00
DL 0,00 0,00 0,00 0,00 0,07 0,00 0,00 0,00 0,00 0,00
DG 0,00 0,00 0,00 0,00 0,00 0,83 0,00 0,00 0,00 0,00
DM 0,00 0,00 0,00 0,00 0,00 0,33 0,00 0,00 0,00 0,00
EG 15,75 0,00 5,42 7,47 4,09 19,20 9,09 4,57 0,00 3,01
EK 0,00 0,00 0,00 0,00 0,26 0,00 0,00 0,00 0,00 0,00
EQ 0,00 0,00 0,29 0,00 0,22 0,00 0,00 0,00 0,00 0,00
ER 0,73 0,00 0,59 0,81 0,44 1,67 0,00 1,52 0,00 0,67
ES 0,37 0,00 0,29 0,40 0,22 0,83 0,00 0,51 0,00 0,33
FG 2,50 2,61 1,32 1,88 1,25 2,50 2,60 2,54 1,16 1,34
FH 0,00 0,00 0,00 0,00 0,18 0,00 0,00 0,00 0,31 0,27
FI 0,00 0,00 0,93 0,54 1,29 0,67 0,00 0,00 0,39 0,00
FP 0,00 0,00 0,00 0,00 0,00 0,00 0,00 0,51 0,00 0,00
FV 1,71 0,00 0,00 0,00 0,00 0,83 0,65 2,54 0,00 0,00
FY 1,28 8,47 3,76 3,30 2,58 0,00 0,00 0,00 1,23 0,94
GF 1,71 0,45 1,02 2,36 1,29 0,83 0,65 2,03 1,54 1,34
GG 0,00 0,45 0,00 0,47 2,39 0,00 0,00 0,00 0,00 0,00
GI 0,43 0,00 0,00 0,47 0,26 0,83 0,00 0,00 0,39 0,33
GK 0,00 1,53 0,29 1,21 0,00 0,00 0,65 0,00 0,00 3,34
GL 0,24 0,00 0,59 0,00 0,59 0,00 0,00 0,00 0,77 0,54
GN 0,00 0,38 0,00 0,00 0,22 0,00 0,00 0,00 0,00 0,33
GP 1,28 0,38 2,93 3,23 0,26 0,00 0,65 4,06 3,08 0,00
GQ 0,00 0,00 0,00 0,00 0,26 0,00 1,30 0,00 0,00 0,00
GR 0,43 0,00 0,00 0,94 0,26 0,00 1,95 1,52 0,00 0,00
GY 0,67 1,15 0,49 0,40 1,03 0,00 0,00 0,00 0,15 0,27
HA 0,00 0,00 0,00 0,00 0,00 0,00 0,00 0,00 0,15 0,00
HQ 0,00 0,00 0,00 0,00 0,00 0,33 0,00 0,00 0,00 0,00

144
HH 0,24 0,00 0,00 0,81 0,63 0,00 0,00 0,00 0,00 0,00
HP 0,00 0,00 0,00 0,00 0,26 0,00 0,00 0,00 0,00 0,00
HR 2,56 0,38 0,93 1,75 1,25 2,50 0,65 1,02 0,00 0,67
HS 1,47 0,00 0,59 0,81 1,51 0,00 0,00 0,00 0,00 0,00
KA 0,00 0,00 0,10 0,00 0,15 0,00 0,00 0,00 0,46 0,13
KC 0,00 0,00 0,00 0,00 0,00 0,00 0,00 0,00 0,15 0,00
KE 0,00 0,00 0,00 0,00 0,00 0,00 0,00 0,00 0,15 0,00
KF 1,04 0,00 0,24 0,00 0,00 0,00 0,00 0,00 0,15 0,00
KH 0,00 0,00 0,24 0,00 0,00 0,00 0,00 0,00 0,31 0,13
KL 0,00 0,00 0,00 0,00 0,11 0,00 0,00 0,00 0,00 0,00
KP 0,00 0,00 0,29 2,83 1,40 0,83 4,55 0,00 1,93 2,01
KR 0,31 0,00 0,73 0,67 0,74 0,00 0,00 0,00 0,31 0,13
KS 0,24 0,00 0,20 0,00 0,00 0,00 0,65 0,00 0,15 0,00
LA 1,10 0,00 0,73 1,01 0,70 1,17 0,00 0,00 0,54 0,47
LG 0,00 0,00 0,10 0,00 0,52 0,00 0,00 0,00 0,31 0,00
LP 0,43 0,00 0,00 0,00 0,00 0,00 0,00 0,00 0,00 0,00
LY 0,37 3,37 1,46 1,21 1,29 0,00 0,00 0,00 0,93 0,27
MP 0,00 0,00 0,00 0,00 0,11 0,00 0,00 0,00 0,00 0,00
NK 0,00 0,45 0,00 0,00 0,00 0,00 0,65 0,00 0,00 0,00
NN 0,00 0,00 0,00 0,00 0,00 0,00 0,65 0,00 0,00 0,00
NP 0,00 0,00 0,00 0,00 0,00 0,83 0,00 0,00 0,00 0,00
NQ 0,00 0,76 0,00 0,00 0,00 0,00 0,00 0,00 0,00 0,67
NY 0,00 0,89 0,00 0,00 0,00 0,00 0,00 0,00 0,00 0,00
PA 0,43 0,19 0,15 1,01 0,11 0,83 0,65 1,02 0,00 0,33
PF 0,43 0,00 0,68 0,00 0,26 0,00 0,00 0,00 0,46 0,27
PG 0,00 2,55 0,59 0,47 1,29 0,00 0,00 0,00 0,39 0,47
PH 0,00 0,00 0,59 0,00 0,00 0,33 0,00 0,00 0,00 0,00
PI 0,18 0,00 0,00 0,00 0,00 0,00 0,00 0,00 0,00 0,00
PL 0,43 0,00 0,00 0,00 0,00 0,00 0,00 0,51 0,31 0,60
PM 0,00 0,00 0,00 0,00 0,11 0,00 0,00 0,00 0,00 0,00
PP 1,77 13,30 0,29 8,21 1,51 0,83 3,90 4,06 3,62 5,69
PQ 0,79 1,72 1,56 5,45 2,58 1,67 5,84 3,55 1,54 4,68
PR 3,36 3,06 2,78 3,90 2,54 4,17 2,60 6,60 5,94 3,34
PS 0,00 0,00 0,59 0,00 0,33 0,00 0,00 0,00 1,16 1,00

145
PY 0,85 0,76 0,59 0,47 0,48 0,00 0,65 1,02 0,85 0,74
QA 0,73 0,00 2,34 0,00 0,00 0,00 1,30 1,02 1,54 0,00
QE 0,00 0,00 0,88 0,00 0,15 0,00 0,00 1,52 0,00 0,00
QG 34,98 19,03 42,75 26,85 42,99 37,56 44,16 42,13 49,34 47,83
QI 0,00 0,00 0,00 0,27 0,00 0,00 0,00 0,00 0,00 0,00
QL 0,18 0,00 0,00 0,00 0,00 0,00 0,00 0,00 0,00 0,00
QP 0,00 0,00 0,00 0,00 0,52 0,00 1,30 0,00 0,39 0,00
QQ 2,93 0,00 0,00 0,87 0,55 0,83 0,00 3,05 0,39 0,13
QR 0,43 0,00 0,00 0,87 0,74 0,00 0,65 0,00 0,39 0,00
QS 2,50 0,76 0,93 3,03 1,47 3,34 1,30 1,52 1,16 1,34
QY 0,73 4,20 0,59 2,02 2,65 0,00 0,00 0,00 1,39 0,54
RA 0,00 0,00 0,10 0,00 0,07 0,00 0,00 0,00 0,85 0,13
RD 0,00 0,00 0,10 0,00 0,07 0,00 0,00 0,00 0,31 0,13
RE 0,00 0,00 0,68 0,00 0,00 0,00 0,00 0,00 0,15 0,27
RG 0,00 0,00 0,83 0,47 0,26 0,83 0,65 0,51 0,69 0,74
RH 0,00 0,00 0,20 0,00 0,00 0,00 0,00 0,00 0,00 0,00
RI 1,28 0,00 0,00 0,67 0,00 0,00 3,25 2,54 0,08 0,33
RK 0,24 0,00 1,17 0,00 0,18 0,00 0,00 0,00 0,31 0,27
RP 0,00 0,76 0,00 0,00 0,00 0,83 0,00 0,00 0,00 0,00
RQ 0,00 0,00 0,00 0,00 0,00 0,00 0,00 0,51 0,00 0,00
RR 0,00 0,00 0,68 0,00 0,00 0,00 0,00 0,00 0,39 0,27
RS 0,00 0,00 5,08 0,81 2,21 3,34 1,30 0,51 2,31 3,41
SA 2,99 0,00 0,34 0,94 0,52 0,83 0,65 1,52 0,39 0,00
SE 0,00 0,00 0,00 0,00 0,11 0,00 0,00 0,00 0,00 0,00
SF 0,00 0,00 0,00 0,20 0,00 0,00 0,00 0,00 0,00 0,00
SG 0,00 0,00 0,00 0,00 0,00 0,00 0,00 0,00 0,15 0,00
SH 0,00 0,00 0,00 0,00 0,63 0,00 0,00 0,00 0,00 0,00
SK 0,00 0,00 0,59 0,00 0,00 0,00 0,00 0,00 0,00 0,33
SN 0,00 4,01 0,00 0,00 0,00 0,00 0,00 0,00 0,00 0,00
SP 0,00 0,00 0,00 0,00 0,00 0,83 0,00 0,00 0,39 0,00
SQ 0,00 0,76 0,29 0,00 0,00 0,00 0,00 0,51 0,39 0,33
SR 1,47 0,00 1,46 0,81 0,22 1,67 1,30 1,02 1,54 3,68
SS 0,12 0,38 0,00 0,00 0,07 0,00 0,00 0,00 0,00 0,00
SV 0,12 0,00 0,00 0,00 0,00 0,00 0,00 0,00 0,00 0,00

146
TF 0,00 0,76 0,00 0,40 0,22 0,00 0,00 0,00 0,31 0,00
TL 0,00 0,00 0,20 0,00 0,00 0,00 0,00 0,00 0,00 0,00
TP 0,00 0,00 0,00 0,20 0,00 0,00 0,00 0,00 0,00 0,00
VF 0,00 0,00 0,00 0,20 0,00 0,00 0,00 0,00 0,00 0,00
VS 0,12 0,00 0,00 0,00 0,00 0,00 0,00 0,00 0,00 0,00
YD 0,00 2,67 0,00 0,00 0,00 0,00 0,00 0,00 0,00 0,00
YG 5,07 20,31 6,05 3,70 5,04 7,51 5,19 5,08 5,55 3,61
YK 0,00 0,00 0,49 0,34 0,70 0,00 0,00 0,00 0,00 0,00
YL 0,61 0,45 0,00 0,20 0,00 0,00 0,00 0,00 0,00 0,00
YP 0,00 0,00 0,00 0,20 0,00 0,00 0,00 0,00 0,00 0,00
YQ 0,73 3,06 0,00 2,02 1,55 0,00 0,00 0,00 0,46 0,27
YR 0,92 0,00 1,95 2,15 2,36 0,00 0,00 0,00 1,23 1,07
YT 0,00 0,00 0,00 0,00 0,44 0,00 0,00 0,00 0,15 0,00

147
Supplemental Table 8: Cleavage site frequency for C-terminal of identified SGP.
% T1D 1 T1D 2 T1D 3 T1D 4 T1D 5 Ctrl 1 Ctrl 2 Ctrl 3 Ctrl 4 Ctrl 5
AD 0,29 0,00 1,18 1,03 0,89 0,00 0,00 0,00 0,85 0,74
AG 0,35 0,00 0,26 0,36 0,20 0,00 0,00 0,99 1,07 0,93
AK 0,29 0,00 1,09 0,00 0,49 0,00 0,00 0,00 0,85 0,37
AP 0,81 0,32 0,00 0,97 0,46 0,00 0,00 0,99 1,07 0,62
AS 0,00 0,00 0,09 0,00 0,07 0,00 0,00 0,00 0,28 0,12
DE 0,81 0,00 0,00 0,00 0,00 0,00 0,62 0,99 0,00 0,00
DG 0,40 0,00 0,61 0,85 0,00 0,75 0,00 1,49 0,36 0,62
DR 0,17 0,00 0,00 0,00 0,10 0,00 0,00 0,00 0,00 0,00
DS 0,00 0,00 0,96 0,30 0,33 0,00 0,00 0,00 0,00 0,00
EE 0,81 0,00 0,00 0,00 0,00 0,00 0,62 0,00 0,00 0,00
EG 0,00 0,00 0,00 0,00 0,00 0,00 0,00 0,50 0,00 0,00
EK 0,00 3,03 0,00 0,00 0,63 0,00 0,00 0,00 0,00 0,00
EL 0,00 0,00 0,00 0,00 0,13 0,00 0,00 0,00 0,00 0,00
EQ 0,00 0,32 0,00 0,00 0,43 0,00 0,00 0,50 0,00 0,00
ER 0,81 0,00 0,00 0,00 0,00 0,75 0,00 0,99 0,00 0,00
ES 0,00 0,00 0,00 0,00 0,00 0,00 0,00 0,00 0,36 0,31
FE 0,00 0,00 0,17 0,24 0,13 0,00 0,00 0,00 0,00 0,00
FG 1,56 2,16 1,14 1,93 1,51 1,50 1,85 0,99 1,14 0,74
FH 1,27 3,78 1,57 0,73 0,56 0,00 0,00 0,00 0,71 0,49
FI 0,81 0,00 0,00 0,00 0,69 0,00 0,00 0,50 0,36 0,31
FL 0,35 0,32 0,26 0,00 0,39 0,00 0,00 0,00 0,00 0,12
FP 0,00 0,38 0,31 0,85 0,23 0,00 0,00 0,00 0,00 0,00
FV 0,81 0,00 0,00 0,42 0,00 0,00 1,85 1,49 0,71 0,31
FY 0,40 0,76 0,00 0,42 0,23 0,00 0,00 0,00 0,14 0,00
GF 0,81 0,76 0,31 0,85 0,23 0,75 1,23 0,99 0,36 0,31
GG 0,81 0,00 0,00 0,85 1,51 1,50 0,62 0,00 2,13 0,00
GH 0,00 0,00 0,00 0,00 0,00 0,75 0,00 0,00 0,00 0,00
GK 0,81 0,00 0,00 0,00 0,46 0,00 0,00 0,00 1,07 0,00
GL 0,00 0,00 0,00 0,00 0,13 0,00 0,00 0,00 0,00 0,00
GN 0,00 0,00 0,26 0,00 0,00 0,00 0,00 0,00 0,00 0,00
GP 2,02 0,32 0,83 1,33 1,71 4,50 2,47 1,98 0,50 2,78

148
GR 1,04 1,95 0,79 0,85 0,36 0,75 1,23 1,98 0,99 0,62
GY 0,00 0,00 0,22 0,67 1,05 0,00 0,00 0,00 0,43 0,37
HE 0,29 2,27 0,83 0,73 0,39 0,00 0,00 0,00 0,43 0,12
HF 0,00 0,00 0,52 0,00 0,26 0,00 0,00 0,00 0,00 0,00
HH 0,40 3,03 1,14 0,42 0,86 0,00 0,00 0,00 0,14 0,12
HP 0,40 0,00 0,00 0,36 0,10 0,00 0,00 0,00 0,00 0,00
HR 0,40 1,89 0,00 0,00 0,23 0,00 0,62 0,50 0,00 0,00
HS 0,40 3,41 0,61 0,42 0,56 0,00 0,00 0,00 0,14 0,12
HY 0,00 0,00 0,00 0,00 0,13 0,00 0,00 0,00 0,00 0,00
ID 1,21 0,00 0,00 0,00 0,00 0,00 0,00 0,00 0,00 0,00
IG 0,00 0,65 0,26 0,00 0,20 0,00 0,00 0,00 0,14 0,25
IP 0,40 0,00 0,00 0,00 0,00 0,00 0,00 0,00 0,00 0,00
IQ 0,00 0,00 0,00 0,00 0,07 0,00 0,00 0,00 0,14 0,00
KA 0,00 0,00 0,17 0,00 0,13 0,00 0,00 0,00 0,57 0,25
KF 1,39 3,03 2,93 0,73 1,18 0,00 0,00 0,00 0,85 0,74
KH 0,69 6,43 1,27 1,03 0,56 0,00 0,00 0,00 0,57 0,49
KN 0,00 0,00 0,00 0,24 0,00 0,30 0,00 0,00 0,00 0,00
KP 0,40 1,68 1,31 4,35 0,59 1,50 6,79 0,50 0,00 1,23
KR 0,00 0,00 0,00 0,00 0,82 0,00 0,00 0,00 0,00 0,12
KS 0,46 0,00 1,05 0,73 0,53 2,70 0,00 0,00 0,28 0,00
LA 1,27 0,00 0,61 0,42 0,59 0,75 0,62 0,99 0,50 0,93
LF 0,00 0,00 0,00 0,00 0,00 0,00 0,00 0,00 1,21 0,00
LI 0,00 0,00 0,26 0,00 0,00 0,00 0,00 0,00 0,36 0,31
LN 0,23 0,00 0,00 0,00 0,13 0,30 0,00 0,00 0,00 0,00
LP 0,40 0,00 0,00 0,00 0,10 0,00 0,00 0,00 0,00 0,00
LS 0,23 0,00 0,00 0,00 0,20 0,00 0,00 0,00 0,00 0,00
LV 0,00 0,00 0,00 0,00 0,00 0,00 0,00 0,00 0,00 0,12
LY 0,35 0,97 0,26 1,09 1,78 0,00 0,00 0,00 0,71 0,12
ML 0,00 0,00 0,00 0,00 0,00 0,00 0,00 0,00 0,14 0,00
MT 0,00 0,00 0,00 0,00 0,16 0,00 0,00 0,00 0,00 0,00
NP 0,00 0,00 0,26 0,18 0,00 0,30 1,23 0,00 0,43 0,31
NQ 0,00 0,00 0,00 0,00 0,23 0,00 0,00 0,00 0,00 0,00
PE 0,00 0,00 0,00 0,00 0,00 0,00 0,00 0,00 0,14 0,00
PG 1,21 0,38 0,31 1,27 1,84 1,50 1,85 2,48 0,71 0,31

149
PH 0,17 0,00 0,00 0,00 0,23 0,00 0,00 0,00 0,00 0,00
PP 3,29 10,86 6,51 9,43 1,65 1,50 4,94 10,40 7,03 4,63
PQ 1,10 1,35 2,10 2,54 0,30 1,50 4,32 2,97 0,36 1,85
PR 1,21 0,76 0,92 1,27 1,38 1,50 2,47 1,98 0,71 0,62
PS 0,00 0,32 0,52 0,36 0,99 0,00 0,00 0,50 1,07 0,93
PV 0,69 0,00 0,00 0,36 0,20 0,00 0,00 0,00 0,28 0,25
PY 0,81 0,38 0,61 0,85 0,86 0,00 0,00 0,99 1,14 0,74
QA 0,69 0,00 0,52 0,73 0,39 1,50 1,23 0,99 0,71 0,62
QD 0,00 0,38 0,00 0,42 0,23 0,00 0,00 0,00 0,36 0,31
QE 0,00 0,00 0,00 0,00 0,07 0,00 0,00 0,00 0,00 0,00
QF 0,81 0,00 0,00 0,42 0,46 0,00 0,62 0,50 0,36 0,00
QG 33,53 19,78 43,92 27,75 38,60 36,04 45,06 42,57 44,74 47,04
QL 0,00 0,00 0,00 0,00 0,07 0,00 0,00 0,00 0,00 0,00
QP 0,35 0,32 0,52 0,36 0,99 0,00 0,00 0,00 0,00 2,78
QQ 1,62 0,38 0,31 0,85 0,39 2,25 1,85 2,97 0,36 0,00
QR 0,40 0,00 0,00 0,36 0,20 0,00 0,62 0,00 0,00 0,00
QS 13,53 0,32 3,98 5,44 2,93 15,77 4,32 6,44 1,42 4,94
QY 0,00 0,65 0,26 0,36 0,39 0,00 0,00 0,00 0,14 0,12
RA 0,35 0,00 0,17 0,00 0,13 0,00 0,00 0,00 0,43 0,74
RD 0,00 0,00 0,09 0,00 0,07 0,00 0,00 0,00 0,14 0,12
RE 0,23 0,00 0,00 0,00 0,13 0,00 0,00 0,00 0,00 0,00
RF 0,00 0,00 0,00 0,00 0,00 0,00 0,00 0,00 0,00 0,12
RG 3,24 1,51 2,67 3,26 3,62 5,26 1,85 3,47 2,98 2,28
RH 0,81 0,00 0,22 0,00 0,23 0,00 0,00 0,00 0,28 0,12
RI 1,10 5,57 1,05 1,09 1,02 0,75 0,62 0,50 1,07 0,74
RK 0,69 1,14 2,84 2,48 0,95 0,00 0,00 0,00 0,57 0,62
RL 0,00 0,00 0,09 0,00 0,13 0,00 0,00 0,00 0,28 0,25
RP 3,12 0,00 0,00 0,79 0,92 3,00 1,85 0,50 1,07 0,93
RQ 0,12 0,00 0,00 0,00 0,00 0,75 0,00 0,00 0,00 0,00
RR 0,00 1,78 0,31 0,00 0,89 0,00 0,00 0,00 0,00 0,00
RS 0,00 2,27 5,24 2,90 7,70 0,00 0,62 3,47 7,10 6,48
SA 0,40 0,00 0,00 0,18 0,23 0,00 0,00 0,00 0,00 0,00
SD 0,40 0,00 0,00 1,27 0,46 1,50 0,00 0,00 0,00 0,00
SG 0,75 0,00 0,00 1,15 0,63 0,00 0,00 0,00 0,00 0,00
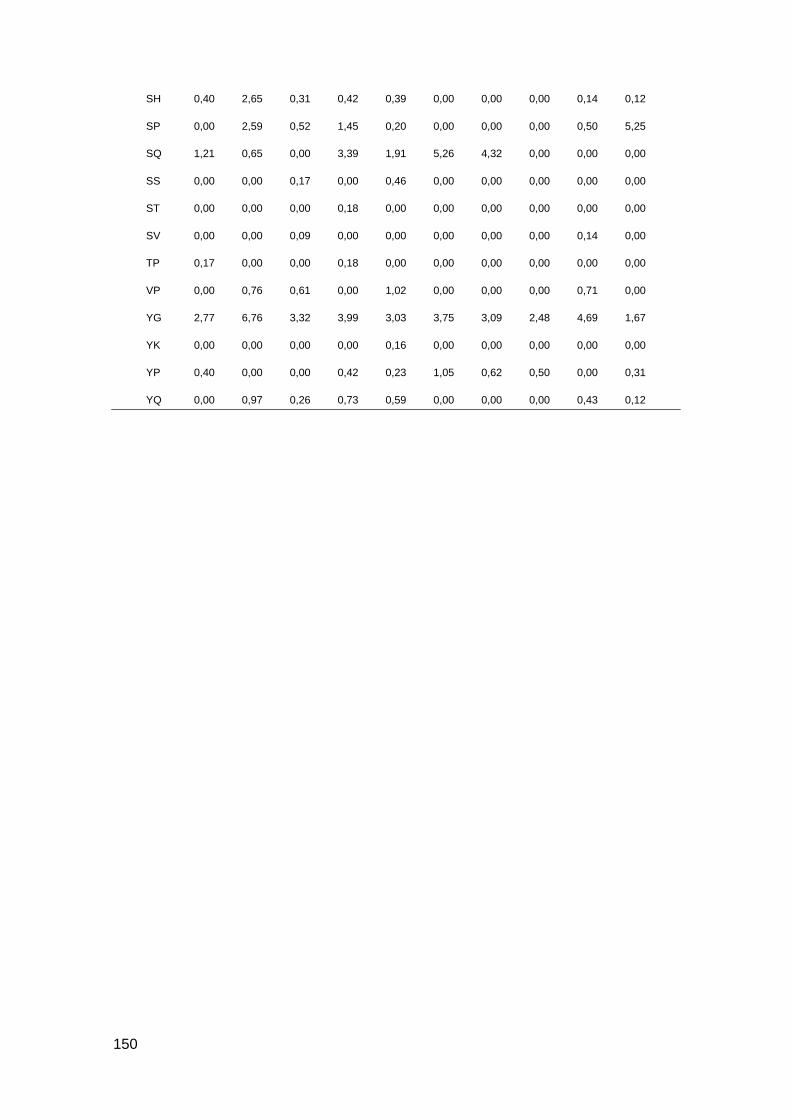
150
SH 0,40 2,65 0,31 0,42 0,39 0,00 0,00 0,00 0,14 0,12
SP 0,00 2,59 0,52 1,45 0,20 0,00 0,00 0,00 0,50 5,25
SQ 1,21 0,65 0,00 3,39 1,91 5,26 4,32 0,00 0,00 0,00
SS 0,00 0,00 0,17 0,00 0,46 0,00 0,00 0,00 0,00 0,00
ST 0,00 0,00 0,00 0,18 0,00 0,00 0,00 0,00 0,00 0,00
SV 0,00 0,00 0,09 0,00 0,00 0,00 0,00 0,00 0,14 0,00
TP 0,17 0,00 0,00 0,18 0,00 0,00 0,00 0,00 0,00 0,00
VP 0,00 0,76 0,61 0,00 1,02 0,00 0,00 0,00 0,71 0,00
YG 2,77 6,76 3,32 3,99 3,03 3,75 3,09 2,48 4,69 1,67
YK 0,00 0,00 0,00 0,00 0,16 0,00 0,00 0,00 0,00 0,00
YP 0,40 0,00 0,00 0,42 0,23 1,05 0,62 0,50 0,00 0,31
YQ 0,00 0,97 0,26 0,73 0,59 0,00 0,00 0,00 0,43 0,12

151
Supplemental Table 9: Cleavage site frequency for N-terminal of identified NSGP.
% T1D 1 T1D 2 T1D 3 T1D 4 T1D 5 Ctrl 1 Ctrl 2 Ctrl 3 Ctrl 4 Ctrl 5
AA 0,33 1,54 0,00 0,25 0,87 0,00 0,79 1,54 0,25 1,13
AC 0,00 0,00 0,83 0,00 0,00 0,00 0,79 0,00 0,98 0,00
AD 1,15 0,90 0,83 0,49 0,11 0,00 0,00 1,54 0,00 0,00
AE 0,00 0,00 0,96 0,16 0,22 0,00 0,00 0,00 0,74 0,00
AG 2,14 3,22 0,83 2,22 3,57 2,70 1,32 0,00 0,98 1,13
AI 0,99 0,00 0,00 0,99 0,00 0,00 0,00 0,00 0,00 1,28
AK 0,00 1,80 0,00 0,00 0,00 0,00 0,00 0,00 0,74 0,00
AL 0,49 0,00 0,83 0,41 0,22 0,00 0,00 0,00 0,00 0,00
AM 0,00 0,00 0,00 0,08 0,00 0,00 0,00 0,00 0,00 0,00
AN 0,16 0,00 0,00 0,00 0,00 0,00 0,00 0,00 0,25 0,00
AP 0,66 0,99 1,32 1,15 2,96 0,00 0,00 0,92 1,72 0,28
AQ 0,00 2,32 0,00 0,00 0,65 0,00 0,00 0,00 1,23 0,00
AR 0,00 0,00 0,41 0,16 0,00 2,70 0,79 0,00 0,00 0,00
AS 0,16 0,00 0,69 0,00 0,76 0,00 0,79 0,00 0,00 0,00
AT 0,00 0,90 0,00 0,00 0,00 0,00 0,00 1,54 0,74 1,28
AV 0,99 0,00 0,00 1,07 0,11 0,00 0,00 0,00 0,98 0,57
AY 0,00 0,00 0,00 0,00 0,11 0,00 0,00 0,00 0,00 0,00
CA 0,00 0,00 0,00 0,00 0,00 0,00 0,00 0,00 0,49 0,00
CD 0,00 0,00 0,00 0,00 0,00 0,00 0,00 0,31 0,00 0,00
CH 0,00 0,00 0,00 0,00 0,00 0,00 0,00 0,00 0,00 0,57
CI 0,00 0,00 0,00 0,08 0,00 0,00 0,00 0,00 0,00 0,00
CL 0,00 0,00 0,83 0,08 0,00 0,00 0,00 0,00 0,00 0,00
CN 0,00 0,00 0,00 0,00 0,00 0,00 0,00 1,23 0,00 0,00
CS 0,00 0,00 0,00 0,00 0,11 0,00 0,00 0,00 0,00 0,00
CT 0,00 0,00 0,00 0,16 0,00 0,00 0,00 0,00 0,00 0,00
DD 0,00 0,00 0,00 0,49 0,00 0,00 0,00 0,00 0,00 0,57
DG 0,33 1,81 1,15 1,97 2,30 0,00 0,00 0,00 1,97 1,84
DI 0,00 0,00 0,00 0,49 0,00 0,00 0,00 0,00 0,00 0,57
DK 0,00 0,51 0,00 0,49 0,22 0,00 0,00 0,00 0,00 0,28
DL 0,00 0,00 0,00 0,08 0,00 0,00 0,00 0,00 0,00 0,00
DM 0,00 0,00 0,00 0,49 0,00 0,00 0,00 0,00 0,00 0,43
DP 0,00 0,00 0,83 0,08 0,00 2,16 0,00 0,00 1,47 0,00
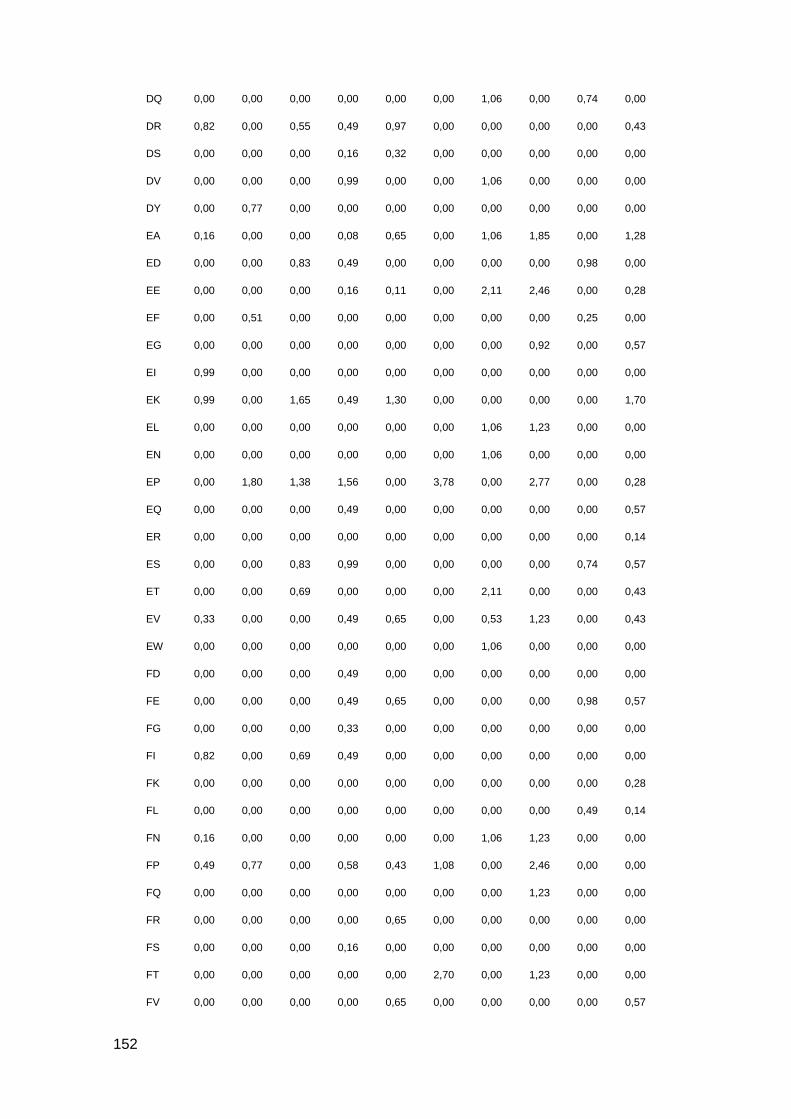
152
DQ 0,00 0,00 0,00 0,00 0,00 0,00 1,06 0,00 0,74 0,00
DR 0,82 0,00 0,55 0,49 0,97 0,00 0,00 0,00 0,00 0,43
DS 0,00 0,00 0,00 0,16 0,32 0,00 0,00 0,00 0,00 0,00
DV 0,00 0,00 0,00 0,99 0,00 0,00 1,06 0,00 0,00 0,00
DY 0,00 0,77 0,00 0,00 0,00 0,00 0,00 0,00 0,00 0,00
EA 0,16 0,00 0,00 0,08 0,65 0,00 1,06 1,85 0,00 1,28
ED 0,00 0,00 0,83 0,49 0,00 0,00 0,00 0,00 0,98 0,00
EE 0,00 0,00 0,00 0,16 0,11 0,00 2,11 2,46 0,00 0,28
EF 0,00 0,51 0,00 0,00 0,00 0,00 0,00 0,00 0,25 0,00
EG 0,00 0,00 0,00 0,00 0,00 0,00 0,00 0,92 0,00 0,57
EI 0,99 0,00 0,00 0,00 0,00 0,00 0,00 0,00 0,00 0,00
EK 0,99 0,00 1,65 0,49 1,30 0,00 0,00 0,00 0,00 1,70
EL 0,00 0,00 0,00 0,00 0,00 0,00 1,06 1,23 0,00 0,00
EN 0,00 0,00 0,00 0,00 0,00 0,00 1,06 0,00 0,00 0,00
EP 0,00 1,80 1,38 1,56 0,00 3,78 0,00 2,77 0,00 0,28
EQ 0,00 0,00 0,00 0,49 0,00 0,00 0,00 0,00 0,00 0,57
ER 0,00 0,00 0,00 0,00 0,00 0,00 0,00 0,00 0,00 0,14
ES 0,00 0,00 0,83 0,99 0,00 0,00 0,00 0,00 0,74 0,57
ET 0,00 0,00 0,69 0,00 0,00 0,00 2,11 0,00 0,00 0,43
EV 0,33 0,00 0,00 0,49 0,65 0,00 0,53 1,23 0,00 0,43
EW 0,00 0,00 0,00 0,00 0,00 0,00 1,06 0,00 0,00 0,00
FD 0,00 0,00 0,00 0,49 0,00 0,00 0,00 0,00 0,00 0,00
FE 0,00 0,00 0,00 0,49 0,65 0,00 0,00 0,00 0,98 0,57
FG 0,00 0,00 0,00 0,33 0,00 0,00 0,00 0,00 0,00 0,00
FI 0,82 0,00 0,69 0,49 0,00 0,00 0,00 0,00 0,00 0,00
FK 0,00 0,00 0,00 0,00 0,00 0,00 0,00 0,00 0,00 0,28
FL 0,00 0,00 0,00 0,00 0,00 0,00 0,00 0,00 0,49 0,14
FN 0,16 0,00 0,00 0,00 0,00 0,00 1,06 1,23 0,00 0,00
FP 0,49 0,77 0,00 0,58 0,43 1,08 0,00 2,46 0,00 0,00
FQ 0,00 0,00 0,00 0,00 0,00 0,00 0,00 1,23 0,00 0,00
FR 0,00 0,00 0,00 0,00 0,65 0,00 0,00 0,00 0,00 0,00
FS 0,00 0,00 0,00 0,16 0,00 0,00 0,00 0,00 0,00 0,00
FT 0,00 0,00 0,00 0,00 0,00 2,70 0,00 1,23 0,00 0,00
FV 0,00 0,00 0,00 0,00 0,65 0,00 0,00 0,00 0,00 0,57

153
GA 3,13 7,34 2,48 3,45 0,32 0,00 0,00 0,00 1,72 2,98
GC 0,00 0,00 0,28 0,08 0,00 0,00 0,00 0,00 0,00 0,00
GD 0,99 2,06 0,00 1,97 0,87 0,00 1,06 0,00 0,00 0,57
GE 0,00 3,86 2,61 2,55 0,32 0,00 0,79 2,46 0,74 2,41
GF 1,32 0,51 0,83 1,31 4,55 0,00 1,32 0,00 3,69 0,43
GG 0,00 0,00 0,83 0,49 0,11 0,00 0,00 0,00 0,98 0,00
GI 0,00 1,67 0,00 0,33 0,32 0,00 0,00 0,00 0,00 1,13
GK 1,15 0,00 0,00 0,66 1,95 0,00 0,00 0,00 0,49 0,00
GL 0,00 1,80 3,03 1,64 1,19 0,00 2,64 3,08 0,25 4,11
GM 0,49 0,00 0,00 0,25 0,00 0,00 0,00 0,00 0,00 1,28
GN 0,00 0,77 1,38 0,16 0,00 0,00 1,06 0,00 0,00 0,14
GP 5,26 7,21 7,98 3,29 6,39 22,16 9,50 4,00 5,16 2,70
GQ 1,97 2,96 0,55 0,49 1,41 0,00 0,00 0,00 0,49 2,41
GR 1,97 1,80 0,00 1,56 1,08 0,00 0,79 2,15 0,98 0,14
GS 0,00 0,00 1,38 1,07 1,19 1,62 0,00 0,00 0,25 0,99
GT 0,00 0,77 0,00 0,58 0,11 0,00 1,32 0,92 0,00 0,00
GV 1,15 2,70 2,20 0,16 0,00 2,70 0,00 1,54 1,23 1,13
GW 0,00 0,00 0,00 0,08 0,00 0,00 0,00 0,00 0,00 0,00
GY 0,99 0,00 0,00 0,00 0,00 0,00 0,00 0,00 0,98 0,00
HC 0,00 0,00 0,00 0,00 0,65 0,00 0,00 0,00 0,00 0,00
HG 0,00 0,00 0,00 0,00 0,22 0,00 0,53 0,00 0,00 0,43
HH 0,00 0,00 0,00 0,00 0,11 0,00 0,00 0,00 0,00 0,14
HI 0,00 0,00 0,83 0,49 0,00 0,00 0,00 0,00 0,00 0,00
HK 0,00 0,00 0,00 0,58 0,00 0,00 0,00 0,00 0,00 0,00
HL 0,00 0,00 0,00 0,49 0,00 0,00 0,00 0,00 0,00 0,57
HM 0,00 0,00 0,00 0,00 0,00 0,00 1,32 1,54 0,00 0,00
HP 0,00 0,00 0,00 0,33 0,11 0,00 0,53 0,00 0,00 0,99
HQ 0,00 0,00 0,00 0,58 0,00 0,00 0,00 0,00 0,00 0,00
HR 0,00 0,00 0,00 0,00 0,00 0,00 0,00 0,00 0,00 0,71
HS 0,16 0,00 0,00 0,25 0,22 0,00 0,26 0,00 0,00 0,00
HT 0,00 0,00 0,00 0,08 0,00 0,00 0,00 0,00 0,00 0,00
IA 0,16 0,00 0,28 0,08 0,00 0,00 0,00 0,00 1,23 0,00
IE 0,00 0,00 1,51 0,00 0,00 0,00 0,00 0,00 0,00 0,00
IF 0,00 0,00 0,00 0,25 0,00 0,00 0,00 1,23 0,98 0,00
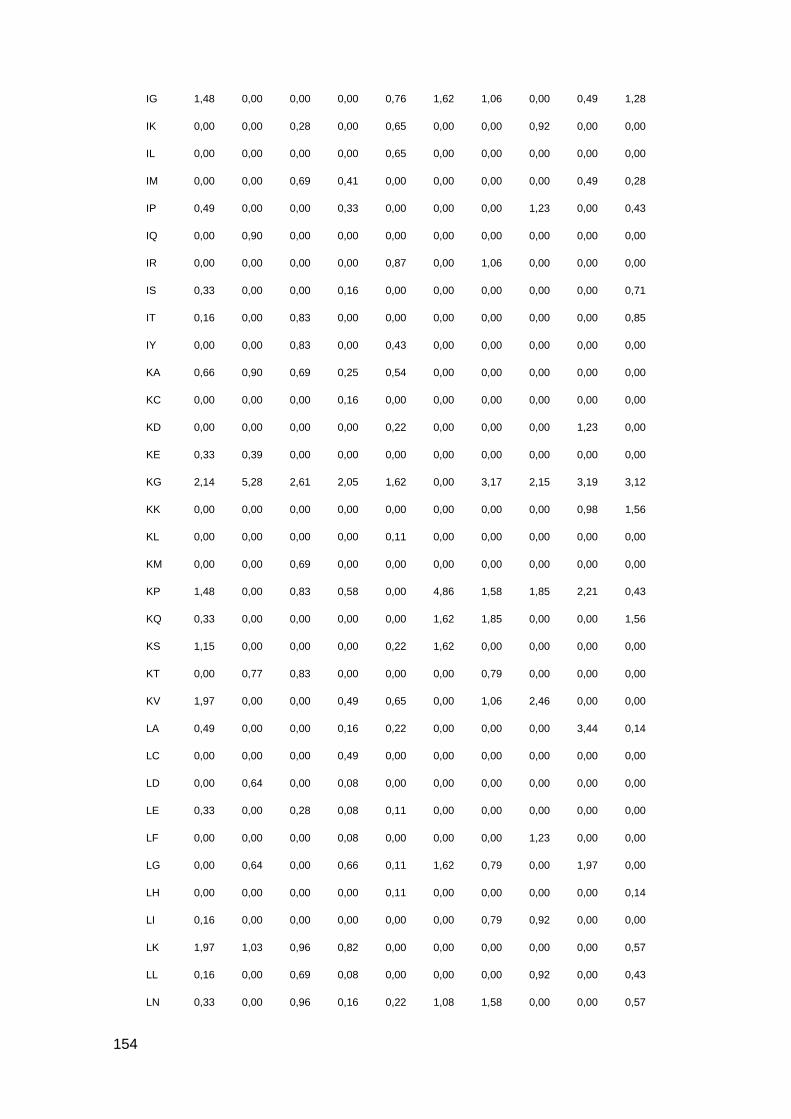
154
IG 1,48 0,00 0,00 0,00 0,76 1,62 1,06 0,00 0,49 1,28
IK 0,00 0,00 0,28 0,00 0,65 0,00 0,00 0,92 0,00 0,00
IL 0,00 0,00 0,00 0,00 0,65 0,00 0,00 0,00 0,00 0,00
IM 0,00 0,00 0,69 0,41 0,00 0,00 0,00 0,00 0,49 0,28
IP 0,49 0,00 0,00 0,33 0,00 0,00 0,00 1,23 0,00 0,43
IQ 0,00 0,90 0,00 0,00 0,00 0,00 0,00 0,00 0,00 0,00
IR 0,00 0,00 0,00 0,00 0,87 0,00 1,06 0,00 0,00 0,00
IS 0,33 0,00 0,00 0,16 0,00 0,00 0,00 0,00 0,00 0,71
IT 0,16 0,00 0,83 0,00 0,00 0,00 0,00 0,00 0,00 0,85
IY 0,00 0,00 0,83 0,00 0,43 0,00 0,00 0,00 0,00 0,00
KA 0,66 0,90 0,69 0,25 0,54 0,00 0,00 0,00 0,00 0,00
KC 0,00 0,00 0,00 0,16 0,00 0,00 0,00 0,00 0,00 0,00
KD 0,00 0,00 0,00 0,00 0,22 0,00 0,00 0,00 1,23 0,00
KE 0,33 0,39 0,00 0,00 0,00 0,00 0,00 0,00 0,00 0,00
KG 2,14 5,28 2,61 2,05 1,62 0,00 3,17 2,15 3,19 3,12
KK 0,00 0,00 0,00 0,00 0,00 0,00 0,00 0,00 0,98 1,56
KL 0,00 0,00 0,00 0,00 0,11 0,00 0,00 0,00 0,00 0,00
KM 0,00 0,00 0,69 0,00 0,00 0,00 0,00 0,00 0,00 0,00
KP 1,48 0,00 0,83 0,58 0,00 4,86 1,58 1,85 2,21 0,43
KQ 0,33 0,00 0,00 0,00 0,00 1,62 1,85 0,00 0,00 1,56
KS 1,15 0,00 0,00 0,00 0,22 1,62 0,00 0,00 0,00 0,00
KT 0,00 0,77 0,83 0,00 0,00 0,00 0,79 0,00 0,00 0,00
KV 1,97 0,00 0,00 0,49 0,65 0,00 1,06 2,46 0,00 0,00
LA 0,49 0,00 0,00 0,16 0,22 0,00 0,00 0,00 3,44 0,14
LC 0,00 0,00 0,00 0,49 0,00 0,00 0,00 0,00 0,00 0,00
LD 0,00 0,64 0,00 0,08 0,00 0,00 0,00 0,00 0,00 0,00
LE 0,33 0,00 0,28 0,08 0,11 0,00 0,00 0,00 0,00 0,00
LF 0,00 0,00 0,00 0,08 0,00 0,00 0,00 1,23 0,00 0,00
LG 0,00 0,64 0,00 0,66 0,11 1,62 0,79 0,00 1,97 0,00
LH 0,00 0,00 0,00 0,00 0,11 0,00 0,00 0,00 0,00 0,14
LI 0,16 0,00 0,00 0,00 0,00 0,00 0,79 0,92 0,00 0,00
LK 1,97 1,03 0,96 0,82 0,00 0,00 0,00 0,00 0,00 0,57
LL 0,16 0,00 0,69 0,08 0,00 0,00 0,00 0,92 0,00 0,43
LN 0,33 0,00 0,96 0,16 0,22 1,08 1,58 0,00 0,00 0,57
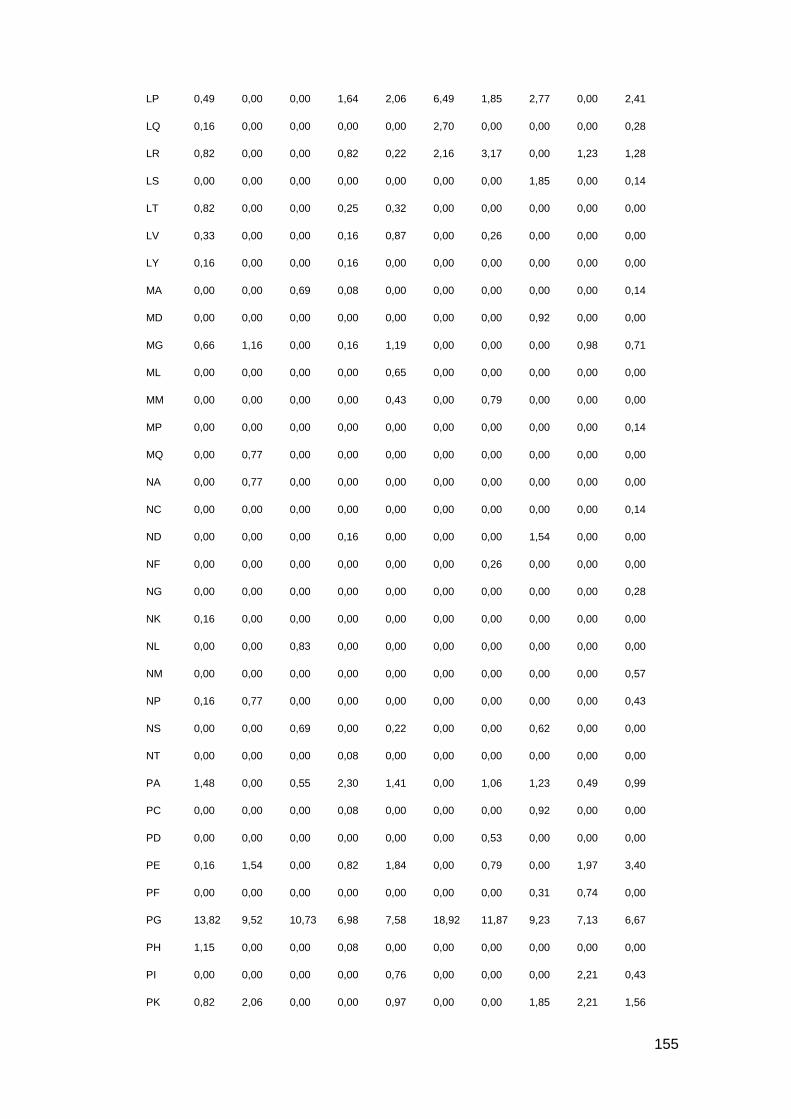
155
LP 0,49 0,00 0,00 1,64 2,06 6,49 1,85 2,77 0,00 2,41
LQ 0,16 0,00 0,00 0,00 0,00 2,70 0,00 0,00 0,00 0,28
LR 0,82 0,00 0,00 0,82 0,22 2,16 3,17 0,00 1,23 1,28
LS 0,00 0,00 0,00 0,00 0,00 0,00 0,00 1,85 0,00 0,14
LT 0,82 0,00 0,00 0,25 0,32 0,00 0,00 0,00 0,00 0,00
LV 0,33 0,00 0,00 0,16 0,87 0,00 0,26 0,00 0,00 0,00
LY 0,16 0,00 0,00 0,16 0,00 0,00 0,00 0,00 0,00 0,00
MA 0,00 0,00 0,69 0,08 0,00 0,00 0,00 0,00 0,00 0,14
MD 0,00 0,00 0,00 0,00 0,00 0,00 0,00 0,92 0,00 0,00
MG 0,66 1,16 0,00 0,16 1,19 0,00 0,00 0,00 0,98 0,71
ML 0,00 0,00 0,00 0,00 0,65 0,00 0,00 0,00 0,00 0,00
MM 0,00 0,00 0,00 0,00 0,43 0,00 0,79 0,00 0,00 0,00
MP 0,00 0,00 0,00 0,00 0,00 0,00 0,00 0,00 0,00 0,14
MQ 0,00 0,77 0,00 0,00 0,00 0,00 0,00 0,00 0,00 0,00
NA 0,00 0,77 0,00 0,00 0,00 0,00 0,00 0,00 0,00 0,00
NC 0,00 0,00 0,00 0,00 0,00 0,00 0,00 0,00 0,00 0,14
ND 0,00 0,00 0,00 0,16 0,00 0,00 0,00 1,54 0,00 0,00
NF 0,00 0,00 0,00 0,00 0,00 0,00 0,26 0,00 0,00 0,00
NG 0,00 0,00 0,00 0,00 0,00 0,00 0,00 0,00 0,00 0,28
NK 0,16 0,00 0,00 0,00 0,00 0,00 0,00 0,00 0,00 0,00
NL 0,00 0,00 0,83 0,00 0,00 0,00 0,00 0,00 0,00 0,00
NM 0,00 0,00 0,00 0,00 0,00 0,00 0,00 0,00 0,00 0,57
NP 0,16 0,77 0,00 0,00 0,00 0,00 0,00 0,00 0,00 0,43
NS 0,00 0,00 0,69 0,00 0,22 0,00 0,00 0,62 0,00 0,00
NT 0,00 0,00 0,00 0,08 0,00 0,00 0,00 0,00 0,00 0,00
PA 1,48 0,00 0,55 2,30 1,41 0,00 1,06 1,23 0,49 0,99
PC 0,00 0,00 0,00 0,08 0,00 0,00 0,00 0,92 0,00 0,00
PD 0,00 0,00 0,00 0,00 0,00 0,00 0,53 0,00 0,00 0,00
PE 0,16 1,54 0,00 0,82 1,84 0,00 0,79 0,00 1,97 3,40
PF 0,00 0,00 0,00 0,00 0,00 0,00 0,00 0,31 0,74 0,00
PG 13,82 9,52 10,73 6,98 7,58 18,92 11,87 9,23 7,13 6,67
PH 1,15 0,00 0,00 0,08 0,00 0,00 0,00 0,00 0,00 0,00
PI 0,00 0,00 0,00 0,00 0,76 0,00 0,00 0,00 2,21 0,43
PK 0,82 2,06 0,00 0,00 0,97 0,00 0,00 1,85 2,21 1,56
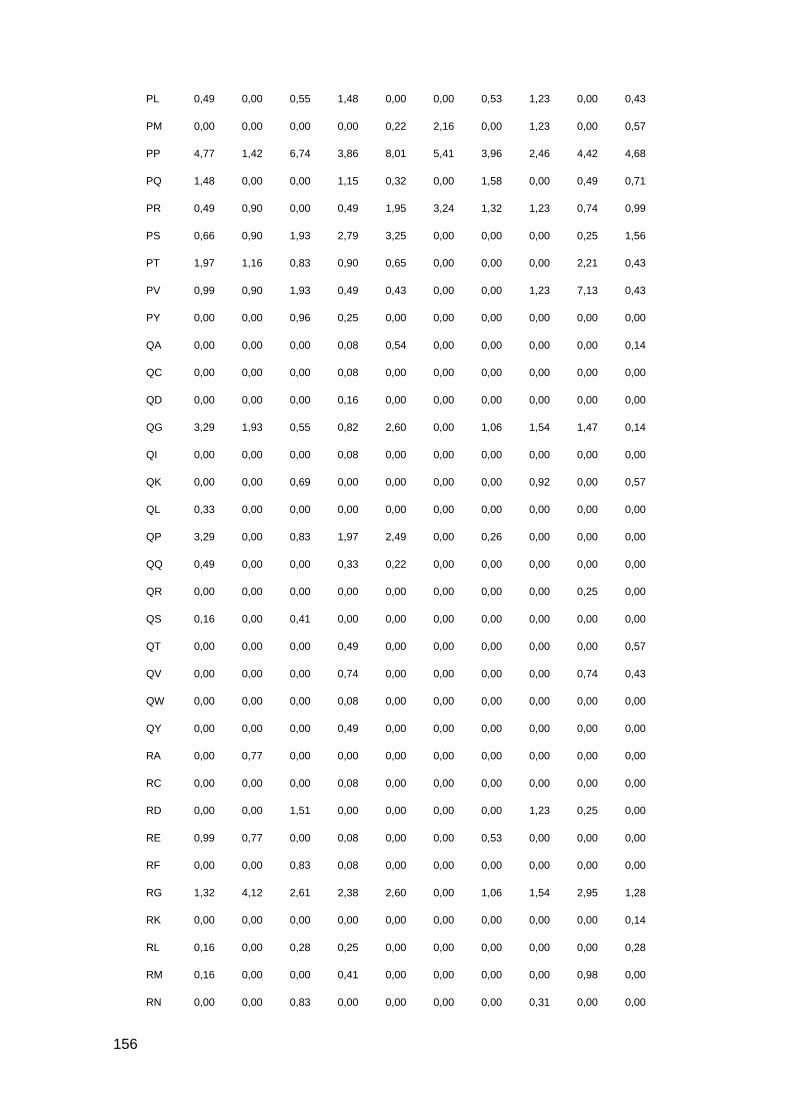
156
PL 0,49 0,00 0,55 1,48 0,00 0,00 0,53 1,23 0,00 0,43
PM 0,00 0,00 0,00 0,00 0,22 2,16 0,00 1,23 0,00 0,57
PP 4,77 1,42 6,74 3,86 8,01 5,41 3,96 2,46 4,42 4,68
PQ 1,48 0,00 0,00 1,15 0,32 0,00 1,58 0,00 0,49 0,71
PR 0,49 0,90 0,00 0,49 1,95 3,24 1,32 1,23 0,74 0,99
PS 0,66 0,90 1,93 2,79 3,25 0,00 0,00 0,00 0,25 1,56
PT 1,97 1,16 0,83 0,90 0,65 0,00 0,00 0,00 2,21 0,43
PV 0,99 0,90 1,93 0,49 0,43 0,00 0,00 1,23 7,13 0,43
PY 0,00 0,00 0,96 0,25 0,00 0,00 0,00 0,00 0,00 0,00
QA 0,00 0,00 0,00 0,08 0,54 0,00 0,00 0,00 0,00 0,14
QC 0,00 0,00 0,00 0,08 0,00 0,00 0,00 0,00 0,00 0,00
QD 0,00 0,00 0,00 0,16 0,00 0,00 0,00 0,00 0,00 0,00
QG 3,29 1,93 0,55 0,82 2,60 0,00 1,06 1,54 1,47 0,14
QI 0,00 0,00 0,00 0,08 0,00 0,00 0,00 0,00 0,00 0,00
QK 0,00 0,00 0,69 0,00 0,00 0,00 0,00 0,92 0,00 0,57
QL 0,33 0,00 0,00 0,00 0,00 0,00 0,00 0,00 0,00 0,00
QP 3,29 0,00 0,83 1,97 2,49 0,00 0,26 0,00 0,00 0,00
QQ 0,49 0,00 0,00 0,33 0,22 0,00 0,00 0,00 0,00 0,00
QR 0,00 0,00 0,00 0,00 0,00 0,00 0,00 0,00 0,25 0,00
QS 0,16 0,00 0,41 0,00 0,00 0,00 0,00 0,00 0,00 0,00
QT 0,00 0,00 0,00 0,49 0,00 0,00 0,00 0,00 0,00 0,57
QV 0,00 0,00 0,00 0,74 0,00 0,00 0,00 0,00 0,74 0,43
QW 0,00 0,00 0,00 0,08 0,00 0,00 0,00 0,00 0,00 0,00
QY 0,00 0,00 0,00 0,49 0,00 0,00 0,00 0,00 0,00 0,00
RA 0,00 0,77 0,00 0,00 0,00 0,00 0,00 0,00 0,00 0,00
RC 0,00 0,00 0,00 0,08 0,00 0,00 0,00 0,00 0,00 0,00
RD 0,00 0,00 1,51 0,00 0,00 0,00 0,00 1,23 0,25 0,00
RE 0,99 0,77 0,00 0,08 0,00 0,00 0,53 0,00 0,00 0,00
RF 0,00 0,00 0,83 0,08 0,00 0,00 0,00 0,00 0,00 0,00
RG 1,32 4,12 2,61 2,38 2,60 0,00 1,06 1,54 2,95 1,28
RK 0,00 0,00 0,00 0,00 0,00 0,00 0,00 0,00 0,00 0,14
RL 0,16 0,00 0,28 0,25 0,00 0,00 0,00 0,00 0,00 0,28
RM 0,16 0,00 0,00 0,41 0,00 0,00 0,00 0,00 0,98 0,00
RN 0,00 0,00 0,83 0,00 0,00 0,00 0,00 0,31 0,00 0,00
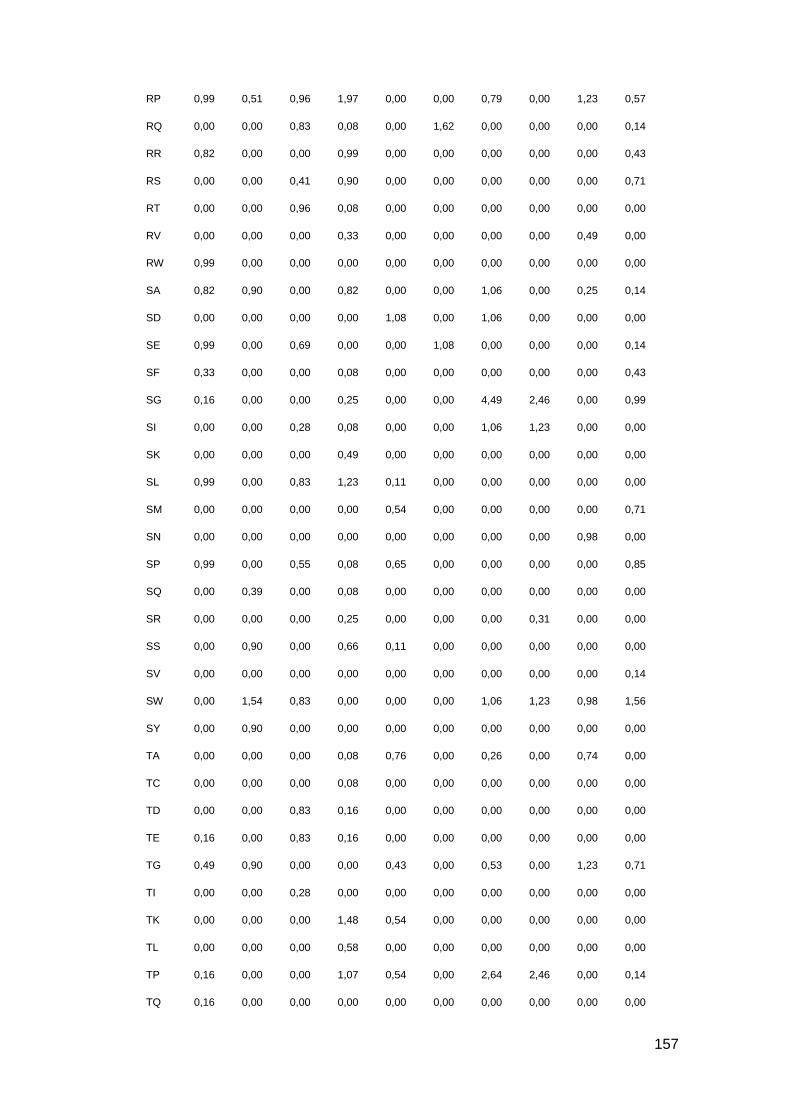
157
RP 0,99 0,51 0,96 1,97 0,00 0,00 0,79 0,00 1,23 0,57
RQ 0,00 0,00 0,83 0,08 0,00 1,62 0,00 0,00 0,00 0,14
RR 0,82 0,00 0,00 0,99 0,00 0,00 0,00 0,00 0,00 0,43
RS 0,00 0,00 0,41 0,90 0,00 0,00 0,00 0,00 0,00 0,71
RT 0,00 0,00 0,96 0,08 0,00 0,00 0,00 0,00 0,00 0,00
RV 0,00 0,00 0,00 0,33 0,00 0,00 0,00 0,00 0,49 0,00
RW 0,99 0,00 0,00 0,00 0,00 0,00 0,00 0,00 0,00 0,00
SA 0,82 0,90 0,00 0,82 0,00 0,00 1,06 0,00 0,25 0,14
SD 0,00 0,00 0,00 0,00 1,08 0,00 1,06 0,00 0,00 0,00
SE 0,99 0,00 0,69 0,00 0,00 1,08 0,00 0,00 0,00 0,14
SF 0,33 0,00 0,00 0,08 0,00 0,00 0,00 0,00 0,00 0,43
SG 0,16 0,00 0,00 0,25 0,00 0,00 4,49 2,46 0,00 0,99
SI 0,00 0,00 0,28 0,08 0,00 0,00 1,06 1,23 0,00 0,00
SK 0,00 0,00 0,00 0,49 0,00 0,00 0,00 0,00 0,00 0,00
SL 0,99 0,00 0,83 1,23 0,11 0,00 0,00 0,00 0,00 0,00
SM 0,00 0,00 0,00 0,00 0,54 0,00 0,00 0,00 0,00 0,71
SN 0,00 0,00 0,00 0,00 0,00 0,00 0,00 0,00 0,98 0,00
SP 0,99 0,00 0,55 0,08 0,65 0,00 0,00 0,00 0,00 0,85
SQ 0,00 0,39 0,00 0,08 0,00 0,00 0,00 0,00 0,00 0,00
SR 0,00 0,00 0,00 0,25 0,00 0,00 0,00 0,31 0,00 0,00
SS 0,00 0,90 0,00 0,66 0,11 0,00 0,00 0,00 0,00 0,00
SV 0,00 0,00 0,00 0,00 0,00 0,00 0,00 0,00 0,00 0,14
SW 0,00 1,54 0,83 0,00 0,00 0,00 1,06 1,23 0,98 1,56
SY 0,00 0,90 0,00 0,00 0,00 0,00 0,00 0,00 0,00 0,00
TA 0,00 0,00 0,00 0,08 0,76 0,00 0,26 0,00 0,74 0,00
TC 0,00 0,00 0,00 0,08 0,00 0,00 0,00 0,00 0,00 0,00
TD 0,00 0,00 0,83 0,16 0,00 0,00 0,00 0,00 0,00 0,00
TE 0,16 0,00 0,83 0,16 0,00 0,00 0,00 0,00 0,00 0,00
TG 0,49 0,90 0,00 0,00 0,43 0,00 0,53 0,00 1,23 0,71
TI 0,00 0,00 0,28 0,00 0,00 0,00 0,00 0,00 0,00 0,00
TK 0,00 0,00 0,00 1,48 0,54 0,00 0,00 0,00 0,00 0,00
TL 0,00 0,00 0,00 0,58 0,00 0,00 0,00 0,00 0,00 0,00
TP 0,16 0,00 0,00 1,07 0,54 0,00 2,64 2,46 0,00 0,14
TQ 0,16 0,00 0,00 0,00 0,00 0,00 0,00 0,00 0,00 0,00
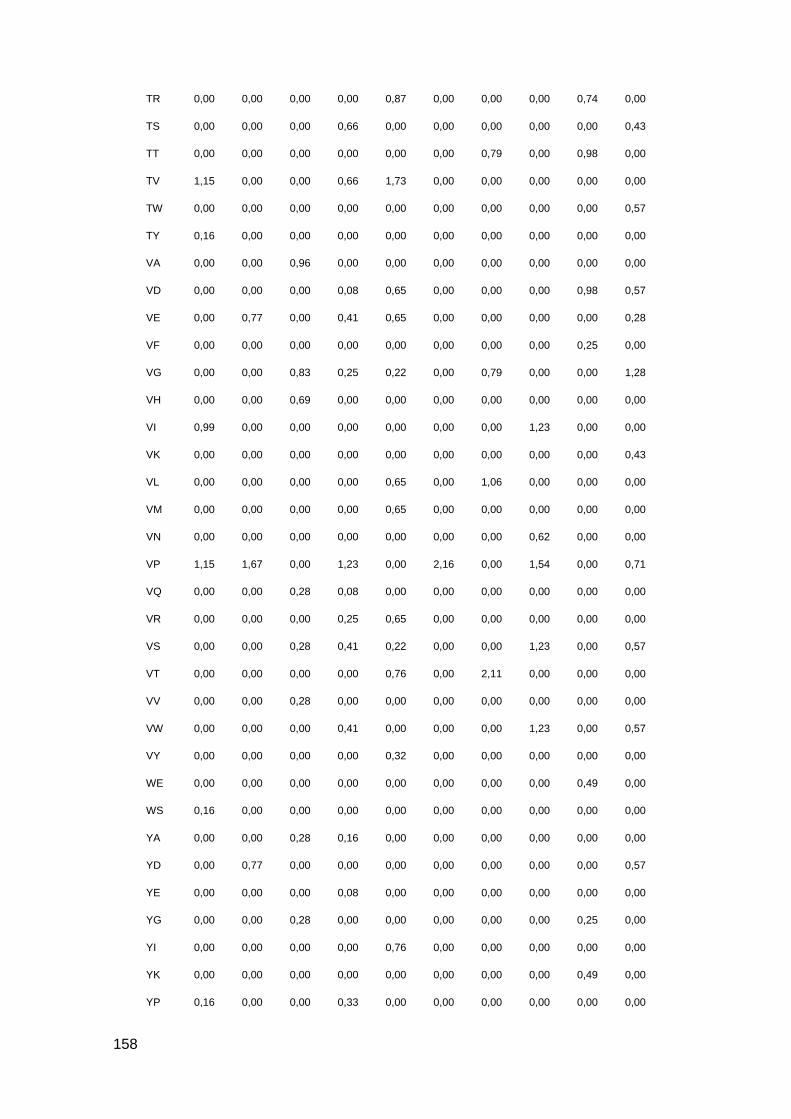
158
TR 0,00 0,00 0,00 0,00 0,87 0,00 0,00 0,00 0,74 0,00
TS 0,00 0,00 0,00 0,66 0,00 0,00 0,00 0,00 0,00 0,43
TT 0,00 0,00 0,00 0,00 0,00 0,00 0,79 0,00 0,98 0,00
TV 1,15 0,00 0,00 0,66 1,73 0,00 0,00 0,00 0,00 0,00
TW 0,00 0,00 0,00 0,00 0,00 0,00 0,00 0,00 0,00 0,57
TY 0,16 0,00 0,00 0,00 0,00 0,00 0,00 0,00 0,00 0,00
VA 0,00 0,00 0,96 0,00 0,00 0,00 0,00 0,00 0,00 0,00
VD 0,00 0,00 0,00 0,08 0,65 0,00 0,00 0,00 0,98 0,57
VE 0,00 0,77 0,00 0,41 0,65 0,00 0,00 0,00 0,00 0,28
VF 0,00 0,00 0,00 0,00 0,00 0,00 0,00 0,00 0,25 0,00
VG 0,00 0,00 0,83 0,25 0,22 0,00 0,79 0,00 0,00 1,28
VH 0,00 0,00 0,69 0,00 0,00 0,00 0,00 0,00 0,00 0,00
VI 0,99 0,00 0,00 0,00 0,00 0,00 0,00 1,23 0,00 0,00
VK 0,00 0,00 0,00 0,00 0,00 0,00 0,00 0,00 0,00 0,43
VL 0,00 0,00 0,00 0,00 0,65 0,00 1,06 0,00 0,00 0,00
VM 0,00 0,00 0,00 0,00 0,65 0,00 0,00 0,00 0,00 0,00
VN 0,00 0,00 0,00 0,00 0,00 0,00 0,00 0,62 0,00 0,00
VP 1,15 1,67 0,00 1,23 0,00 2,16 0,00 1,54 0,00 0,71
VQ 0,00 0,00 0,28 0,08 0,00 0,00 0,00 0,00 0,00 0,00
VR 0,00 0,00 0,00 0,25 0,65 0,00 0,00 0,00 0,00 0,00
VS 0,00 0,00 0,28 0,41 0,22 0,00 0,00 1,23 0,00 0,57
VT 0,00 0,00 0,00 0,00 0,76 0,00 2,11 0,00 0,00 0,00
VV 0,00 0,00 0,28 0,00 0,00 0,00 0,00 0,00 0,00 0,00
VW 0,00 0,00 0,00 0,41 0,00 0,00 0,00 1,23 0,00 0,57
VY 0,00 0,00 0,00 0,00 0,32 0,00 0,00 0,00 0,00 0,00
WE 0,00 0,00 0,00 0,00 0,00 0,00 0,00 0,00 0,49 0,00
WS 0,16 0,00 0,00 0,00 0,00 0,00 0,00 0,00 0,00 0,00
YA 0,00 0,00 0,28 0,16 0,00 0,00 0,00 0,00 0,00 0,00
YD 0,00 0,77 0,00 0,00 0,00 0,00 0,00 0,00 0,00 0,57
YE 0,00 0,00 0,00 0,08 0,00 0,00 0,00 0,00 0,00 0,00
YG 0,00 0,00 0,28 0,00 0,00 0,00 0,00 0,00 0,25 0,00
YI 0,00 0,00 0,00 0,00 0,76 0,00 0,00 0,00 0,00 0,00
YK 0,00 0,00 0,00 0,00 0,00 0,00 0,00 0,00 0,49 0,00
YP 0,16 0,00 0,00 0,33 0,00 0,00 0,00 0,00 0,00 0,00

159
YQ 0,00 0,00 0,00 0,00 0,00 0,00 0,00 0,00 1,23 0,00
YR 0,99 0,00 0,00 0,00 0,00 0,00 0,00 0,00 0,00 0,00

160
Supplemental Table 10: Cleavage site frequency for C-terminal of identified NSGP.
% T1D 1 T1D 2 T1D 3 T1D 4 T1D 5 Ctrl 1 Ctrl 2 Ctrl 3 Ctrl 4 Ctrl 5
AA 1,16 2,57 0,41 0,16 0,11 0,00 0,00 0,00 0,00 1,84
AG 2,16 1,80 0,83 3,37 1,08 7,57 0,00 1,23 0,98 0,71
AH 0,00 0,00 1,38 0,00 0,00 0,00 0,00 0,00 0,00 0,00
AK 0,00 0,77 0,00 0,00 0,00 0,00 0,00 1,23 0,00 0,00
AL 0,00 0,00 0,00 0,16 0,00 0,00 0,00 0,00 0,00 0,00
AP 5,80 4,63 2,61 4,44 3,25 2,16 5,48 3,38 4,91 4,11
AQ 0,00 0,00 0,00 0,00 0,00 1,62 1,04 1,23 0,00 0,00
AR 0,17 0,00 0,00 0,00 0,00 0,00 1,31 1,23 0,00 0,14
AS 0,33 0,00 0,00 0,00 0,65 0,00 0,00 0,00 0,00 0,00
AV 0,00 0,00 0,41 0,00 0,43 0,00 0,00 0,00 0,00 0,14
CG 0,00 0,00 0,00 0,00 0,00 0,00 0,00 1,23 0,00 0,00
CK 0,00 0,77 0,00 0,00 0,00 0,00 0,00 0,00 0,00 0,00
CP 0,00 0,00 0,00 0,33 0,22 1,62 0,00 0,00 0,00 0,28
DA 0,83 0,00 0,00 0,00 0,00 0,00 0,00 0,00 0,00 0,00
DE 0,00 0,00 0,55 0,00 0,00 0,00 0,00 0,00 0,00 0,14
DG 0,00 0,90 0,00 0,49 0,00 0,00 0,00 0,00 3,19 1,70
DI 0,17 0,00 3,58 1,73 1,73 1,08 0,00 0,00 0,00 0,00
DK 0,00 0,00 0,00 0,00 0,00 0,00 0,00 1,23 0,00 0,71
DL 0,00 0,00 0,00 0,00 0,00 0,00 0,26 0,00 0,98 0,00
DN 0,00 0,00 0,00 0,16 0,00 0,00 0,00 0,00 0,00 0,14
DP 1,00 0,90 0,00 0,00 0,00 1,62 1,31 1,23 0,49 1,84
DQ 0,00 0,00 0,28 0,00 0,00 1,62 0,00 0,00 0,00 0,57
DR 0,00 0,77 0,00 0,00 0,11 0,00 0,00 0,00 1,72 0,00
DT 0,00 0,00 0,83 0,08 0,00 0,00 0,00 0,00 0,00 0,00
DV 0,17 0,00 1,10 0,49 0,00 0,00 0,00 0,00 0,98 0,00
EA 0,00 0,00 0,00 0,08 0,00 0,00 0,00 0,00 0,00 0,00
EE 0,33 0,00 0,83 0,58 0,00 0,00 0,00 0,00 0,00 0,14
EG 0,00 0,77 0,00 0,00 0,00 0,00 0,00 0,00 0,00 0,00
EH 0,00 0,00 0,28 0,08 0,00 0,00 0,00 0,00 0,00 0,00
EI 0,00 0,00 0,00 0,00 0,00 0,00 0,00 1,23 0,00 0,00
EK 0,00 0,00 0,69 0,00 0,00 0,00 0,00 0,00 0,00 1,70
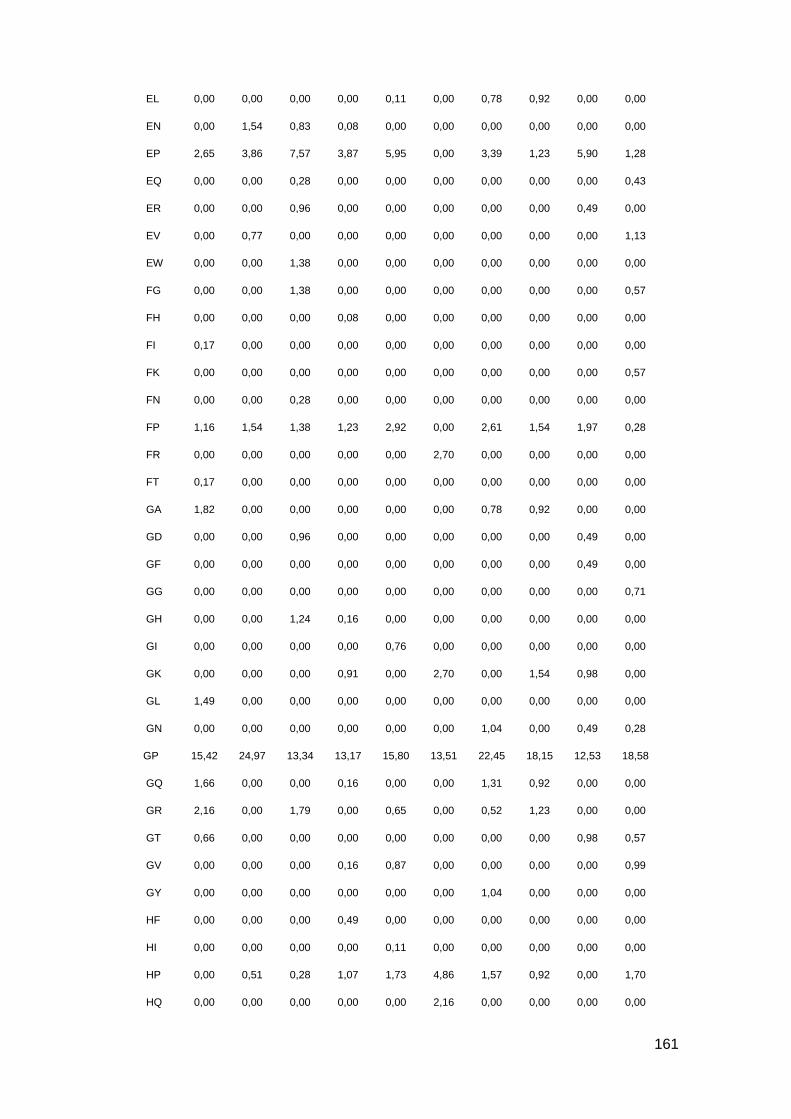
161
EL 0,00 0,00 0,00 0,00 0,11 0,00 0,78 0,92 0,00 0,00
EN 0,00 1,54 0,83 0,08 0,00 0,00 0,00 0,00 0,00 0,00
EP 2,65 3,86 7,57 3,87 5,95 0,00 3,39 1,23 5,90 1,28
EQ 0,00 0,00 0,28 0,00 0,00 0,00 0,00 0,00 0,00 0,43
ER 0,00 0,00 0,96 0,00 0,00 0,00 0,00 0,00 0,49 0,00
EV 0,00 0,77 0,00 0,00 0,00 0,00 0,00 0,00 0,00 1,13
EW 0,00 0,00 1,38 0,00 0,00 0,00 0,00 0,00 0,00 0,00
FG 0,00 0,00 1,38 0,00 0,00 0,00 0,00 0,00 0,00 0,57
FH 0,00 0,00 0,00 0,08 0,00 0,00 0,00 0,00 0,00 0,00
FI 0,17 0,00 0,00 0,00 0,00 0,00 0,00 0,00 0,00 0,00
FK 0,00 0,00 0,00 0,00 0,00 0,00 0,00 0,00 0,00 0,57
FN 0,00 0,00 0,28 0,00 0,00 0,00 0,00 0,00 0,00 0,00
FP 1,16 1,54 1,38 1,23 2,92 0,00 2,61 1,54 1,97 0,28
FR 0,00 0,00 0,00 0,00 0,00 2,70 0,00 0,00 0,00 0,00
FT 0,17 0,00 0,00 0,00 0,00 0,00 0,00 0,00 0,00 0,00
GA 1,82 0,00 0,00 0,00 0,00 0,00 0,78 0,92 0,00 0,00
GD 0,00 0,00 0,96 0,00 0,00 0,00 0,00 0,00 0,49 0,00
GF 0,00 0,00 0,00 0,00 0,00 0,00 0,00 0,00 0,49 0,00
GG 0,00 0,00 0,00 0,00 0,00 0,00 0,00 0,00 0,00 0,71
GH 0,00 0,00 1,24 0,16 0,00 0,00 0,00 0,00 0,00 0,00
GI 0,00 0,00 0,00 0,00 0,76 0,00 0,00 0,00 0,00 0,00
GK 0,00 0,00 0,00 0,91 0,00 2,70 0,00 1,54 0,98 0,00
GL 1,49 0,00 0,00 0,00 0,00 0,00 0,00 0,00 0,00 0,00
GN 0,00 0,00 0,00 0,00 0,00 0,00 1,04 0,00 0,49 0,28
GP 15,42 24,97 13,34 13,17 15,80 13,51 22,45 18,15 12,53 18,58
GQ 1,66 0,00 0,00 0,16 0,00 0,00 1,31 0,92 0,00 0,00
GR 2,16 0,00 1,79 0,00 0,65 0,00 0,52 1,23 0,00 0,00
GT 0,66 0,00 0,00 0,00 0,00 0,00 0,00 0,00 0,98 0,57
GV 0,00 0,00 0,00 0,16 0,87 0,00 0,00 0,00 0,00 0,99
GY 0,00 0,00 0,00 0,00 0,00 0,00 1,04 0,00 0,00 0,00
HF 0,00 0,00 0,00 0,49 0,00 0,00 0,00 0,00 0,00 0,00
HI 0,00 0,00 0,00 0,00 0,11 0,00 0,00 0,00 0,00 0,00
HP 0,00 0,51 0,28 1,07 1,73 4,86 1,57 0,92 0,00 1,70
HQ 0,00 0,00 0,00 0,00 0,00 2,16 0,00 0,00 0,00 0,00

162
HV 1,00 0,00 0,00 0,99 0,00 0,00 0,00 0,00 0,00 1,13
IE 0,00 0,00 0,00 0,00 0,22 0,00 0,00 0,00 0,00 0,00
IG 1,00 0,00 0,00 0,08 0,00 2,70 0,00 0,00 0,74 0,14
II 0,17 0,00 0,00 0,00 0,00 0,00 0,00 0,00 0,00 0,00
IK 0,33 0,00 0,00 0,00 0,00 0,00 0,00 0,00 0,00 0,00
IL 0,00 0,00 0,83 0,08 0,00 0,00 0,00 0,00 0,00 0,00
IN 0,00 0,00 0,83 0,00 0,00 0,00 0,00 0,00 0,00 0,00
IP 0,17 0,77 0,00 1,81 1,73 0,00 2,61 2,46 0,00 1,56
IQ 0,00 0,00 0,00 0,00 0,11 0,00 0,00 0,00 0,00 0,00
IV 0,00 0,00 0,00 0,08 0,00 0,00 0,00 0,00 0,00 0,00
KE 0,00 0,00 0,00 0,08 0,00 0,00 0,00 0,00 0,00 0,00
KG 1,16 0,39 0,00 0,00 0,00 2,70 0,00 0,00 0,00 0,00
KH 0,00 0,00 0,83 0,00 0,00 0,00 0,00 0,00 0,00 0,00
KI 0,00 0,00 0,00 0,00 0,00 0,00 0,00 1,23 0,98 0,00
KK 1,00 0,00 0,00 0,00 0,00 0,00 1,04 0,00 0,00 0,00
KL 0,00 0,00 0,00 0,08 0,00 0,00 1,04 0,00 0,00 0,00
KN 0,00 0,00 0,00 0,74 0,00 0,00 0,00 0,00 0,00 0,00
KP 1,49 0,77 1,38 2,55 1,84 0,00 3,13 3,69 1,97 2,13
KR 0,00 0,00 0,69 0,00 0,00 0,00 0,00 0,00 0,00 0,00
KS 0,00 0,00 0,28 0,00 0,00 0,00 0,00 0,00 0,00 0,00
KV 0,00 0,00 0,00 0,82 1,30 0,00 0,00 2,46 0,74 0,14
LG 0,00 0,64 0,00 0,08 0,00 0,00 0,00 0,00 0,00 0,00
LH 0,00 0,00 0,69 0,74 0,00 0,00 0,00 0,00 0,00 0,00
LI 0,00 0,00 0,00 0,00 0,00 0,00 0,00 0,31 0,00 0,00
LK 1,16 0,00 0,00 0,00 0,00 0,00 0,00 1,23 0,98 0,14
LL 0,50 0,64 0,00 0,00 0,32 0,00 0,00 0,00 0,00 0,00
LN 0,00 0,00 0,00 0,08 0,00 0,00 0,00 0,31 0,00 0,00
LP 5,97 6,44 5,50 7,24 7,90 5,95 7,05 3,38 3,69 6,38
LR 0,50 0,00 0,00 0,00 0,00 0,00 0,78 0,00 0,00 0,00
LS 0,00 0,00 0,00 0,00 0,00 0,00 0,00 0,00 0,98 0,00
LV 0,00 0,00 0,00 0,33 0,11 0,00 0,00 0,00 0,00 0,14
MD 1,00 0,00 0,00 0,00 0,00 0,00 0,00 0,00 0,00 0,00
ME 0,00 0,00 0,00 0,00 0,00 0,00 0,00 0,00 0,00 0,43
MG 0,00 0,00 0,00 0,41 0,00 0,00 0,00 0,00 1,72 0,43

163
MK 0,00 0,64 0,00 0,25 0,00 0,00 0,00 0,00 0,00 0,00
MP 0,00 0,00 0,00 0,00 0,00 2,16 0,00 1,23 0,00 0,85
MQ 0,00 0,00 0,00 0,16 0,00 0,00 0,00 0,00 0,00 0,00
MR 0,33 0,00 0,00 0,00 0,00 0,00 0,00 0,00 0,00 0,00
NG 0,00 0,00 0,00 0,00 0,00 2,70 0,00 0,00 0,00 0,00
NK 0,00 0,00 0,00 0,49 0,00 0,00 0,00 0,00 0,00 0,00
NL 0,00 0,00 0,00 0,00 0,00 0,00 0,00 0,31 0,00 0,00
NN 0,00 0,00 0,00 0,00 0,65 0,00 0,00 0,00 0,00 0,00
NP 0,83 0,00 0,83 0,49 0,76 0,00 2,09 0,00 1,23 0,57
NQ 0,00 0,00 0,00 0,08 0,00 0,00 0,00 0,00 0,00 0,00
NS 0,00 0,00 0,00 0,00 0,00 0,00 0,00 0,00 0,00 0,57
NV 0,00 0,77 0,00 0,16 0,22 0,00 0,00 0,00 0,00 0,00
PA 0,50 0,77 0,00 0,16 1,52 0,00 0,00 0,00 0,00 0,00
PD 0,00 0,00 0,00 0,00 0,00 0,00 0,00 0,00 0,00 0,14
PC 0,00 0,00 0,00 0,25 0,00 0,00 0,00 0,00 0,00 0,00
PE 0,00 0,00 0,00 0,00 0,65 0,00 0,00 1,23 0,00 0,00
PG 2,16 5,79 2,75 4,61 4,11 17,30 1,83 2,46 3,19 3,12
PH 0,17 0,00 0,28 0,00 0,00 0,00 0,00 0,00 0,00 0,14
PI 1,00 0,00 0,00 0,00 0,00 1,62 0,00 0,00 0,00 0,43
PK 0,66 0,77 0,00 0,58 0,00 0,00 0,00 0,00 0,00 0,00
PL 0,66 0,00 0,69 0,08 0,43 0,00 0,00 0,00 0,00 0,00
PM 0,17 0,00 0,00 0,00 0,00 0,00 0,00 0,00 0,00 0,00
PN 0,00 0,00 0,00 0,33 0,00 0,00 0,00 0,00 0,00 0,00
PP 18,41 22,14 15,96 18,85 17,53 16,22 18,28 21,54 18,92 17,59
PQ 0,17 0,77 1,10 0,74 0,00 0,00 0,00 0,00 0,49 0,00
PR 0,83 0,00 0,96 0,08 0,76 0,00 0,00 0,92 0,00 0,71
PS 0,00 0,00 0,00 0,00 0,00 0,00 0,00 0,00 0,00 0,14
PV 0,17 0,77 0,00 0,58 1,41 0,00 0,00 0,00 2,95 0,00
QA 0,00 0,00 0,00 0,00 0,65 0,00 0,00 0,00 0,00 0,00
QE 0,00 0,00 0,00 0,08 0,00 0,00 0,00 0,00 0,00 0,00
QG 0,66 0,77 2,48 0,33 2,49 1,08 3,13 0,00 0,00 0,71
QI 0,00 0,00 0,00 0,00 0,00 0,00 0,00 0,00 0,00 0,28
QK 0,83 0,00 0,00 0,00 0,00 0,00 0,00 0,00 0,00 0,14
QL 0,00 0,00 0,00 0,00 0,32 0,00 0,00 0,00 0,00 0,00

164
QP 2,65 2,83 2,06 2,63 3,79 0,00 0,78 0,00 3,93 0,43
QQ 0,00 0,00 0,00 0,00 0,00 0,00 0,00 0,00 0,74 0,00
QR 0,00 0,00 0,00 0,00 0,00 0,00 0,00 0,00 0,00 0,57
QS 0,00 0,00 0,41 0,16 0,00 0,00 0,00 0,00 0,00 0,00
QV 0,00 0,00 0,00 0,08 0,54 0,00 0,00 0,00 0,00 0,00
RA 0,00 0,00 0,00 0,00 0,00 0,00 0,00 0,00 0,00 0,43
RF 0,00 0,00 0,00 0,16 0,00 0,00 0,00 0,00 0,00 0,00
RG 0,00 0,00 0,96 0,49 1,08 1,62 0,00 0,00 0,00 0,99
RK 0,00 0,00 0,00 0,25 0,00 0,00 0,00 0,00 0,00 0,43
RN 0,00 0,00 0,00 0,00 0,00 0,00 0,00 0,31 0,74 0,00
RP 1,00 1,80 1,79 1,65 1,08 0,00 1,04 1,54 1,23 0,85
RR 0,00 0,00 0,55 0,00 0,00 0,00 0,00 0,00 0,00 0,28
RS 0,00 0,00 0,00 0,08 0,00 0,00 0,00 0,00 0,00 0,14
SA 1,16 0,00 0,00 0,00 0,65 0,00 0,00 0,00 0,00 0,57
SF 0,00 0,00 0,00 0,00 0,00 0,00 0,00 0,00 0,00 0,43
SG 0,17 0,00 0,00 0,66 0,00 0,00 0,52 0,92 0,00 0,14
SL 0,00 0,00 0,00 0,00 0,00 0,00 0,00 0,31 0,00 0,00
SN 0,00 0,00 0,00 0,00 0,65 0,00 0,00 0,00 0,00 0,43
SP 4,64 1,67 0,96 2,63 3,68 2,70 0,26 0,00 1,47 2,13
SQ 0,00 0,00 0,00 0,00 0,11 0,00 0,00 0,00 0,00 0,28
SR 0,83 0,00 0,00 0,08 0,11 0,00 0,00 0,00 0,00 0,14
ST 0,00 0,00 0,00 0,00 0,00 0,00 1,04 0,00 0,00 0,00
SV 0,00 0,00 0,00 0,58 0,00 0,00 0,00 0,00 0,98 0,00
SW 0,17 0,00 0,00 0,00 0,00 0,00 0,00 0,00 0,00 0,00
TG 0,66 0,00 0,69 1,73 0,54 0,00 0,00 0,92 2,46 0,99
TI 0,00 0,00 0,00 0,16 0,00 0,00 0,00 0,00 0,00 0,57
TK 0,00 0,00 0,00 0,25 0,54 0,00 0,26 0,00 0,00 0,00
TL 1,00 0,77 0,00 0,00 0,00 0,00 2,09 0,00 0,00 0,00
TP 0,17 0,00 3,16 3,13 3,03 0,00 2,61 3,69 0,00 1,84
TQ 0,83 0,00 0,00 0,00 0,00 0,00 0,00 0,00 0,00 0,00
TR 0,00 0,00 0,00 0,00 0,00 0,00 0,00 0,00 0,49 0,14
TS 0,00 0,00 0,00 0,00 0,00 0,00 0,00 0,00 0,00 0,57
TV 0,00 0,77 0,28 0,58 0,11 0,00 0,00 0,00 0,00 0,57
VA 0,17 0,00 0,00 0,49 0,00 0,00 0,00 0,00 0,00 0,00
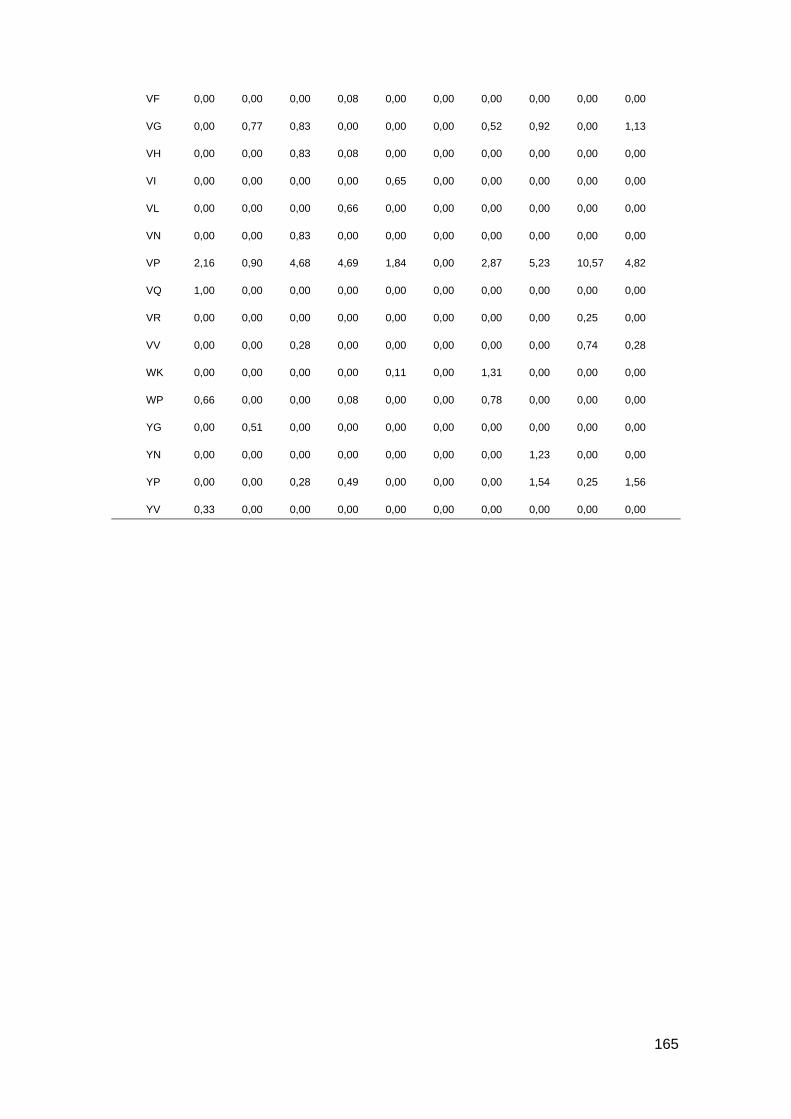
165
VF 0,00 0,00 0,00 0,08 0,00 0,00 0,00 0,00 0,00 0,00
VG 0,00 0,77 0,83 0,00 0,00 0,00 0,52 0,92 0,00 1,13
VH 0,00 0,00 0,83 0,08 0,00 0,00 0,00 0,00 0,00 0,00
VI 0,00 0,00 0,00 0,00 0,65 0,00 0,00 0,00 0,00 0,00
VL 0,00 0,00 0,00 0,66 0,00 0,00 0,00 0,00 0,00 0,00
VN 0,00 0,00 0,83 0,00 0,00 0,00 0,00 0,00 0,00 0,00
VP 2,16 0,90 4,68 4,69 1,84 0,00 2,87 5,23 10,57 4,82
VQ 1,00 0,00 0,00 0,00 0,00 0,00 0,00 0,00 0,00 0,00
VR 0,00 0,00 0,00 0,00 0,00 0,00 0,00 0,00 0,25 0,00
VV 0,00 0,00 0,28 0,00 0,00 0,00 0,00 0,00 0,74 0,28
WK 0,00 0,00 0,00 0,00 0,11 0,00 1,31 0,00 0,00 0,00
WP 0,66 0,00 0,00 0,08 0,00 0,00 0,78 0,00 0,00 0,00
YG 0,00 0,51 0,00 0,00 0,00 0,00 0,00 0,00 0,00 0,00
YN 0,00 0,00 0,00 0,00 0,00 0,00 0,00 1,23 0,00 0,00
YP 0,00 0,00 0,28 0,49 0,00 0,00 0,00 1,54 0,25 1,56
YV 0,33 0,00 0,00 0,00 0,00 0,00 0,00 0,00 0,00 0,00

166
Supplemental Table 11: Contingency table for N-terminal of identified SGP in controls.
The amino acids are represented in one letter code
% A C D E F G H I K L M N P Q R S T V W Y Total
A 0,23 0,10 0,00 0,25 0,21 0,79
C
D 0,17 0,07 0,24
E 7,17 0,77 0,33 8,27
F 2,03 0,12 0,21 0,10 0,80 0,43 3,69
G 1,28 0,31 0,80 0,26 0,07 1,56 0,26 0,69 0,08 5,31
H 0,03 0,07 0,97 1,07
I
K 0,12 0,03 0,03 0,03 0,09 1,86 0,09 0,16 2,41
L 0,44 0,06 0,24 0,74
M
N 0,13 0,13 0,17 0,13 0,56
P 0,57 0,15 0,17 0,07 0,28 3,62 3,46 4,53 0,43 0,65 13,93
Q 0,77 0,30 44,20 0,34 0,88 0,21 1,73 0,39 48,82
R 0,20 0,09 0,08 0,68 1,24 0,12 0,17 0,10 0,13 2,17 4,98
S 0,68 0,03 0,07 0,24 0,25 1,84 3,11
T 0,06 0,06
V
W
Y 5,39 0,15 0,46 0,03 6,03
Total 2,81 0,03 0,09 0,41 1,52 60,13 0,38 1,76 1,12 0,54 0,07 0,20 8,06 5,55 9,90 4,82 0,03 0,80 1,79 100

167
Supplemental Table 12: Contingency table for C-terminal of identified SGP in controls.
The amino acids are represented in one letter code
% A C D E F G H I K L M N P Q R S T V W Y Total
A 0,32 0,60 0,24 0,54 0,08 1,78
C 0,00
D 0,32 0,64 0,96
E 0,12 0,10 0,10 0,35 0,13 0,80
F 1,24 0,24 0,23 0,02 0,87 0,03 2,63
G 0,73 0,85 0,15 0,21 2,45 1,11 0,16 5,66
H 0,11 0,05 0,22 0,05 0,43
I 0,08 0,03 0,11
K 0,16 0,32 0,21 0,06 2,00 0,02 0,60 3,37
L 0,76 0,24 0,13 0,06 0,02 0,17 1,38
M 0,03 0,03
N 0,45 0,45
P 0,03 1,37 5,70 2,20 1,46 0,50 0,11 0,57 11,94
Q 1,01 0,13 0,30 43,09 0,56 1,49 0,12 6,58 0,05 53,33
R 0,23 0,05 0,02 3,17 0,08 0,74 0,24 0,11 1,47 0,15 3,53 9,79
S 0,30 0,05 1,15 1,92 0,03 3,45
T 0,00
V 0,14 0,14
W 0,00
Y 3,14 0,50 0,11 3,75
Total 2,16 0,00 0,80 0,58 1,61 54,28 0,78 1,10 0,69 0,16 0,00 0,12 14,96 6,00 3,28 11,47 0,00 1,03 0,00 0,98 100

168
Supplemental Table 13: Contingency table for N-terminal of identified SGP in diabetic patients.
The amino acids are represented in one letter code
% A C D E F G H I K L M N P Q R S T V W Y Total
A 0,07 0,22 0,02 0,26 0,15 0,01 0,73
C 0,00
D 0,01 0,01
E 6,55 0,05 0,10 0,51 0,26 7,47
F 1,91 0,04 0,55 0,34 3,88 6,72
G 1,37 0,66 0,23 0,61 0,28 0,12 1,62 0,05 0,33 0,75 6,02
H 0,34 0,05 1,37 0,88 2,64
I 0,00
K 0,05 0,26 0,05 0,02 0,90 0,49 0,09 1,86
L 0,71 0,12 0,09 1,54 2,46
M 0,02 0,02
N 0,09 0,15 0,18 0,42
P 0,38 0,27 0,98 0,12 0,04 0,09 0,02 5,02 2,42 3,13 0,18 0,63 13,28
Q 0,61 0,21 33,32 0,05 0,04 0,10 0,87 0,41 1,74 2,04 39,39
R 0,03 0,03 0,14 0,31 0,04 0,39 0,32 0,15 0,14 1,62 3,17
S 0,96 0,02 0,04 0,13 0,12 0,80 0,21 0,79 0,11 0,02 3,20
T 0,28 0,04 0,04 0,36
V 0,04 0,02 0,06
W 0,00
Y 0,53 8,03 0,31 0,25 0,04 1,47 1,48 0,09 12,20
Total 2,74 0,56 0,37 2,26 51,95 0,94 1,26 1,50 0,73 0,02 0,92 8,05 5,53 8,80 4,91 0,09 0,36 0,00 9,02 100
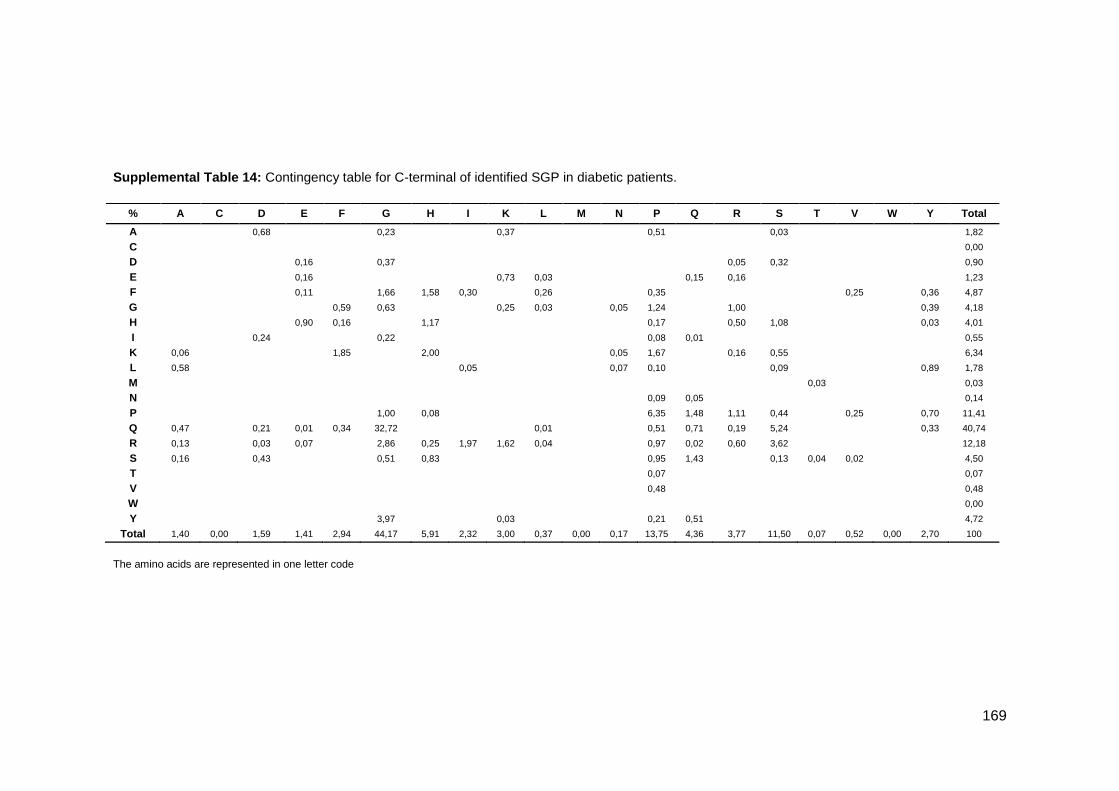
169
Supplemental Table 14: Contingency table for C-terminal of identified SGP in diabetic patients.
The amino acids are represented in one letter code
% A C D E F G H I K L M N P Q R S T V W Y Total
A 0,68 0,23 0,37 0,51 0,03 1,82
C 0,00
D 0,16 0,37 0,05 0,32 0,90
E 0,16 0,73 0,03 0,15 0,16 1,23
F 0,11 1,66 1,58 0,30 0,26 0,35 0,25 0,36 4,87
G 0,59 0,63 0,25 0,03 0,05 1,24 1,00 0,39 4,18
H 0,90 0,16 1,17 0,17 0,50 1,08 0,03 4,01
I 0,24 0,22 0,08 0,01 0,55
K 0,06 1,85 2,00 0,05 1,67 0,16 0,55 6,34
L 0,58 0,05 0,07 0,10 0,09 0,89 1,78
M 0,03 0,03
N 0,09 0,05 0,14
P 1,00 0,08 6,35 1,48 1,11 0,44 0,25 0,70 11,41
Q 0,47 0,21 0,01 0,34 32,72 0,01 0,51 0,71 0,19 5,24 0,33 40,74
R 0,13 0,03 0,07 2,86 0,25 1,97 1,62 0,04 0,97 0,02 0,60 3,62 12,18
S 0,16 0,43 0,51 0,83 0,95 1,43 0,13 0,04 0,02 4,50
T 0,07 0,07
V 0,48 0,48
W 0,00
Y 3,97 0,03 0,21 0,51 4,72
Total 1,40 0,00 1,59 1,41 2,94 44,17 5,91 2,32 3,00 0,37 0,00 0,17 13,75 4,36 3,77 11,50 0,07 0,52 0,00 2,70 100

170
Supplemental Table 15: Contingency table for N-terminal of identified NSGP in controls.
The amino acids are represented in one letter code
% A C D E F G H I K L M N P Q R S T V W Y Total
A 0,74 0,35 0,31 0,15 1,23 0,26 0,15 0,05 0,58 0,25 0,70 0,16 0,71 0,31 5,95
C 0,10 0,06 0,11 0,25 0,52
D 0,11 0,76 0,11 0,06 0,09 0,73 0,36 0,09 0,21 2,52
E 0,84 0,20 0,97 0,05 0,30 0,34 0,46 0,21 1,37 0,11 0,03 0,26 0,51 0,44 0,21 6,30
F 0,31 0,06 0,13 0,46 0,71 0,25 0,79 0,11 2,82
G 0,94 0,33 1,28 1,09 0,20 0,23 0,10 2,02 0,26 0,24 8,70 0,58 0,81 0,57 0,45 1,32 0,20 19,32
H 0,19 0,03 0,11 0,57 0,30 0,14 0,05 1,39
I 0,25 0,44 0,89 0,18 0,15 0,33 0,21 0,14 0,17 2,76
K 0,25 2,33 0,51 2,19 1,01 0,32 0,16 0,70 7,47
L 0,72 0,25 0,88 0,03 0,34 0,11 0,27 0,65 2,70 0,60 1,57 0,40 0,05 8,57
M 0,03 0,18 0,34 0,16 0,03 0,74
N 0,03 0,31 0,05 0,06 0,11 0,09 0,12 0,77
P 0,75 0,18 0,11 1,23 0,21 10,76 0,53 1,12 0,44 0,79 4,19 0,56 1,50 0,36 0,53 1,76 25,02
Q 0,03 0,84 0,30 0,05 0,05 0,11 0,23 1,61
R 0,30 0,11 1,37 0,03 0,06 0,20 0,06 0,52 0,35 0,09 0,14 0,10 3,33
S 0,29 0,21 0,24 0,09 1,59 0,46 0,14 0,20 0,17 0,06 0,03 0,97 4,45
T 0,20 0,49 1,05 0,15 0,09 0,35 0,11 2,44
V 0,31 0,06 0,05 0,41 0,25 0,09 0,21 0,12 0,88 0,36 0,42 0,36 3,52
W 0,10 0,10
Y 0,11 0,05 0,10 0,25 0,51
Total 4,89 0,56 2,79 4,45 2,23 22,69 0,17 2,18 3,15 3,70 2,47 2,24 24,59 4,32 5,40 2,97 4,20 5,26 1,65 0,20 100
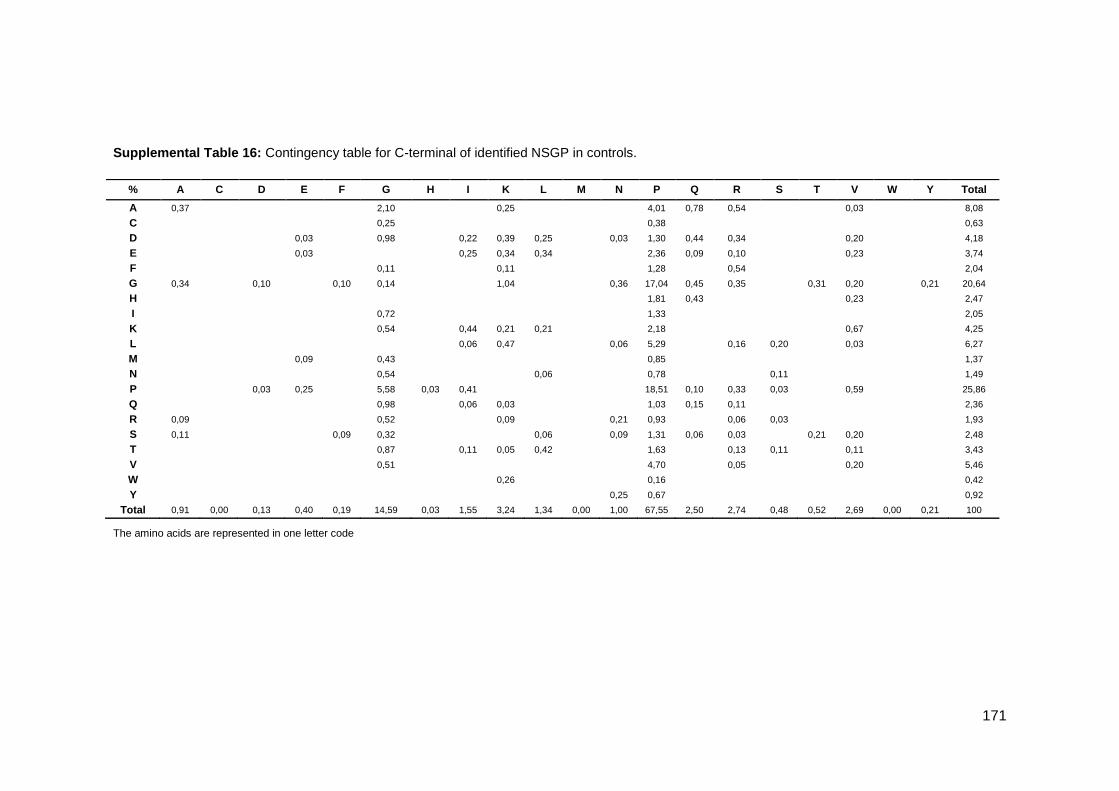
171
Supplemental Table 16: Contingency table for C-terminal of identified NSGP in controls.
The amino acids are represented in one letter code
% A C D E F G H I K L M N P Q R S T V W Y Total
A 0,37 2,10 0,25 4,01 0,78 0,54 0,03 8,08
C 0,25 0,38 0,63
D 0,03 0,98 0,22 0,39 0,25 0,03 1,30 0,44 0,34 0,20 4,18
E 0,03 0,25 0,34 0,34 2,36 0,09 0,10 0,23 3,74
F 0,11 0,11 1,28 0,54 2,04
G 0,34 0,10 0,10 0,14 1,04 0,36 17,04 0,45 0,35 0,31 0,20 0,21 20,64
H 1,81 0,43 0,23 2,47
I 0,72 1,33 2,05
K 0,54 0,44 0,21 0,21 2,18 0,67 4,25
L 0,06 0,47 0,06 5,29 0,16 0,20 0,03 6,27
M 0,09 0,43 0,85 1,37
N 0,54 0,06 0,78 0,11 1,49
P 0,03 0,25 5,58 0,03 0,41 18,51 0,10 0,33 0,03 0,59 25,86
Q 0,98 0,06 0,03 1,03 0,15 0,11 2,36
R 0,09 0,52 0,09 0,21 0,93 0,06 0,03 1,93
S 0,11 0,09 0,32 0,06 0,09 1,31 0,06 0,03 0,21 0,20 2,48
T 0,87 0,11 0,05 0,42 1,63 0,13 0,11 0,11 3,43
V 0,51 4,70 0,05 0,20 5,46
W 0,26 0,16 0,42
Y 0,25 0,67 0,92
Total 0,91 0,00 0,13 0,40 0,19 14,59 0,03 1,55 3,24 1,34 0,00 1,00 67,55 2,50 2,74 0,48 0,52 2,69 0,00 0,21 100

172
Supplemental Table 17: Contingency table for N-terminal of identified NSGP in diabetic patients.
The amino acids are represented in one letter code
% A C D E F G H I K L M N P Q R S T V W Y Total
A 0,60 0,17 0,70 0,27 2,40 0,40 0,36 0,39 0,02 0,03 1,42 0,59 0,11 0,32 0,18 0,43 0,02 8,41
C 0,02 0,18 0,02 0,03 0,25
D 0,10 1,51 0,10 0,24 0,02 0,10 0,18 0,57 0,10 0,20 0,15 3,27
E 0,18 0,26 0,05 0,10 0,20 0,89 0,95 0,10 0,36 0,14 0,29 3,52
F 0,10 0,23 0,07 0,40 0,03 0,45 0,13 0,03 0,13 1,57
G 3,34 0,07 1,18 1,87 1,70 0,29 0,46 0,75 1,53 0,15 0,46 6,03 1,48 1,28 0,73 0,29 1,24 0,02 0,20 23,07
H 0,13 0,04 0,02 0,26 0,12 0,10 0,09 0,12 0,13 0,02 1,03
I 0,10 0,30 0,05 0,45 0,19 0,13 0,22 0,16 0,18 0,17 0,10 0,20 0,25 2,50
K 0,61 0,03 0,04 0,14 2,74 0,02 0,14 0,58 0,07 0,27 0,32 0,62 5,58
L 0,17 0,10 0,14 0,16 0,02 0,28 0,02 0,03 0,96 0,19 0,33 0,84 0,03 0,37 0,28 0,27 0,06 4,25
M 0,15 0,63 0,13 0,09 0,15 1,15
N 0,15 0,03 0,03 0,17 0,19 0,18 0,02 0,77
P 1,15 0,02 0,87 9,73 0,25 0,15 0,77 0,50 0,04 4,96 0,59 0,77 1,91 1,10 0,95 0,24 24,00
Q 0,12 0,02 0,03 1,84 0,02 0,14 0,07 1,72 0,21 0,11 0,10 0,15 0,02 0,10 4,65
R 0,15 0,02 0,30 0,37 0,18 2,61 0,14 0,11 0,17 0,89 0,18 0,36 0,26 0,21 0,07 0,20 6,22
S 0,51 0,22 0,34 0,08 0,08 0,07 0,10 0,63 0,11 0,45 0,09 0,05 0,33 0,47 0,18 3,71
T 0,17 0,02 0,20 0,23 0,36 0,06 0,40 0,12 0,35 0,03 0,17 0,13 0,00 0,71 0,03 2,98
V 0,19 0,15 0,37 0,26 0,14 0,20 0,13 0,13 0,81 0,07 0,18 0,18 0,15 0,06 0,08 0,06 3,16
W 0,03 0,03
Y 0,09 0,15 0,02 0,06 0,15 0,10 0,20 0,77
Total 7,68 0,58 3,60 5,22 2,13 23,35 0,43 2,52 4,95 4,45 1,11 1,02 20,17 3,89 4,36 5,19 3,04 5,12 0,79 1,29 100
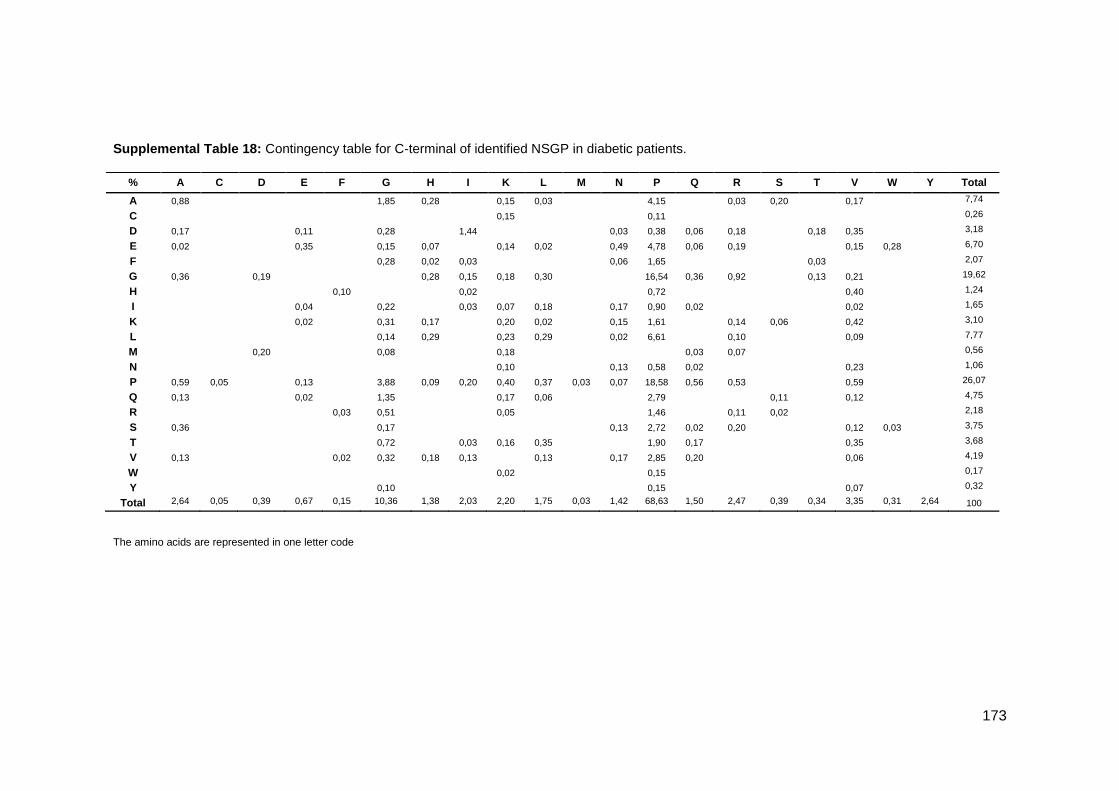
173
Supplemental Table 18: Contingency table for C-terminal of identified NSGP in diabetic patients.
The amino acids are represented in one letter code
% A C D E F G H I K L M N P Q R S T V W Y Total
A 0,88 1,85 0,28 0,15 0,03 4,15 0,03 0,20 0,17 7,74
C 0,15 0,11 0,26
D 0,17 0,11 0,28 1,44 0,03 0,38 0,06 0,18 0,18 0,35 3,18
E 0,02 0,35 0,15 0,07 0,14 0,02 0,49 4,78 0,06 0,19 0,15 0,28 6,70
F 0,28 0,02 0,03 0,06 1,65 0,03 2,07
G 0,36 0,19 0,28 0,15 0,18 0,30 16,54 0,36 0,92 0,13 0,21 19,62
H 0,10 0,02 0,72 0,40 1,24
I 0,04 0,22 0,03 0,07 0,18 0,17 0,90 0,02 0,02 1,65
K 0,02 0,31 0,17 0,20 0,02 0,15 1,61 0,14 0,06 0,42 3,10
L 0,14 0,29 0,23 0,29 0,02 6,61 0,10 0,09 7,77
M 0,20 0,08 0,18 0,03 0,07 0,56
N 0,10 0,13 0,58 0,02 0,23 1,06
P 0,59 0,05 0,13 3,88 0,09 0,20 0,40 0,37 0,03 0,07 18,58 0,56 0,53 0,59 26,07
Q 0,13 0,02 1,35 0,17 0,06 2,79 0,11 0,12 4,75
R 0,03 0,51 0,05 1,46 0,11 0,02 2,18
S 0,36 0,17 0,13 2,72 0,02 0,20 0,12 0,03 3,75
T 0,72 0,03 0,16 0,35 1,90 0,17 0,35 3,68
V 0,13 0,02 0,32 0,18 0,13 0,13 0,17 2,85 0,20 0,06 4,19
W 0,02 0,15 0,17
Y 0,10 0,15 0,07 0,32
Total 2,64 0,05 0,39 0,67 0,15 10,36 1,38 2,03 2,20 1,75 0,03 1,42 68,63 1,50 2,47 0,39 0,34 3,35 0,31 2,64 100
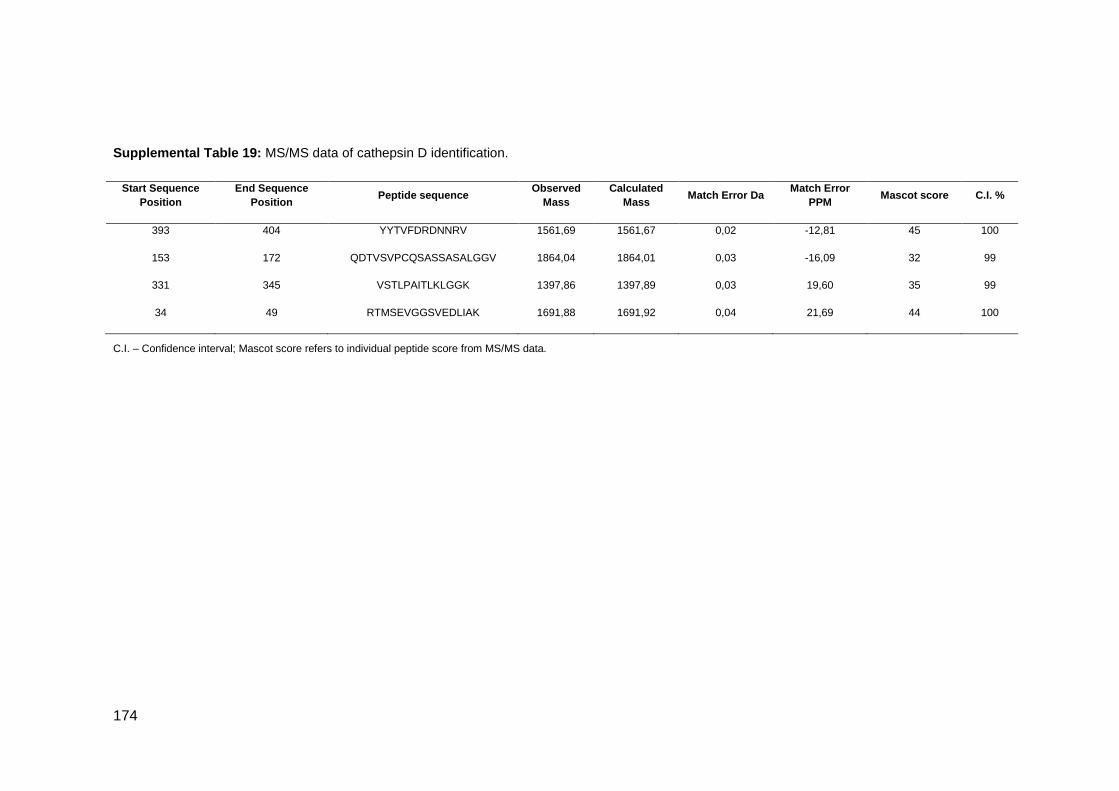
174
Supplemental Table 19: MS/MS data of cathepsin D identification.
Start Sequence
Position
End Sequence
Position Peptide sequence
Observed
Mass
Calculated
Mass Match Error Da
Match Error
PPM Mascot score C.I. %
393 404 YYTVFDRDNNRV 1561,69 1561,67 0,02 -12,81 45 100
153 172 QDTVSVPCQSASSASALGGV 1864,04 1864,01 0,03 -16,09 32 99
331 345 VSTLPAITLKLGGK 1397,86 1397,89 0,03 19,60 35 99
34 49 RTMSEVGGSVEDLIAK 1691,88 1691,92 0,04 21,69 44 100
C.I. – Confidence interval; Mascot score refers to individual peptide score from MS/MS data.
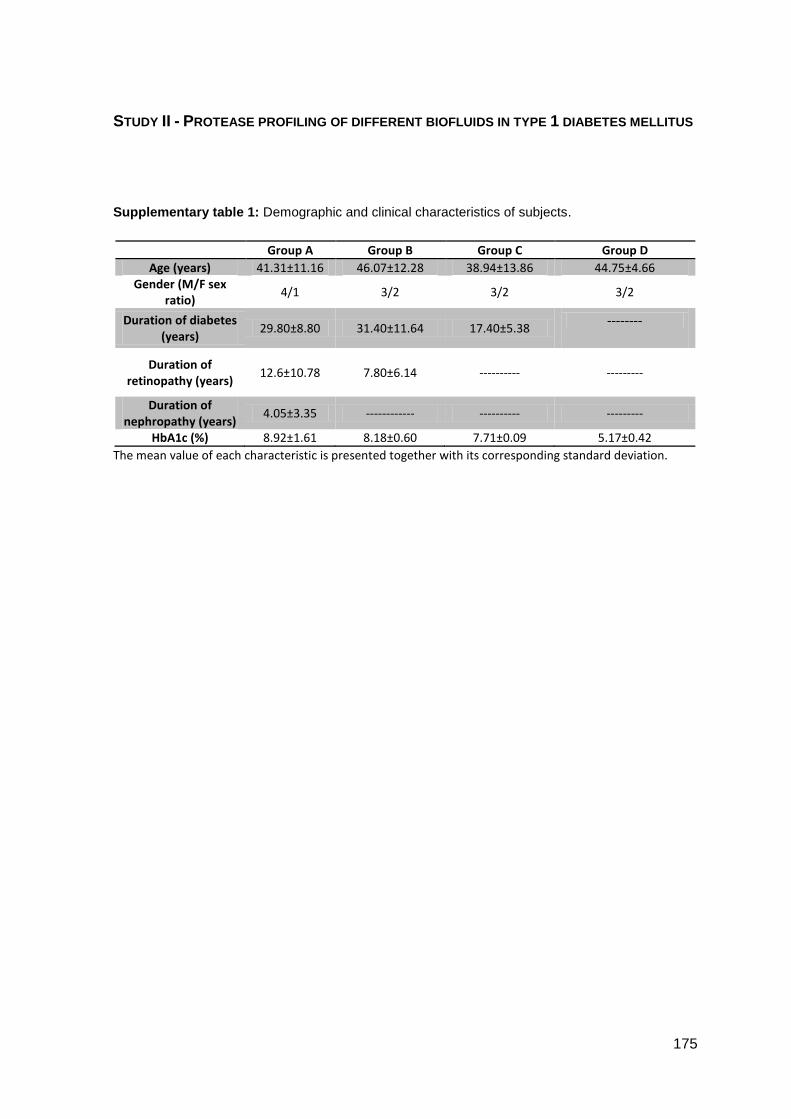
175
STUDY II - PROTEASE PROFILING OF DIFFERENT BIOFLUIDS IN TYPE 1 DIABETES MELLITUS
Supplementary table 1: Demographic and clinical characteristics of subjects.
Group A Group B Group C Group D
Age (years) 41.31±11.16 46.07±12.28 38.94±13.86 44.75±4.66 Gender (M/F sex
ratio) 4/1 3/2 3/2 3/2
Duration of diabetes (years)
29.80±8.80 31.40±11.64 17.40±5.38 --------
Duration of retinopathy (years)
12.6±10.78
7.80±6.14 ---------- ---------
Duration of nephropathy (years)
4.05±3.35 ------------ ---------- ---------
HbA1c (%) 8.92±1.61 8.18±0.60 7.71±0.09 5.17±0.42
The mean value of each characteristic is presented together with its corresponding standard deviation.

176

177
STUDY III - SALIVARY PROTEOME AND PEPTIDOME PROFILING IN TYPE 1 DIABETES MELLITUS USING A QUANTITATIVE APPROACH
Supplementary table S1: Proteins differentially regulated between T1D-R+N/Ctrl; T1D-R/Ctrl and T1D/Ctrl (Protscore refers to ProteinPilot score).
Protscore %
Coverage Accession Gene ID Name Peptides (95%)
T1D-R+N /Ctrl
p value
T1D-R /Ctrl
p value
T1D /Ctrl
p value
9,16 15.9 P01023 A2MG_HUMAN Alpha-2-macroglobulin 6 3.1108 0.0098
127,62 93 P04745 AMY1_HUMAN Alpha-amylase 1 362
1.8948 0.0000
11.26 20.5 Q6ZME0 Q6ZME0_HUMAN Bactericidal/permeability-increasing protein-like 1 6 1.3569 0.0207 1.4129 0.0176 1.7707 0.0359
3,2 26.6 Q6EZE9 Q6EZE9_HUMAN Defensin, alpha 3, neutrophil-specific 2 1.6206 0.0071
0.4982 0.0026
15,04 31.6 Q9UGM3 DMBT1_HUMAN Deleted in malignant brain tumors 1 protein 13
0.6656 0.0010 0.6247 0.0090
2,2 6.9 Q2TSD0 Q2TSD0_HUMAN Glyceraldehyde-3-phosphate dehydrogenase 3 1.7718 0.0496
7.97 32.0 Q6GMX6 Q6GMX6_HUMAN IGH@ protein 7 1.3964 0.0497
6.45 17.9 KLK1 KLK1_HUMAN Kallikrein-1 6 0.4763 0.0159
15,04 44 P22079 PERL_HUMAN Lactoperoxidase 12 1.6242 0.0009
2.37 17.9 P30740 ILEU_HUMAN Leukocyte elastase inhibitor 6 1.3157 0.0472
5,49 8.6 Q59GX5 Q59GX5_HUMAN L-plastin variant (Fragment) 4 1.8157 0.0036 1.4002 0.0331
6,38 37.8 B2R4C5 B2R4C5_HUMAN Lysozyme C 5
5.4841 0.0341
2,16 14.9 P14780 MMP9_HUMAN Matrix metalloproteinase-9 3 1.7854 0.0250
24,4 22.7 Q9HC84 MUC5B_HUMAN Mucin-5B 17
1.3125 0.0129
5,98 29.2 Q8TAX7 MUC7_HUMAN Mucin-7 5 3.8097 0.0081
6,17 39 P08246 ELNE_HUMAN Neutrophil elastase 7 1.5345 0.0386
7,11 49 C3PTT6 C3PTT6_HUMAN Pancreatic adenocarcinoma upregulated factor 14 1.7223 0.0041 1.2514 0.0169 2.3395 0.0009
3,8 14.8 P13796 PLSL_HUMAN Plastin-2 4 1.8379 0.0038 1.3734 0.0363
12 56.2 P12273 PIP_HUMAN Prolactin-inducible protein 14
2.5702 0.0263
25,22 78.5 P05109 S10A8_HUMAN Protein S100-A8 19 1.9484 0.0007 1.7727 0.0004
17,28 95.6 P06702 S10A9_HUMAN Protein S100-A9 24 1.5670 0.0143 1.4814 0.0064
37,05 60.8 P02768 ALBU_HUMAN Serum albumin 54 1.3098 0.0000
25,83 49.1 Q6P5S2 CF058_HUMAN UPF0762 protein C6orf58 28
2.1725 0.0328
20,83 55.7 P25311 ZA2G_HUMAN Zinc-alpha-2-glycoprotein 20 1.7030 0.0026
10,01 59.6 Q96DA0 ZG16B_HUMAN Zymogen granule protein 16 homolog B 18 1.7233 0.0003 2.0279 0.0005
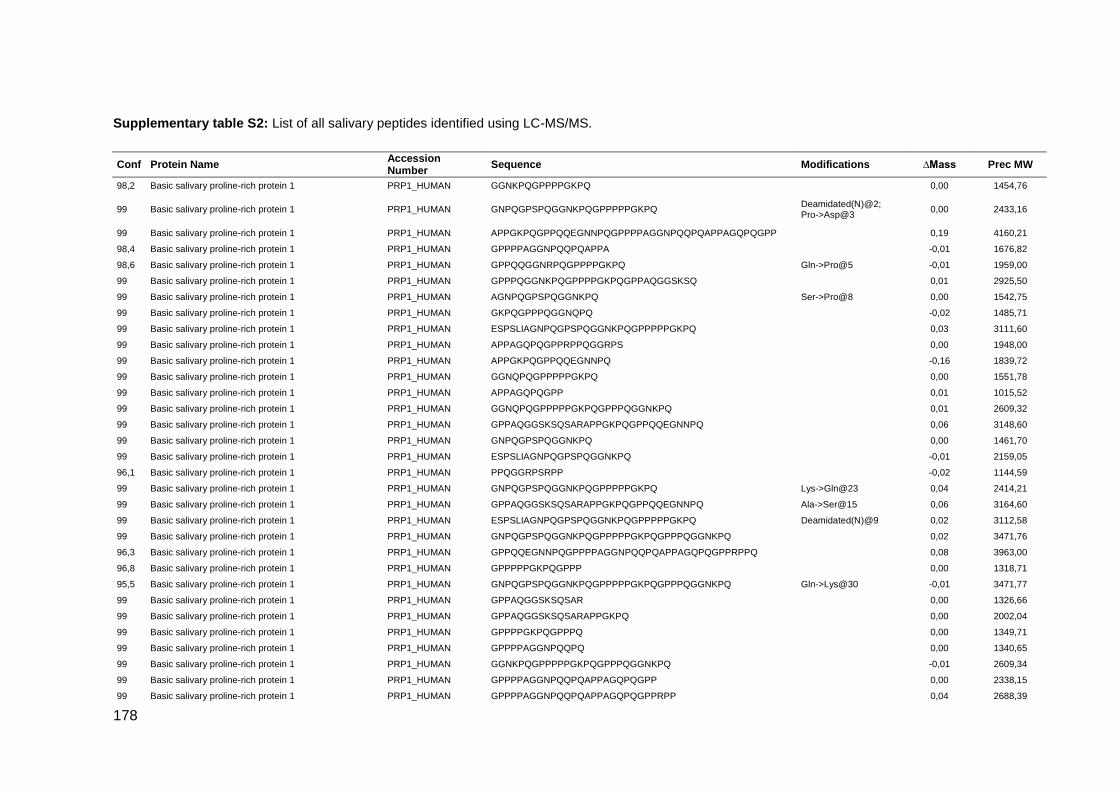
178
Supplementary table S2: List of all salivary peptides identified using LC-MS/MS.
Conf Protein Name Accession Number
Sequence Modifications ∆Mass Prec MW
98,2 Basic salivary proline-rich protein 1 PRP1_HUMAN GGNKPQGPPPPGKPQ
0,00 1454,76
99 Basic salivary proline-rich protein 1 PRP1_HUMAN GNPQGPSPQGGNKPQGPPPPPGKPQ Deamidated(N)@2; Pro->Asp@3
0,00 2433,16
99 Basic salivary proline-rich protein 1 PRP1_HUMAN APPGKPQGPPQQEGNNPQGPPPPAGGNPQQPQAPPAGQPQGPP
0,19 4160,21
98,4 Basic salivary proline-rich protein 1 PRP1_HUMAN GPPPPAGGNPQQPQAPPA
-0,01 1676,82
98,6 Basic salivary proline-rich protein 1 PRP1_HUMAN GPPQQGGNRPQGPPPPGKPQ Gln->Pro@5 -0,01 1959,00
99 Basic salivary proline-rich protein 1 PRP1_HUMAN GPPPQGGNKPQGPPPPGKPQGPPAQGGSKSQ
0,01 2925,50
99 Basic salivary proline-rich protein 1 PRP1_HUMAN AGNPQGPSPQGGNKPQ Ser->Pro@8 0,00 1542,75
99 Basic salivary proline-rich protein 1 PRP1_HUMAN GKPQGPPPQGGNQPQ
-0,02 1485,71
99 Basic salivary proline-rich protein 1 PRP1_HUMAN ESPSLIAGNPQGPSPQGGNKPQGPPPPPGKPQ
0,03 3111,60
99 Basic salivary proline-rich protein 1 PRP1_HUMAN APPAGQPQGPPRPPQGGRPS
0,00 1948,00
99 Basic salivary proline-rich protein 1 PRP1_HUMAN APPGKPQGPPQQEGNNPQ
-0,16 1839,72
99 Basic salivary proline-rich protein 1 PRP1_HUMAN GGNQPQGPPPPPGKPQ
0,00 1551,78
99 Basic salivary proline-rich protein 1 PRP1_HUMAN APPAGQPQGPP
0,01 1015,52
99 Basic salivary proline-rich protein 1 PRP1_HUMAN GGNQPQGPPPPPGKPQGPPPQGGNKPQ
0,01 2609,32
99 Basic salivary proline-rich protein 1 PRP1_HUMAN GPPAQGGSKSQSARAPPGKPQGPPQQEGNNPQ
0,06 3148,60
99 Basic salivary proline-rich protein 1 PRP1_HUMAN GNPQGPSPQGGNKPQ
0,00 1461,70
99 Basic salivary proline-rich protein 1 PRP1_HUMAN ESPSLIAGNPQGPSPQGGNKPQ
-0,01 2159,05
96,1 Basic salivary proline-rich protein 1 PRP1_HUMAN PPQGGRPSRPP
-0,02 1144,59
99 Basic salivary proline-rich protein 1 PRP1_HUMAN GNPQGPSPQGGNKPQGPPPPPGKPQ Lys->Gln@23 0,04 2414,21
99 Basic salivary proline-rich protein 1 PRP1_HUMAN GPPAQGGSKSQSARAPPGKPQGPPQQEGNNPQ Ala->Ser@15 0,06 3164,60
99 Basic salivary proline-rich protein 1 PRP1_HUMAN ESPSLIAGNPQGPSPQGGNKPQGPPPPPGKPQ Deamidated(N)@9 0,02 3112,58
99 Basic salivary proline-rich protein 1 PRP1_HUMAN GNPQGPSPQGGNKPQGPPPPPGKPQGPPPQGGNKPQ
0,02 3471,76
96,3 Basic salivary proline-rich protein 1 PRP1_HUMAN GPPQQEGNNPQGPPPPAGGNPQQPQAPPAGQPQGPPRPPQ
0,08 3963,00
96,8 Basic salivary proline-rich protein 1 PRP1_HUMAN GPPPPPGKPQGPPP
0,00 1318,71
95,5 Basic salivary proline-rich protein 1 PRP1_HUMAN GNPQGPSPQGGNKPQGPPPPPGKPQGPPPQGGNKPQ Gln->Lys@30 -0,01 3471,77
99 Basic salivary proline-rich protein 1 PRP1_HUMAN GPPAQGGSKSQSAR
0,00 1326,66
99 Basic salivary proline-rich protein 1 PRP1_HUMAN GPPAQGGSKSQSARAPPGKPQ
0,00 2002,04
99 Basic salivary proline-rich protein 1 PRP1_HUMAN GPPPPGKPQGPPPQ
0,00 1349,71
99 Basic salivary proline-rich protein 1 PRP1_HUMAN GPPPPAGGNPQQPQ
0,00 1340,65
99 Basic salivary proline-rich protein 1 PRP1_HUMAN GGNKPQGPPPPPGKPQGPPPQGGNKPQ
-0,01 2609,34
99 Basic salivary proline-rich protein 1 PRP1_HUMAN GPPPPAGGNPQQPQAPPAGQPQGPP
0,00 2338,15
99 Basic salivary proline-rich protein 1 PRP1_HUMAN GPPPPAGGNPQQPQAPPAGQPQGPPRPP
0,04 2688,39

179
99 Basic salivary proline-rich protein 1 PRP1_HUMAN GPPPPGKPQGPPPQGDKSQSPRSPPGKPQ
0,06 2896,56
99 Basic salivary proline-rich protein 1 PRP1_HUMAN GPPPPGKPQGPPAQGGSKSQSA
-0,04 2025,98
99 Basic salivary proline-rich protein 1 PRP1_HUMAN GPPPPAGGNPQQPQAPPAGQPQGPPRPPQ Deamidated(N)@9 0,04 2817,43
99 Basic salivary proline-rich protein 1 PRP1_HUMAN GPPPPGKPQGPPAQGGSKSQ
-0,39 1867,56
99 Basic salivary proline-rich protein 1 PRP1_HUMAN GPPPPGKPQGPPPQGDKSQSP
0,00 2049,02
99 Basic salivary proline-rich protein 1 PRP1_HUMAN GPPPPAGGNPQQPQAPPAGQPQGPPRPPQGGRPS
0,08 3270,72
99 Basic salivary proline-rich protein 1 PRP1_HUMAN GPPPQGGNQPQGPPPPPGKPQGPPPQGGNKPQ Gln->Lys@21 -0,01 3085,57
98,3 Basic salivary proline-rich protein 1 PRP1_HUMAN PPGKPQGPPPQGGNQPQ
-0,15 1679,69
99 Basic salivary proline-rich protein 1 PRP1_HUMAN GPPPQGDKSRSPQSPPGKPQ Pro->Asp@4; Deamidated(Q)@5
-0,01 2059,98
99 Basic salivary proline-rich protein 1 PRP1_HUMAN GPPPPPGKPQGPPPQGGNKPQGPPPPGKPQ
0,00 2883,52
99 Basic salivary proline-rich protein 1 PRP1_HUMAN GPPPPAGGNPQQPQAPPAGQPQGPPRPPQG
0,04 2873,47
99 Basic salivary proline-rich protein 1 PRP1_HUMAN GPPPQGDKSRSP
0,00 1221,61
98,8 Basic salivary proline-rich protein 1 PRP1_HUMAN GGNQPQGPPPPPGKPQGPPQQ
0,01 2059,03
99 Basic salivary proline-rich protein 1 PRP1_HUMAN GPPPQGDKSRSPQ
0,00 1349,67
99 Basic salivary proline-rich protein 1 PRP1_HUMAN GPPPPGKPQGPPAQGGSKSQSARAPPGKPQGPPQQEGNNPQ
0,10 4004,10
98,9 Basic salivary proline-rich protein 1 PRP1_HUMAN GPPPQGGNKPQGPPPPGKPQGPPPQGDKS Gln->Arg@25 -0,03 2822,43
99 Basic salivary proline-rich protein 1 PRP1_HUMAN GPPPQGDKSRSPQSPPGKPQ
0,00 2041,03
99 Basic salivary proline-rich protein 1 PRP1_HUMAN GPPPPPGKPQGPPPQGGNKPQ Lys->Arg@19 0,00 2056,06
96,6 Basic salivary proline-rich protein 1 PRP1_HUMAN GPPPQGGNKPQ
0,00 1075,54
97,8 Basic salivary proline-rich protein 1 PRP1_HUMAN GPPPPGKPQGPPPQ Pro->Ala@12 0,00 1323,69
96,4 Basic salivary proline-rich protein 1 PRP1_HUMAN SPRSPPGKPQGPPPQGGNQPQ
0,01 2107,06
99 Basic salivary proline-rich protein 1 PRP1_HUMAN GPPPQGDKSRSPR
0,00 1377,71
99 Basic salivary proline-rich protein 1 PRP1_HUMAN GPPPPGKPQGPPPQGDKSRSPQSPPGKPQ
0,02 2896,52
99 Basic salivary proline-rich protein 1 PRP1_HUMAN GPPPQGGNKPQGPPPPGKPQ
-0,01 1930,99
99 Basic salivary proline-rich protein 1 PRP1_HUMAN GPPPQGDKSQSPR
0,01 1349,68
99 Basic salivary proline-rich protein 1 PRP1_HUMAN GPPPQGDKSRSPQSPPGKPQGPPPQGGNQPQ
0,04 3098,56
99 Basic salivary proline-rich protein 1 PRP1_HUMAN GPPPQGGNKPQGPPPPGKPQGPPPQGDKSQS Ser->Met@29; Deamidated(Q)@30; Phospho(S)@31
0,15 3134,62
99 Basic salivary proline-rich protein 1 PRP1_HUMAN PPPAGGNPQQPQAPPAGQPQGPP
-0,01 2184,06
99 Basic salivary proline-rich protein 1 PRP1_HUMAN GPPPQGGNQPQGPPPPPGKPQ
0,00 2028,01
99 Basic salivary proline-rich protein 1 PRP1_HUMAN GPPPQGGNQPQGPPPPPGKPQGPPPQ
0,03 2504,29
99 Basic salivary proline-rich protein 1 PRP1_HUMAN GPPPQGGNQPQGPPPPPGKPQGPPPQGGNKPQ Lys->Gln@30 0,07 3085,58
99 Basic salivary proline-rich protein 1 PRP1_HUMAN GPPPQGGNQPQGPPPPPG
0,00 1674,81
99 Basic salivary proline-rich protein 1 PRP1_HUMAN GPPPQGGNQPQGPPPPPGKPQGPPPQGGNKPQGPPPPGKPQ Deamidated(N)@29; Amidated@C-term
0,09 3941,10
99 Basic salivary proline-rich protein 1 PRP1_HUMAN GPPQQEGNNPQ
0,01 1164,52
96,2 Basic salivary proline-rich protein 1 PRP1_HUMAN GPPPPGKPQGPPPQGDKSQSPR Lys->Arg@17 0,03 2233,16
99 Basic salivary proline-rich protein 1 PRP1_HUMAN GPPQQEGNNPQGPPPPAGGNPQ
-0,01 2133,98

180
99 Basic salivary proline-rich protein 1 PRP1_HUMAN GPPPQGGNKPQGPPPPGKPQGPPPQGDKSRS Deamidated(Q)@25; Oxidation(R)@30; Phospho(S)@31
0,15 3134,64
99 Basic salivary proline-rich protein 1 PRP1_HUMAN GPPQQEGNNPQGPPPPAGGNPQQPQ Glu->Gln@6; Deamidated(N)@9
0,02 2487,17
99 Basic salivary proline-rich protein 1 PRP1_HUMAN GPPPQGGNQPQ Acetyl@N-term -0,01 1117,51
97,6 Basic salivary proline-rich protein 1 PRP1_HUMAN GPPQQEGNNPQGPPPPAGGNPQQPQAPPAGQPQGPP
0,01 3484,66
98,3 Basic salivary proline-rich protein 1 PRP1_HUMAN GPPPPPGKPQGPPPQG
-0,04 1503,75
99 Basic salivary proline-rich protein 1 PRP1_HUMAN GPPQQEGNNPQGPPPPAGGNPQQPQAPPA
0,01 2823,34
95,3 Basic salivary proline-rich protein 1 PRP1_HUMAN GPPPQGGNKPQGPPPPGKPQGPPPQGDKSRSP
0,02 3134,62
99 Basic salivary proline-rich protein 1 PRP1_HUMAN GPPPQGGNQPQGPPPPPGKPQGPPQQGGNRPQ
0,07 3144,63
99 Basic salivary proline-rich protein 1 PRP1_HUMAN GGNKPQGPPPPPGKPQ
-0,04 1551,77
96,6 Basic salivary proline-rich protein 1 PRP1_HUMAN GGNRPQGPPPPGKPQ
0,00 1482,77
99 Basic salivary proline-rich protein 1 PRP1_HUMAN GPPQQEGNNPQGPPPPAGGNPQQPQAPPAGQPQ
0,07 3233,59
99 Basic salivary proline-rich protein 1 PRP1_HUMAN GPPQQGGNRPQGPPPPGKPQ
0,00 1990,01
95,8 Basic salivary proline-rich protein 1 PRP1_HUMAN GPPRPPQGGRPS
-0,03 1201,60
99 Basic salivary proline-rich protein 1 PRP1_HUMAN SPPGKPQGPPPQGGNQPQGPPPPPGKPQGPPPQGGNKPQ Gln->Lys@12 0,05 3777,00
99 Basic salivary proline-rich protein 1 PRP1_HUMAN GPPRPPQGGRPSRPPQ
0,00 1679,90
96,6 Basic salivary proline-rich protein 1 PRP1_HUMAN GPPPPGKPQGPPPQGDKSRSPR
-0,06 2233,11
99 Basic salivary proline-rich protein 1 PRP1_HUMAN GPPPQGGNQPQGPPPPPGKPQGPPPQGGNKPQGPPPPGKPQ
0,07 3941,08
99 Basic salivary proline-rich protein 1 PRP1_HUMAN GQPQGPPRPPQGGRPS
0,00 1611,83
99 Basic salivary proline-rich protein 1 PRP1_HUMAN GPPQQEGNNPQGPPPPAGGNPQQPQAPPAGQPQGPPRPPQ Glu->Lys@6; Deamidated(N)@20
-0,08 3962,88
99 Basic salivary proline-rich protein 1 PRP1_HUMAN GPPPPPGKPQGPPPQGGNKPQ
0,00 2028,06
99 Basic salivary proline-rich protein 1 PRP1_HUMAN PPQGGRPSRPPQ
0,00 1272,67
99 Basic salivary proline-rich protein 1 PRP1_HUMAN GPPPPAGGNPQQPQAPPAGQPQ
0,01 2087,03
97,8 Basic salivary proline-rich protein 1 PRP1_HUMAN GPPPPPGKPQGPPQQ
0,00 1477,76
99 Basic salivary proline-rich protein 1 PRP1_HUMAN QPQAPPAGQPQGPP
-0,01 1368,67
99 Basic salivary proline-rich protein 1 PRP1_HUMAN GPPQQEGNNPQGPPPPAGGNPQQPQAPPAGQPQGPPRPP
0,08 3834,94
99 Basic salivary proline-rich protein 1 PRP1_HUMAN GPPPPGKPQGPPAQ
0,01 1323,71
98 Basic salivary proline-rich protein 1 PRP1_HUMAN GPPPQGGNKPQGPPPPGKPQGPPAQGGSKSQ Lys->Gln@9 0,05 2925,50
99 Basic salivary proline-rich protein 1 PRP1_HUMAN QPQAPPAGQPQGPPRPPQ
-0,01 1846,93
97,3 Basic salivary proline-rich protein 1 PRP1_HUMAN GNKPQGPPPPGKPQ
-0,02 1397,72
98,1 Basic salivary proline-rich protein 1 PRP1_HUMAN SPPGKPQGPPPQGGNQP Asn->Lys@15 0,00 1652,87
99 Basic salivary proline-rich protein 1 PRP1_HUMAN GPPPQGGNKPQGPPPPGKPQ Lys->Arg@9 0,00 1959,00
99 Basic salivary proline-rich protein 1 PRP1_HUMAN SPPGKPQGPPPQGGNQPQ
-0,16 1766,71
99 Basic salivary proline-rich protein 1 PRP1_HUMAN GPPPPPGKPQ
0,02 970,54
97,7 Basic salivary proline-rich protein 1 PRP1_HUMAN SPPGKPQGPPPQGGNQPQGPPPPPGKPQGPPPQGGNKPQ
0,09 3777,00
99 Basic salivary proline-rich protein 1 PRP1_HUMAN GNPQGPSPQGGNKPQGPPPPPGKPQ Deamidated(N)@2 0,02 2415,21
99 Basic salivary proline-rich protein 1 PRP1_HUMAN SPPGKPQGPPPQGGNQPQGPPPPPGKPQ Lys->Gln@26 0,05 2719,39

181
99 Basic salivary proline-rich protein 1 PRP1_HUMAN GPPPPPGKPQGPPPQ
0,01 1446,77
98,5 Basic salivary proline-rich protein 1 PRP1_HUMAN SPPGKPQGPPPQGGNQPQGPPPPPGKPQGPPPQ
0,05 3195,67
99 Basic salivary proline-rich protein 1 PRP1_HUMAN GPPQQEGNNPQGPPPPAGGNPQQPQAPPAGQPQGPPRPP Deamidated(Q)@5 0,12 3835,96
99 Basic salivary proline-rich protein 1 PRP1_HUMAN SPQSPPGKPQGPPPQGGNQPQ
-0,01 2079,00
99 Basic salivary proline-rich protein 1 PRP1_HUMAN GPPPPAGGNPQQPQAPPAGQPQGPPRPPQGGRPSRPPQ
0,08 3748,99
98,4 Basic salivary proline-rich protein 1 PRP1_HUMAN GPPPPPGKPQGPPQQGGNRPQ
0,00 2087,07
99 Basic salivary proline-rich protein 1 PRP1_HUMAN PSLIAGNPQGP
0,03 1049,58
99 Basic salivary proline-rich protein 1 PRP1_HUMAN SPPGKPQGPPPQGGNQPQGPPPPPG
0,00 2366,18
98,5 Basic salivary proline-rich protein 1 PRP1_HUMAN APPGKPQGPPQQEGNNPQ Pro->Asn@2 0,00 1856,87
99 Basic salivary proline-rich protein 1 PRP1_HUMAN PPQGDKSQSPRSPPGKPQ
0,00 1886,96
99 Basic salivary proline-rich protein 1 PRP1_HUMAN PSPQGGNKPQGPPPPPGKPQGPPPQGGNKPQGPPPPGKPQ Phospho(S)@2; Gln-
>Asp@4 0,13 3941,07
98,7 Basic salivary proline-rich protein 1 PRP1_HUMAN GPPQQEGNNPQGPPPPAGGNPQQPQ
0,01 2487,16
99 Basic salivary proline-rich protein 1 PRP1_HUMAN PPQGDKSRSPQSPPGKPQ
0,00 1886,96
99 Basic salivary proline-rich protein 1 PRP1_HUMAN QGGNKPQGPPPPPGKPQ Gln->pyro-Glu@N-term 0,00 1662,85
99 Basic salivary proline-rich protein 1 PRP1_HUMAN QGPPPQGGNKPQGPPPPGKPQ Gln->Cys@1 0,02 2034,03
99 Basic salivary proline-rich protein 1 PRP1_HUMAN GPPQQGGNRPQGPPPPGKPQGPPPQGDKS Gln->Pro@5 0,05 2822,47
98,9 Basic salivary proline-rich protein 1 PRP1_HUMAN GPPAQGGSKSQSARAPPGKPQ Ala->Ser@15 -0,02 2018,01
99 Basic salivary proline-rich protein 1 PRP1_HUMAN GPPRPPQGGRPSRPP
0,00 1551,84
99 Basic salivary proline-rich protein 1 PRP1_HUMAN QNLNEDVSQEESPSLIAGNPQGPSPQGGNKPQ Gln->pyro-Glu@N-term; Phospho(S)@8
0,08 3378,58
99 Basic salivary proline-rich protein 1 PRP1_HUMAN GPPPQGGNQPQ
0,04 1075,55
99 Basic salivary proline-rich protein 1 PRP1_HUMAN RSPPGKPQGPPPQGGNQPQ Phospho(S)@2; Oxidation(P)@4
0,09 2019,02
99 Basic salivary proline-rich protein 1 PRP1_HUMAN SARAPPGKPQGPPQQEGNNPQ
0,01 2154,06
99 Basic salivary proline-rich protein 1 PRP1_HUMAN KPQGPPPQGGNKPQ
0,00 1428,75
97,9 Basic salivary proline-rich protein 1 PRP1_HUMAN GPPPPAGGNPQQPQAPPAGQPQGPPRPPQ
0,01 2816,42
99 Basic salivary proline-rich protein 1 PRP1_HUMAN SLIAGNPQGPSPQGGNKPQ
0,00 1845,93
99 Basic salivary proline-rich protein 1 PRP1_HUMAN SPPGKPQGPPPQGGNQP Asn->Gln@15 -0,02 1652,81
99 Basic salivary proline-rich protein 1 PRP1_HUMAN GNPQGPSPQGGNKPQGPPPPPGKPQ
0,00 2414,21
99 Basic salivary proline-rich protein 1 PRP1_HUMAN SPPGKPQGPPPQGGNQPQGPPPPPGKPQ
0,02 2719,40
99 Basic salivary proline-rich protein 1 PRP1_HUMAN SPPGKPQGPPPQGGNQPQGPPPPPGKPQ Lys->Glu@5 0,04 2720,37
99 Basic salivary proline-rich protein 1 PRP1_HUMAN SPPGKPQGPPPQGGNQPQGPPPPPGKPQGPPPQGGNKPQG Lys->Ala@37 0,16 3777,03
99 Basic salivary proline-rich protein 1 PRP1_HUMAN PQGPPPPGKPQGPPPQ Gln->Pro@2 0,00 1543,81
99 Basic salivary proline-rich protein 1 PRP1_HUMAN QGPPPPPGKPQGPPPQ Gln->Pro@1 0,00 1543,81
99 Basic salivary proline-rich protein 1 PRP1_HUMAN SPQSPPGKPQGPPPQGGNQPQGPPPPPGKPQ
0,06 3031,58
99 Basic salivary proline-rich protein 1 PRP1_HUMAN GPPPQGDKSQSPRSPPGKPQ
-0,01 2041,03
99 Basic salivary proline-rich protein 1 PRP1_HUMAN SPPGKPQGPPPQGGNQPQGPPPPPGKPQGPPPQGGNKPQ Lys->Arg@37 0,09 3805,01
98 Basic salivary proline-rich protein 1 PRP1_HUMAN APPAGQPQGPPRPPQ
0,00 1493,77
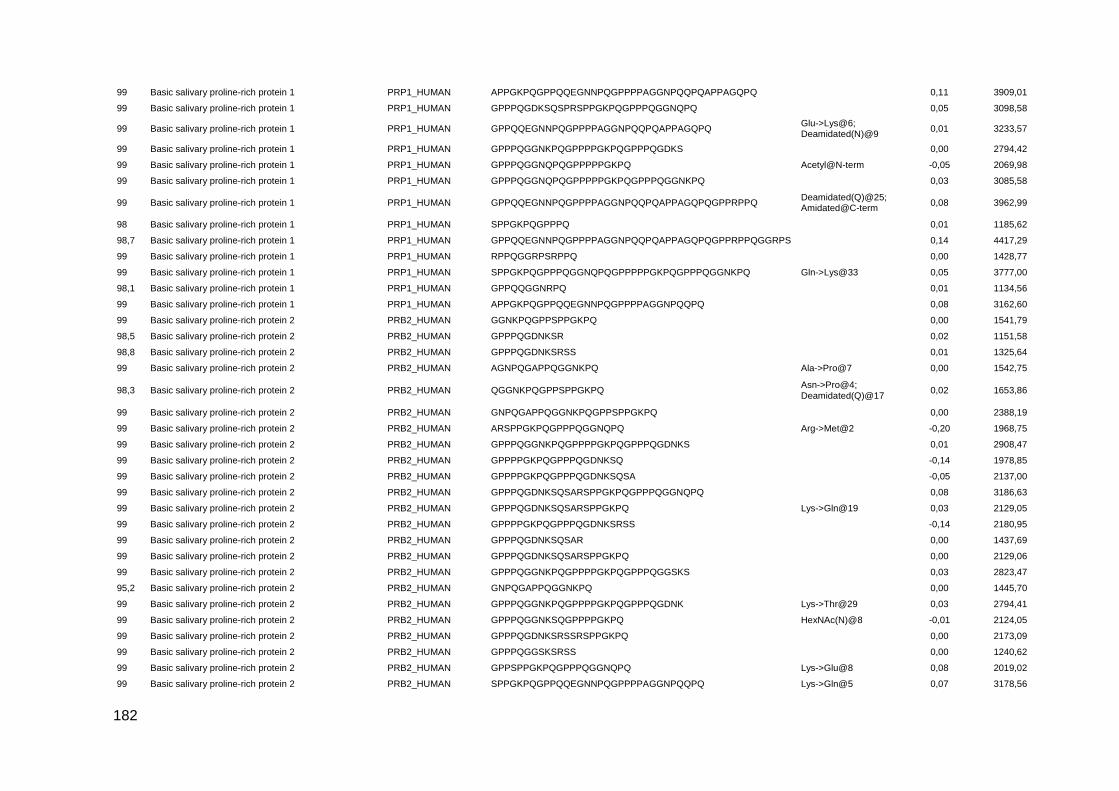
182
99 Basic salivary proline-rich protein 1 PRP1_HUMAN APPGKPQGPPQQEGNNPQGPPPPAGGNPQQPQAPPAGQPQ
0,11 3909,01
99 Basic salivary proline-rich protein 1 PRP1_HUMAN GPPPQGDKSQSPRSPPGKPQGPPPQGGNQPQ
0,05 3098,58
99 Basic salivary proline-rich protein 1 PRP1_HUMAN GPPQQEGNNPQGPPPPAGGNPQQPQAPPAGQPQ Glu->Lys@6; Deamidated(N)@9
0,01 3233,57
99 Basic salivary proline-rich protein 1 PRP1_HUMAN GPPPQGGNKPQGPPPPGKPQGPPPQGDKS
0,00 2794,42
99 Basic salivary proline-rich protein 1 PRP1_HUMAN GPPPQGGNQPQGPPPPPGKPQ Acetyl@N-term -0,05 2069,98
99 Basic salivary proline-rich protein 1 PRP1_HUMAN GPPPQGGNQPQGPPPPPGKPQGPPPQGGNKPQ
0,03 3085,58
99 Basic salivary proline-rich protein 1 PRP1_HUMAN GPPQQEGNNPQGPPPPAGGNPQQPQAPPAGQPQGPPRPPQ Deamidated(Q)@25; Amidated@C-term
0,08 3962,99
98 Basic salivary proline-rich protein 1 PRP1_HUMAN SPPGKPQGPPPQ
0,01 1185,62
98,7 Basic salivary proline-rich protein 1 PRP1_HUMAN GPPQQEGNNPQGPPPPAGGNPQQPQAPPAGQPQGPPRPPQGGRPS
0,14 4417,29
99 Basic salivary proline-rich protein 1 PRP1_HUMAN RPPQGGRPSRPPQ
0,00 1428,77
99 Basic salivary proline-rich protein 1 PRP1_HUMAN SPPGKPQGPPPQGGNQPQGPPPPPGKPQGPPPQGGNKPQ Gln->Lys@33 0,05 3777,00
98,1 Basic salivary proline-rich protein 1 PRP1_HUMAN GPPQQGGNRPQ
0,01 1134,56
99 Basic salivary proline-rich protein 1 PRP1_HUMAN APPGKPQGPPQQEGNNPQGPPPPAGGNPQQPQ
0,08 3162,60
99 Basic salivary proline-rich protein 2 PRB2_HUMAN GGNKPQGPPSPPGKPQ
0,00 1541,79
98,5 Basic salivary proline-rich protein 2 PRB2_HUMAN GPPPQGDNKSR
0,02 1151,58
98,8 Basic salivary proline-rich protein 2 PRB2_HUMAN GPPPQGDNKSRSS
0,01 1325,64
99 Basic salivary proline-rich protein 2 PRB2_HUMAN AGNPQGAPPQGGNKPQ Ala->Pro@7 0,00 1542,75
98,3 Basic salivary proline-rich protein 2 PRB2_HUMAN QGGNKPQGPPSPPGKPQ Asn->Pro@4; Deamidated(Q)@17
0,02 1653,86
99 Basic salivary proline-rich protein 2 PRB2_HUMAN GNPQGAPPQGGNKPQGPPSPPGKPQ
0,00 2388,19
99 Basic salivary proline-rich protein 2 PRB2_HUMAN ARSPPGKPQGPPPQGGNQPQ Arg->Met@2 -0,20 1968,75
99 Basic salivary proline-rich protein 2 PRB2_HUMAN GPPPQGGNKPQGPPPPGKPQGPPPQGDNKS
0,01 2908,47
99 Basic salivary proline-rich protein 2 PRB2_HUMAN GPPPPGKPQGPPPQGDNKSQ
-0,14 1978,85
99 Basic salivary proline-rich protein 2 PRB2_HUMAN GPPPPGKPQGPPPQGDNKSQSA
-0,05 2137,00
99 Basic salivary proline-rich protein 2 PRB2_HUMAN GPPPQGDNKSQSARSPPGKPQGPPPQGGNQPQ
0,08 3186,63
99 Basic salivary proline-rich protein 2 PRB2_HUMAN GPPPQGDNKSQSARSPPGKPQ Lys->Gln@19 0,03 2129,05
99 Basic salivary proline-rich protein 2 PRB2_HUMAN GPPPPGKPQGPPPQGDNKSRSS
-0,14 2180,95
99 Basic salivary proline-rich protein 2 PRB2_HUMAN GPPPQGDNKSQSAR
0,00 1437,69
99 Basic salivary proline-rich protein 2 PRB2_HUMAN GPPPQGDNKSQSARSPPGKPQ
0,00 2129,06
99 Basic salivary proline-rich protein 2 PRB2_HUMAN GPPPQGGNKPQGPPPPGKPQGPPPQGGSKS
0,03 2823,47
95,2 Basic salivary proline-rich protein 2 PRB2_HUMAN GNPQGAPPQGGNKPQ
0,00 1445,70
99 Basic salivary proline-rich protein 2 PRB2_HUMAN GPPPQGGNKPQGPPPPGKPQGPPPQGDNK Lys->Thr@29 0,03 2794,41
99 Basic salivary proline-rich protein 2 PRB2_HUMAN GPPPQGGNKSQGPPPPGKPQ HexNAc(N)@8 -0,01 2124,05
99 Basic salivary proline-rich protein 2 PRB2_HUMAN GPPPQGDNKSRSSRSPPGKPQ
0,00 2173,09
99 Basic salivary proline-rich protein 2 PRB2_HUMAN GPPPQGGSKSRSS
0,00 1240,62
99 Basic salivary proline-rich protein 2 PRB2_HUMAN GPPSPPGKPQGPPPQGGNQPQ Lys->Glu@8 0,08 2019,02
99 Basic salivary proline-rich protein 2 PRB2_HUMAN SPPGKPQGPPQQEGNNPQGPPPPAGGNPQQPQ Lys->Gln@5 0,07 3178,56

183
99 Basic salivary proline-rich protein 2 PRB2_HUMAN GPPSPPGKPQ
0,00 960,51
99 Basic salivary proline-rich protein 2 PRB2_HUMAN QNLNEDVSQEESPSLIAGNPQGAPPQGGNKPQ Gln->pyro-Glu@N-term; Phospho(S)@8; Ala->Ser@23
0,07 3378,57
96,8 Basic salivary proline-rich protein 2 PRB2_HUMAN GPPPPGKPQGPPPQGDNKSQS Gln->Tyr@20; Phospho(S)@21
-0,03 2180,96
99 Basic salivary proline-rich protein 2 PRB2_HUMAN SPPGKPQGPPQQEGNNPQ
-0,17 1855,71
99 Basic salivary proline-rich protein 2 PRB2_HUMAN QGGNKPQGPPSPPGKPQGPPPQGGNQPQ Gln->pyro-Glu@N-term 0,08 2710,40
99 Basic salivary proline-rich protein 2 PRB2_HUMAN SPPGKPQGPPQQEGNNPQGPPPPAGGNPQ
0,05 2825,40
99 Basic salivary proline-rich protein 2 PRB2_HUMAN SPPGKPQGPPQQEGNNPQGPPPPAGGNPQQPQ
0,06 3178,57
99 Basic salivary proline-rich protein 2 PRB2_HUMAN SPPGKPQGPPQQEGNNPQGPPPPAGGNPQQPQAPPAGQPQ
0,16 3925,05
97,1 Basic salivary proline-rich protein 2 PRB2_HUMAN GPPPPGKPQGPPPQGGSKSR
-0,01 1922,01
99 Basic salivary proline-rich protein 2 PRB2_HUMAN SPPGKPQGPPQQEGNNPQGPPPPAGGNPQQPQAPPAGQPQGPP
0,15 4176,16
99 Basic salivary proline-rich protein 2 PRB2_HUMAN SRSPPGKPQGPPPQGGNQPQ Arg->Asp@2 0,00 1968,93
95,9 Basic salivary proline-rich protein 2 PRB2_HUMAN SARSPPGKPQGPPQQEGNNPQ
-0,06 2169,99
97,4 Basic salivary proline-rich protein 2 PRB2_HUMAN GPPPQGGSKSRSA
0,01 1224,63
96,1 Basic salivary proline-rich protein 2 PRB2_HUMAN GPPPPGKPQGPPPQGDNKS
-0,12 1850,80
98 Basic salivary proline-rich protein 2 PRB2_HUMAN SPPGKPQGPPQQE
0,01 1345,67
99 Basic salivary proline-rich protein 2 PRB2_HUMAN GNPQGAPPQGGNKPQ Oxidation(P)@7 0,00 1461,70
96,5 Basic salivary proline-rich protein 2 PRB2_HUMAN GPPPPGKPQGPPPQGDNKSRSS Lys->Gln@7 -0,16 2180,89
99 Basic salivary proline-rich protein 2 PRB2_HUMAN GGNKSQGPPPPGKPQ HexNAc(N)@3 0,00 1647,82
95,6 Basic salivary proline-rich protein 3 PRB3_HUMAN SGKPEGRRPQGGNQPQ
0,00 1691,84
95,5 Basic salivary proline-rich protein 3 PRB3_HUMAN SQGPPPRPGKPEGSPSQGGNKPQ
-0,01 2283,13
98,3 Basic salivary proline-rich protein 3 PRB3_HUMAN SQGPPPHPGKPE Acetyl@N-term -0,05 1268,56
95,4 Basic salivary proline-rich protein 3 PRB3_HUMAN GPPPHPGKPQ
0,01 1010,54
99 Basic salivary proline-rich protein 3 PRB3_HUMAN PGKPEGSPSQGGNKPQGPPPHPGKPQ
-0,02 2556,27
99 Basic salivary proline-rich protein 3 PRB3_HUMAN PQGPPPPGGNPQQPLPPPAG
0,02 1898,98
99 Basic salivary proline-rich protein 3 PRB3_HUMAN GPPPPPQGGRPHRPP
0,00 1542,82
99 Basic salivary proline-rich protein 3 PRB3_HUMAN QSLNEDVSQEESPSVISGKPEGR Gln->pyro-Glu@N-term; Phospho(S)@8
0,00 2534,12
99 Basic salivary proline-rich protein 3 PRB3_HUMAN GPPPPGGNPQQPLPPPAGKPQGPPPPPQGGRPH
0,03 3201,69
99 Basic salivary proline-rich protein 3 PRB3_HUMAN PPPPGRPQGPPPPGGNPQQPLPPPAGKPQ
0,02 2853,53
99 Basic salivary proline-rich protein 3 PRB3_HUMAN PGKPEGSPSQGGNKPQGPPPHPGKPQ Lys->Gln@24 0,03 2556,27
99 Basic salivary proline-rich protein 3 PRB3_HUMAN QSLNEDVSQEESPSVISGKPEGR
Gln->pyro-Glu@N-term; Deamidated(N)@4; Glu->Lys@5; Phospho(S)@8
-0,03 2534,12
99 Basic salivary proline-rich protein 3 PRB3_HUMAN QSQGPPPRPGKPE Gln->pyro-Glu@N-term 0,01 1356,68
99 Basic salivary proline-rich protein 3 PRB3_HUMAN GPPPQEGNKPQRPPPPGRPQ
0,00 2130,11

184
99 Basic salivary proline-rich protein 3 PRB3_HUMAN QSLNEDVSQEESPSVISGKPEGRRPQ Gln->pyro-Glu@N-term; Phospho(S)@8
0,01 2915,34
99 Basic salivary proline-rich protein 3 PRB3_HUMAN QSLNEDVSQEESPSVISGKPEGRRPQ Gln->pyro-Glu@N-term; Phospho(S)@14
0,02 2915,35
99 Basic salivary proline-rich protein 3 PRB3_HUMAN PGKPEGPPPQGGNQSQGPPP HexNAc(N)@13 0,01 2125,01
99 Basic salivary proline-rich protein 3 PRB3_HUMAN QGGRPHRPPQGQPPQ
-0,01 1635,83
99 Basic salivary proline-rich protein 3 PRB3_HUMAN QSQGPPPHPGKPE Gln->pyro-Glu@N-term 0,00 1337,64
99 Basic salivary proline-rich protein 3 PRB3_HUMAN GPPPPGGNPQQPLPPPAGKPQGPPPPPQG
0,00 2754,42
99 Basic salivary proline-rich protein 3 PRB3_HUMAN PGKPEGSPSQGGNKPQ
-0,01 1563,76
99 Basic salivary proline-rich protein 3 PRB3_HUMAN GSPSQGGNKPQGPPPHPGKPQ
0,00 2048,02
99 Basic salivary proline-rich protein 3 PRB3_HUMAN QSLNEDVSQEESPSVISGKPEGRRPQ Dehydrated(D)@6; Phospho(S)@8; Deamidated(Q)@9
0,04 2915,37
99 Basic salivary proline-rich protein 3 PRB3_HUMAN PGKPEGSPSQGGNKPQGPPPHPGKPQ Glu->Gln@5; Deamidated(N)@13
0,02 2556,30
99 Basic salivary proline-rich protein 3 PRB3_HUMAN QSLNEDVSQEESPSVISGKPEGRRPQGGNQPQ Gln->pyro-Glu@N-term; Phospho(S)@8
0,10 3496,68
99 Basic salivary proline-rich protein 3 PRB3_HUMAN QGPPPHPGKPE
0,00 1139,58
99 Basic salivary proline-rich protein 3 PRB3_HUMAN SQGPPPHPGKPEGPPPQ
0,01 1702,85
99 Basic salivary proline-rich protein 3 PRB3_HUMAN QSQGPPPRPGKPE
-0,12 1373,58
98,9 Basic salivary proline-rich protein 3 PRB3_HUMAN GPPPHPGKPE
0,01 1011,52
95,9 Basic salivary proline-rich protein 3 PRB3_HUMAN SQGPPPRPGKPE
-0,11 1245,54
95,9 Basic salivary proline-rich protein 3 PRB3_HUMAN GKPEGRRPQGGNQPQRTPPPPGKP Phospho(T)@17; Lys->Arg@23; Oxidation(P)@24
0,10 2656,41
99 Basic salivary proline-rich protein 3 PRB3_HUMAN GPPPRPGKPEGSPS
0,00 1358,70
99 Basic salivary proline-rich protein 3 PRB3_HUMAN PPPGGNPQQPLPPPAGKPQ
0,01 1872,99
98,9 Basic salivary proline-rich protein 3 PRB3_HUMAN SQGPPPHPGKPE
0,01 1226,61
96 Basic salivary proline-rich protein 3 PRB3_HUMAN QGPPPRPGKPE Gln->pyro-Glu@N-term 0,01 1141,59
97,5 Basic salivary proline-rich protein 3 PRB3_HUMAN PPPPGRPQGPPPPGGNPQ
4,00 1746,88
95,9 Basic salivary proline-rich protein 3 PRB3_HUMAN SQGPPPRPGKPE Deamidated(Q)@2 0,01 1246,64
99 Basic salivary proline-rich protein 3 PRB3_HUMAN GKPEGRRPQGGNQPQ
0,00 1604,81
97,5 Basic salivary proline-rich protein 3 PRB3_HUMAN SQGPPPHPGKPEGPPPQGGNQSQG Gly->Phe@19 0,01 2421,16
99 Basic salivary proline-rich protein 3 PRB3_HUMAN GKPEGRRPQGGNQPQ Lys->Phe@2 -0,08 1623,70
97,8 Basic salivary proline-rich protein 3 PRB3_HUMAN GPPPQEGNKPQRPPPPGRPQ Oxidation(P)@2; Gln->Met@5
-0,01 2149,08
99 Basic salivary proline-rich protein 3 PRB3_HUMAN GPPPPGGNPQQPLPPPA
0,00 1616,83
98,5 Basic salivary proline-rich protein 3 PRB3_HUMAN QGPPPHPGKPE Gln->pyro-Glu@N-term 0,01 1122,55
99 Basic salivary proline-rich protein 3 PRB3_HUMAN GPPPPGGNPQQPLPPPAGKPQGPPPPPQGGRPH Deamidated(Q)@11 0,04 3202,68
95,8 Basic salivary proline-rich protein 3 PRB3_HUMAN QPLPPPAGKPQ
0,00 1128,63

185
98,2 Basic salivary proline-rich protein 3 PRB3_HUMAN GPPPPPQGGRPH Acetyl@N-term -0,05 1234,57
99 Basic salivary proline-rich protein 3 PRB3_HUMAN GPPPPGGNPQQPLPPPAG
-0,01 1673,84
98,9 Basic salivary proline-rich protein 3 PRB3_HUMAN GPPPQEGNKPQ
0,00 1147,57
97,2 Basic salivary proline-rich protein 3 PRB3_HUMAN GRPHRPPQGQPPQ
0,00 1450,76
99 Basic salivary proline-rich protein 3 PRB3_HUMAN GPPPPGGNPQQPLPPPAGKPQ
-0,01 2027,05
99 Basic salivary proline-rich protein 3 PRB3_HUMAN GGRPHRPPQGQPPQ
0,00 1507,77
97,6 Basic salivary proline-rich protein 3 PRB3_HUMAN GPPPPPQGGRPHRPPQGQPP
-0,02 2050,04
97,3 Basic salivary proline-rich protein 3 PRB3_HUMAN GPPPPGGNPQQPLPPPAGKPQGPPPPPQGGRPHRPPQGQPPQ
0,13 4187,30
99 Basic salivary proline-rich protein 3 PRB3_HUMAN GPPPPGGNPQQPLPPPAGKPQGPPPPPQ
0,00 2697,41
99 Basic salivary proline-rich protein 3 PRB3_HUMAN GPPPPPQGGRPHRPPQGQPPQ
0,00 2178,12
99 Basic salivary proline-rich protein 3 PRB3_HUMAN GPPPPGGNPQQPLPPPAGKPQGPPPPPQG Deamidated(Q)@11 0,03 2755,44
99 Basic salivary proline-rich protein 4 PRB4_HUMAN GPPPPGGNPQQPQAPPA
-0,01 1605,78
99 Basic salivary proline-rich protein 4 PRB4_HUMAN GKPEGRRPQGGNQPQRPPPPPGKPQ
0,01 2656,41
99 Basic salivary proline-rich protein 4 PRB4_HUMAN SPPGKPQGPPQQEGNKPQGPPPPGKPQ Glu->Gln@13; Deamidated(Q)@18
0,01 2725,41
99 Basic salivary proline-rich protein 4 PRB4_HUMAN GPPPPGGNPQQPQAPPAGKPQ
0,00 2016,01
99 Basic salivary proline-rich protein 4 PRB4_HUMAN GKPQGPPQQEGNKPQ
0,00 1588,79
99 Basic salivary proline-rich protein 4 PRB4_HUMAN GPPPPGGNPQQPQAPPAGKPQGPPPPPQ Deamidated(N)@8 0,01 2687,35
99 Basic salivary proline-rich protein 4 PRB4_HUMAN GPPPPGGNPQQPQAPPAGKPQGPPPPPQ
0,00 2686,36
99 Basic salivary proline-rich protein 4 PRB4_HUMAN FLISGKPEGRRPQGGNQPQ Leu->Asn@2 -0,02 2066,02
99 Basic salivary proline-rich protein 4 PRB4_HUMAN GPPPPPQGGRPPRPA
0,01 1476,80
99 Basic salivary proline-rich protein 4 PRB4_HUMAN SPPGKPQGPPQQEGNKPQGPPPPGKPQ Lys->Gln@25 0,05 2725,41
99 Basic salivary proline-rich protein 4 PRB4_HUMAN GPPPPGGNPQQPQAPPAGKPQGPPPPPQGGRPP
0,04 3150,65
99 Basic salivary proline-rich protein 4 PRB4_HUMAN GPPPPGKPQGPPPPGGNPQQPQ
-0,03 2125,04
99 Basic salivary proline-rich protein 4 PRB4_HUMAN GPPPPPQGGRPPRPAQGQ
0,00 1789,93
99 Basic salivary proline-rich protein 4 PRB4_HUMAN GPPPPGGNPQQPQAPPAGKPQGPPPPPQGGRPP Pro->Ala@5 0,04 3124,63
99 Basic salivary proline-rich protein 4 PRB4_HUMAN GPPPPPQGGRPPRPAQGQQPPQ
0,00 2240,15
99 Basic salivary proline-rich protein 4 PRB4_HUMAN GPPPQEGNKSRSA
0,00 1323,65
99 Basic salivary proline-rich protein 4 PRB4_HUMAN GPPPPGGNPQQPQAPPAGKPQGPPPPPQGGRPPRPAQGQQPPQ
0,16 4238,33
99 Basic salivary proline-rich protein 4 PRB4_HUMAN GPPQQEGNKPQGPPPPGKPQ
0,00 2034,02
99 Basic salivary proline-rich protein 4 PRB4_HUMAN LISGKPEGRRPQGGNQPQ
0,00 1918,01
99 Basic salivary proline-rich protein 4 PRB4_HUMAN GPPPPPQGGRPPRPAQ
0,00 1604,85
99 Basic salivary proline-rich protein 4 PRB4_HUMAN SQGPPPHPGKPERPPPQGGNQS
0,02 2245,12
99 Basic salivary proline-rich protein 4 PRB4_HUMAN SPPGKPQGPPQQEGNKPQ
-0,13 1869,81
99 Basic salivary proline-rich protein 4 PRB4_HUMAN SPPGKPQGPPQQEGNKPQGPPPPGKPQ
0,02 2725,41
99 Basic salivary proline-rich protein 4 PRB4_HUMAN PPPQGGNQSHRPPPPPGKPE
0,00 2070,04
99 Basic salivary proline-rich protein 4 PRB4_HUMAN PPPPGGNPQQPQAPPAGKPQGPP Pro->Ala@3 -0,03 2184,07
99 Basic salivary proline-rich protein 4 PRB4_HUMAN SQGPPPHPGKPEGPPPQEGNKS
0,00 2218,08
99 Basic salivary proline-rich protein 4 PRB4_HUMAN PPPPGGNPQQPQAPPAGKPQGPPPPPQGGRPP Pro->Gln@4 0,06 3124,65
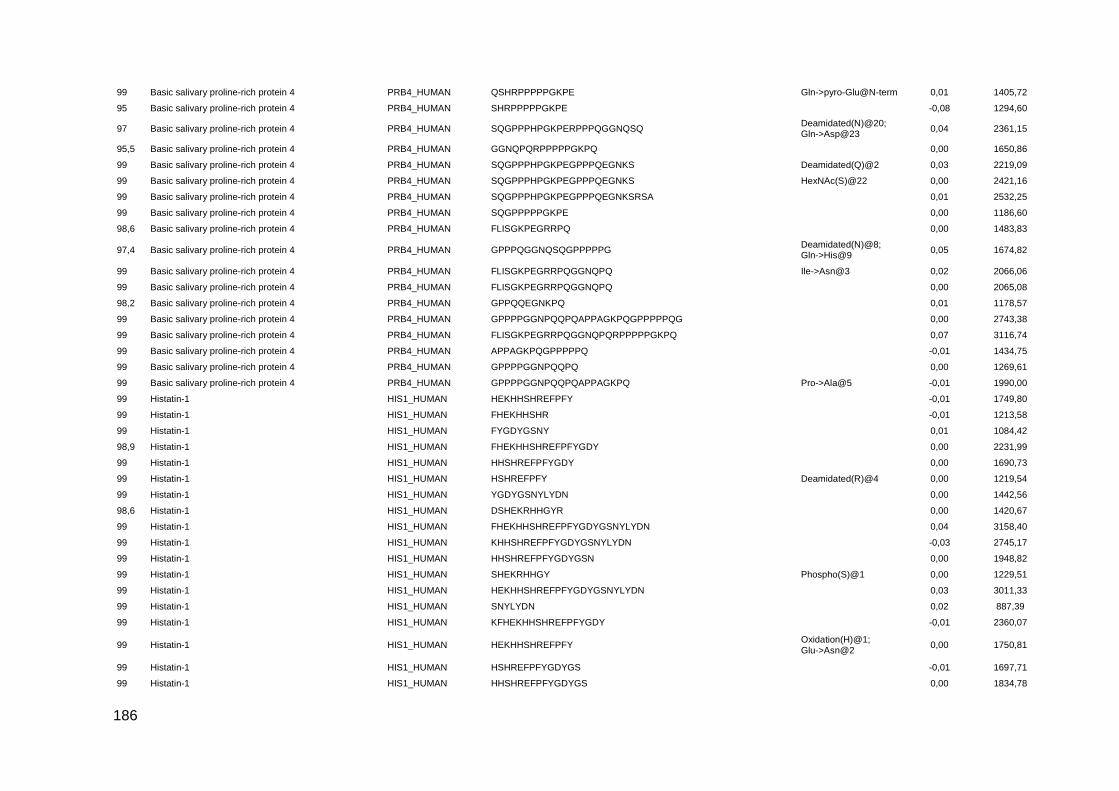
186
99 Basic salivary proline-rich protein 4 PRB4_HUMAN QSHRPPPPPGKPE Gln->pyro-Glu@N-term 0,01 1405,72
95 Basic salivary proline-rich protein 4 PRB4_HUMAN SHRPPPPPGKPE
-0,08 1294,60
97 Basic salivary proline-rich protein 4 PRB4_HUMAN SQGPPPHPGKPERPPPQGGNQSQ Deamidated(N)@20; Gln->Asp@23
0,04 2361,15
95,5 Basic salivary proline-rich protein 4 PRB4_HUMAN GGNQPQRPPPPPGKPQ
0,00 1650,86
99 Basic salivary proline-rich protein 4 PRB4_HUMAN SQGPPPHPGKPEGPPPQEGNKS Deamidated(Q)@2 0,03 2219,09
99 Basic salivary proline-rich protein 4 PRB4_HUMAN SQGPPPHPGKPEGPPPQEGNKS HexNAc(S)@22 0,00 2421,16
99 Basic salivary proline-rich protein 4 PRB4_HUMAN SQGPPPHPGKPEGPPPQEGNKSRSA
0,01 2532,25
99 Basic salivary proline-rich protein 4 PRB4_HUMAN SQGPPPPPGKPE
0,00 1186,60
98,6 Basic salivary proline-rich protein 4 PRB4_HUMAN FLISGKPEGRRPQ
0,00 1483,83
97,4 Basic salivary proline-rich protein 4 PRB4_HUMAN GPPPQGGNQSQGPPPPPG Deamidated(N)@8; Gln->His@9
0,05 1674,82
99 Basic salivary proline-rich protein 4 PRB4_HUMAN FLISGKPEGRRPQGGNQPQ Ile->Asn@3 0,02 2066,06
99 Basic salivary proline-rich protein 4 PRB4_HUMAN FLISGKPEGRRPQGGNQPQ
0,00 2065,08
98,2 Basic salivary proline-rich protein 4 PRB4_HUMAN GPPQQEGNKPQ
0,01 1178,57
99 Basic salivary proline-rich protein 4 PRB4_HUMAN GPPPPGGNPQQPQAPPAGKPQGPPPPPQG
0,00 2743,38
99 Basic salivary proline-rich protein 4 PRB4_HUMAN FLISGKPEGRRPQGGNQPQRPPPPPGKPQ
0,07 3116,74
99 Basic salivary proline-rich protein 4 PRB4_HUMAN APPAGKPQGPPPPPQ
-0,01 1434,75
99 Basic salivary proline-rich protein 4 PRB4_HUMAN GPPPPGGNPQQPQ
0,00 1269,61
99 Basic salivary proline-rich protein 4 PRB4_HUMAN GPPPPGGNPQQPQAPPAGKPQ Pro->Ala@5 -0,01 1990,00
99 Histatin-1 HIS1_HUMAN HEKHHSHREFPFY
-0,01 1749,80
99 Histatin-1 HIS1_HUMAN FHEKHHSHR
-0,01 1213,58
99 Histatin-1 HIS1_HUMAN FYGDYGSNY
0,01 1084,42
98,9 Histatin-1 HIS1_HUMAN FHEKHHSHREFPFYGDY
0,00 2231,99
99 Histatin-1 HIS1_HUMAN HHSHREFPFYGDY
0,00 1690,73
99 Histatin-1 HIS1_HUMAN HSHREFPFY Deamidated(R)@4 0,00 1219,54
99 Histatin-1 HIS1_HUMAN YGDYGSNYLYDN
0,00 1442,56
98,6 Histatin-1 HIS1_HUMAN DSHEKRHHGYR
0,00 1420,67
99 Histatin-1 HIS1_HUMAN FHEKHHSHREFPFYGDYGSNYLYDN
0,04 3158,40
99 Histatin-1 HIS1_HUMAN KHHSHREFPFYGDYGSNYLYDN
-0,03 2745,17
99 Histatin-1 HIS1_HUMAN HHSHREFPFYGDYGSN
0,00 1948,82
99 Histatin-1 HIS1_HUMAN SHEKRHHGY Phospho(S)@1 0,00 1229,51
99 Histatin-1 HIS1_HUMAN HEKHHSHREFPFYGDYGSNYLYDN
0,03 3011,33
99 Histatin-1 HIS1_HUMAN SNYLYDN
0,02 887,39
99 Histatin-1 HIS1_HUMAN KFHEKHHSHREFPFYGDY
-0,01 2360,07
99 Histatin-1 HIS1_HUMAN HEKHHSHREFPFY Oxidation(H)@1; Glu->Asn@2
0,00 1750,81
99 Histatin-1 HIS1_HUMAN HSHREFPFYGDYGS
-0,01 1697,71
99 Histatin-1 HIS1_HUMAN HHSHREFPFYGDYGS
0,00 1834,78
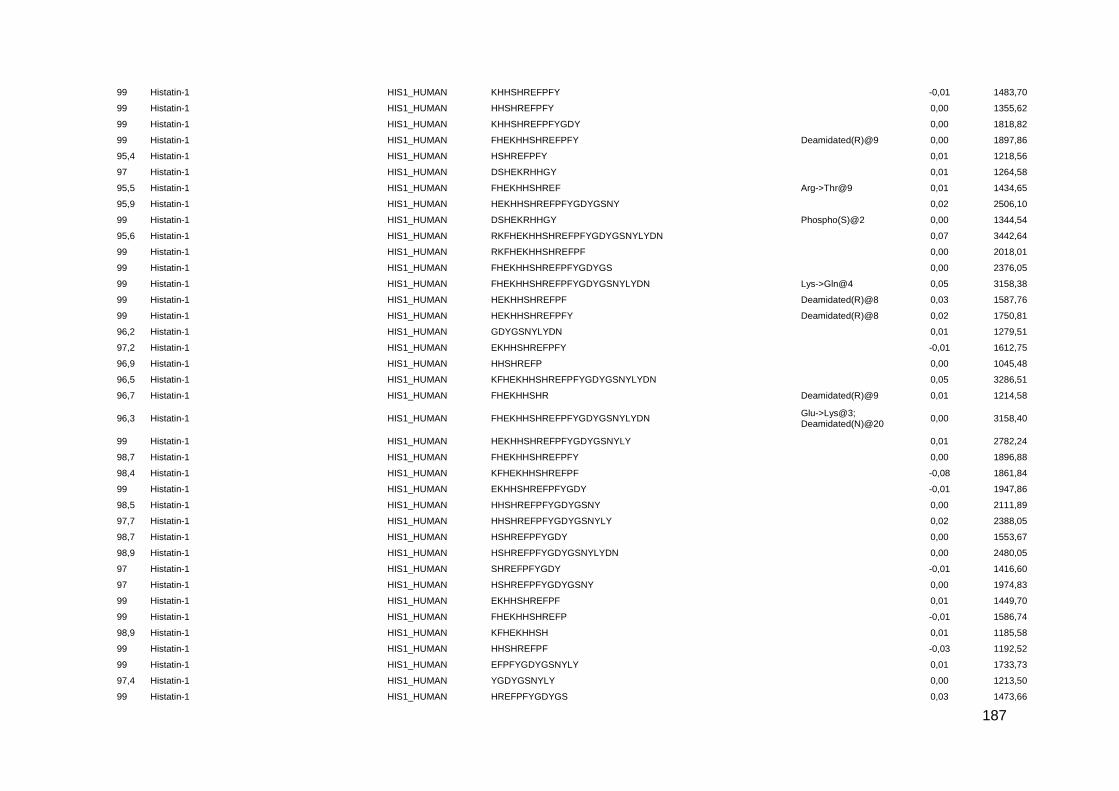
187
99 Histatin-1 HIS1_HUMAN KHHSHREFPFY
-0,01 1483,70
99 Histatin-1 HIS1_HUMAN HHSHREFPFY
0,00 1355,62
99 Histatin-1 HIS1_HUMAN KHHSHREFPFYGDY
0,00 1818,82
99 Histatin-1 HIS1_HUMAN FHEKHHSHREFPFY Deamidated(R)@9 0,00 1897,86
95,4 Histatin-1 HIS1_HUMAN HSHREFPFY
0,01 1218,56
97 Histatin-1 HIS1_HUMAN DSHEKRHHGY
0,01 1264,58
95,5 Histatin-1 HIS1_HUMAN FHEKHHSHREF Arg->Thr@9 0,01 1434,65
95,9 Histatin-1 HIS1_HUMAN HEKHHSHREFPFYGDYGSNY
0,02 2506,10
99 Histatin-1 HIS1_HUMAN DSHEKRHHGY Phospho(S)@2 0,00 1344,54
95,6 Histatin-1 HIS1_HUMAN RKFHEKHHSHREFPFYGDYGSNYLYDN
0,07 3442,64
99 Histatin-1 HIS1_HUMAN RKFHEKHHSHREFPF
0,00 2018,01
99 Histatin-1 HIS1_HUMAN FHEKHHSHREFPFYGDYGS
0,00 2376,05
99 Histatin-1 HIS1_HUMAN FHEKHHSHREFPFYGDYGSNYLYDN Lys->Gln@4 0,05 3158,38
99 Histatin-1 HIS1_HUMAN HEKHHSHREFPF Deamidated(R)@8 0,03 1587,76
99 Histatin-1 HIS1_HUMAN HEKHHSHREFPFY Deamidated(R)@8 0,02 1750,81
96,2 Histatin-1 HIS1_HUMAN GDYGSNYLYDN
0,01 1279,51
97,2 Histatin-1 HIS1_HUMAN EKHHSHREFPFY
-0,01 1612,75
96,9 Histatin-1 HIS1_HUMAN HHSHREFP
0,00 1045,48
96,5 Histatin-1 HIS1_HUMAN KFHEKHHSHREFPFYGDYGSNYLYDN
0,05 3286,51
96,7 Histatin-1 HIS1_HUMAN FHEKHHSHR Deamidated(R)@9 0,01 1214,58
96,3 Histatin-1 HIS1_HUMAN FHEKHHSHREFPFYGDYGSNYLYDN Glu->Lys@3; Deamidated(N)@20
0,00 3158,40
99 Histatin-1 HIS1_HUMAN HEKHHSHREFPFYGDYGSNYLY
0,01 2782,24
98,7 Histatin-1 HIS1_HUMAN FHEKHHSHREFPFY
0,00 1896,88
98,4 Histatin-1 HIS1_HUMAN KFHEKHHSHREFPF
-0,08 1861,84
99 Histatin-1 HIS1_HUMAN EKHHSHREFPFYGDY
-0,01 1947,86
98,5 Histatin-1 HIS1_HUMAN HHSHREFPFYGDYGSNY
0,00 2111,89
97,7 Histatin-1 HIS1_HUMAN HHSHREFPFYGDYGSNYLY
0,02 2388,05
98,7 Histatin-1 HIS1_HUMAN HSHREFPFYGDY
0,00 1553,67
98,9 Histatin-1 HIS1_HUMAN HSHREFPFYGDYGSNYLYDN
0,00 2480,05
97 Histatin-1 HIS1_HUMAN SHREFPFYGDY
-0,01 1416,60
97 Histatin-1 HIS1_HUMAN HSHREFPFYGDYGSNY
0,00 1974,83
99 Histatin-1 HIS1_HUMAN EKHHSHREFPF
0,01 1449,70
99 Histatin-1 HIS1_HUMAN FHEKHHSHREFP
-0,01 1586,74
98,9 Histatin-1 HIS1_HUMAN KFHEKHHSH
0,01 1185,58
99 Histatin-1 HIS1_HUMAN HHSHREFPF
-0,03 1192,52
99 Histatin-1 HIS1_HUMAN EFPFYGDYGSNYLY
0,01 1733,73
97,4 Histatin-1 HIS1_HUMAN YGDYGSNYLY
0,00 1213,50
99 Histatin-1 HIS1_HUMAN HREFPFYGDYGS
0,03 1473,66
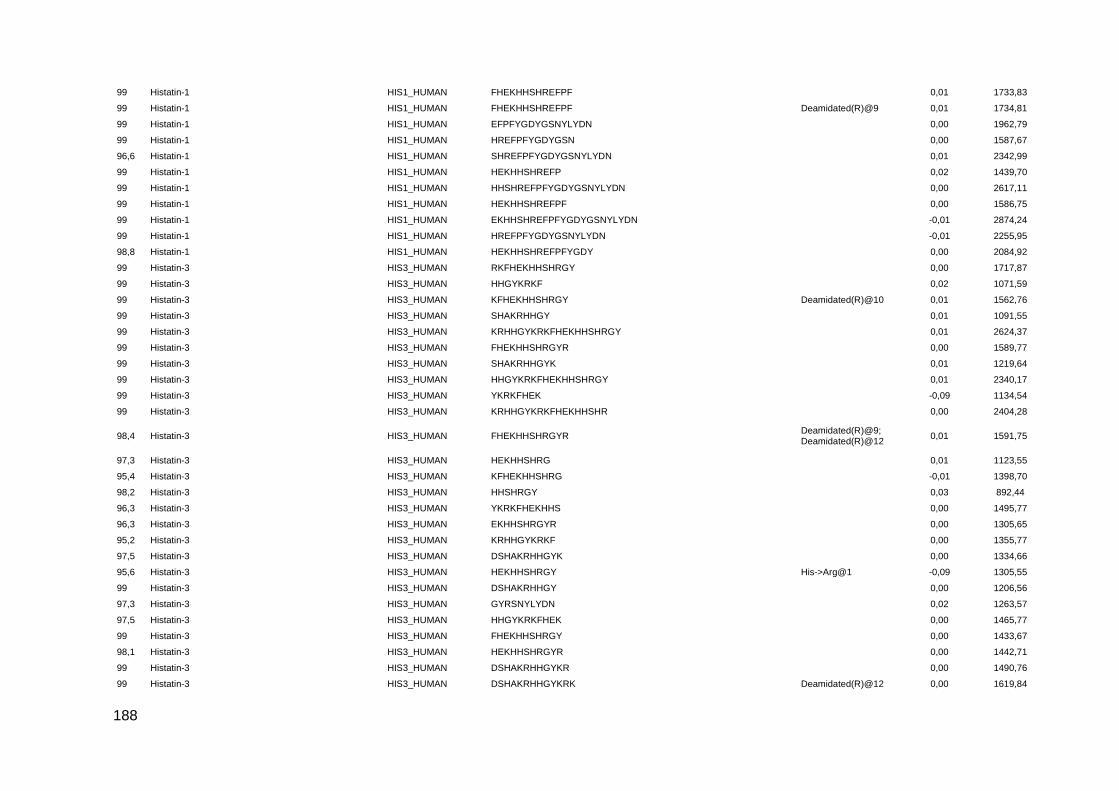
188
99 Histatin-1 HIS1_HUMAN FHEKHHSHREFPF
0,01 1733,83
99 Histatin-1 HIS1_HUMAN FHEKHHSHREFPF Deamidated(R)@9 0,01 1734,81
99 Histatin-1 HIS1_HUMAN EFPFYGDYGSNYLYDN
0,00 1962,79
99 Histatin-1 HIS1_HUMAN HREFPFYGDYGSN
0,00 1587,67
96,6 Histatin-1 HIS1_HUMAN SHREFPFYGDYGSNYLYDN
0,01 2342,99
99 Histatin-1 HIS1_HUMAN HEKHHSHREFP
0,02 1439,70
99 Histatin-1 HIS1_HUMAN HHSHREFPFYGDYGSNYLYDN
0,00 2617,11
99 Histatin-1 HIS1_HUMAN HEKHHSHREFPF
0,00 1586,75
99 Histatin-1 HIS1_HUMAN EKHHSHREFPFYGDYGSNYLYDN
-0,01 2874,24
99 Histatin-1 HIS1_HUMAN HREFPFYGDYGSNYLYDN
-0,01 2255,95
98,8 Histatin-1 HIS1_HUMAN HEKHHSHREFPFYGDY
0,00 2084,92
99 Histatin-3 HIS3_HUMAN RKFHEKHHSHRGY
0,00 1717,87
99 Histatin-3 HIS3_HUMAN HHGYKRKF
0,02 1071,59
99 Histatin-3 HIS3_HUMAN KFHEKHHSHRGY Deamidated(R)@10 0,01 1562,76
99 Histatin-3 HIS3_HUMAN SHAKRHHGY
0,01 1091,55
99 Histatin-3 HIS3_HUMAN KRHHGYKRKFHEKHHSHRGY
0,01 2624,37
99 Histatin-3 HIS3_HUMAN FHEKHHSHRGYR
0,00 1589,77
99 Histatin-3 HIS3_HUMAN SHAKRHHGYK
0,01 1219,64
99 Histatin-3 HIS3_HUMAN HHGYKRKFHEKHHSHRGY
0,01 2340,17
99 Histatin-3 HIS3_HUMAN YKRKFHEK
-0,09 1134,54
99 Histatin-3 HIS3_HUMAN KRHHGYKRKFHEKHHSHR
0,00 2404,28
98,4 Histatin-3 HIS3_HUMAN FHEKHHSHRGYR Deamidated(R)@9; Deamidated(R)@12
0,01 1591,75
97,3 Histatin-3 HIS3_HUMAN HEKHHSHRG
0,01 1123,55
95,4 Histatin-3 HIS3_HUMAN KFHEKHHSHRG
-0,01 1398,70
98,2 Histatin-3 HIS3_HUMAN HHSHRGY
0,03 892,44
96,3 Histatin-3 HIS3_HUMAN YKRKFHEKHHS
0,00 1495,77
96,3 Histatin-3 HIS3_HUMAN EKHHSHRGYR
0,00 1305,65
95,2 Histatin-3 HIS3_HUMAN KRHHGYKRKF
0,00 1355,77
97,5 Histatin-3 HIS3_HUMAN DSHAKRHHGYK
0,00 1334,66
95,6 Histatin-3 HIS3_HUMAN HEKHHSHRGY His->Arg@1 -0,09 1305,55
99 Histatin-3 HIS3_HUMAN DSHAKRHHGY
0,00 1206,56
97,3 Histatin-3 HIS3_HUMAN GYRSNYLYDN
0,02 1263,57
97,5 Histatin-3 HIS3_HUMAN HHGYKRKFHEK
0,00 1465,77
99 Histatin-3 HIS3_HUMAN FHEKHHSHRGY
0,00 1433,67
98,1 Histatin-3 HIS3_HUMAN HEKHHSHRGYR
0,00 1442,71
99 Histatin-3 HIS3_HUMAN DSHAKRHHGYKR
0,00 1490,76
99 Histatin-3 HIS3_HUMAN DSHAKRHHGYKRK Deamidated(R)@12 0,00 1619,84

189
99 Histatin-3 HIS3_HUMAN KFHEKHHSHRGY Lys->Glu@1 0,04 1562,76
99 Histatin-3 HIS3_HUMAN FHEKHHSHRGY Deamidated(R)@9 0,01 1434,66
99 Histatin-3 HIS3_HUMAN DSHAKRHHGYKRK
-0,01 1618,85
99 Histatin-3 HIS3_HUMAN KFHEKHHSHRGY
0,00 1561,77
99 Histatin-3 HIS3_HUMAN HEKHHSHRGY
0,01 1286,61
99 Histatin-3 HIS3_HUMAN DSHAKRHHGYKRKFHEKHHSHRGY
0,08 3034,59
99 Histatin-3 HIS3_HUMAN DSHAKRHHGYKRKF
0,00 1765,92
99 Histatin-3 HIS3_HUMAN RKFHEKHHSHRGY Deamidated(R)@1 0,00 1718,85
99 Histatin-3 HIS3_HUMAN HEKHHSHRGYR Deamidated(R)@11 0,01 1443,70
99 Histatin-3 HIS3_HUMAN FHEKHHSHRG
0,00 1270,61
99 Histatin-3 HIS3_HUMAN DSHAKRHHGYKRKFHEKH
0,03 2297,21
99 Mucin-7 MUC7_HUMAN SHFELPHYPGLLAH
0,00 1616,81
99 Mucin-7 MUC7_HUMAN SHFELPHYPGLLAHQKPF
0,01 2117,09
99 Mucin-7 MUC7_HUMAN SPKSHFELPHYPGLL
0,00 1720,89
99 Mucin-7 MUC7_HUMAN SPKSHFELPHYPGLLAHQKPF Lys->Gln@3 0,05 2429,28
99 Mucin-7 MUC7_HUMAN SPKSHFELPHYPGLLA
-0,01 1791,92
98,3 Mucin-7 MUC7_HUMAN SHFELPHYPGL
0,00 1295,63
99 Mucin-7 MUC7_HUMAN ELPHYPGLLA
0,01 1108,60
98,8 Mucin-7 MUC7_HUMAN MKNLLNRIIDDMVEQ
0,00 1830,94
99 Mucin-7 MUC7_HUMAN ELPHYPGLLAHQKPF
0,00 1745,92
99 Mucin-7 MUC7_HUMAN FELPHYPGLLAHQKPF
0,00 1892,99
99 Mucin-7 MUC7_HUMAN SHFELPHYPG
0,00 1182,55
99 Mucin-7 MUC7_HUMAN FELPHYPGLLA
-0,01 1255,65
99 Mucin-7 MUC7_HUMAN FELPHYPGLL
0,00 1184,62
99 Mucin-7 MUC7_HUMAN HHHQSPKSHFELPHYPGLL
0,02 2260,15
99 Mucin-7 MUC7_HUMAN HFELPHYPGLL
0,00 1321,68
99 Mucin-7 MUC7_HUMAN HHHQSPKSHFELPHYPGLLAHQKPF
0,03 2968,53
99 Mucin-7 MUC7_HUMAN YMKNLLNRIIDD
0,00 1506,79
99 Mucin-7 MUC7_HUMAN KSHFELPHYPGLL
0,00 1536,81
99 Mucin-7 MUC7_HUMAN LLYMKNLLNRIIDD
0,00 1732,96
99 Mucin-7 MUC7_HUMAN SHFELPHYPGLL
0,00 1408,71
99 Mucin-7 MUC7_HUMAN HFELPHYPGLLA
0,00 1392,72
99 Mucin-7 MUC7_HUMAN SHFELPHYPGLLA
0,00 1479,75
99 Polymeric immunoglobulin receptor PIGR_HUMAN ASVDSGSSEEQGGSSRALVSTLVPLG
0,00 2489,22
99 Polymeric immunoglobulin receptor PIGR_HUMAN AAPDEKVLDSGFREIENK
0,00 2017,01
96,5 Polymeric immunoglobulin receptor PIGR_HUMAN VDSGSSEEQGGSSRALVSTLVPLG
0,02 2331,18
98,6 Polymeric immunoglobulin receptor PIGR_HUMAN AIQDPRLFAEEK
0,00 1415,74
99 Polymeric immunoglobulin receptor PIGR_HUMAN ASVDSGSSEEQGGSSRALVSTLVPL
0,01 2432,21

190
99 Polymeric immunoglobulin receptor PIGR_HUMAN SVDSGSSEEQGGSSRALVSTLVPLG
0,00 2418,19
99 Proline-rich protein 4 PROL4_HUMAN QLSLPRFPSVSLQEAS Gln->pyro-Glu@N-term -0,01 1740,90
99 Proline-rich protein 4 PROL4_HUMAN PPPEGLLPRPPGDSGNQDDGPQ
0,01 2239,06
99 Proline-rich protein 4 PROL4_HUMAN QLSLPRFPSVS Gln->pyro-Glu@N-term 0,00 1212,65
99 Proline-rich protein 4 PROL4_HUMAN QLSLPRFPSVSLQ
0,00 1470,82
98,8 Proline-rich protein 4 PROL4_HUMAN QLSLPRFPSVSLQEA Gln->pyro-Glu@N-term 0,00 1653,87
98,7 Proline-rich protein 4 PROL4_HUMAN QRDRPARHPQEQPLW Gln->Arg@1; Oxidation(W)@15
0,00 1957,02
96,7 Salivary acidic proline-rich phosphoprotein 1/2 PRPC_HUMAN QQGGHPPPPQGRPQ Gln->pyro-Glu@N-term -0,09 1462,61
97,2 Salivary acidic proline-rich phosphoprotein 1/2 PRPC_HUMAN QGPPPPQGKPQ Gln->pyro-Glu@N-term 0,00 1112,56
98 Salivary acidic proline-rich phosphoprotein 1/2 PRPC_HUMAN DGGDSEQFIDEERQGPPLGGQQSQPS Ser->Ala@5 -0,09 2741,13
97 Salivary acidic proline-rich phosphoprotein 1/2 PRPC_HUMAN DEERQGPPLGGQQSQPS
0,00 1808,83
97,8 Salivary acidic proline-rich phosphoprotein 1/2 PRPC_HUMAN PPQGGRPQGPPQGQSPQ
0,00 1711,84
98,7 Salivary acidic proline-rich phosphoprotein 1/2 PRPC_HUMAN QQGPPPPPPGKPQ
0,01 1323,70
97,2 Salivary acidic proline-rich phosphoprotein 1/2 PRPC_HUMAN GPPPQGGRPQGPPQGQSPQ
5,02 1870,93
99 Salivary acidic proline-rich phosphoprotein 1/2 PRPC_HUMAN DDGPQQGPPQQGGQQQQGPPPPQGKPQ
0,04 2775,33
99 Salivary acidic proline-rich phosphoprotein 1/2 PRPC_HUMAN GGHPPPPQGRPQ
0,01 1223,63
97,8 Salivary acidic proline-rich phosphoprotein 1/2 PRPC_HUMAN SQPSAGDGNQDDGPQQGPPQQGGQQQ Asp->Asn@7 0,00 2604,12
99 Salivary acidic proline-rich phosphoprotein 1/2 PRPC_HUMAN DDGPQQGPPQQGGQQQQGPPPPQGKPQ Asp->Asn@2 0,01 2774,32
98,4 Salivary acidic proline-rich phosphoprotein 1/2 PRPC_HUMAN QGPPQQGGQQQQGPPPPQGKPQGPPQQGGHPPPPQGRPQ Deamidated(Q)@22 0,08 3977,02
97,5 Salivary acidic proline-rich phosphoprotein 1/2 PRPC_HUMAN RGRPQGPPQQGGHQQ
0,00 1626,80
98,1 Salivary acidic proline-rich phosphoprotein 1/2 PRPC_HUMAN GRPQGPPQQGGHQQGPPPPPPGKPQGPPPQ
0,04 2996,55
99 Salivary acidic proline-rich phosphoprotein 1/2 PRPC_HUMAN DGGDSEQFIDEER
0,00 1495,61
99 Salivary acidic proline-rich phosphoprotein 1/2 PRPC_HUMAN GGHQQGPPPPPPGKPQ
-0,01 1574,79
99 Salivary acidic proline-rich phosphoprotein 1/2 PRPC_HUMAN DDGPQQGPPQQGGQQQQGPPPPQGKPQGPPQQ
0,04 3282,58
98 Salivary acidic proline-rich phosphoprotein 1/2 PRPC_HUMAN DGGDSEQFIDEERQGPPLGGQQ Dehydrated(D)@1; Phospho(S)@5; Deamidated(Q)@7
0,00 2420,98
97,7 Salivary acidic proline-rich phosphoprotein 1/2 PRPC_HUMAN GGRPQGPPQGQSPQ
4,06 1393,73
98,4 Salivary acidic proline-rich phosphoprotein 1/2 PRPC_HUMAN IDEERQGPPLGGQQSQPSAGDGNQDDGPQ Asp->Asn@21 0,07 2975,39
97,8 Salivary acidic proline-rich phosphoprotein 1/2 PRPC_HUMAN FIDEERQGPPLGGQQ
0,00 1669,81
98,4 Salivary acidic proline-rich phosphoprotein 1/2 PRPC_HUMAN SQPSAGDGNQDDGPQQGPPQQGGQQQ Asp->Asn@11 0,01 2604,12
99 Salivary acidic proline-rich phosphoprotein 1/2 PRPC_HUMAN DGGDSEQFIDEERQ
0,01 1623,68
98,1 Salivary acidic proline-rich phosphoprotein 1/2 PRPC_HUMAN QQGGHPPPPQGRPQ
0,01 1479,74
98,5 Salivary acidic proline-rich phosphoprotein 1/2 PRPC_HUMAN GPPPPPPGKPQGPPPQGGRPQGPPQGQSPQ Acetyl@N-term -0,03 2957,46
99 Salivary acidic proline-rich phosphoprotein 1/2 PRPC_HUMAN DGGDSEQFIDEERQGPPLGGQQ Dehydrated(D)@4; Phospho(S)@5
-0,01 2419,98
98,4 Salivary acidic proline-rich phosphoprotein 1/2 PRPC_HUMAN RPQGPPQQGGHPRPP
0,00 1604,82
98,7 Salivary acidic proline-rich phosphoprotein 1/2 PRPC_HUMAN SQPSAGDGNQDDGPQQGPPQQGGQQQ Asp->Asn@12 -0,06 2604,06
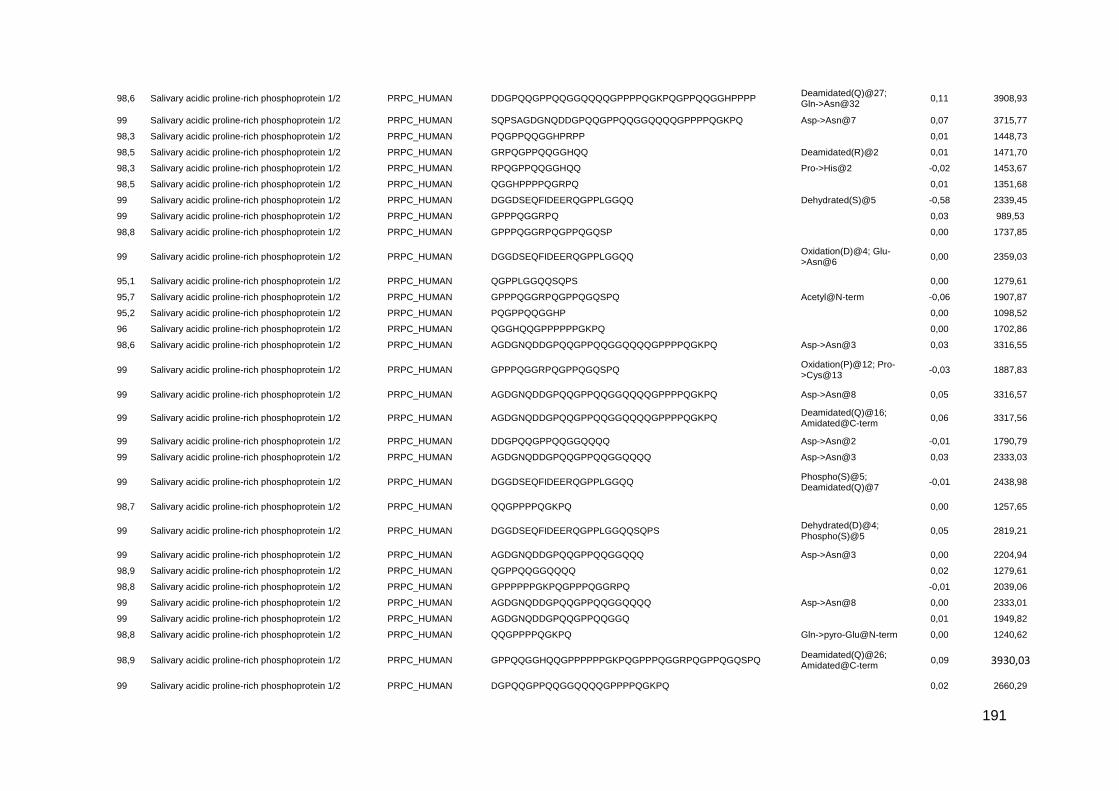
191
98,6 Salivary acidic proline-rich phosphoprotein 1/2 PRPC_HUMAN DDGPQQGPPQQGGQQQQGPPPPQGKPQGPPQQGGHPPPP Deamidated(Q)@27; Gln->Asn@32
0,11 3908,93
99 Salivary acidic proline-rich phosphoprotein 1/2 PRPC_HUMAN SQPSAGDGNQDDGPQQGPPQQGGQQQQGPPPPQGKPQ Asp->Asn@7 0,07 3715,77
98,3 Salivary acidic proline-rich phosphoprotein 1/2 PRPC_HUMAN PQGPPQQGGHPRPP
0,01 1448,73
98,5 Salivary acidic proline-rich phosphoprotein 1/2 PRPC_HUMAN GRPQGPPQQGGHQQ Deamidated(R)@2 0,01 1471,70
98,3 Salivary acidic proline-rich phosphoprotein 1/2 PRPC_HUMAN RPQGPPQQGGHQQ Pro->His@2 -0,02 1453,67
98,5 Salivary acidic proline-rich phosphoprotein 1/2 PRPC_HUMAN QGGHPPPPQGRPQ
0,01 1351,68
99 Salivary acidic proline-rich phosphoprotein 1/2 PRPC_HUMAN DGGDSEQFIDEERQGPPLGGQQ Dehydrated(S)@5 -0,58 2339,45
99 Salivary acidic proline-rich phosphoprotein 1/2 PRPC_HUMAN GPPPQGGRPQ
0,03 989,53
98,8 Salivary acidic proline-rich phosphoprotein 1/2 PRPC_HUMAN GPPPQGGRPQGPPQGQSP
0,00 1737,85
99 Salivary acidic proline-rich phosphoprotein 1/2 PRPC_HUMAN DGGDSEQFIDEERQGPPLGGQQ Oxidation(D)@4; Glu->Asn@6
0,00 2359,03
95,1 Salivary acidic proline-rich phosphoprotein 1/2 PRPC_HUMAN QGPPLGGQQSQPS
0,00 1279,61
95,7 Salivary acidic proline-rich phosphoprotein 1/2 PRPC_HUMAN GPPPQGGRPQGPPQGQSPQ Acetyl@N-term -0,06 1907,87
95,2 Salivary acidic proline-rich phosphoprotein 1/2 PRPC_HUMAN PQGPPQQGGHP
0,00 1098,52
96 Salivary acidic proline-rich phosphoprotein 1/2 PRPC_HUMAN QGGHQQGPPPPPPGKPQ
0,00 1702,86
98,6 Salivary acidic proline-rich phosphoprotein 1/2 PRPC_HUMAN AGDGNQDDGPQQGPPQQGGQQQQGPPPPQGKPQ Asp->Asn@3 0,03 3316,55
99 Salivary acidic proline-rich phosphoprotein 1/2 PRPC_HUMAN GPPPQGGRPQGPPQGQSPQ Oxidation(P)@12; Pro->Cys@13
-0,03 1887,83
99 Salivary acidic proline-rich phosphoprotein 1/2 PRPC_HUMAN AGDGNQDDGPQQGPPQQGGQQQQGPPPPQGKPQ Asp->Asn@8 0,05 3316,57
99 Salivary acidic proline-rich phosphoprotein 1/2 PRPC_HUMAN AGDGNQDDGPQQGPPQQGGQQQQGPPPPQGKPQ Deamidated(Q)@16; Amidated@C-term
0,06 3317,56
99 Salivary acidic proline-rich phosphoprotein 1/2 PRPC_HUMAN DDGPQQGPPQQGGQQQQ Asp->Asn@2 -0,01 1790,79
99 Salivary acidic proline-rich phosphoprotein 1/2 PRPC_HUMAN AGDGNQDDGPQQGPPQQGGQQQQ Asp->Asn@3 0,03 2333,03
99 Salivary acidic proline-rich phosphoprotein 1/2 PRPC_HUMAN DGGDSEQFIDEERQGPPLGGQQ Phospho(S)@5; Deamidated(Q)@7
-0,01 2438,98
98,7 Salivary acidic proline-rich phosphoprotein 1/2 PRPC_HUMAN QQGPPPPQGKPQ
0,00 1257,65
99 Salivary acidic proline-rich phosphoprotein 1/2 PRPC_HUMAN DGGDSEQFIDEERQGPPLGGQQSQPS Dehydrated(D)@4; Phospho(S)@5
0,05 2819,21
99 Salivary acidic proline-rich phosphoprotein 1/2 PRPC_HUMAN AGDGNQDDGPQQGPPQQGGQQQ Asp->Asn@3 0,00 2204,94
98,9 Salivary acidic proline-rich phosphoprotein 1/2 PRPC_HUMAN QGPPQQGGQQQQ
0,02 1279,61
98,8 Salivary acidic proline-rich phosphoprotein 1/2 PRPC_HUMAN GPPPPPPGKPQGPPPQGGRPQ
-0,01 2039,06
99 Salivary acidic proline-rich phosphoprotein 1/2 PRPC_HUMAN AGDGNQDDGPQQGPPQQGGQQQQ Asp->Asn@8 0,00 2333,01
99 Salivary acidic proline-rich phosphoprotein 1/2 PRPC_HUMAN AGDGNQDDGPQQGPPQQGGQ
0,01 1949,82
98,8 Salivary acidic proline-rich phosphoprotein 1/2 PRPC_HUMAN QQGPPPPQGKPQ Gln->pyro-Glu@N-term 0,00 1240,62
98,9 Salivary acidic proline-rich phosphoprotein 1/2 PRPC_HUMAN GPPQQGGHQQGPPPPPPGKPQGPPPQGGRPQGPPQGQSPQ Deamidated(Q)@26; Amidated@C-term
0,09 3930,03
99 Salivary acidic proline-rich phosphoprotein 1/2 PRPC_HUMAN DGPQQGPPQQGGQQQQGPPPPQGKPQ
0,02 2660,29

192
99 Salivary acidic proline-rich phosphoprotein 1/2 PRPC_HUMAN GGDSEQFIDEERQGPPLGGQ Phospho(S)@4 0,00 2194,92
99 Salivary acidic proline-rich phosphoprotein 1/2 PRPC_HUMAN DDGPQQGPPQQGGQQQ Asp->Asn@2 0,00 1662,73
98,9 Salivary acidic proline-rich phosphoprotein 1/2 PRPC_HUMAN GPPPPPPGKPQGPPPQGGRPQGPPQGQSPQ
0,02 2915,50
99 Salivary acidic proline-rich phosphoprotein 1/2 PRPC_HUMAN DGGDSEQFIDEERQGPPLGGQ Phospho(S)@5 0,02 2309,96
99 Salivary acidic proline-rich phosphoprotein 1/2 PRPC_HUMAN DDGPQQGPPQQGGQQQ
0,00 1663,72
99 Salivary acidic proline-rich phosphoprotein 1/2 PRPC_HUMAN AGDGNQDDGPQQGPPQQGGQQ
-0,02 2077,85
98,9 Salivary acidic proline-rich phosphoprotein 1/2 PRPC_HUMAN IDEERQGPPLGGQQSQPS
-0,01 1921,91
99 Salivary acidic proline-rich phosphoprotein 1/2 PRPC_HUMAN GPPQQGGHPRPPR
-0,13 1379,59
99 Salivary acidic proline-rich phosphoprotein 1/2 PRPC_HUMAN DSEQFIDEERQGPPLGGQQ Oxidation(D)@1; Phospho(S)@2
0,09 2225,01
99 Salivary acidic proline-rich phosphoprotein 1/2 PRPC_HUMAN AGDGNQDDGPQQGPPQQGGQQQ
-0,01 2205,92
99 Salivary acidic proline-rich phosphoprotein 1/2 PRPC_HUMAN GHQQGPPPPPPGKPQ
-0,15 1517,63
99 Salivary acidic proline-rich phosphoprotein 1/2 PRPC_HUMAN AGDGNQDDGPQQGPPQQGGQQQ Asp->Asn@7 0,00 2204,94
99 Salivary acidic proline-rich phosphoprotein 1/2 PRPC_HUMAN GGDSEQFIDEERQGPPLG
0,02 1929,89
99 Salivary acidic proline-rich phosphoprotein 1/2 PRPC_HUMAN AGDGNQDDGPQQGPPQQGGQQQQ Asp->Asn@7 0,03 2333,03
99 Salivary acidic proline-rich phosphoprotein 1/2 PRPC_HUMAN GDGNQDDGPQQGPPQQGGQQQQ
-0,02 2262,93
99 Salivary acidic proline-rich phosphoprotein 1/2 PRPC_HUMAN AGDGNQDDGPQQGPPQQGGQQQQ
0,00 2333,99
99 Salivary acidic proline-rich phosphoprotein 1/2 PRPC_HUMAN AGDGNQDDGPQQGPPQQGGQQQQGPPPPQGKPQ Asp->Asn@7 0,05 3316,57
99 Salivary acidic proline-rich phosphoprotein 1/2 PRPC_HUMAN EERQGPPLGGQQSQPSAGDGNQDDGPQ
0,03 2748,23
99 Salivary acidic proline-rich phosphoprotein 1/2 PRPC_HUMAN GDSEQFIDEERQGPPLGGQQ Arg-add@N-term -0,17 2341,92
95,3 Salivary acidic proline-rich phosphoprotein 1/2 PRPC_HUMAN QGGRPQGPPQGQSPQ
0,00 1517,73
96,2 Salivary acidic proline-rich phosphoprotein 1/2 PRPC_HUMAN GPPQQGGHQQ
-0,02 1032,45
97,9 Salivary acidic proline-rich phosphoprotein 1/2 PRPC_HUMAN VISDGGDSEQF Phospho(S)@8 0,01 1232,47
99 Salivary acidic proline-rich phosphoprotein 1/2 PRPC_HUMAN AGDGNQDDGPQQGPPQQGGQQQQGPPPPQGKPQ
-0,99 3316,52
95,8 Salivary acidic proline-rich phosphoprotein 1/2 PRPC_HUMAN KPQGPPPQGGRPQGPPQGQSPQ
-0,01 2219,11
96,5 Salivary acidic proline-rich phosphoprotein 1/2 PRPC_HUMAN SQPSAGDGNQDDGPQQGPPQQGGQQQ Deamidated(Q)@2; Asn->Leu@9
-0,02 2605,11
99 Salivary acidic proline-rich phosphoprotein 1/2 PRPC_HUMAN DDGPQQGPPQQGGQQQQGPPPPQGKPQ Asp->Asn@1 0,02 2774,33
99 Salivary acidic proline-rich phosphoprotein 1/2 PRPC_HUMAN GGDSEQFIDEERQGPPLG Phospho(S)@4 0,01 2009,85
99 Salivary acidic proline-rich phosphoprotein 1/2 PRPC_HUMAN GDSEQFIDEERQGPPLGGQQSQPS Arg-add@N-term -0,15 2741,11
99 Salivary acidic proline-rich phosphoprotein 1/2 PRPC_HUMAN DGGDSEQFIDEERQ Phospho(S)@5 0,00 1703,63
99 Salivary acidic proline-rich phosphoprotein 1/2 PRPC_HUMAN DDGPQQGPPQQGGQQQQGPPPPQGKPQ Lys->Gln@25 0,07 2775,33
99 Salivary acidic proline-rich phosphoprotein 1/2 PRPC_HUMAN GPPPQGGRPQ Acetyl@N-term -0,05 1031,46
99 Salivary acidic proline-rich phosphoprotein 1/2 PRPC_HUMAN DGGDSEQFIDEERQGPPL Phospho(S)@5 0,00 2067,84
99 Salivary acidic proline-rich phosphoprotein 1/2 PRPC_HUMAN DGGDSEQFIDEERQGPPLGGQQ Phospho(S)@5 0,00 2438,01
99 Salivary acidic proline-rich phosphoprotein 1/2 PRPC_HUMAN DGGDSEQFIDEERQGPPLGGQQ
0,00 2358,04
99 Salivary acidic proline-rich phosphoprotein 1/2 PRPC_HUMAN GGDSEQFIDEERQGPPLGGQQSQPS Dehydrated(S)@4 -0,55 2623,63
99 Salivary acidic proline-rich phosphoprotein 1/2 PRPC_HUMAN DEERQGPPLGGQQSQPSAGDGNQDDGPQ
0,03 2863,26

193
99 Salivary acidic proline-rich phosphoprotein 1/2 PRPC_HUMAN DGGDSEQFIDEERQGPPLGGQQSQPS Phospho(S)@5 0,01 2837,19
99 Salivary acidic proline-rich phosphoprotein 1/2 PRPC_HUMAN GPPPPPPGKPQGPPPQG
0,00 1600,84
99 Salivary acidic proline-rich phosphoprotein 1/2 PRPC_HUMAN DGGDSEQFIDEERQGPPLGGQQSQPS
0,01 2757,22
99 Salivary acidic proline-rich phosphoprotein 1/2 PRPC_HUMAN GPPPPPPGKPQGPPPQGGRPQ Acetyl@N-term -0,06 2081,02
99 Salivary acidic proline-rich phosphoprotein 1/2 PRPC_HUMAN ERQGPPLGGQQSQPSAGDGNQDDGPQ
0,02 2619,17
99 Salivary acidic proline-rich phosphoprotein 1/2 PRPC_HUMAN GPPPPPPGKPQGPPPQGGRPQGPPQGQSPQ Lys->Gln@9 0,05 2915,49
99 Salivary acidic proline-rich phosphoprotein 1/2 PRPC_HUMAN GGDSEQFIDEER Phospho(S)@4 0,00 1460,54
99 Salivary acidic proline-rich phosphoprotein 1/2 PRPC_HUMAN GPPPPPPGKPQGPPPQGGRPQGPPQGQSP
0,02 2787,44
99 Salivary acidic proline-rich phosphoprotein 1/2 PRPC_HUMAN GGDSEQFIDEERQ Phospho(S)@4 0,00 1588,60
99 Salivary acidic proline-rich phosphoprotein 1/2 PRPC_HUMAN DGGDSEQFIDEERQGPPLGGQQ Asp->Val@1 -0,16 2341,92
95,7 Salivary acidic proline-rich phosphoprotein 1/2 PRPC_HUMAN GGHPRPPRGRPQ
0,00 1310,71
96,4 Salivary acidic proline-rich phosphoprotein 1/2 PRPC_HUMAN QQGPPPPPPGKPQ Gln->pyro-Glu@N-term 0,00 1306,67
95,5 Salivary acidic proline-rich phosphoprotein 1/2 PRPC_HUMAN DEERQGPPLGGQQ
0,00 1409,65
96,2 Salivary acidic proline-rich phosphoprotein 1/2 PRPC_HUMAN PQGPPQQGGHQQ
0,00 1257,59
96,6 Salivary acidic proline-rich phosphoprotein 1/2 PRPC_HUMAN SDGGDSEQFIDEERQGPPLGGQQSQPS Asp->Gln@2 -0,16 2857,11
99 Salivary acidic proline-rich phosphoprotein 1/2 PRPC_HUMAN GGDSEQFIDEERQGPPL Phospho(S)@4 -0,02 1952,80
99 Salivary acidic proline-rich phosphoprotein 1/2 PRPC_HUMAN GPPPPPPGKPQGPPPQ
0,00 1543,81
99 Salivary acidic proline-rich phosphoprotein 1/2 PRPC_HUMAN GGHQQGPPPPPPGKPQGPPPQGGRPQGPPQGQSPQ
0,05 3422,75
99 Salivary acidic proline-rich phosphoprotein 1/2 PRPC_HUMAN GGDSEQFIDEERQGPPLGGQQ Dehydrated(S)@4 0,01 2225,01
99 Salivary acidic proline-rich phosphoprotein 1/2 PRPC_HUMAN GPPQQGGHPPPPQGRPQ Acetyl@N-term -0,05 1772,82
99 Salivary acidic proline-rich phosphoprotein 1/2 PRPC_HUMAN QGRPQGPPQQGGHP
0,01 1439,71
99 Salivary acidic proline-rich phosphoprotein 1/2 PRPC_HUMAN GPPQQGGHPPPPQG
0,00 1349,65
99 Salivary acidic proline-rich phosphoprotein 1/2 PRPC_HUMAN DGGDSEQFIDEERQGPPLGGQQSQPS Asp->Val@1 -0,11 2741,14
99 Salivary acidic proline-rich phosphoprotein 1/2 PRPC_HUMAN GGDSEQFIDEERQGPPLGGQQ
0,02 2243,02
99 Salivary acidic proline-rich phosphoprotein 1/2 PRPC_HUMAN QGRPQGPPQQGGHPRPP
0,00 1789,91
99 Salivary acidic proline-rich phosphoprotein 1/2 PRPC_HUMAN DGGDSEQFIDEERQGPPLGGQQSQPS Deamidated(Q)@7 0,02 2758,21
99 Salivary acidic proline-rich phosphoprotein 1/2 PRPC_HUMAN GGDSEQFIDEERQGPPLGGQQ Phospho(S)@4 0,00 2322,97
99 Salivary acidic proline-rich phosphoprotein 1/2 PRPC_HUMAN GPPQQGGHQQGPPPPPPGKPQGPPPQGGRPQ
0,04 3053,57
99 Salivary acidic proline-rich phosphoprotein 1/2 PRPC_HUMAN SQPSAGDGNQDDGPQQGPPQQGGQQQQGPPPPQGKPQ Deamidated(Q)@25; Amidated@C-term
0,07 3716,75
99 Salivary acidic proline-rich phosphoprotein 1/2 PRPC_HUMAN GPPQQGGHPPPPQGRPQGPPQQGGHP
0,01 2586,27
99 Salivary acidic proline-rich phosphoprotein 1/2 PRPC_HUMAN GPPQQGGHPPPP
0,00 1164,57
99 Salivary acidic proline-rich phosphoprotein 1/2 PRPC_HUMAN GGDSEQFIDEERQGPPLGGQQSQPS
0,01 2642,19
99 Salivary acidic proline-rich phosphoprotein 1/2 PRPC_HUMAN GPPQQGGHPPPPQ
0,00 1292,63
99 Salivary acidic proline-rich phosphoprotein 1/2 PRPC_HUMAN GPPQQGGHPPPPQGRP
-0,01 1602,80
99 Salivary acidic proline-rich phosphoprotein 1/2 PRPC_HUMAN GPPQQGGHPPPPQGRPQGPPQQ
0,01 2238,11
99 Salivary acidic proline-rich phosphoprotein 1/2 PRPC_HUMAN EQFIDEERQGPPLGGQQ
0,01 1926,92
99 Salivary acidic proline-rich phosphoprotein 1/2 PRPC_HUMAN GGDSEQFIDEERQGPPLGGQQSQPS Phospho(S)@4 0,01 2722,16

194
99 Salivary acidic proline-rich phosphoprotein 1/2 PRPC_HUMAN FIDEERQGPPLGGQQSQPS
0,00 2068,98
99 Salivary acidic proline-rich phosphoprotein 1/2 PRPC_HUMAN EQFIDEERQGPPLGGQQSQPS
0,02 2326,10
99 Salivary acidic proline-rich phosphoprotein 1/2 PRPC_HUMAN GPPQQGGHPPPPQGRPQGPPQ
0,01 2110,06
99 Salivary acidic proline-rich phosphoprotein 1/2 PRPC_HUMAN GGDSEQFIDEER
0,00 1380,58
99 Salivary acidic proline-rich phosphoprotein 1/2 PRPC_HUMAN GPPQQGGHPPPPQGRPQ
-0,15 1730,71
99 Salivary acidic proline-rich phosphoprotein 1/2 PRPC_HUMAN GRPQGPPQQGGHQQGPPPPPPGKPQ Acetyl@N-term -0,09 2562,19
99 Salivary acidic proline-rich phosphoprotein 1/2 PRPC_HUMAN GPPQQGGHPPPPQGRPQ Deamidated(Q)@4 0,01 1731,86
99 Salivary acidic proline-rich phosphoprotein 1/2 PRPC_HUMAN GPPQQGGHPPPPQGRPQGPPQQGGHPRPP
0,03 2936,49
99 Salivary acidic proline-rich phosphoprotein 1/2 PRPC_HUMAN GRPQGPPQQGGHQQGPPPPPPGKPQ
0,01 2520,29
95,8 Salivary acidic proline-rich phosphoprotein 1/2 PRPC_HUMAN GHPPPPQGRPQ
0,01 1166,61
96,5 Salivary acidic proline-rich phosphoprotein 1/2 PRPC_HUMAN QQGPPPPQGKPQGPPQQGGHPPPPQGRPQ Gln->pyro-Glu@N-term 0,03 2953,50
98,1 Salivary acidic proline-rich phosphoprotein 1/2 PRPC_HUMAN EERQGPPLGGQQ
0,01 1294,63
96,7 Salivary acidic proline-rich phosphoprotein 1/2 PRPC_HUMAN GRPQGPPQQGGHQQGPPPPPPGKPQGPPPQGGRPQ Gln->Lys@30 -0,01 3491,80
96,9 Salivary acidic proline-rich phosphoprotein 1/2 PRPC_HUMAN GRPQGPPQQGGHQQ Deamidated(Q)@4 0,01 1471,70
98 Salivary acidic proline-rich phosphoprotein 1/2 PRPC_HUMAN SAGDGNQDDGPQQGPPQQGGQQQQGPPPPQGKPQ
0,01 3404,55
99 Salivary acidic proline-rich phosphoprotein 1/2 PRPC_HUMAN GPPQQGGHPRPPRGRPQ
-0,16 1817,79
99 Salivary acidic proline-rich phosphoprotein 1/2 PRPC_HUMAN VISDGGDSEQFIDEER Phospho(S)@8 0,02 1874,77
99 Salivary acidic proline-rich phosphoprotein 1/2 PRPC_HUMAN GPPQQGGHQQGPPPPPPGKPQGPPPQGGRPQGPPQGQSPQ Deamidated(Q)@21 0,12 3931,04
99 Salivary acidic proline-rich phosphoprotein 1/2 PRPC_HUMAN GPPQQGGHQQGPPPPPPGKPQ
0,00 2082,04
99 Salivary acidic proline-rich phosphoprotein 1/2 PRPC_HUMAN RGRPQGPPQQGGHQQ Deamidated(R)@1 0,00 1627,79
99 Salivary acidic proline-rich phosphoprotein 1/2 PRPC_HUMAN GRPQGPPQQGGHQQGPPPPPPGKPQGPPPQGGRPQ
0,07 3491,83
99 Salivary acidic proline-rich phosphoprotein 1/2 PRPC_HUMAN GPPQQGGQQQQGPPPPQGKPQ
-0,05 2135,00
99 Salivary acidic proline-rich phosphoprotein 1/2 PRPC_HUMAN GPPQQGGHPRPP Gly->Ala@1 -0,02 1237,61
99 Salivary acidic proline-rich phosphoprotein 1/2 PRPC_HUMAN GPPQQGGHQQGPPPPPPGKPQGPPPQ
0,00 2558,28
99 Salivary acidic proline-rich phosphoprotein 1/2 PRPC_HUMAN SDGGDSEQFIDEERQGPPLGGQQ Phospho(S)@6 0,03 2525,07
99 Salivary acidic proline-rich phosphoprotein 1/2 PRPC_HUMAN GRPQGPPQQGGHQQGPPPPPPGKPQGPPPQGGRPQGPPQGQSPQ
0,16 4368,34
99 Salivary acidic proline-rich phosphoprotein 1/2 PRPC_HUMAN GPPQQGGHQQGPPPPPPGKPQGPPPQGGRPQGPPQGQSPQ Deamidated(Q)@10 0,12 3931,05
99 Salivary acidic proline-rich phosphoprotein 1/2 PRPC_HUMAN GPPQQGGHQQGPPPPPPGKPQGPPPQGGRPQGPPQGQSPQ
0,09 3930,03
99 Salivary acidic proline-rich phosphoprotein 1/2 PRPC_HUMAN SQPSAGDGNQDDGPQQGPPQQGGQQQQ Oxidation(P)@3; Dehydrated(S)@4; Deamidated(Q)@10
0,09 2732,22
99 Salivary acidic proline-rich phosphoprotein 1/2 PRPC_HUMAN GPPQQGGHQQGPPPPPPGKPQGPPPQGGRPQGPPQGQSP
Deamidated(Q)@9; Oxidation(P)@33; Dioxidation(P)@34; Phospho(S)@38
-0,74 3930,08
99 Salivary acidic proline-rich phosphoprotein 1/2 PRPC_HUMAN GRPQGPPQQGGHQQ
0,02 1470,73
99 Salivary acidic proline-rich phosphoprotein 1/2 PRPC_HUMAN PPPPPGKPQGPPPQGGRPQG Arg->Tyr@17 -0,01 1948,97
99 Salivary acidic proline-rich phosphoprotein 1/2 PRPC_HUMAN GRPQGPPQQGGHQQ Acetyl@N-term -0,06 1512,66
99 Salivary acidic proline-rich phosphoprotein 1/2 PRPC_HUMAN GRPQGPPQQGGHQQGPPPPPPGKPQ Lys->Gln@23 0,04 2520,28
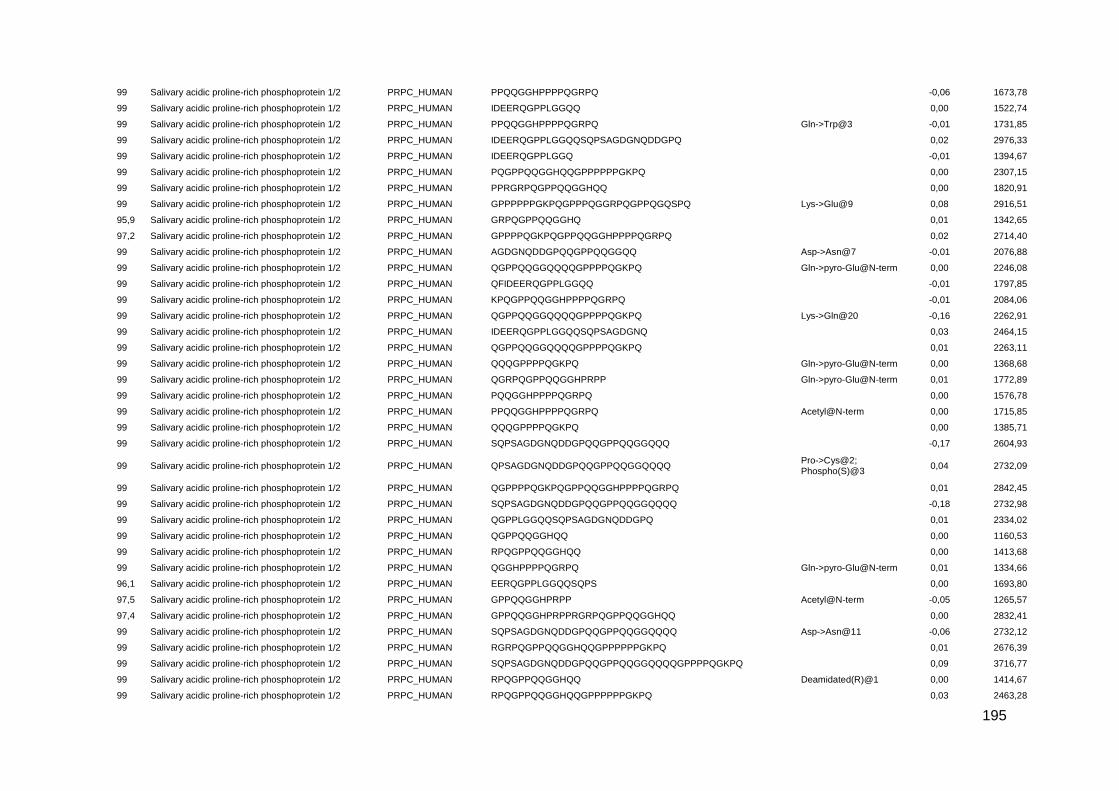
195
99 Salivary acidic proline-rich phosphoprotein 1/2 PRPC_HUMAN PPQQGGHPPPPQGRPQ
-0,06 1673,78
99 Salivary acidic proline-rich phosphoprotein 1/2 PRPC_HUMAN IDEERQGPPLGGQQ
0,00 1522,74
99 Salivary acidic proline-rich phosphoprotein 1/2 PRPC_HUMAN PPQQGGHPPPPQGRPQ Gln->Trp@3 -0,01 1731,85
99 Salivary acidic proline-rich phosphoprotein 1/2 PRPC_HUMAN IDEERQGPPLGGQQSQPSAGDGNQDDGPQ
0,02 2976,33
99 Salivary acidic proline-rich phosphoprotein 1/2 PRPC_HUMAN IDEERQGPPLGGQ
-0,01 1394,67
99 Salivary acidic proline-rich phosphoprotein 1/2 PRPC_HUMAN PQGPPQQGGHQQGPPPPPPGKPQ
0,00 2307,15
99 Salivary acidic proline-rich phosphoprotein 1/2 PRPC_HUMAN PPRGRPQGPPQQGGHQQ
0,00 1820,91
99 Salivary acidic proline-rich phosphoprotein 1/2 PRPC_HUMAN GPPPPPPGKPQGPPPQGGRPQGPPQGQSPQ Lys->Glu@9 0,08 2916,51
95,9 Salivary acidic proline-rich phosphoprotein 1/2 PRPC_HUMAN GRPQGPPQQGGHQ
0,01 1342,65
97,2 Salivary acidic proline-rich phosphoprotein 1/2 PRPC_HUMAN GPPPPQGKPQGPPQQGGHPPPPQGRPQ
0,02 2714,40
99 Salivary acidic proline-rich phosphoprotein 1/2 PRPC_HUMAN AGDGNQDDGPQQGPPQQGGQQ Asp->Asn@7 -0,01 2076,88
99 Salivary acidic proline-rich phosphoprotein 1/2 PRPC_HUMAN QGPPQQGGQQQQGPPPPQGKPQ Gln->pyro-Glu@N-term 0,00 2246,08
99 Salivary acidic proline-rich phosphoprotein 1/2 PRPC_HUMAN QFIDEERQGPPLGGQQ
-0,01 1797,85
99 Salivary acidic proline-rich phosphoprotein 1/2 PRPC_HUMAN KPQGPPQQGGHPPPPQGRPQ
-0,01 2084,06
99 Salivary acidic proline-rich phosphoprotein 1/2 PRPC_HUMAN QGPPQQGGQQQQGPPPPQGKPQ Lys->Gln@20 -0,16 2262,91
99 Salivary acidic proline-rich phosphoprotein 1/2 PRPC_HUMAN IDEERQGPPLGGQQSQPSAGDGNQ
0,03 2464,15
99 Salivary acidic proline-rich phosphoprotein 1/2 PRPC_HUMAN QGPPQQGGQQQQGPPPPQGKPQ
0,01 2263,11
99 Salivary acidic proline-rich phosphoprotein 1/2 PRPC_HUMAN QQQGPPPPQGKPQ Gln->pyro-Glu@N-term 0,00 1368,68
99 Salivary acidic proline-rich phosphoprotein 1/2 PRPC_HUMAN QGRPQGPPQQGGHPRPP Gln->pyro-Glu@N-term 0,01 1772,89
99 Salivary acidic proline-rich phosphoprotein 1/2 PRPC_HUMAN PQQGGHPPPPQGRPQ
0,00 1576,78
99 Salivary acidic proline-rich phosphoprotein 1/2 PRPC_HUMAN PPQQGGHPPPPQGRPQ Acetyl@N-term 0,00 1715,85
99 Salivary acidic proline-rich phosphoprotein 1/2 PRPC_HUMAN QQQGPPPPQGKPQ
0,00 1385,71
99 Salivary acidic proline-rich phosphoprotein 1/2 PRPC_HUMAN SQPSAGDGNQDDGPQQGPPQQGGQQQ
-0,17 2604,93
99 Salivary acidic proline-rich phosphoprotein 1/2 PRPC_HUMAN QPSAGDGNQDDGPQQGPPQQGGQQQQ Pro->Cys@2; Phospho(S)@3
0,04 2732,09
99 Salivary acidic proline-rich phosphoprotein 1/2 PRPC_HUMAN QGPPPPQGKPQGPPQQGGHPPPPQGRPQ
0,01 2842,45
99 Salivary acidic proline-rich phosphoprotein 1/2 PRPC_HUMAN SQPSAGDGNQDDGPQQGPPQQGGQQQQ
-0,18 2732,98
99 Salivary acidic proline-rich phosphoprotein 1/2 PRPC_HUMAN QGPPLGGQQSQPSAGDGNQDDGPQ
0,01 2334,02
99 Salivary acidic proline-rich phosphoprotein 1/2 PRPC_HUMAN QGPPQQGGHQQ
0,00 1160,53
99 Salivary acidic proline-rich phosphoprotein 1/2 PRPC_HUMAN RPQGPPQQGGHQQ
0,00 1413,68
99 Salivary acidic proline-rich phosphoprotein 1/2 PRPC_HUMAN QGGHPPPPQGRPQ Gln->pyro-Glu@N-term 0,01 1334,66
96,1 Salivary acidic proline-rich phosphoprotein 1/2 PRPC_HUMAN EERQGPPLGGQQSQPS
0,00 1693,80
97,5 Salivary acidic proline-rich phosphoprotein 1/2 PRPC_HUMAN GPPQQGGHPRPP Acetyl@N-term -0,05 1265,57
97,4 Salivary acidic proline-rich phosphoprotein 1/2 PRPC_HUMAN GPPQQGGHPRPPRGRPQGPPQQGGHQQ
0,00 2832,41
99 Salivary acidic proline-rich phosphoprotein 1/2 PRPC_HUMAN SQPSAGDGNQDDGPQQGPPQQGGQQQQ Asp->Asn@11 -0,06 2732,12
99 Salivary acidic proline-rich phosphoprotein 1/2 PRPC_HUMAN RGRPQGPPQQGGHQQGPPPPPPGKPQ
0,01 2676,39
99 Salivary acidic proline-rich phosphoprotein 1/2 PRPC_HUMAN SQPSAGDGNQDDGPQQGPPQQGGQQQQGPPPPQGKPQ
0,09 3716,77
99 Salivary acidic proline-rich phosphoprotein 1/2 PRPC_HUMAN RPQGPPQQGGHQQ Deamidated(R)@1 0,00 1414,67
99 Salivary acidic proline-rich phosphoprotein 1/2 PRPC_HUMAN RPQGPPQQGGHQQGPPPPPPGKPQ
0,03 2463,28

196
99 Salivary acidic proline-rich phosphoprotein 1/2 PRPC_HUMAN SQPSAGDGNQDDGPQQGPPQQGGQQQQGPPPPQGKPQ Asp->Asn@12 0,02 3715,72
99 Salivary acidic proline-rich phosphoprotein 1/2 PRPC_HUMAN SDGGDSEQFIDEERQGPPLGGQQSQPS Phospho(S)@6 0,08 2924,29
96,4 Salivary acidic proline-rich phosphoprotein 1/2 PRPC_HUMAN VISDGGDSEQFIDEERQGPPLGGQQ Phospho(S)@8 0,02 2737,20
98,8 Salivary acidic proline-rich phosphoprotein 1/2 PRPC_HUMAN PPPPPGKPQGPPPQGGRPQGPPQGQSPQ
0,03 2761,44
99 Salivary acidic proline-rich phosphoprotein 1/2 PRPC_HUMAN DDGPQQGPPQQGGQQQ Asp->Asn@1 0,00 1662,73
96,8 Salivary acidic proline-rich phosphoprotein 1/2 PRPC_HUMAN QFIDEERQGPPLGGQQSQPS
0,03 2197,07
99 Salivary acidic proline-rich phosphoprotein 1/2 PRPC_HUMAN SQPSAGDGNQDDGPQQGPPQQGGQQQQ Asp->Asn@7 0,02 2732,19
99 Salivary acidic proline-rich phosphoprotein 1/2 PRPC_HUMAN VISDGGDSEQFIDEERQGPPLGGQQSQPS Phospho(S)@8 0,07 3136,43
99 Salivary acidic proline-rich phosphoprotein 1/2 PRPC_HUMAN QGPPQQGGQQQQGPPPPQGKPQGPPQQGGHPPPPQGRPQ
0,07 3976,03
99 Salivary acidic proline-rich phosphoprotein 1/2 PRPC_HUMAN SDGGDSEQFIDEERQGPPLGGQQSQPS Ser->Val@6 -0,12 2856,16
96,7 Salivary acidic proline-rich phosphoprotein 1/2 PRPC_HUMAN GPPQQGGHPRPP
0,02 1223,64
97,7 Salivary acidic proline-rich phosphoprotein 1/2 PRPC_HUMAN DDGPQQGPPQQGGQQQQ
0,01 1791,79
99 Salivary acidic proline-rich phosphoprotein 1/2 PRPC_HUMAN DDGPQQGPPQQGGQQQQ Asp->Asn@1 0,00 1790,79
98,2 Salivary acidic proline-rich phosphoprotein 1/2 PRPC_HUMAN DGGDSEQFIDEER Phospho(S)@5 0,00 1575,58
99 Salivary acidic proline-rich phosphoprotein 1/2 PRPC_HUMAN AGDGNQDDGPQQGPPQQGGQQ Asp->Asn@8 0,01 2076,90
99 Salivary acidic proline-rich phosphoprotein 1/2 PRPC_HUMAN SQPSAGDGNQDDGPQQGPPQQGGQQQQ Asp->Asn@12 0,03 2732,21
99 Salivary acidic proline-rich phosphoprotein 1/2 PRPC_HUMAN SQPSAGDGNQDDGPQQGPPQQGGQQQQGPPPPQGKPQ Asn->Leu@9 0,08 3715,80
99 Statherin STAT_HUMAN EKFLRRIGRFGYGYGPY
0,00 2078,09
99 Statherin STAT_HUMAN GYGPYQPVPEQPLYPQPYQPQYQQYTF
0,05 3275,58
99 Statherin STAT_HUMAN FGYGYGPYQPVPEQPL
-0,02 1810,83
99 Statherin STAT_HUMAN GYGPYQPVPEQPLYPQPYQPQYQQY
1,04 3028,45
99 Statherin STAT_HUMAN FGYGYGPYQPVPEQPLYPQPY
0,01 2459,15
99 Statherin STAT_HUMAN GPYQPVPEQPLYPQPYQPQ
-0,01 2225,07
99 Statherin STAT_HUMAN GYGYGPYQPVPE
0,00 1325,59
99 Statherin STAT_HUMAN GYGYGPYQPVPEQPLYPQPYQPQYQQYT
0,05 3348,59
99 Statherin STAT_HUMAN GYGPYQPVPEQPL
-0,01 1443,70
99 Statherin STAT_HUMAN GYGYGPYQPVPEQP
0,00 1550,71
99 Statherin STAT_HUMAN GYGYGPYQPVPEQPL Oxidation(P)@11; Cation:K(E)@12
-0,03 1717,71
99 Statherin STAT_HUMAN GYGPYQPVPEQPLYPQPY
-0,01 2091,98
99 Statherin STAT_HUMAN GYGYGPYQPVPEQPLYPQPYQPQ Oxidation(P)@11; Cation:K(E)@12
-0,02 2719,18
99 Statherin STAT_HUMAN LRRIGRFGYGYGPYQPVPEQPLYPQPYQPQ
0,08 3563,89
99 Statherin STAT_HUMAN GYGYGPYQPVPEQPLYPQPYQPQYQQYTF Gln->Lys@8 0,05 3495,69
99 Statherin STAT_HUMAN GYGYGPYQPVPEQPL
-0,01 1663,78
99 Statherin STAT_HUMAN IGRFGYGY
0,01 931,46
99 Statherin STAT_HUMAN GYGYGPYQPVPEQPLYPQ
0,00 2051,96
99 Statherin STAT_HUMAN GYGYGPYQPVPEQPLYPQPYQPQYQQYTF
0,13 3495,74
99 Statherin STAT_HUMAN GYGYGPYQPVPEQPLYPQPY
-0,01 2312,07

197
99 Statherin STAT_HUMAN GYGYGPYQPVPEQPLYPQPY Oxidation(P)@11; Cation:K(E)@12
-0,03 2365,99
99 Statherin STAT_HUMAN YPQPYQPQYQQY
0,00 1601,71
96,5 Statherin STAT_HUMAN EKFLRRIGRFGY
0,01 1540,87
95,7 Statherin STAT_HUMAN GPYQPVPEQPLYPQPY
0,00 1871,91
97,8 Statherin STAT_HUMAN GRFGYGYGPY
0,00 1135,51
95,2 Statherin STAT_HUMAN RFGYGYGPYQPVPEQPLYPQPYQPQ
0,03 2968,45
99 Statherin STAT_HUMAN GYGYGPYQPVPEQPLYPQPYQPQ
0,01 2665,26
99 Statherin STAT_HUMAN IGRFGYGYGPYQPVPEQPLYPQPY
0,03 2785,38
98,7 Statherin STAT_HUMAN GYGYGPYQPVPEQPLYPQPYQPQ Phospho(Y)@16; Tyr->His@20
-0,04 2719,17
99 Statherin STAT_HUMAN GYGYGPYQPVPEQPLYPQPYQPQYQQY
0,06 3247,55
99 Statherin STAT_HUMAN IGRFGYGYGPYQPVPEQPLYPQPYQPQ
0,04 3138,56
99 Statherin STAT_HUMAN QPVPEQPLYPQPY
-0,01 1554,77
99 Statherin STAT_HUMAN IGRFGYGYGPYQPVPEQPLYPQPYQPQYQQY
0,07 3720,84
99 Statherin STAT_HUMAN QPVPEQPLYPQPYQPQYQQY
0,00 2490,18
99 Statherin STAT_HUMAN QPVPEQPLYPQPYQPQ
0,00 1907,94
99 Statherin STAT_HUMAN QPVPEQPLYPQPYQPQYQQYT
0,03 2591,27
99 Statherin STAT_HUMAN VPEQPLYPQPYQPQ
0,00 1682,83
99 Statherin STAT_HUMAN IGRFGYGYGPYQPVPEQPLYPQPYQPQYQ
0,03 3429,68
99 Statherin STAT_HUMAN LRRIGRFGYGYGPYQPVPEQPL
0,00 2562,35
99 Statherin STAT_HUMAN YGPYQPVPEQPL
-0,01 1386,68
99 Statherin STAT_HUMAN RFGYGYGPYQPVPEQPLYPQPYQPQ Tyr->Phe@4; Oxidation(P)@8; Deamidated(Q)@10
0,03 2969,43
99 Statherin STAT_HUMAN YGPYQPVPEQPLYPQPYQPQ
0,01 2388,15
99 Statherin STAT_HUMAN RIGRFGYGYGPYQPVPEQPLYPQPYQPQ
0,05 3294,67
99 Statherin STAT_HUMAN YPQPYQPQYQQYT
0,00 1702,76
99 Statherin STAT_HUMAN QPVPEQPLYPQPYQPQ Dehydrated(E)@5 0,01 1889,94
99 Statherin STAT_HUMAN QPYQPQYQQY
0,00 1341,60
96,9 Statherin STAT_HUMAN IGRFGYGYGPYQPVPEQPL
-0,01 2137,06
96,5 Statherin STAT_HUMAN GPYQPVPEQPL
0,00 1223,62
98,7 Statherin STAT_HUMAN IGRFGYGYGP
0,01 1085,54
99 Statherin STAT_HUMAN YQPVPEQPLYPQPYQPQ
0,01 2071,01
99 Statherin STAT_HUMAN VPEQPLYPQPYQPQYQQY
0,02 2265,09
97,1 Statherin STAT_HUMAN IGRFGYGYGPY
0,00 1248,59
97,4 Statherin STAT_HUMAN YPQPYQPQYQQYTF
-0,02 1849,81
96,7 Statherin STAT_HUMAN GYGYGPYQPVPEQPL Oxidation(P)@9; Val->His@10
-0,07 1717,70

198
96,7 Statherin STAT_HUMAN GYGPYQPVPEQPLYPQPYQPQ Phospho(Y)@14; Tyr->His@18
-0,02 2499,10
97,8 Statherin STAT_HUMAN YQPVPEQPLYPQPYQPQYQQYT
0,03 2754,33
99 Statherin STAT_HUMAN PQPYQPQYQQYTF
0,01 1686,78
96,6 Statherin STAT_HUMAN QPVPEQPLYPQPYQPQ Deamidated(Q)@1 0,00 1908,93
97,1 Statherin STAT_HUMAN LRRIGRFGYGYGPY
-0,01 1673,87
99 Statherin STAT_HUMAN GYGYGPYQPVPEQPLYPQPYQPQ Cation:Na(E)@12 -0,11 2687,12
97 Statherin STAT_HUMAN QPQYQQYTF
0,01 1201,55
97,8 Statherin STAT_HUMAN LRRIGRFGYGYGPYQPVPEQPLYPQPYQPQYQQY Deamidated(Q)@33 0,14 4147,18
99 Statherin STAT_HUMAN GPYQPVPEQPLYPQPYQPQYQQY
0,00 2807,33
95,5 Statherin STAT_HUMAN YGPYQPVPE
0,01 1048,50
97,4 Statherin STAT_HUMAN YPQPYQPQYQQ
0,00 1438,65
99 Statherin STAT_HUMAN GRFGYGYGPYQPVPEQPLYPQPY
0,03 2672,29
98,2 Statherin STAT_HUMAN IGRFGYGYGPYQPVPEQP
0,00 2023,98
98,9 Statherin STAT_HUMAN PEQPLYPQPYQPQ
0,01 1583,77
97,9 Statherin STAT_HUMAN IGRFGYGYGPYQPVPEQPLYPQPYQPQYQQYTF
0,12 3969,00
98,6 Statherin STAT_HUMAN RFGYGYGPYQPVPEQPLYPQPYQPQYQQY
0,02 3550,68
98,5 Statherin STAT_HUMAN YGPYQPVPEQPLYPQPY
0,00 2034,97
98,4 Statherin STAT_HUMAN GYGPYQPVPEQPLYPQPYQPQ
-3,09 2442,07
99 Statherin STAT_HUMAN EQPLYPQPYQPQ
0,01 1486,72
98,7 Statherin STAT_HUMAN VPEQPLYPQPY
0,00 1329,66
99 Submaxillary gland androgen-regulated protein 3A SMR3A_HUMAN GPYPPGPLAPPPPPC Dioxidation(C)@15 -0,06 1487,65
99 Submaxillary gland androgen-regulated protein 3B SMR3B_HUMAN GPGIFPPPPPQP
0,01 1199,64
99 Submaxillary gland androgen-regulated protein 3B SMR3B_HUMAN APPQPFGPGFVPPPPPPPYGPGR
-0,01 2322,19
99 Submaxillary gland androgen-regulated protein 3B SMR3B_HUMAN GPGRIPPPPPAPYGPG
0,01 1525,81
99 Submaxillary gland androgen-regulated protein 3B SMR3B_HUMAN GPLAPPQPFGPG
0,01 1133,60
99 Submaxillary gland androgen-regulated protein 3B SMR3B_HUMAN GPGFVPPPPPPPYGPGRIPPPPPAPY
0,01 2614,39
99 Submaxillary gland androgen-regulated protein 3B SMR3B_HUMAN GPLAPPQPFGPGF
0,00 1280,66
99 Submaxillary gland androgen-regulated protein 3B SMR3B_HUMAN GPGIFPPPPPQ
-0,03 1102,55
99 Submaxillary gland androgen-regulated protein 3B SMR3B_HUMAN GPYPPGPLAPPQPF
0,00 1433,73
99 Submaxillary gland androgen-regulated protein 3B SMR3B_HUMAN GPYPPGPLAPPQPFGPG
-0,01 1644,82
99 Submaxillary gland androgen-regulated protein 3B SMR3B_HUMAN GPGRIPPPPPAP
0,01 1151,65
99 Submaxillary gland androgen-regulated protein 3B SMR3B_HUMAN GPGRIPPPPPAPY Oxidation(P)@7 0,01 1330,72
99 Submaxillary gland androgen-regulated protein 3B SMR3B_HUMAN GPGFVPPPPPPPYGPGRIPPPPPAPYGPGIFPPPPPQP
0,07 3796,07
99 Submaxillary gland androgen-regulated protein 3B SMR3B_HUMAN GPYPPGPLAPPQPFGPGF
-0,01 1791,89
99 Submaxillary gland androgen-regulated protein 3B SMR3B_HUMAN IPPPPPAPYGPGIFPPPPPQP
0,00 2129,14
99 Submaxillary gland androgen-regulated protein 3B SMR3B_HUMAN GPYPPGPLAPPQPFGPGFVPPPPPPPY
0,01 2733,41
99 Submaxillary gland androgen-regulated protein 3B SMR3B_HUMAN IPPPPPAPYGPGIFP
-0,01 1515,80
99 Submaxillary gland androgen-regulated protein 3B SMR3B_HUMAN GPLAPPQPFGPGFVPPPPPPPYGPGRIPPPPPAPY
0,04 3518,89
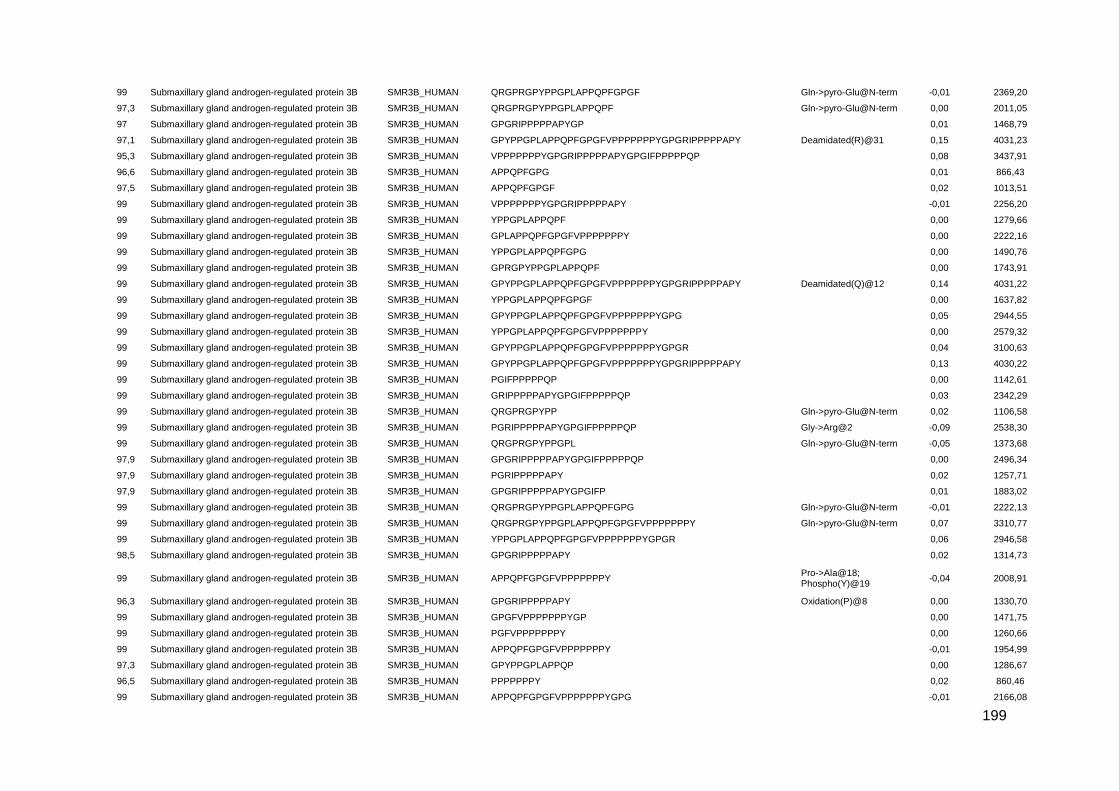
199
99 Submaxillary gland androgen-regulated protein 3B SMR3B_HUMAN QRGPRGPYPPGPLAPPQPFGPGF Gln->pyro-Glu@N-term -0,01 2369,20
97,3 Submaxillary gland androgen-regulated protein 3B SMR3B_HUMAN QRGPRGPYPPGPLAPPQPF Gln->pyro-Glu@N-term 0,00 2011,05
97 Submaxillary gland androgen-regulated protein 3B SMR3B_HUMAN GPGRIPPPPPAPYGP
0,01 1468,79
97,1 Submaxillary gland androgen-regulated protein 3B SMR3B_HUMAN GPYPPGPLAPPQPFGPGFVPPPPPPPYGPGRIPPPPPAPY Deamidated(R)@31 0,15 4031,23
95,3 Submaxillary gland androgen-regulated protein 3B SMR3B_HUMAN VPPPPPPPYGPGRIPPPPPAPYGPGIFPPPPPQP
0,08 3437,91
96,6 Submaxillary gland androgen-regulated protein 3B SMR3B_HUMAN APPQPFGPG
0,01 866,43
97,5 Submaxillary gland androgen-regulated protein 3B SMR3B_HUMAN APPQPFGPGF
0,02 1013,51
99 Submaxillary gland androgen-regulated protein 3B SMR3B_HUMAN VPPPPPPPYGPGRIPPPPPAPY
-0,01 2256,20
99 Submaxillary gland androgen-regulated protein 3B SMR3B_HUMAN YPPGPLAPPQPF
0,00 1279,66
99 Submaxillary gland androgen-regulated protein 3B SMR3B_HUMAN GPLAPPQPFGPGFVPPPPPPPY
0,00 2222,16
99 Submaxillary gland androgen-regulated protein 3B SMR3B_HUMAN YPPGPLAPPQPFGPG
0,00 1490,76
99 Submaxillary gland androgen-regulated protein 3B SMR3B_HUMAN GPRGPYPPGPLAPPQPF
0,00 1743,91
99 Submaxillary gland androgen-regulated protein 3B SMR3B_HUMAN GPYPPGPLAPPQPFGPGFVPPPPPPPYGPGRIPPPPPAPY Deamidated(Q)@12 0,14 4031,22
99 Submaxillary gland androgen-regulated protein 3B SMR3B_HUMAN YPPGPLAPPQPFGPGF
0,00 1637,82
99 Submaxillary gland androgen-regulated protein 3B SMR3B_HUMAN GPYPPGPLAPPQPFGPGFVPPPPPPPYGPG
0,05 2944,55
99 Submaxillary gland androgen-regulated protein 3B SMR3B_HUMAN YPPGPLAPPQPFGPGFVPPPPPPPY
0,00 2579,32
99 Submaxillary gland androgen-regulated protein 3B SMR3B_HUMAN GPYPPGPLAPPQPFGPGFVPPPPPPPYGPGR
0,04 3100,63
99 Submaxillary gland androgen-regulated protein 3B SMR3B_HUMAN GPYPPGPLAPPQPFGPGFVPPPPPPPYGPGRIPPPPPAPY
0,13 4030,22
99 Submaxillary gland androgen-regulated protein 3B SMR3B_HUMAN PGIFPPPPPQP
0,00 1142,61
99 Submaxillary gland androgen-regulated protein 3B SMR3B_HUMAN GRIPPPPPAPYGPGIFPPPPPQP
0,03 2342,29
99 Submaxillary gland androgen-regulated protein 3B SMR3B_HUMAN QRGPRGPYPP Gln->pyro-Glu@N-term 0,02 1106,58
99 Submaxillary gland androgen-regulated protein 3B SMR3B_HUMAN PGRIPPPPPAPYGPGIFPPPPPQP Gly->Arg@2 -0,09 2538,30
99 Submaxillary gland androgen-regulated protein 3B SMR3B_HUMAN QRGPRGPYPPGPL Gln->pyro-Glu@N-term -0,05 1373,68
97,9 Submaxillary gland androgen-regulated protein 3B SMR3B_HUMAN GPGRIPPPPPAPYGPGIFPPPPPQP
0,00 2496,34
97,9 Submaxillary gland androgen-regulated protein 3B SMR3B_HUMAN PGRIPPPPPAPY
0,02 1257,71
97,9 Submaxillary gland androgen-regulated protein 3B SMR3B_HUMAN GPGRIPPPPPAPYGPGIFP
0,01 1883,02
99 Submaxillary gland androgen-regulated protein 3B SMR3B_HUMAN QRGPRGPYPPGPLAPPQPFGPG Gln->pyro-Glu@N-term -0,01 2222,13
99 Submaxillary gland androgen-regulated protein 3B SMR3B_HUMAN QRGPRGPYPPGPLAPPQPFGPGFVPPPPPPPY Gln->pyro-Glu@N-term 0,07 3310,77
99 Submaxillary gland androgen-regulated protein 3B SMR3B_HUMAN YPPGPLAPPQPFGPGFVPPPPPPPYGPGR
0,06 2946,58
98,5 Submaxillary gland androgen-regulated protein 3B SMR3B_HUMAN GPGRIPPPPPAPY
0,02 1314,73
99 Submaxillary gland androgen-regulated protein 3B SMR3B_HUMAN APPQPFGPGFVPPPPPPPY Pro->Ala@18; Phospho(Y)@19
-0,04 2008,91
96,3 Submaxillary gland androgen-regulated protein 3B SMR3B_HUMAN GPGRIPPPPPAPY Oxidation(P)@8 0,00 1330,70
99 Submaxillary gland androgen-regulated protein 3B SMR3B_HUMAN GPGFVPPPPPPPYGP
0,00 1471,75
99 Submaxillary gland androgen-regulated protein 3B SMR3B_HUMAN PGFVPPPPPPPY
0,00 1260,66
99 Submaxillary gland androgen-regulated protein 3B SMR3B_HUMAN APPQPFGPGFVPPPPPPPY
-0,01 1954,99
97,3 Submaxillary gland androgen-regulated protein 3B SMR3B_HUMAN GPYPPGPLAPPQP
0,00 1286,67
96,5 Submaxillary gland androgen-regulated protein 3B SMR3B_HUMAN PPPPPPPY
0,02 860,46
99 Submaxillary gland androgen-regulated protein 3B SMR3B_HUMAN APPQPFGPGFVPPPPPPPYGPG
-0,01 2166,08
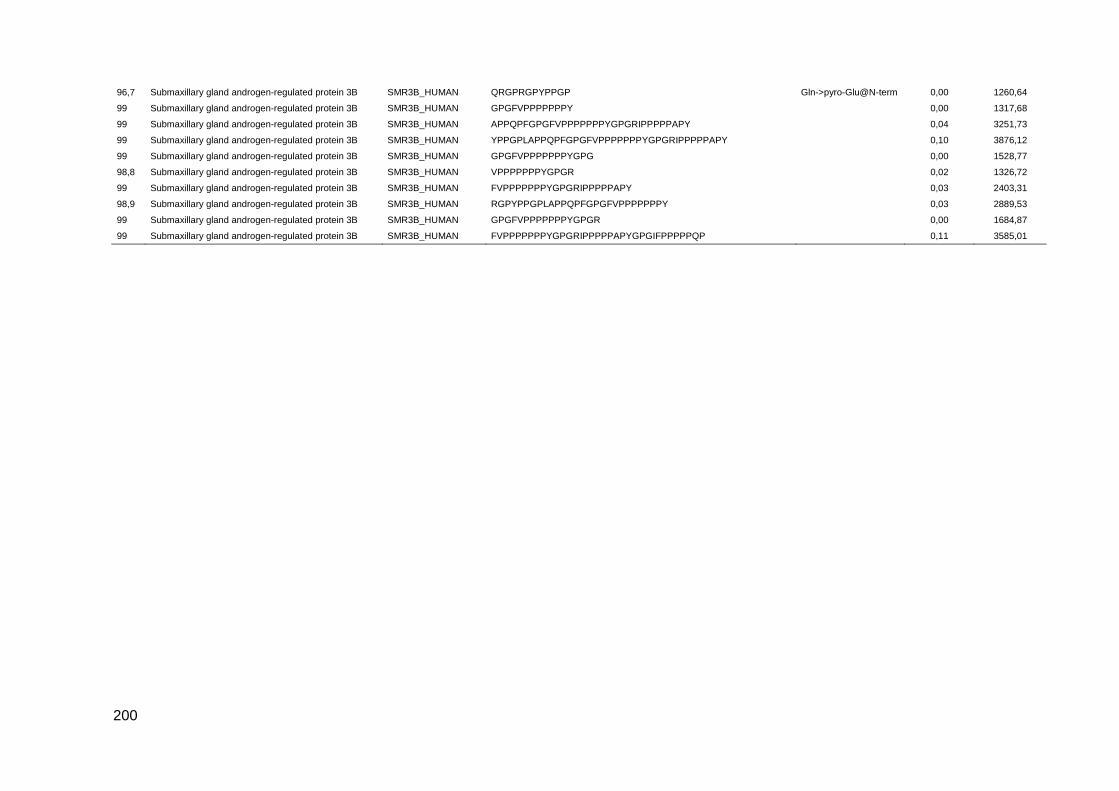
200
96,7 Submaxillary gland androgen-regulated protein 3B SMR3B_HUMAN QRGPRGPYPPGP Gln->pyro-Glu@N-term 0,00 1260,64
99 Submaxillary gland androgen-regulated protein 3B SMR3B_HUMAN GPGFVPPPPPPPY
0,00 1317,68
99 Submaxillary gland androgen-regulated protein 3B SMR3B_HUMAN APPQPFGPGFVPPPPPPPYGPGRIPPPPPAPY
0,04 3251,73
99 Submaxillary gland androgen-regulated protein 3B SMR3B_HUMAN YPPGPLAPPQPFGPGFVPPPPPPPYGPGRIPPPPPAPY
0,10 3876,12
99 Submaxillary gland androgen-regulated protein 3B SMR3B_HUMAN GPGFVPPPPPPPYGPG
0,00 1528,77
98,8 Submaxillary gland androgen-regulated protein 3B SMR3B_HUMAN VPPPPPPPYGPGR
0,02 1326,72
99 Submaxillary gland androgen-regulated protein 3B SMR3B_HUMAN FVPPPPPPPYGPGRIPPPPPAPY
0,03 2403,31
98,9 Submaxillary gland androgen-regulated protein 3B SMR3B_HUMAN RGPYPPGPLAPPQPFGPGFVPPPPPPPY
0,03 2889,53
99 Submaxillary gland androgen-regulated protein 3B SMR3B_HUMAN GPGFVPPPPPPPYGPGR
0,00 1684,87
99 Submaxillary gland androgen-regulated protein 3B SMR3B_HUMAN FVPPPPPPPYGPGRIPPPPPAPYGPGIFPPPPPQP
0,11 3585,01

201
Supplementary table S3: Salivary peptides identified in all groups, common to all DM-related groups and exclusive to T1D-R+N, T1D-R, T1D and Ctrl.
Conf Protein Name Accession Number Sequence Modifications ∆Mass Prec MW
Salivary peptides identified in all groups
99 Basic salivary proline-rich protein 1 PRP1_HUMAN GNPQGPSPQGGNKPQGPPPPPGKPQ Deamidated(N)@2; Pro->Asp@3
0,00 2433,16
98,4 Basic salivary proline-rich protein 1 PRP1_HUMAN GPPPPAGGNPQQPQAPPA
-0,01 1676,82
98,6 Basic salivary proline-rich protein 1 PRP1_HUMAN GPPQQGGNRPQGPPPPGKPQ Gln->Pro@5 -0,01 1959,00
99 Basic salivary proline-rich protein 1 PRP1_HUMAN APPGKPQGPPQQEGNNPQ
-0,16 1839,72
99 Basic salivary proline-rich protein 1 PRP1_HUMAN GGNQPQGPPPPPGKPQ
0,00 1551,78
99 Basic salivary proline-rich protein 1 PRP1_HUMAN GPPAQGGSKSQSARAPPGKPQGPPQQEGNNPQ
0,06 3148,60
99 Basic salivary proline-rich protein 1 PRP1_HUMAN GNPQGPSPQGGNKPQ
0,00 1461,70
96,3 Basic salivary proline-rich protein 1 PRP1_HUMAN GPPQQEGNNPQGPPPPAGGNPQQPQAPPAGQPQGPPRPPQ
0,08 3963,00
99 Basic salivary proline-rich protein 1 PRP1_HUMAN GPPAQGGSKSQSARAPPGKPQ
0,00 2002,04
99 Basic salivary proline-rich protein 1 PRP1_HUMAN GPPPPGKPQGPPPQ
0,00 1349,71
99 Basic salivary proline-rich protein 1 PRP1_HUMAN GPPPPAGGNPQQPQ
0,00 1340,65
99 Basic salivary proline-rich protein 1 PRP1_HUMAN GPPPPAGGNPQQPQAPPAGQPQGPP
0,00 2338,15
99 Basic salivary proline-rich protein 1 PRP1_HUMAN GPPPPAGGNPQQPQAPPAGQPQGPPRPP
0,04 2688,39
99 Basic salivary proline-rich protein 1 PRP1_HUMAN GPPPPAGGNPQQPQAPPAGQPQGPPRPPQ Deamidated(N)@9 0,04 2817,43
99 Basic salivary proline-rich protein 1 PRP1_HUMAN GPPPPAGGNPQQPQAPPAGQPQGPPRPPQGGRPS
0,08 3270,72
99 Basic salivary proline-rich protein 1 PRP1_HUMAN GPPPQGDKSRSPQSPPGKPQ Pro->Asp@4; Deamidated(Q)@5
-0,01 2059,98
99 Basic salivary proline-rich protein 1 PRP1_HUMAN GPPPQGGNQPQGPPPPPGKPQGPPPQGGNKPQ Gln->Lys@21 -0,01 3085,57
99 Basic salivary proline-rich protein 1 PRP1_HUMAN GPPPPPGKPQGPPPQGGNKPQGPPPPGKPQ
0,00 2883,52
99 Basic salivary proline-rich protein 1 PRP1_HUMAN GPPPQGDKSRSP
0,00 1221,61
96,6 Basic salivary proline-rich protein 1 PRP1_HUMAN GPPPQGGNKPQ
0,00 1075,54
99 Basic salivary proline-rich protein 1 PRP1_HUMAN GPPPQGDKSRSPR
0,00 1377,71
99 Basic salivary proline-rich protein 1 PRP1_HUMAN GPPPQGDKSRSPQSPPGKPQGPPPQGGNQPQ
0,04 3098,56
99 Basic salivary proline-rich protein 1 PRP1_HUMAN GPPPQGGNKPQGPPPPGKPQ
-0,01 1930,99
99 Basic salivary proline-rich protein 1 PRP1_HUMAN GPPPQGGNQPQGPPPPPGKPQ
0,00 2028,01
99 Basic salivary proline-rich protein 1 PRP1_HUMAN GPPQQEGNNPQGPPPPAGGNPQ
-0,01 2133,98
99 Basic salivary proline-rich protein 1 PRP1_HUMAN GPPPQGGNQPQ Acetyl@N-term -0,01 1117,51
99 Basic salivary proline-rich protein 1 PRP1_HUMAN GPPQQEGNNPQGPPPPAGGNPQQPQ Glu->Gln@6; Deamidated(N)@9
0,02 2487,17
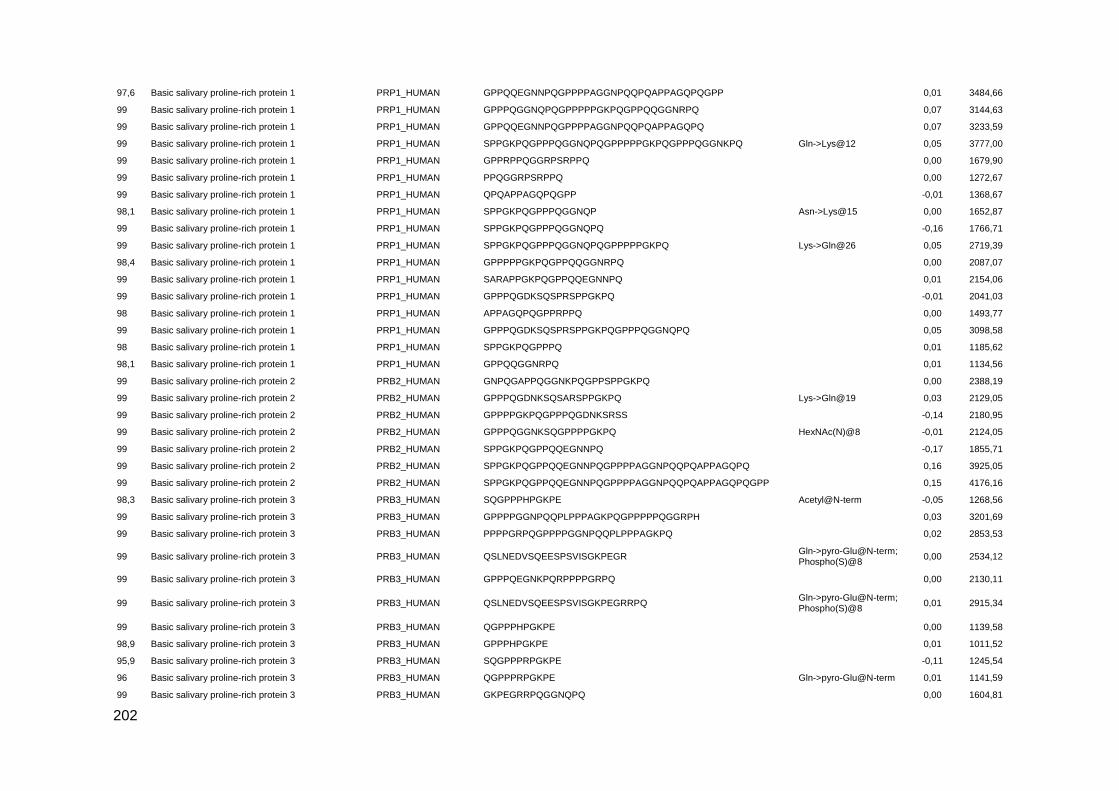
202
97,6 Basic salivary proline-rich protein 1 PRP1_HUMAN GPPQQEGNNPQGPPPPAGGNPQQPQAPPAGQPQGPP
0,01 3484,66
99 Basic salivary proline-rich protein 1 PRP1_HUMAN GPPPQGGNQPQGPPPPPGKPQGPPQQGGNRPQ
0,07 3144,63
99 Basic salivary proline-rich protein 1 PRP1_HUMAN GPPQQEGNNPQGPPPPAGGNPQQPQAPPAGQPQ
0,07 3233,59
99 Basic salivary proline-rich protein 1 PRP1_HUMAN SPPGKPQGPPPQGGNQPQGPPPPPGKPQGPPPQGGNKPQ Gln->Lys@12 0,05 3777,00
99 Basic salivary proline-rich protein 1 PRP1_HUMAN GPPRPPQGGRPSRPPQ
0,00 1679,90
99 Basic salivary proline-rich protein 1 PRP1_HUMAN PPQGGRPSRPPQ
0,00 1272,67
99 Basic salivary proline-rich protein 1 PRP1_HUMAN QPQAPPAGQPQGPP
-0,01 1368,67
98,1 Basic salivary proline-rich protein 1 PRP1_HUMAN SPPGKPQGPPPQGGNQP Asn->Lys@15 0,00 1652,87
99 Basic salivary proline-rich protein 1 PRP1_HUMAN SPPGKPQGPPPQGGNQPQ
-0,16 1766,71
99 Basic salivary proline-rich protein 1 PRP1_HUMAN SPPGKPQGPPPQGGNQPQGPPPPPGKPQ Lys->Gln@26 0,05 2719,39
98,4 Basic salivary proline-rich protein 1 PRP1_HUMAN GPPPPPGKPQGPPQQGGNRPQ
0,00 2087,07
99 Basic salivary proline-rich protein 1 PRP1_HUMAN SARAPPGKPQGPPQQEGNNPQ
0,01 2154,06
99 Basic salivary proline-rich protein 1 PRP1_HUMAN GPPPQGDKSQSPRSPPGKPQ
-0,01 2041,03
98 Basic salivary proline-rich protein 1 PRP1_HUMAN APPAGQPQGPPRPPQ
0,00 1493,77
99 Basic salivary proline-rich protein 1 PRP1_HUMAN GPPPQGDKSQSPRSPPGKPQGPPPQGGNQPQ
0,05 3098,58
98 Basic salivary proline-rich protein 1 PRP1_HUMAN SPPGKPQGPPPQ
0,01 1185,62
98,1 Basic salivary proline-rich protein 1 PRP1_HUMAN GPPQQGGNRPQ
0,01 1134,56
99 Basic salivary proline-rich protein 2 PRB2_HUMAN GNPQGAPPQGGNKPQGPPSPPGKPQ
0,00 2388,19
99 Basic salivary proline-rich protein 2 PRB2_HUMAN GPPPQGDNKSQSARSPPGKPQ Lys->Gln@19 0,03 2129,05
99 Basic salivary proline-rich protein 2 PRB2_HUMAN GPPPPGKPQGPPPQGDNKSRSS
-0,14 2180,95
99 Basic salivary proline-rich protein 2 PRB2_HUMAN GPPPQGGNKSQGPPPPGKPQ HexNAc(N)@8 -0,01 2124,05
99 Basic salivary proline-rich protein 2 PRB2_HUMAN SPPGKPQGPPQQEGNNPQ
-0,17 1855,71
99 Basic salivary proline-rich protein 2 PRB2_HUMAN SPPGKPQGPPQQEGNNPQGPPPPAGGNPQQPQAPPAGQPQ
0,16 3925,05
99 Basic salivary proline-rich protein 2 PRB2_HUMAN SPPGKPQGPPQQEGNNPQGPPPPAGGNPQQPQAPPAGQPQGPP
0,15 4176,16
98,3 Basic salivary proline-rich protein 3 PRB3_HUMAN SQGPPPHPGKPE Acetyl@N-term -0,05 1268,56
99 Basic salivary proline-rich protein 3 PRB3_HUMAN GPPPPGGNPQQPLPPPAGKPQGPPPPPQGGRPH
0,03 3201,69
99 Basic salivary proline-rich protein 3 PRB3_HUMAN PPPPGRPQGPPPPGGNPQQPLPPPAGKPQ
0,02 2853,53
99 Basic salivary proline-rich protein 3 PRB3_HUMAN QSLNEDVSQEESPSVISGKPEGR Gln->pyro-Glu@N-term; Phospho(S)@8
0,00 2534,12
99 Basic salivary proline-rich protein 3 PRB3_HUMAN GPPPQEGNKPQRPPPPGRPQ
0,00 2130,11
99 Basic salivary proline-rich protein 3 PRB3_HUMAN QSLNEDVSQEESPSVISGKPEGRRPQ Gln->pyro-Glu@N-term; Phospho(S)@8
0,01 2915,34
99 Basic salivary proline-rich protein 3 PRB3_HUMAN QGPPPHPGKPE
0,00 1139,58
98,9 Basic salivary proline-rich protein 3 PRB3_HUMAN GPPPHPGKPE
0,01 1011,52
95,9 Basic salivary proline-rich protein 3 PRB3_HUMAN SQGPPPRPGKPE
-0,11 1245,54
96 Basic salivary proline-rich protein 3 PRB3_HUMAN QGPPPRPGKPE Gln->pyro-Glu@N-term 0,01 1141,59
99 Basic salivary proline-rich protein 3 PRB3_HUMAN GKPEGRRPQGGNQPQ
0,00 1604,81
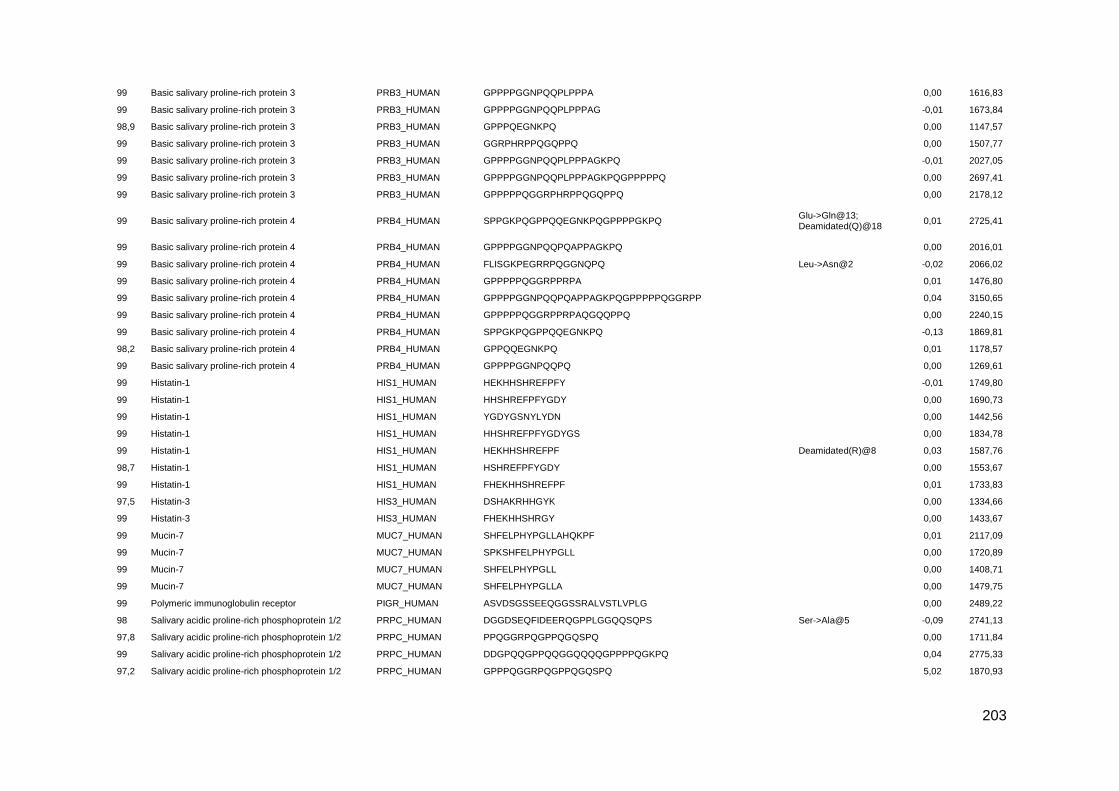
203
99 Basic salivary proline-rich protein 3 PRB3_HUMAN GPPPPGGNPQQPLPPPA
0,00 1616,83
99 Basic salivary proline-rich protein 3 PRB3_HUMAN GPPPPGGNPQQPLPPPAG
-0,01 1673,84
98,9 Basic salivary proline-rich protein 3 PRB3_HUMAN GPPPQEGNKPQ
0,00 1147,57
99 Basic salivary proline-rich protein 3 PRB3_HUMAN GGRPHRPPQGQPPQ
0,00 1507,77
99 Basic salivary proline-rich protein 3 PRB3_HUMAN GPPPPGGNPQQPLPPPAGKPQ
-0,01 2027,05
99 Basic salivary proline-rich protein 3 PRB3_HUMAN GPPPPGGNPQQPLPPPAGKPQGPPPPPQ
0,00 2697,41
99 Basic salivary proline-rich protein 3 PRB3_HUMAN GPPPPPQGGRPHRPPQGQPPQ
0,00 2178,12
99 Basic salivary proline-rich protein 4 PRB4_HUMAN SPPGKPQGPPQQEGNKPQGPPPPGKPQ Glu->Gln@13; Deamidated(Q)@18
0,01 2725,41
99 Basic salivary proline-rich protein 4 PRB4_HUMAN GPPPPGGNPQQPQAPPAGKPQ
0,00 2016,01
99 Basic salivary proline-rich protein 4 PRB4_HUMAN FLISGKPEGRRPQGGNQPQ Leu->Asn@2 -0,02 2066,02
99 Basic salivary proline-rich protein 4 PRB4_HUMAN GPPPPPQGGRPPRPA
0,01 1476,80
99 Basic salivary proline-rich protein 4 PRB4_HUMAN GPPPPGGNPQQPQAPPAGKPQGPPPPPQGGRPP
0,04 3150,65
99 Basic salivary proline-rich protein 4 PRB4_HUMAN GPPPPPQGGRPPRPAQGQQPPQ
0,00 2240,15
99 Basic salivary proline-rich protein 4 PRB4_HUMAN SPPGKPQGPPQQEGNKPQ
-0,13 1869,81
98,2 Basic salivary proline-rich protein 4 PRB4_HUMAN GPPQQEGNKPQ
0,01 1178,57
99 Basic salivary proline-rich protein 4 PRB4_HUMAN GPPPPGGNPQQPQ
0,00 1269,61
99 Histatin-1 HIS1_HUMAN HEKHHSHREFPFY
-0,01 1749,80
99 Histatin-1 HIS1_HUMAN HHSHREFPFYGDY
0,00 1690,73
99 Histatin-1 HIS1_HUMAN YGDYGSNYLYDN
0,00 1442,56
99 Histatin-1 HIS1_HUMAN HHSHREFPFYGDYGS
0,00 1834,78
99 Histatin-1 HIS1_HUMAN HEKHHSHREFPF Deamidated(R)@8 0,03 1587,76
98,7 Histatin-1 HIS1_HUMAN HSHREFPFYGDY
0,00 1553,67
99 Histatin-1 HIS1_HUMAN FHEKHHSHREFPF
0,01 1733,83
97,5 Histatin-3 HIS3_HUMAN DSHAKRHHGYK
0,00 1334,66
99 Histatin-3 HIS3_HUMAN FHEKHHSHRGY
0,00 1433,67
99 Mucin-7 MUC7_HUMAN SHFELPHYPGLLAHQKPF
0,01 2117,09
99 Mucin-7 MUC7_HUMAN SPKSHFELPHYPGLL
0,00 1720,89
99 Mucin-7 MUC7_HUMAN SHFELPHYPGLL
0,00 1408,71
99 Mucin-7 MUC7_HUMAN SHFELPHYPGLLA
0,00 1479,75
99 Polymeric immunoglobulin receptor PIGR_HUMAN ASVDSGSSEEQGGSSRALVSTLVPLG
0,00 2489,22
98 Salivary acidic proline-rich phosphoprotein 1/2 PRPC_HUMAN DGGDSEQFIDEERQGPPLGGQQSQPS Ser->Ala@5 -0,09 2741,13
97,8 Salivary acidic proline-rich phosphoprotein 1/2 PRPC_HUMAN PPQGGRPQGPPQGQSPQ
0,00 1711,84
99 Salivary acidic proline-rich phosphoprotein 1/2 PRPC_HUMAN DDGPQQGPPQQGGQQQQGPPPPQGKPQ
0,04 2775,33
97,2 Salivary acidic proline-rich phosphoprotein 1/2 PRPC_HUMAN GPPPQGGRPQGPPQGQSPQ
5,02 1870,93

204
98 Salivary acidic proline-rich phosphoprotein 1/2 PRPC_HUMAN DGGDSEQFIDEERQGPPLGGQQ Dehydrated(D)@1; Phospho(S)@5; Deamidated(Q)@7
0,00 2420,98
98,1 Salivary acidic proline-rich phosphoprotein 1/2 PRPC_HUMAN GRPQGPPQQGGHQQGPPPPPPGKPQGPPPQ
0,04 2996,55
97,5 Salivary acidic proline-rich phosphoprotein 1/2 PRPC_HUMAN RGRPQGPPQQGGHQQ
0,00 1626,80
97,7 Salivary acidic proline-rich phosphoprotein 1/2 PRPC_HUMAN GGRPQGPPQGQSPQ
4,06 1393,73
99 Salivary acidic proline-rich phosphoprotein 1/2 PRPC_HUMAN DGGDSEQFIDEERQ
0,01 1623,68
98,5 Salivary acidic proline-rich phosphoprotein 1/2 PRPC_HUMAN GPPPPPPGKPQGPPPQGGRPQGPPQGQSPQ Acetyl@N-term -0,03 2957,46
99 Salivary acidic proline-rich phosphoprotein 1/2 PRPC_HUMAN SQPSAGDGNQDDGPQQGPPQQGGQQQQGPPPPQGKPQ Asp->Asn@7 0,07 3715,77
98,5 Salivary acidic proline-rich phosphoprotein 1/2 PRPC_HUMAN GRPQGPPQQGGHQQ Deamidated(R)@2 0,01 1471,70
98,3 Salivary acidic proline-rich phosphoprotein 1/2 PRPC_HUMAN PQGPPQQGGHPRPP
0,01 1448,73
99 Salivary acidic proline-rich phosphoprotein 1/2 PRPC_HUMAN GPPPQGGRPQ
0,03 989,53
98,5 Salivary acidic proline-rich phosphoprotein 1/2 PRPC_HUMAN QGGHPPPPQGRPQ
0,01 1351,68
95,1 Salivary acidic proline-rich phosphoprotein 1/2 PRPC_HUMAN QGPPLGGQQSQPS
0,00 1279,61
99 Salivary acidic proline-rich phosphoprotein 1/2 PRPC_HUMAN AGDGNQDDGPQQGPPQQGGQQQQ Asp->Asn@3 0,03 2333,03
98,6 Salivary acidic proline-rich phosphoprotein 1/2 PRPC_HUMAN AGDGNQDDGPQQGPPQQGGQQQQGPPPPQGKPQ Asp->Asn@3 0,03 3316,55
99 Salivary acidic proline-rich phosphoprotein 1/2 PRPC_HUMAN DDGPQQGPPQQGGQQQQ Asp->Asn@2 -0,01 1790,79
99 Salivary acidic proline-rich phosphoprotein 1/2 PRPC_HUMAN AGDGNQDDGPQQGPPQQGGQQQ Asp->Asn@3 0,00 2204,94
98,7 Salivary acidic proline-rich phosphoprotein 1/2 PRPC_HUMAN QQGPPPPQGKPQ
0,00 1257,65
98,8 Salivary acidic proline-rich phosphoprotein 1/2 PRPC_HUMAN GPPPPPPGKPQGPPPQGGRPQ
-0,01 2039,06
99 Salivary acidic proline-rich phosphoprotein 1/2 PRPC_HUMAN GGDSEQFIDEERQGPPLGGQ Phospho(S)@4 0,00 2194,92
98,9 Salivary acidic proline-rich phosphoprotein 1/2 PRPC_HUMAN GPPQQGGHQQGPPPPPPGKPQGPPPQGGRPQGPPQGQSPQ Deamidated(Q)@26; Amidated@C-term
0,09 3930,03
98,9 Salivary acidic proline-rich phosphoprotein 1/2 PRPC_HUMAN IDEERQGPPLGGQQSQPS
-0,01 1921,91
99 Salivary acidic proline-rich phosphoprotein 1/2 PRPC_HUMAN GGDSEQFIDEERQGPPLGGQQSQPS Dehydrated(S)@4 -0,55 2623,63
99 Salivary acidic proline-rich phosphoprotein 1/2 PRPC_HUMAN GGDSEQFIDEER Phospho(S)@4 0,00 1460,54
99 Salivary acidic proline-rich phosphoprotein 1/2 PRPC_HUMAN GGDSEQFIDEERQ Phospho(S)@4 0,00 1588,60
99 Salivary acidic proline-rich phosphoprotein 1/2 PRPC_HUMAN GPPPPPPGKPQGPPPQ
0,00 1543,81
99 Salivary acidic proline-rich phosphoprotein 1/2 PRPC_HUMAN GGDSEQFIDEERQGPPLGGQQ Dehydrated(S)@4 0,01 2225,01
99 Salivary acidic proline-rich phosphoprotein 1/2 PRPC_HUMAN GPPQQGGHPPPPQGRPQ Acetyl@N-term -0,05 1772,82
99 Salivary acidic proline-rich phosphoprotein 1/2 PRPC_HUMAN QGRPQGPPQQGGHPRPP
0,00 1789,91
99 Salivary acidic proline-rich phosphoprotein 1/2 PRPC_HUMAN GPPQQGGHQQGPPPPPPGKPQGPPPQGGRPQ
0,04 3053,57
99 Salivary acidic proline-rich phosphoprotein 1/2 PRPC_HUMAN GRPQGPPQQGGHQQGPPPPPPGKPQ Acetyl@N-term -0,09 2562,19
99 Salivary acidic proline-rich phosphoprotein 1/2 PRPC_HUMAN GPPQQGGHPPPPQGRPQGPPQQGGHPRPP
0,03 2936,49
95,8 Salivary acidic proline-rich phosphoprotein 1/2 PRPC_HUMAN GHPPPPQGRPQ
0,01 1166,61
96,7 Salivary acidic proline-rich phosphoprotein 1/2 PRPC_HUMAN GRPQGPPQQGGHQQGPPPPPPGKPQGPPPQGGRPQ Gln->Lys@30 -0,01 3491,80
99 Salivary acidic proline-rich phosphoprotein 1/2 PRPC_HUMAN GPPQQGGHPRPPRGRPQ
-0,16 1817,79
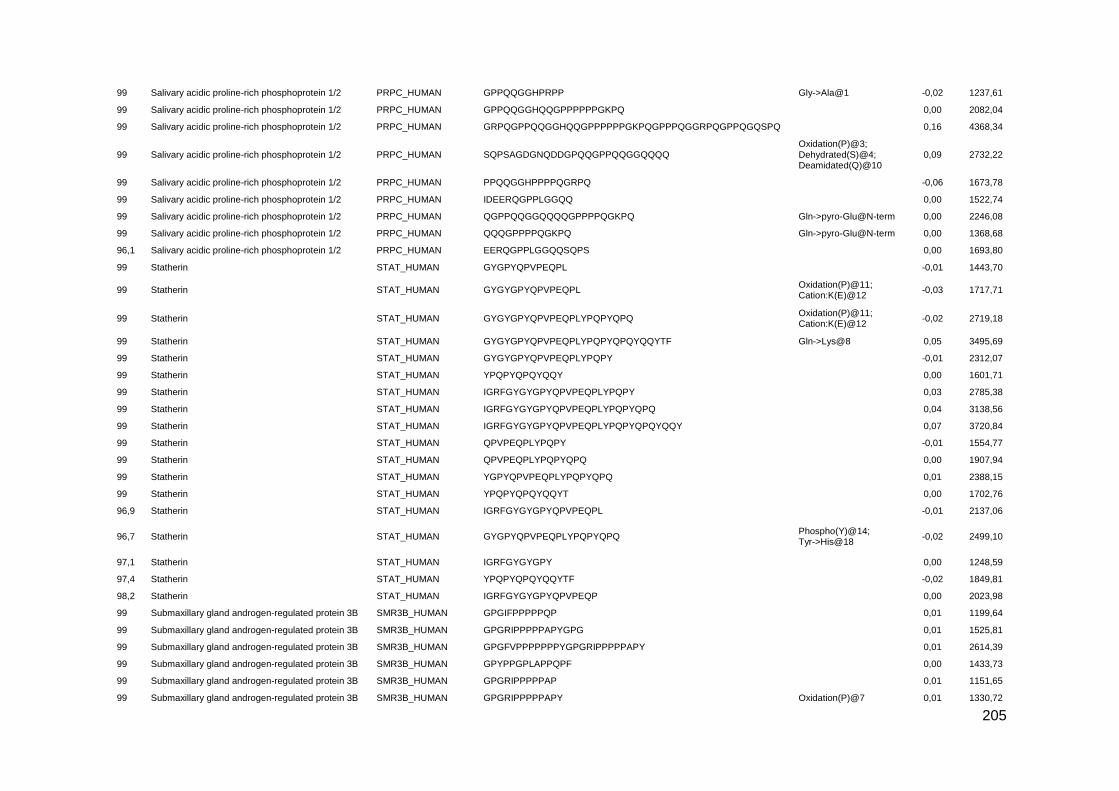
205
99 Salivary acidic proline-rich phosphoprotein 1/2 PRPC_HUMAN GPPQQGGHPRPP Gly->Ala@1 -0,02 1237,61
99 Salivary acidic proline-rich phosphoprotein 1/2 PRPC_HUMAN GPPQQGGHQQGPPPPPPGKPQ
0,00 2082,04
99 Salivary acidic proline-rich phosphoprotein 1/2 PRPC_HUMAN GRPQGPPQQGGHQQGPPPPPPGKPQGPPPQGGRPQGPPQGQSPQ
0,16 4368,34
99 Salivary acidic proline-rich phosphoprotein 1/2 PRPC_HUMAN SQPSAGDGNQDDGPQQGPPQQGGQQQQ Oxidation(P)@3; Dehydrated(S)@4; Deamidated(Q)@10
0,09 2732,22
99 Salivary acidic proline-rich phosphoprotein 1/2 PRPC_HUMAN PPQQGGHPPPPQGRPQ
-0,06 1673,78
99 Salivary acidic proline-rich phosphoprotein 1/2 PRPC_HUMAN IDEERQGPPLGGQQ
0,00 1522,74
99 Salivary acidic proline-rich phosphoprotein 1/2 PRPC_HUMAN QGPPQQGGQQQQGPPPPQGKPQ Gln->pyro-Glu@N-term 0,00 2246,08
99 Salivary acidic proline-rich phosphoprotein 1/2 PRPC_HUMAN QQQGPPPPQGKPQ Gln->pyro-Glu@N-term 0,00 1368,68
96,1 Salivary acidic proline-rich phosphoprotein 1/2 PRPC_HUMAN EERQGPPLGGQQSQPS
0,00 1693,80
99 Statherin STAT_HUMAN GYGPYQPVPEQPL
-0,01 1443,70
99 Statherin STAT_HUMAN GYGYGPYQPVPEQPL Oxidation(P)@11; Cation:K(E)@12
-0,03 1717,71
99 Statherin STAT_HUMAN GYGYGPYQPVPEQPLYPQPYQPQ Oxidation(P)@11; Cation:K(E)@12
-0,02 2719,18
99 Statherin STAT_HUMAN GYGYGPYQPVPEQPLYPQPYQPQYQQYTF Gln->Lys@8 0,05 3495,69
99 Statherin STAT_HUMAN GYGYGPYQPVPEQPLYPQPY
-0,01 2312,07
99 Statherin STAT_HUMAN YPQPYQPQYQQY
0,00 1601,71
99 Statherin STAT_HUMAN IGRFGYGYGPYQPVPEQPLYPQPY
0,03 2785,38
99 Statherin STAT_HUMAN IGRFGYGYGPYQPVPEQPLYPQPYQPQ
0,04 3138,56
99 Statherin STAT_HUMAN IGRFGYGYGPYQPVPEQPLYPQPYQPQYQQY
0,07 3720,84
99 Statherin STAT_HUMAN QPVPEQPLYPQPY
-0,01 1554,77
99 Statherin STAT_HUMAN QPVPEQPLYPQPYQPQ
0,00 1907,94
99 Statherin STAT_HUMAN YGPYQPVPEQPLYPQPYQPQ
0,01 2388,15
99 Statherin STAT_HUMAN YPQPYQPQYQQYT
0,00 1702,76
96,9 Statherin STAT_HUMAN IGRFGYGYGPYQPVPEQPL
-0,01 2137,06
96,7 Statherin STAT_HUMAN GYGPYQPVPEQPLYPQPYQPQ Phospho(Y)@14; Tyr->His@18
-0,02 2499,10
97,1 Statherin STAT_HUMAN IGRFGYGYGPY
0,00 1248,59
97,4 Statherin STAT_HUMAN YPQPYQPQYQQYTF
-0,02 1849,81
98,2 Statherin STAT_HUMAN IGRFGYGYGPYQPVPEQP
0,00 2023,98
99 Submaxillary gland androgen-regulated protein 3B SMR3B_HUMAN GPGIFPPPPPQP
0,01 1199,64
99 Submaxillary gland androgen-regulated protein 3B SMR3B_HUMAN GPGRIPPPPPAPYGPG
0,01 1525,81
99 Submaxillary gland androgen-regulated protein 3B SMR3B_HUMAN GPGFVPPPPPPPYGPGRIPPPPPAPY
0,01 2614,39
99 Submaxillary gland androgen-regulated protein 3B SMR3B_HUMAN GPYPPGPLAPPQPF
0,00 1433,73
99 Submaxillary gland androgen-regulated protein 3B SMR3B_HUMAN GPGRIPPPPPAP
0,01 1151,65
99 Submaxillary gland androgen-regulated protein 3B SMR3B_HUMAN GPGRIPPPPPAPY Oxidation(P)@7 0,01 1330,72
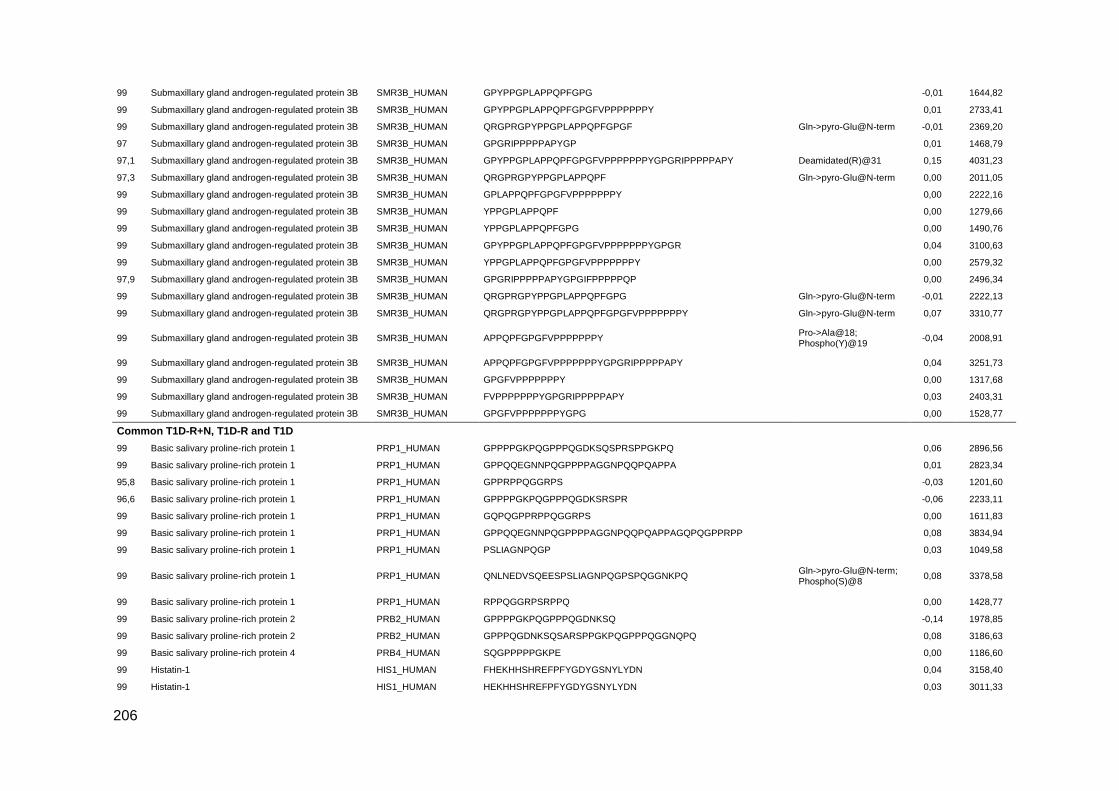
206
99 Submaxillary gland androgen-regulated protein 3B SMR3B_HUMAN GPYPPGPLAPPQPFGPG
-0,01 1644,82
99 Submaxillary gland androgen-regulated protein 3B SMR3B_HUMAN GPYPPGPLAPPQPFGPGFVPPPPPPPY
0,01 2733,41
99 Submaxillary gland androgen-regulated protein 3B SMR3B_HUMAN QRGPRGPYPPGPLAPPQPFGPGF Gln->pyro-Glu@N-term -0,01 2369,20
97 Submaxillary gland androgen-regulated protein 3B SMR3B_HUMAN GPGRIPPPPPAPYGP
0,01 1468,79
97,1 Submaxillary gland androgen-regulated protein 3B SMR3B_HUMAN GPYPPGPLAPPQPFGPGFVPPPPPPPYGPGRIPPPPPAPY Deamidated(R)@31 0,15 4031,23
97,3 Submaxillary gland androgen-regulated protein 3B SMR3B_HUMAN QRGPRGPYPPGPLAPPQPF Gln->pyro-Glu@N-term 0,00 2011,05
99 Submaxillary gland androgen-regulated protein 3B SMR3B_HUMAN GPLAPPQPFGPGFVPPPPPPPY
0,00 2222,16
99 Submaxillary gland androgen-regulated protein 3B SMR3B_HUMAN YPPGPLAPPQPF
0,00 1279,66
99 Submaxillary gland androgen-regulated protein 3B SMR3B_HUMAN YPPGPLAPPQPFGPG
0,00 1490,76
99 Submaxillary gland androgen-regulated protein 3B SMR3B_HUMAN GPYPPGPLAPPQPFGPGFVPPPPPPPYGPGR
0,04 3100,63
99 Submaxillary gland androgen-regulated protein 3B SMR3B_HUMAN YPPGPLAPPQPFGPGFVPPPPPPPY
0,00 2579,32
97,9 Submaxillary gland androgen-regulated protein 3B SMR3B_HUMAN GPGRIPPPPPAPYGPGIFPPPPPQP
0,00 2496,34
99 Submaxillary gland androgen-regulated protein 3B SMR3B_HUMAN QRGPRGPYPPGPLAPPQPFGPG Gln->pyro-Glu@N-term -0,01 2222,13
99 Submaxillary gland androgen-regulated protein 3B SMR3B_HUMAN QRGPRGPYPPGPLAPPQPFGPGFVPPPPPPPY Gln->pyro-Glu@N-term 0,07 3310,77
99 Submaxillary gland androgen-regulated protein 3B SMR3B_HUMAN APPQPFGPGFVPPPPPPPY Pro->Ala@18; Phospho(Y)@19
-0,04 2008,91
99 Submaxillary gland androgen-regulated protein 3B SMR3B_HUMAN APPQPFGPGFVPPPPPPPYGPGRIPPPPPAPY
0,04 3251,73
99 Submaxillary gland androgen-regulated protein 3B SMR3B_HUMAN GPGFVPPPPPPPY
0,00 1317,68
99 Submaxillary gland androgen-regulated protein 3B SMR3B_HUMAN FVPPPPPPPYGPGRIPPPPPAPY
0,03 2403,31
99 Submaxillary gland androgen-regulated protein 3B SMR3B_HUMAN GPGFVPPPPPPPYGPG
0,00 1528,77
Common T1D-R+N, T1D-R and T1D
99 Basic salivary proline-rich protein 1 PRP1_HUMAN GPPPPGKPQGPPPQGDKSQSPRSPPGKPQ 0,06 2896,56
99 Basic salivary proline-rich protein 1 PRP1_HUMAN GPPQQEGNNPQGPPPPAGGNPQQPQAPPA 0,01 2823,34
95,8 Basic salivary proline-rich protein 1 PRP1_HUMAN GPPRPPQGGRPS -0,03 1201,60
96,6 Basic salivary proline-rich protein 1 PRP1_HUMAN GPPPPGKPQGPPPQGDKSRSPR -0,06 2233,11
99 Basic salivary proline-rich protein 1 PRP1_HUMAN GQPQGPPRPPQGGRPS 0,00 1611,83
99 Basic salivary proline-rich protein 1 PRP1_HUMAN GPPQQEGNNPQGPPPPAGGNPQQPQAPPAGQPQGPPRPP 0,08 3834,94
99 Basic salivary proline-rich protein 1 PRP1_HUMAN PSLIAGNPQGP 0,03 1049,58
99 Basic salivary proline-rich protein 1 PRP1_HUMAN QNLNEDVSQEESPSLIAGNPQGPSPQGGNKPQ Gln->pyro-Glu@N-term; Phospho(S)@8
0,08 3378,58
99 Basic salivary proline-rich protein 1 PRP1_HUMAN RPPQGGRPSRPPQ 0,00 1428,77
99 Basic salivary proline-rich protein 2 PRB2_HUMAN GPPPPGKPQGPPPQGDNKSQ -0,14 1978,85
99 Basic salivary proline-rich protein 2 PRB2_HUMAN GPPPQGDNKSQSARSPPGKPQGPPPQGGNQPQ 0,08 3186,63
99 Basic salivary proline-rich protein 4 PRB4_HUMAN SQGPPPPPGKPE 0,00 1186,60
99 Histatin-1 HIS1_HUMAN FHEKHHSHREFPFYGDYGSNYLYDN 0,04 3158,40
99 Histatin-1 HIS1_HUMAN HEKHHSHREFPFYGDYGSNYLYDN 0,03 3011,33

207
97 Histatin-1 HIS1_HUMAN DSHEKRHHGY 0,01 1264,58
96,2 Histatin-1 HIS1_HUMAN GDYGSNYLYDN 0,01 1279,51
96,9 Histatin-1 HIS1_HUMAN HHSHREFP 0,00 1045,48
96,5 Histatin-1 HIS1_HUMAN KFHEKHHSHREFPFYGDYGSNYLYDN 0,05 3286,51
98,9 Histatin-1 HIS1_HUMAN HSHREFPFYGDYGSNYLYDN 0,00 2480,05
99 Histatin-1 HIS1_HUMAN FHEKHHSHREFP -0,01 1586,74
99 Histatin-1 HIS1_HUMAN HEKHHSHREFP 0,02 1439,70
99 Histatin-1 HIS1_HUMAN EKHHSHREFPFYGDYGSNYLYDN -0,01 2874,24
99 Histatin-3 HIS3_HUMAN KFHEKHHSHRGY Deamidated(R)@10 0,01 1562,76
99 Histatin-3 HIS3_HUMAN DSHAKRHHGYKR 0,00 1490,76
99 Mucin-7 MUC7_HUMAN ELPHYPGLLAHQKPF 0,00 1745,92
99 Salivary acidic proline-rich phosphoprotein ½ PRPC_HUMAN DGPQQGPPQQGGQQQQGPPPPQGKPQ 0,02 2660,29
95,2 Statherin STAT_HUMAN RFGYGYGPYQPVPEQPLYPQPYQPQ 0,03 2968,45
99 Statherin STAT_HUMAN RIGRFGYGYGPYQPVPEQPLYPQPYQPQ 0,05 3294,67
Exclusive to T1D-R+N
99 Basic salivary proline-rich protein 1 PRP1_HUMAN AGNPQGPSPQGGNKPQ Ser->Pro@8 0,00 1542,75
99 Basic salivary proline-rich protein 1 PRP1_HUMAN APPAGQPQGPPRPPQGGRPS 0,00 1948,00
96,8 Basic salivary proline-rich protein 1 PRP1_HUMAN GPPPPPGKPQGPPP 0,00 1318,71
99 Basic salivary proline-rich protein 1 PRP1_HUMAN GPPPQGGNKPQGPPPPGKPQGPPPQGDKSQS Ser->Met@29; Deamidated(Q)@30; Phospho(S)@31
0,15 3134,62
99 Basic salivary proline-rich protein 1 PRP1_HUMAN GPPPQGGNQPQGPPPPPGKPQGPPPQ 0,03 2504,29
99 Basic salivary proline-rich protein 1 PRP1_HUMAN GPPPQGGNQPQGPPPPPGKPQGPPPQGGNKPQGPPPPGKPQ Deamidated(N)@29; Amidated@C-term
0,09 3941,10
97,3 Basic salivary proline-rich protein 1 PRP1_HUMAN GNKPQGPPPPGKPQ -0,02 1397,72
99 Basic salivary proline-rich protein 1 PRP1_HUMAN PSPQGGNKPQGPPPPPGKPQGPPPQGGNKPQGPPPPGKPQ Phospho(S)@2; Gln->Asp@4
0,13 3941,07
99 Basic salivary proline-rich protein 1 PRP1_HUMAN QGGNKPQGPPPPPGKPQ Gln->pyro-Glu@N-term 0,00 1662,85
99 Basic salivary proline-rich protein 1 PRP1_HUMAN QGPPPQGGNKPQGPPPPGKPQ Gln->Cys@1 0,02 2034,03
99 Basic salivary proline-rich protein 1 PRP1_HUMAN SLIAGNPQGPSPQGGNKPQ 0,00 1845,93
99 Basic salivary proline-rich protein 1 PRP1_HUMAN SPPGKPQGPPPQGGNQPQGPPPPPGKPQGPPPQGGNKPQG Lys->Ala@37 0,16 3777,03
99 Basic salivary proline-rich protein 1 PRP1_HUMAN APPGKPQGPPQQEGNNPQGPPPPAGGNPQQPQ 0,08 3162,60
98,5 Basic salivary proline-rich protein 2 PRB2_HUMAN GPPPQGDNKSR 0,02 1151,58
99 Basic salivary proline-rich protein 2 PRB2_HUMAN AGNPQGAPPQGGNKPQ Ala->Pro@7 0,00 1542,75
99 Basic salivary proline-rich protein 2 PRB2_HUMAN GPPPPGKPQGPPPQGDNKSQSA -0,05 2137,00
99 Basic salivary proline-rich protein 2 PRB2_HUMAN GPPPQGGNKPQGPPPPGKPQGPPPQGDNK Lys->Thr@29 0,03 2794,41

208
99 Basic salivary proline-rich protein 2 PRB2_HUMAN QNLNEDVSQEESPSLIAGNPQGAPPQGGNKPQ Gln->pyro-Glu@N-term; Phospho(S)@8; Ala->Ser@23
0,07 3378,57
96,8 Basic salivary proline-rich protein 2 PRB2_HUMAN GPPPPGKPQGPPPQGDNKSQS Gln->Tyr@20; Phospho(S)@21
-0,03 2180,96
99 Basic salivary proline-rich protein 2 PRB2_HUMAN QGGNKPQGPPSPPGKPQGPPPQGGNQPQ Gln->pyro-Glu@N-term 0,08 2710,40
99 Basic salivary proline-rich protein 2 PRB2_HUMAN SRSPPGKPQGPPPQGGNQPQ Arg->Asp@2 0,00 1968,93
96,1 Basic salivary proline-rich protein 2 PRB2_HUMAN GPPPPGKPQGPPPQGDNKS -0,12 1850,80
99 Basic salivary proline-rich protein 2 PRB2_HUMAN GGNKSQGPPPPGKPQ HexNAc(N)@3 0,00 1647,82
95,6 Basic salivary proline-rich protein 3 PRB3_HUMAN SGKPEGRRPQGGNQPQ 0,00 1691,84
99 Basic salivary proline-rich protein 3 PRB3_HUMAN PGKPEGPPPQGGNQSQGPPP HexNAc(N)@13 0,01 2125,01
99 Basic salivary proline-rich protein 3 PRB3_HUMAN QGGRPHRPPQGQPPQ -0,01 1635,83
99 Basic salivary proline-rich protein 3 PRB3_HUMAN QSLNEDVSQEESPSVISGKPEGRRPQGGNQPQ Gln->pyro-Glu@N-term; Phospho(S)@8
0,10 3496,68
97,5 Basic salivary proline-rich protein 3 PRB3_HUMAN SQGPPPHPGKPEGPPPQGGNQSQG Gly->Phe@19 0,01 2421,16
99 Basic salivary proline-rich protein 4 PRB4_HUMAN GKPQGPPQQEGNKPQ 0,00 1588,79
99 Basic salivary proline-rich protein 4 PRB4_HUMAN GPPPPGGNPQQPQAPPAGKPQGPPPPPQGGRPPRPAQGQQPPQ 0,16 4238,33
99 Basic salivary proline-rich protein 4 PRB4_HUMAN GPPPPPQGGRPPRPAQ 0,00 1604,85
99 Basic salivary proline-rich protein 4 PRB4_HUMAN PPPQGGNQSHRPPPPPGKPE 0,00 2070,04
99 Basic salivary proline-rich protein 4 PRB4_HUMAN QSHRPPPPPGKPE Gln->pyro-Glu@N-term 0,01 1405,72
97 Basic salivary proline-rich protein 4 PRB4_HUMAN SQGPPPHPGKPERPPPQGGNQSQ Deamidated(N)@20; Gln->Asp@23
0,04 2361,15
99 Basic salivary proline-rich protein 4 PRB4_HUMAN SQGPPPHPGKPEGPPPQEGNKSRSA 0,01 2532,25
98,6 Basic salivary proline-rich protein 4 PRB4_HUMAN FLISGKPEGRRPQ 0,00 1483,83
95,5 Histatin-1 HIS1_HUMAN FHEKHHSHREF Arg->Thr@9 0,01 1434,65
99 Histatin-1 HIS1_HUMAN RKFHEKHHSHREFPF 0,00 2018,01
98,4 Histatin-1 HIS1_HUMAN KFHEKHHSHREFPF -0,08 1861,84
99 Mucin-7 MUC7_HUMAN SPKSHFELPHYPGLLA -0,01 1791,92
99 Mucin-7 MUC7_HUMAN ELPHYPGLLA 0,01 1108,60
99 Mucin-7 MUC7_HUMAN KSHFELPHYPGLL 0,00 1536,81
99 Mucin-7 MUC7_HUMAN HFELPHYPGLLA 0,00 1392,72
99 Proline-rich protein 4 PROL4_HUMAN PPPEGLLPRPPGDSGNQDDGPQ 0,01 2239,06
95,3 Salivary acidic proline-rich phosphoprotein 1/2 PRPC_HUMAN QGGRPQGPPQGQSPQ 0,00 1517,73
97,9 Salivary acidic proline-rich phosphoprotein 1/2 PRPC_HUMAN VISDGGDSEQF Phospho(S)@8 0,01 1232,47
99 Salivary acidic proline-rich phosphoprotein 1/2 PRPC_HUMAN DGGDSEQFIDEERQGPPL Phospho(S)@5 0,00 2067,84
99 Salivary acidic proline-rich phosphoprotein 1/2 PRPC_HUMAN GPPQQGGHPPPPQGRPQGPPQ 0,01 2110,06
96,5 Salivary acidic proline-rich phosphoprotein 1/2 PRPC_HUMAN QQGPPPPQGKPQGPPQQGGHPPPPQGRPQ Gln->pyro-Glu@N-term 0,03 2953,50

209
99 Salivary acidic proline-rich phosphoprotein 1/2 PRPC_HUMAN GPPQQGGHQQGPPPPPPGKPQGPPPQGGRPQGPPQGQSP
Deamidated(Q)@9; Oxidation(P)@33; Dioxidation(P)@34; Phospho(S)@38
-0,74 3930,08
99 Salivary acidic proline-rich phosphoprotein 1/2 PRPC_HUMAN PPPPPGKPQGPPPQGGRPQG Arg->Tyr@17 -0,01 1948,97
99 Salivary acidic proline-rich phosphoprotein 1/2 PRPC_HUMAN IDEERQGPPLGGQ -0,01 1394,67
99 Statherin STAT_HUMAN GYGPYQPVPEQPLYPQPYQPQYQQYTF 0,05 3275,58
99 Statherin STAT_HUMAN GYGPYQPVPEQPLYPQPYQPQYQQY 1,04 3028,45
99 Statherin STAT_HUMAN GYGYGPYQPVPEQPLYPQ 0,00 2051,96
97,8 Statherin STAT_HUMAN GRFGYGYGPY 0,00 1135,51
99 Submaxillary gland androgen-regulated protein 3B SMR3B_HUMAN IPPPPPAPYGPGIFP -0,01 1515,80
95,3 Submaxillary gland androgen-regulated protein 3B SMR3B_HUMAN VPPPPPPPYGPGRIPPPPPAPYGPGIFPPPPPQP 0,08 3437,91
Exclusive to T1D-R
99 Basic salivary proline-rich protein 1 PRP1_HUMAN GGNKPQGPPPPPGKPQGPPPQGGNKPQ -0,01 2609,34
98,8 Basic salivary proline-rich protein 1 PRP1_HUMAN GGNQPQGPPPPPGKPQGPPQQ 0,01 2059,03
96,2 Basic salivary proline-rich protein 1 PRP1_HUMAN GPPPPGKPQGPPPQGDKSQSPR Lys->Arg@17 0,03 2233,16
99 Basic salivary proline-rich protein 1 PRP1_HUMAN GGNKPQGPPPPPGKPQ -0,04 1551,77
97,8 Basic salivary proline-rich protein 1 PRP1_HUMAN GPPPPPGKPQGPPQQ 0,00 1477,76
99 Basic salivary proline-rich protein 1 PRP1_HUMAN GPPPPGKPQGPPAQ 0,01 1323,71
98 Basic salivary proline-rich protein 1 PRP1_HUMAN GPPPQGGNKPQGPPPPGKPQGPPAQGGSKSQ Lys->Gln@9 0,05 2925,50
99 Basic salivary proline-rich protein 1 PRP1_HUMAN GPPPPPGKPQ 0,02 970,54
99 Basic salivary proline-rich protein 1 PRP1_HUMAN GPPPPPGKPQGPPPQ 0,01 1446,77
98,5 Basic salivary proline-rich protein 1 PRP1_HUMAN SPPGKPQGPPPQGGNQPQGPPPPPGKPQGPPPQ 0,05 3195,67
99 Basic salivary proline-rich protein 1 PRP1_HUMAN PQGPPPPGKPQGPPPQ Gln->Pro@2 0,00 1543,81
99 Basic salivary proline-rich protein 1 PRP1_HUMAN QGPPPPPGKPQGPPPQ Gln->Pro@1 0,00 1543,81
99 Basic salivary proline-rich protein 1 PRP1_HUMAN APPGKPQGPPQQEGNNPQGPPPPAGGNPQQPQAPPAGQPQ 0,11 3909,01
98,3 Basic salivary proline-rich protein 2 PRB2_HUMAN QGGNKPQGPPSPPGKPQ Asn->Pro@4; Deamidated(Q)@17
0,02 1653,86
99 Basic salivary proline-rich protein 3 PRB3_HUMAN SQGPPPHPGKPEGPPPQ 0,01 1702,85
97,4 Basic salivary proline-rich protein 4 PRB4_HUMAN GPPPQGGNQSQGPPPPPG Deamidated(N)@8; Gln->His@9
0,05 1674,82
99 Histatin-1 HIS1_HUMAN KHHSHREFPFYGDYGSNYLYDN -0,03 2745,17
99 Histatin-1 HIS1_HUMAN SHEKRHHGY Phospho(S)@1 0,00 1229,51
99 Histatin-1 HIS1_HUMAN SNYLYDN 0,02 887,39
99 Histatin-1 HIS1_HUMAN FHEKHHSHREFPFYGDYGS 0,00 2376,05
99 Histatin-1 HIS1_HUMAN HEKHHSHREFPFYGDYGSNYLY 0,01 2782,24
97,7 Histatin-1 HIS1_HUMAN HHSHREFPFYGDYGSNYLY 0,02 2388,05
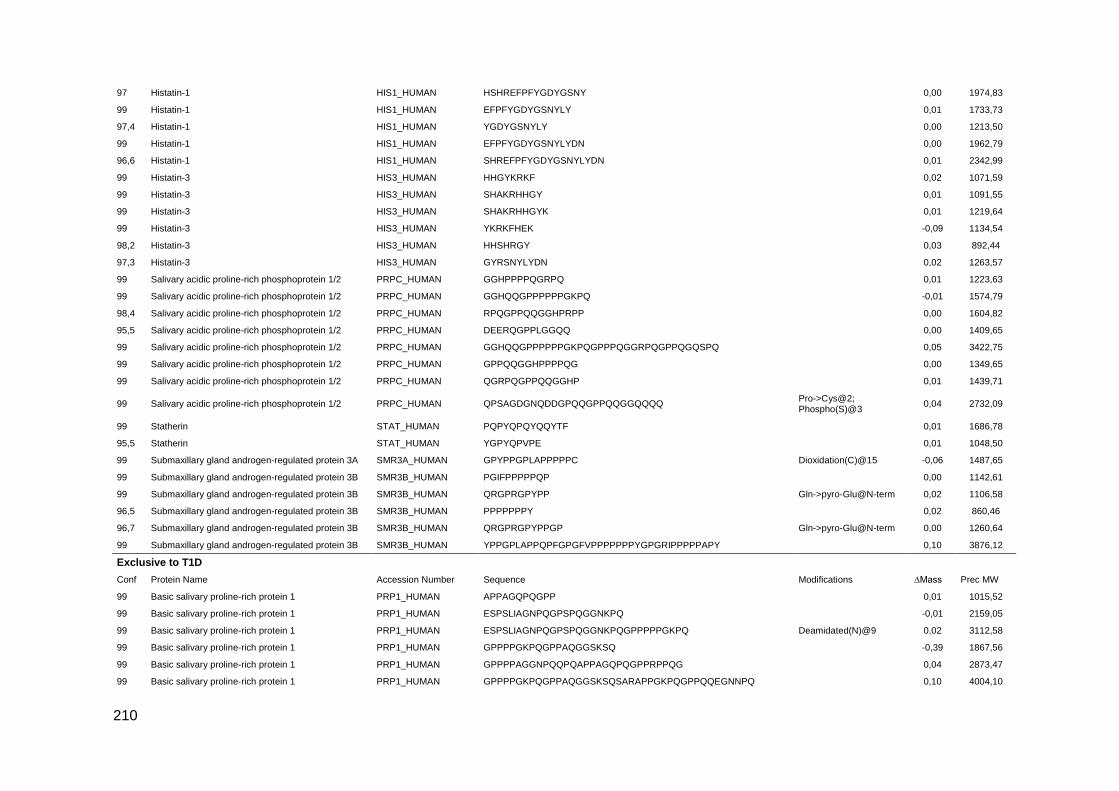
210
97 Histatin-1 HIS1_HUMAN HSHREFPFYGDYGSNY 0,00 1974,83
99 Histatin-1 HIS1_HUMAN EFPFYGDYGSNYLY 0,01 1733,73
97,4 Histatin-1 HIS1_HUMAN YGDYGSNYLY 0,00 1213,50
99 Histatin-1 HIS1_HUMAN EFPFYGDYGSNYLYDN 0,00 1962,79
96,6 Histatin-1 HIS1_HUMAN SHREFPFYGDYGSNYLYDN 0,01 2342,99
99 Histatin-3 HIS3_HUMAN HHGYKRKF 0,02 1071,59
99 Histatin-3 HIS3_HUMAN SHAKRHHGY 0,01 1091,55
99 Histatin-3 HIS3_HUMAN SHAKRHHGYK 0,01 1219,64
99 Histatin-3 HIS3_HUMAN YKRKFHEK -0,09 1134,54
98,2 Histatin-3 HIS3_HUMAN HHSHRGY 0,03 892,44
97,3 Histatin-3 HIS3_HUMAN GYRSNYLYDN 0,02 1263,57
99 Salivary acidic proline-rich phosphoprotein 1/2 PRPC_HUMAN GGHPPPPQGRPQ 0,01 1223,63
99 Salivary acidic proline-rich phosphoprotein 1/2 PRPC_HUMAN GGHQQGPPPPPPGKPQ -0,01 1574,79
98,4 Salivary acidic proline-rich phosphoprotein 1/2 PRPC_HUMAN RPQGPPQQGGHPRPP 0,00 1604,82
95,5 Salivary acidic proline-rich phosphoprotein 1/2 PRPC_HUMAN DEERQGPPLGGQQ 0,00 1409,65
99 Salivary acidic proline-rich phosphoprotein 1/2 PRPC_HUMAN GGHQQGPPPPPPGKPQGPPPQGGRPQGPPQGQSPQ 0,05 3422,75
99 Salivary acidic proline-rich phosphoprotein 1/2 PRPC_HUMAN GPPQQGGHPPPPQG 0,00 1349,65
99 Salivary acidic proline-rich phosphoprotein 1/2 PRPC_HUMAN QGRPQGPPQQGGHP 0,01 1439,71
99 Salivary acidic proline-rich phosphoprotein 1/2 PRPC_HUMAN QPSAGDGNQDDGPQQGPPQQGGQQQQ Pro->Cys@2; Phospho(S)@3
0,04 2732,09
99 Statherin STAT_HUMAN PQPYQPQYQQYTF 0,01 1686,78
95,5 Statherin STAT_HUMAN YGPYQPVPE 0,01 1048,50
99 Submaxillary gland androgen-regulated protein 3A SMR3A_HUMAN GPYPPGPLAPPPPPC Dioxidation(C)@15 -0,06 1487,65
99 Submaxillary gland androgen-regulated protein 3B SMR3B_HUMAN PGIFPPPPPQP 0,00 1142,61
99 Submaxillary gland androgen-regulated protein 3B SMR3B_HUMAN QRGPRGPYPP Gln->pyro-Glu@N-term 0,02 1106,58
96,5 Submaxillary gland androgen-regulated protein 3B SMR3B_HUMAN PPPPPPPY 0,02 860,46
96,7 Submaxillary gland androgen-regulated protein 3B SMR3B_HUMAN QRGPRGPYPPGP Gln->pyro-Glu@N-term 0,00 1260,64
99 Submaxillary gland androgen-regulated protein 3B SMR3B_HUMAN YPPGPLAPPQPFGPGFVPPPPPPPYGPGRIPPPPPAPY 0,10 3876,12
Exclusive to T1D
Conf Protein Name Accession Number Sequence Modifications ∆Mass Prec MW
99 Basic salivary proline-rich protein 1 PRP1_HUMAN APPAGQPQGPP 0,01 1015,52
99 Basic salivary proline-rich protein 1 PRP1_HUMAN ESPSLIAGNPQGPSPQGGNKPQ -0,01 2159,05
99 Basic salivary proline-rich protein 1 PRP1_HUMAN ESPSLIAGNPQGPSPQGGNKPQGPPPPPGKPQ Deamidated(N)@9 0,02 3112,58
99 Basic salivary proline-rich protein 1 PRP1_HUMAN GPPPPGKPQGPPAQGGSKSQ -0,39 1867,56
99 Basic salivary proline-rich protein 1 PRP1_HUMAN GPPPPAGGNPQQPQAPPAGQPQGPPRPPQG 0,04 2873,47
99 Basic salivary proline-rich protein 1 PRP1_HUMAN GPPPPGKPQGPPAQGGSKSQSARAPPGKPQGPPQQEGNNPQ 0,10 4004,10

211
96,4 Basic salivary proline-rich protein 1 PRP1_HUMAN SPRSPPGKPQGPPPQGGNQPQ 0,01 2107,06
99 Basic salivary proline-rich protein 1 PRP1_HUMAN GPPPPGKPQGPPPQGDKSRSPQSPPGKPQ 0,02 2896,52
99 Basic salivary proline-rich protein 1 PRP1_HUMAN GPPPQGGNKPQGPPPPGKPQGPPPQGDKSRS Deamidated(Q)@25; Oxidation(R)@30; Phospho(S)@31
0,15 3134,64
99 Basic salivary proline-rich protein 1 PRP1_HUMAN SPPGKPQGPPPQGGNQPQGPPPPPG 0,00 2366,18
99 Basic salivary proline-rich protein 1 PRP1_HUMAN GPPQQGGNRPQGPPPPGKPQGPPPQGDKS Gln->Pro@5 0,05 2822,47
99 Basic salivary proline-rich protein 1 PRP1_HUMAN GPPRPPQGGRPSRPP 0,00 1551,84
99 Basic salivary proline-rich protein 1 PRP1_HUMAN KPQGPPPQGGNKPQ 0,00 1428,75
99 Basic salivary proline-rich protein 2 PRB2_HUMAN GPPPQGDNKSRSSRSPPGKPQ 0,00 2173,09
99 Basic salivary proline-rich protein 2 PRB2_HUMAN GPPPQGGSKSRSS 0,00 1240,62
97,1 Basic salivary proline-rich protein 2 PRB2_HUMAN GPPPPGKPQGPPPQGGSKSR -0,01 1922,01
97,4 Basic salivary proline-rich protein 2 PRB2_HUMAN GPPPQGGSKSRSA 0,01 1224,63
98 Basic salivary proline-rich protein 2 PRB2_HUMAN SPPGKPQGPPQQE 0,01 1345,67
99 Basic salivary proline-rich protein 3 PRB3_HUMAN PQGPPPPGGNPQQPLPPPAG 0,02 1898,98
95,9 Basic salivary proline-rich protein 3 PRB3_HUMAN GKPEGRRPQGGNQPQRTPPPPGKP Phospho(T)@17; Lys->Arg@23; Oxidation(P)@24
0,10 2656,41
99 Basic salivary proline-rich protein 3 PRB3_HUMAN GPPPRPGKPEGSPS 0,00 1358,70
95,8 Basic salivary proline-rich protein 3 PRB3_HUMAN QPLPPPAGKPQ 0,00 1128,63
97,2 Basic salivary proline-rich protein 3 PRB3_HUMAN GRPHRPPQGQPPQ 0,00 1450,76
97,3 Basic salivary proline-rich protein 3 PRB3_HUMAN GPPPPGGNPQQPLPPPAGKPQGPPPPPQGGRPHRPPQGQPPQ 0,13 4187,30
97,6 Basic salivary proline-rich protein 3 PRB3_HUMAN GPPPPPQGGRPHRPPQGQPP -0,02 2050,04
99 Basic salivary proline-rich protein 4 PRB4_HUMAN GPPPPGGNPQQPQAPPAGKPQGPPPPPQG 0,00 2743,38
98,9 Histatin-1 HIS1_HUMAN FHEKHHSHREFPFYGDY 0,00 2231,99
99 Histatin-1 HIS1_HUMAN KFHEKHHSHREFPFYGDY -0,01 2360,07
95,6 Histatin-1 HIS1_HUMAN RKFHEKHHSHREFPFYGDYGSNYLYDN 0,07 3442,64
99 Histatin-3 HIS3_HUMAN KRHHGYKRKFHEKHHSHRGY 0,01 2624,37
99 Histatin-3 HIS3_HUMAN HHGYKRKFHEKHHSHRGY 0,01 2340,17
99 Histatin-3 HIS3_HUMAN KRHHGYKRKFHEKHHSHR 0,00 2404,28
96,3 Histatin-3 HIS3_HUMAN EKHHSHRGYR 0,00 1305,65
95,2 Histatin-3 HIS3_HUMAN KRHHGYKRKF 0,00 1355,77
97,5 Histatin-3 HIS3_HUMAN HHGYKRKFHEK 0,00 1465,77
99 Histatin-3 HIS3_HUMAN DSHAKRHHGYKRKF 0,00 1765,92
99 Histatin-3 HIS3_HUMAN DSHAKRHHGYKRKFHEKHHSHRGY 0,08 3034,59
99 Histatin-3 HIS3_HUMAN DSHAKRHHGYKRKFHEKH 0,03 2297,21
99 Histatin-3 HIS3_HUMAN FHEKHHSHRG 0,00 1270,61

212
99 Mucin-7 MUC7_HUMAN SPKSHFELPHYPGLLAHQKPF Lys->Gln@3 0,05 2429,28
98,8 Mucin-7 MUC7_HUMAN MKNLLNRIIDDMVEQ 0,00 1830,94
99 Mucin-7 MUC7_HUMAN FELPHYPGLLAHQKPF 0,00 1892,99
99 Mucin-7 MUC7_HUMAN HHHQSPKSHFELPHYPGLL 0,02 2260,15
99 Mucin-7 MUC7_HUMAN HHHQSPKSHFELPHYPGLLAHQKPF 0,03 2968,53
99 Mucin-7 MUC7_HUMAN LLYMKNLLNRIIDD 0,00 1732,96
98,6 Polymeric immunoglobulin receptor PIGR_HUMAN AIQDPRLFAEEK 0,00 1415,74
96,5 Polymeric immunoglobulin receptor PIGR_HUMAN VDSGSSEEQGGSSRALVSTLVPLG 0,02 2331,18
99 Polymeric immunoglobulin receptor PIGR_HUMAN ASVDSGSSEEQGGSSRALVSTLVPL 0,01 2432,21
99 Polymeric immunoglobulin receptor PIGR_HUMAN SVDSGSSEEQGGSSRALVSTLVPLG 0,00 2418,19
98,7 Proline-rich protein 4 PROL4_HUMAN QRDRPARHPQEQPLW Gln->Arg@1; Oxidation(W)@15
0,00 1957,02
95,2 Salivary acidic proline-rich phosphoprotein 1/2 PRPC_HUMAN PQGPPQQGGHP 0,00 1098,52
96 Salivary acidic proline-rich phosphoprotein 1/2 PRPC_HUMAN QGGHQQGPPPPPPGKPQ 0,00 1702,86
99 Salivary acidic proline-rich phosphoprotein 1/2 PRPC_HUMAN DGGDSEQFIDEERQGPPLGGQ Phospho(S)@5 0,02 2309,96
99 Salivary acidic proline-rich phosphoprotein 1/2 PRPC_HUMAN GDGNQDDGPQQGPPQQGGQQQQ -0,02 2262,93
95,8 Salivary acidic proline-rich phosphoprotein 1/2 PRPC_HUMAN KPQGPPPQGGRPQGPPQGQSPQ -0,01 2219,11
99 Salivary acidic proline-rich phosphoprotein 1/2 PRPC_HUMAN GPPQQGGHPPPP 0,00 1164,57
99 Salivary acidic proline-rich phosphoprotein 1/2 PRPC_HUMAN GPPQQGGHPPPPQGRPQGPPQQ 0,01 2238,11
99 Salivary acidic proline-rich phosphoprotein 1/2 PRPC_HUMAN VISDGGDSEQFIDEER Phospho(S)@8 0,02 1874,77
99 Salivary acidic proline-rich phosphoprotein 1/2 PRPC_HUMAN QGPPLGGQQSQPSAGDGNQDDGPQ 0,01 2334,02
97,4 Salivary acidic proline-rich phosphoprotein 1/2 PRPC_HUMAN GPPQQGGHPRPPRGRPQGPPQQGGHQQ 0,00 2832,41
99 Statherin STAT_HUMAN GYGYGPYQPVPEQPLYPQPYQPQYQQYT 0,05 3348,59
99 Statherin STAT_HUMAN LRRIGRFGYGYGPYQPVPEQPLYPQPYQPQ 0,08 3563,89
97,8 Statherin STAT_HUMAN YQPVPEQPLYPQPYQPQYQQYT 0,03 2754,33
97,8 Statherin STAT_HUMAN LRRIGRFGYGYGPYQPVPEQPLYPQPYQPQYQQY Deamidated(Q)@33 0,14 4147,18
98,6 Statherin STAT_HUMAN RFGYGYGPYQPVPEQPLYPQPYQPQYQQY 0,02 3550,68
99 Statherin STAT_HUMAN EQPLYPQPYQPQ 0,01 1486,72
99 Submaxillary gland androgen-regulated protein 3B SMR3B_HUMAN GPLAPPQPFGPGFVPPPPPPPYGPGRIPPPPPAPY 0,04 3518,89
96,6 Submaxillary gland androgen-regulated protein 3B SMR3B_HUMAN APPQPFGPG 0,01 866,43
99 Submaxillary gland androgen-regulated protein 3B SMR3B_HUMAN GPGFVPPPPPPPYGP 0,00 1471,75
Exclusive to Controls
99 Basic salivary proline-rich protein 1 PRP1_HUMAN APPGKPQGPPQQEGNNPQGPPPPAGGNPQQPQAPPAGQPQGPP 0,19 4160,21
98,3 Basic salivary proline-rich protein 1 PRP1_HUMAN PPGKPQGPPPQGGNQPQ -0,15 1679,69
99 Basic salivary proline-rich protein 1 PRP1_HUMAN PPPAGGNPQQPQAPPAGQPQGPP -0,01 2184,06
98,7 Basic salivary proline-rich protein 1 PRP1_HUMAN GPPQQEGNNPQGPPPPAGGNPQQPQAPPAGQPQGPPRPPQGGRPS 0,14 4417,29
99 Basic salivary proline-rich protein 2 PRB2_HUMAN GPPPQGGNKPQGPPPPGKPQGPPPQGDNKS 0,01 2908,47
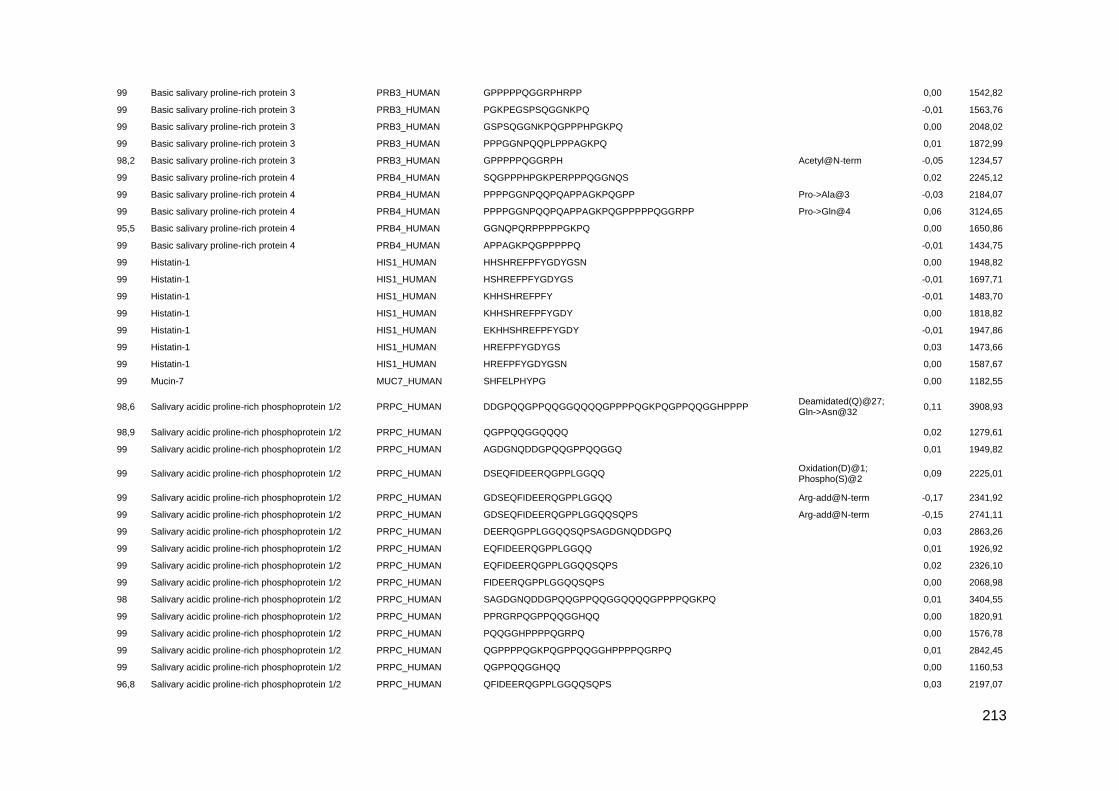
213
99 Basic salivary proline-rich protein 3 PRB3_HUMAN GPPPPPQGGRPHRPP 0,00 1542,82
99 Basic salivary proline-rich protein 3 PRB3_HUMAN PGKPEGSPSQGGNKPQ -0,01 1563,76
99 Basic salivary proline-rich protein 3 PRB3_HUMAN GSPSQGGNKPQGPPPHPGKPQ 0,00 2048,02
99 Basic salivary proline-rich protein 3 PRB3_HUMAN PPPGGNPQQPLPPPAGKPQ 0,01 1872,99
98,2 Basic salivary proline-rich protein 3 PRB3_HUMAN GPPPPPQGGRPH Acetyl@N-term -0,05 1234,57
99 Basic salivary proline-rich protein 4 PRB4_HUMAN SQGPPPHPGKPERPPPQGGNQS 0,02 2245,12
99 Basic salivary proline-rich protein 4 PRB4_HUMAN PPPPGGNPQQPQAPPAGKPQGPP Pro->Ala@3 -0,03 2184,07
99 Basic salivary proline-rich protein 4 PRB4_HUMAN PPPPGGNPQQPQAPPAGKPQGPPPPPQGGRPP Pro->Gln@4 0,06 3124,65
95,5 Basic salivary proline-rich protein 4 PRB4_HUMAN GGNQPQRPPPPPGKPQ 0,00 1650,86
99 Basic salivary proline-rich protein 4 PRB4_HUMAN APPAGKPQGPPPPPQ -0,01 1434,75
99 Histatin-1 HIS1_HUMAN HHSHREFPFYGDYGSN 0,00 1948,82
99 Histatin-1 HIS1_HUMAN HSHREFPFYGDYGS -0,01 1697,71
99 Histatin-1 HIS1_HUMAN KHHSHREFPFY -0,01 1483,70
99 Histatin-1 HIS1_HUMAN KHHSHREFPFYGDY 0,00 1818,82
99 Histatin-1 HIS1_HUMAN EKHHSHREFPFYGDY -0,01 1947,86
99 Histatin-1 HIS1_HUMAN HREFPFYGDYGS 0,03 1473,66
99 Histatin-1 HIS1_HUMAN HREFPFYGDYGSN 0,00 1587,67
99 Mucin-7 MUC7_HUMAN SHFELPHYPG 0,00 1182,55
98,6 Salivary acidic proline-rich phosphoprotein 1/2 PRPC_HUMAN DDGPQQGPPQQGGQQQQGPPPPQGKPQGPPQQGGHPPPP Deamidated(Q)@27; Gln->Asn@32
0,11 3908,93
98,9 Salivary acidic proline-rich phosphoprotein 1/2 PRPC_HUMAN QGPPQQGGQQQQ 0,02 1279,61
99 Salivary acidic proline-rich phosphoprotein 1/2 PRPC_HUMAN AGDGNQDDGPQQGPPQQGGQ 0,01 1949,82
99 Salivary acidic proline-rich phosphoprotein 1/2 PRPC_HUMAN DSEQFIDEERQGPPLGGQQ Oxidation(D)@1; Phospho(S)@2
0,09 2225,01
99 Salivary acidic proline-rich phosphoprotein 1/2 PRPC_HUMAN GDSEQFIDEERQGPPLGGQQ Arg-add@N-term -0,17 2341,92
99 Salivary acidic proline-rich phosphoprotein 1/2 PRPC_HUMAN GDSEQFIDEERQGPPLGGQQSQPS Arg-add@N-term -0,15 2741,11
99 Salivary acidic proline-rich phosphoprotein 1/2 PRPC_HUMAN DEERQGPPLGGQQSQPSAGDGNQDDGPQ 0,03 2863,26
99 Salivary acidic proline-rich phosphoprotein 1/2 PRPC_HUMAN EQFIDEERQGPPLGGQQ 0,01 1926,92
99 Salivary acidic proline-rich phosphoprotein 1/2 PRPC_HUMAN EQFIDEERQGPPLGGQQSQPS 0,02 2326,10
99 Salivary acidic proline-rich phosphoprotein 1/2 PRPC_HUMAN FIDEERQGPPLGGQQSQPS 0,00 2068,98
98 Salivary acidic proline-rich phosphoprotein 1/2 PRPC_HUMAN SAGDGNQDDGPQQGPPQQGGQQQQGPPPPQGKPQ 0,01 3404,55
99 Salivary acidic proline-rich phosphoprotein 1/2 PRPC_HUMAN PPRGRPQGPPQQGGHQQ 0,00 1820,91
99 Salivary acidic proline-rich phosphoprotein 1/2 PRPC_HUMAN PQQGGHPPPPQGRPQ 0,00 1576,78
99 Salivary acidic proline-rich phosphoprotein 1/2 PRPC_HUMAN QGPPPPQGKPQGPPQQGGHPPPPQGRPQ 0,01 2842,45
99 Salivary acidic proline-rich phosphoprotein 1/2 PRPC_HUMAN QGPPQQGGHQQ 0,00 1160,53
96,8 Salivary acidic proline-rich phosphoprotein 1/2 PRPC_HUMAN QFIDEERQGPPLGGQQSQPS 0,03 2197,07
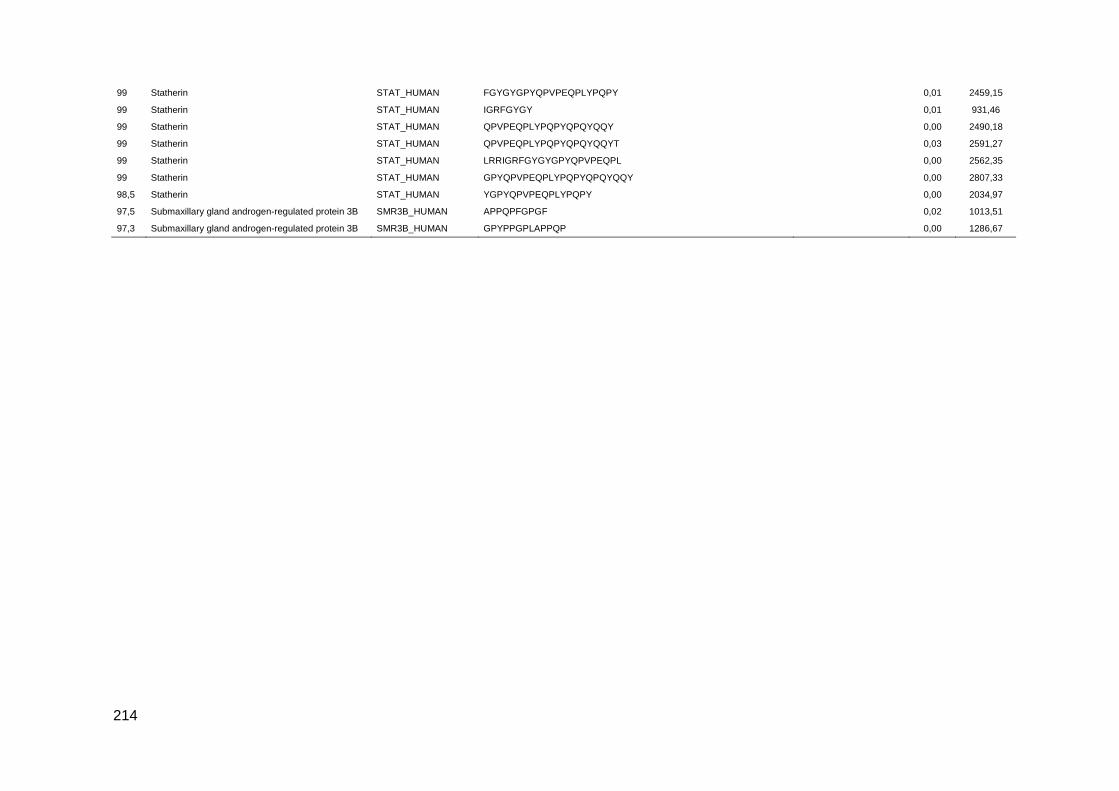
214
99 Statherin STAT_HUMAN FGYGYGPYQPVPEQPLYPQPY 0,01 2459,15
99 Statherin STAT_HUMAN IGRFGYGY 0,01 931,46
99 Statherin STAT_HUMAN QPVPEQPLYPQPYQPQYQQY 0,00 2490,18
99 Statherin STAT_HUMAN QPVPEQPLYPQPYQPQYQQYT 0,03 2591,27
99 Statherin STAT_HUMAN LRRIGRFGYGYGPYQPVPEQPL 0,00 2562,35
99 Statherin STAT_HUMAN GPYQPVPEQPLYPQPYQPQYQQY 0,00 2807,33
98,5 Statherin STAT_HUMAN YGPYQPVPEQPLYPQPY 0,00 2034,97
97,5 Submaxillary gland androgen-regulated protein 3B SMR3B_HUMAN APPQPFGPGF 0,02 1013,51
97,3 Submaxillary gland androgen-regulated protein 3B SMR3B_HUMAN GPYPPGPLAPPQP 0,00 1286,67
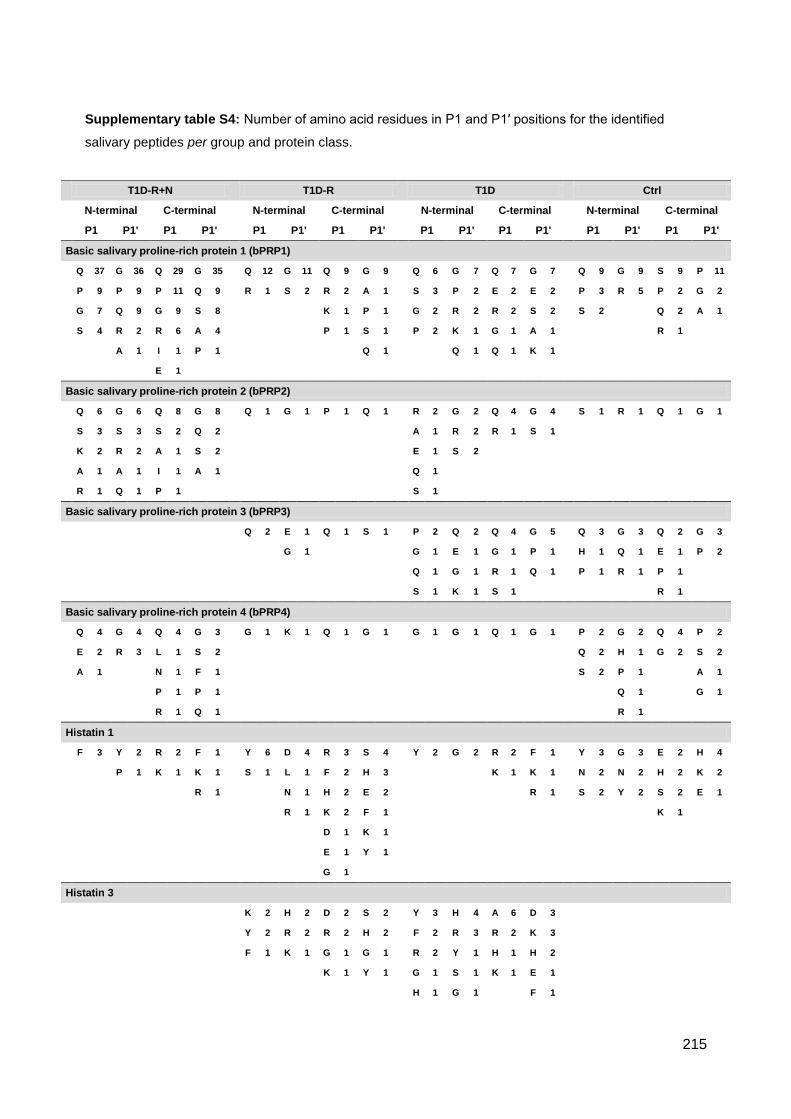
215
Supplementary table S4: Number of amino acid residues in P1 and P1′ positions for the identified
salivary peptides per group and protein class.
T1D-R+N
T1D-R
T1D
Ctrl
N-terminal C-terminal
N-terminal C-terminal
N-terminal C-terminal
N-terminal C-terminal
P1 P1' P1 P1'
P1 P1' P1 P1'
P1 P1' P1 P1'
P1 P1' P1 P1'
Basic salivary proline-rich protein 1 (bPRP1)
Q 37 G 36 Q 29 G 35
Q 12 G 11 Q 9 G 9
Q 6 G 7 Q 7 G 7
Q 9 G 9 S 9 P 11
P 9 P 9 P 11 Q 9
R 1 S 2 R 2 A 1
S 3 P 2 E 2 E 2
P 3 R 5 P 2 G 2
G 7 Q 9 G 9 S 8
K 1 P 1
G 2 R 2 R 2 S 2
S 2
Q 2 A 1
S 4 R 2 R 6 A 4
P 1 S 1
P 2 K 1 G 1 A 1
R 1
A 1 I 1 P 1
Q 1
Q 1 Q 1 K 1
E 1
Basic salivary proline-rich protein 2 (bPRP2)
Q 6 G 6 Q 8 G 8
Q 1 G 1 P 1 Q 1
R 2 G 2 Q 4 G 4
S 1 R 1 Q 1 G 1
S 3 S 3 S 2 Q 2
A 1 R 2 R 1 S 1
K 2 R 2 A 1 S 2
E 1 S 2
A 1 A 1 I 1 A 1
Q 1
R 1 Q 1 P 1
S 1
Basic salivary proline-rich protein 3 (bPRP3)
Q 2 E 1 Q 1 S 1
P 2 Q 2 Q 4 G 5
Q 3 G 3 Q 2 G 3
G 1
G 1 E 1 G 1 P 1
H 1 Q 1 E 1 P 2
Q 1 G 1 R 1 Q 1
P 1 R 1 P 1
S 1 K 1 S 1
R 1
Basic salivary proline-rich protein 4 (bPRP4)
Q 4 G 4 Q 4 G 3
G 1 K 1 Q 1 G 1
G 1 G 1 Q 1 G 1
P 2 G 2 Q 4 P 2
E 2 R 3 L 1 S 2
Q 2 H 1 G 2 S 2
A 1
N 1 F 1
S 2 P 1
A 1
P 1 P 1
Q 1
G 1
R 1 Q 1
R 1
Histatin 1
F 3 Y 2 R 2 F 1
Y 6 D 4 R 3 S 4
Y 2 G 2 R 2 F 1
Y 3 G 3 E 2 H 4
P 1 K 1 K 1
S 1 L 1 F 2 H 3
K 1 K 1
N 2 N 2 H 2 K 2
R 1
N 1 H 2 E 2
R 1
S 2 Y 2 S 2 E 1
R 1 K 2 F 1
K 1
D 1 K 1
E 1 Y 1
G 1
Histatin 3
K 2 H 2 D 2 S 2
Y 3 H 4 A 6 D 3
Y 2 R 2 R 2 H 2
F 2 R 3 R 2 K 3
F 1 K 1 G 1 G 1
R 2 Y 1 H 1 H 2
K 1 Y 1
G 1 S 1 K 1 E 1
H 1 G 1
F 1

216
K 1
Mucin-7 (MUC7)
A 3 H 3 F 1 E 1
F 3 I 3 R 2 H 2
G 1 L 1 K 1 S 1
L 1 A 1 P 1 H 1
D 1 A 1 F 1 F 1
Q 1 K 1
L 1 M 1 H 1 L 1
S 1 S 1
Y 1 M 1
Polymeric immunoglobulin receptor (PIgR)
G 2 L 2 A 1 A 2
K 1 A 1 K 1 S 1
L 1 G 1 R 1 V 1
S 1
Proline-rich protein 4 (PROL4)
Q 1 Q 1 R 1 P 1
Salivary acidic proline-rich phosphoprotein 1/2 (aPRP)
Q 4 G 3 Q 4 G 4 Q 6 G 4 Q 4 G 4 Q 11 G 6 Q 4 Q 4
P 2 R 3 G 1 Q 2 P 3 Q 4 R 2 P 2 S 4 A 4 P 3 D 3
G 1 S 1 I 1 D 1 R 1 P 1 A 1 Q 2 P 1 S 3 G 3 P 2
P 1 R 1 R 1 G 1 D 1 Q 3 S 3 G 2
S 1 K 1 K 1 I 1 E 2
L 1 V 1 E 1 S 1
S 1 R 1 F 1
A 1
Statherin
Y 2 P 1 Y 2 G 4
E 1 Q 1 G 1 P 1
Q 2 F 2 F 3 L 2
Y 5 Q 2 Y 3 Q 2
Q 1 Q 1 F 1
Y 1 Y 1
T 2 T 2 P 2 E 1
L 1 T 2 R 2 F 1
T 1 I 1
Y 2 Y 2 G 1 G 1
T 1 F 1 F 1 G 1
R 1
G 1 G 1 I 1
Y 1
Y 1
L 1
Y 1
Submaxillary gland androgen-regulated protein 3B (SMR3B)
P 1 P 1 F 1 I 1 P 2 G 3 S 2 P 2 G 1 G 2 F 1 G 2 F 1 F 1 L 1 A 1
R 1 V 1 Y 2 L 1 G 1 Q 2 P 1 F 1 L 1 A 1 P 1 V 1 R 1 G 1
P 1 Y 1 Y 1 P 1
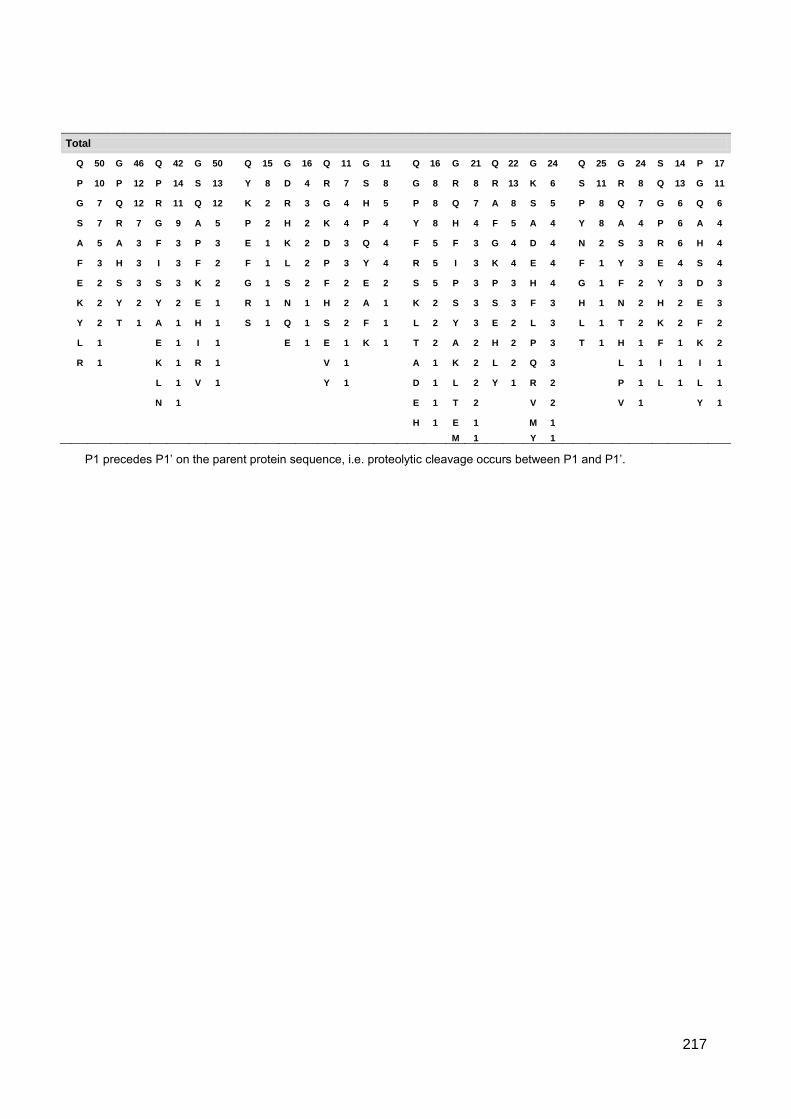
217
P1 precedes P1’ on the parent protein sequence, i.e. proteolytic cleavage occurs between P1 and P1’.
Total
Q 50 G 46 Q 42 G 50
Q 15 G 16 Q 11 G 11
Q 16 G 21 Q 22 G 24
Q 25 G 24 S 14 P 17
P 10 P 12 P 14 S 13
Y 8 D 4 R 7 S 8
G 8 R 8 R 13 K 6
S 11 R 8 Q 13 G 11
G 7 Q 12 R 11 Q 12
K 2 R 3 G 4 H 5
P 8 Q 7 A 8 S 5
P 8 Q 7 G 6 Q 6
S 7 R 7 G 9 A 5
P 2 H 2 K 4 P 4
Y 8 H 4 F 5 A 4
Y 8 A 4 P 6 A 4
A 5 A 3 F 3 P 3
E 1 K 2 D 3 Q 4
F 5 F 3 G 4 D 4
N 2 S 3 R 6 H 4
F 3 H 3 I 3 F 2
F 1 L 2 P 3 Y 4
R 5 I 3 K 4 E 4
F 1 Y 3 E 4 S 4
E 2 S 3 S 3 K 2
G 1 S 2 F 2 E 2
S 5 P 3 P 3 H 4
G 1 F 2 Y 3 D 3
K 2 Y 2 Y 2 E 1
R 1 N 1 H 2 A 1
K 2 S 3 S 3 F 3
H 1 N 2 H 2 E 3
Y 2 T 1 A 1 H 1
S 1 Q 1 S 2 F 1
L 2 Y 3 E 2 L 3
L 1 T 2 K 2 F 2
L 1
E 1 I 1
E 1 E 1 K 1
T 2 A 2 H 2 P 3
T 1 H 1 F 1 K 2
R 1
K 1 R 1
V 1
A 1 K 2 L 2 Q 3
L 1 I 1 I 1
L 1 V 1
Y 1
D 1 L 2 Y 1 R 2
P 1 L 1 L 1
N 1
E 1 T 2
V 2
V 1
Y 1
H 1 E 1
M 1
M 1
Y 1

218
Supplementary table S5: Distribution of the identified peptides presenting Gln->pyro-Glu at N-term and phosphorylation per group. Data is presented
as mean ± STD.
% Gln->pyro-Glu at N-term % Phosphorylation % HexNAc
Peptides T1D-R+N T1D-R T1D Ctrl T1D-R+N T1D-R T1D Ctrl T1D-R+N T1D-R T1D Ctrl
Basic salivary proline-rich protein 1 (bPRP1)
1.18±1.67 0.85±1.20 0.37±0.52 - 1.69±0.94 0.88±1.24 1.37±0.89 - - - - -
Basic salivary proline-rich protein 2 (bPRP2)
0.87±1.23 - 0.42±0.59 - 1.41±0.53 0.61±0.86 1.19±1.68 - 1.81±1.09 1.93±0.53 0.97±1.37 0.76±1.07
Basic salivary proline-rich protein 3 (bPRP3)
17.29±3.83 9.95±14.07 8.69±2.86 10.07±1.99 7.50±4.71 3.13±4.42 7.50±1.18 1.47±2.08 1.56±2.21 - - -
Basic salivary proline-rich protein 4 (bPRP4)
4.85±3.91 2.88±4.07 1.67±2.36 2.27±3.21 - - - - 0.71±1.01 - - -
Histatin 1 - - - - - 3.57±5.05 - - - - - -
Histatin 3 - - - - - - - - - - - -
Mucin-7 (MUC7) - - - - - - - - - - - -
Polymeric immunoglobulin receptor (PIgR)
- - - - - - - - - - - -
Proline-rich protein 4 (PROL4) 37.50±17.68 12.50±17.68 - 16.67±23.57 - - - - - - - -
Salivary acidic proline-rich phosphoprotein 1/2 (aPRP)
5.74±0.69 0.36±0.51 1.12±1.58 3.03±0.49 15.83±2.50 15.10±0.73 17.00±5.42 11.99±1.06 - - - -
Statherin - - - - - 1.89±2.67 - 1.61±2.28 - - - -
Submaxillary gland androgen-regulated protein 3B (SMR3B)
7.44±4.37 11.86±2.08 7.41±10.48 7.02±1.68 - 0.83±1.18 - - - - - -
(-)- The modification was not detected.

219
Supplementary table S6: Salivary peptides differentially regulated between T1D-R+N/Ctrl; T1D-R/Ctrl and T1D/Ctrl (Conf refers to confidence level of
Protscore from ProteinPilot; ∆Mass in Da).
Name Conf Sequence ∆Mass Theor m/z T1D-R+N
/Ctrl T1D-R /Ctrl
T1D /Ctrl
Basic salivary proline-rich protein 1 (bPRP1)
98 GPPPQGGNKPQGPPPPGKPQ 0.02 2844.62 5.92±0.03 6.58±0.02 6.64±0.06
99 GPPQQEGNNPQGPPPPAGGNPQQPQ 0.05 2792.37 4.54±0.02 1.17±0.00 2.18±0.02
98 GPPQQEGNNPQGPPPPAGGNPQQPQAPPAGQPQ
#GPP 0.03 3790.85 4.19±0.02 1.76±0.00 2.66±0.02
99 GPPQQEGNNPQGPPPPAGGNPQQPQAPPAGQPQ 0.04 3538.74 4.07±0.02 1.70±0.00 3.19±0.03
99 GPPQQEGNNPQGPPPPAGGN -0.01 2214.08 3.95±0.02 1.65±0.00 2.69±0.02
99 GPPPQGGNQPQGPPPPPGKPQ 0.00 2637.44 3.53±0.02 2.52±0.01 3.02±0.03
97 GPPQQE
¢GNN
#PQGPPPPAGGNPQQPQAPPAGQPQGPP 0.17 3789.86 3.34±0.02 1.71±0.00 1.89±0.02
99 GPPQQEGNNPQGPPPPAGGNPQ 0.00 2439.20 3.32±0.02 0.84±0.00 1.14±0.01
99 APPGKPQGPPQQEGNNPQ 0.07 2449.30 2.59±0.01 2.27±0.01 3.81±0.03
99 GPPPPAGGNPQQPQ -0.01 1645.86 2.54±0.01 0.61±0.00 1.64±0.01
99 GGNQPQGPPPPPGKPQ 0.00 2161.20 2.50±0.01 1.94±0.01 1.23±0.01
96 GPPPP
ⱠAGGNPQQPQAPPAGQPQGPPRPPQ -0.27 3123.64 2.44±0.01 1.47±0.00 3.45±0.03
99 GPPPPAGGNPQQPQAPPA -0.02 1982.04 2.37±0.01 1.00±0.00 1.72±0.02
99 GPPPPAGGNPQQPQAPPAGQPQGPPRPPQ -0.02 3121.62 2.02±0.01 1.52±0.00 3.04±0.03
95 GPPPPAGGNPQQPQAPPAGQPQGPPRPPQGGRPS -0.05 3575.85 1.98±0.01 0.79±0.00 1.07±0.01
98 GPPPPPGK
§PQ 0.04 1579.94 1.69±0.01 0.79±0.00 1.41±0.01
99 GPPQQEGNNPQ 0.00 1469.73 1.58±0.01 0.60±0.00 1.32±0.01
98 GPPPPPGKPQ 0.00 1275.74 1.56±0.01 0.89±0.00 1.22±0.01
95 GNPQGPSPQGGNKPQ -0.04 1792.92 1.51±0.01 0.58±0.04 1.75±0.22
99 GPPPQGGNK
§PQ 0.00 1684.96 1.44±0.01 0.90±0.00 1.48±0.01
99 GPPQQEGNN
♯PQ -0.29 1787.99 1.38±0.01 0.49±0.00 0.50±0.00
99 GPPPPAGGNPQQPQAPPAGQPQ 0.01 2392.23 1.37±0.01 0.81±0.00 1.51±0.01
99 GPPPPAGGNPQQPQAPPAGQPQGPP -0.04 2643.36 1.31±0.01 0.56±0.00 1.63±0.01
95 GPPPPAGGNPQ 0.00 1292.69 1.29±0.01 0.68±0.00 1.35±0.01
96
ⱡAPPGKPQGPPQQEGNNPQ -0.03 2187.11 1.22±0.01 1.51±0.00 1.96±0.02
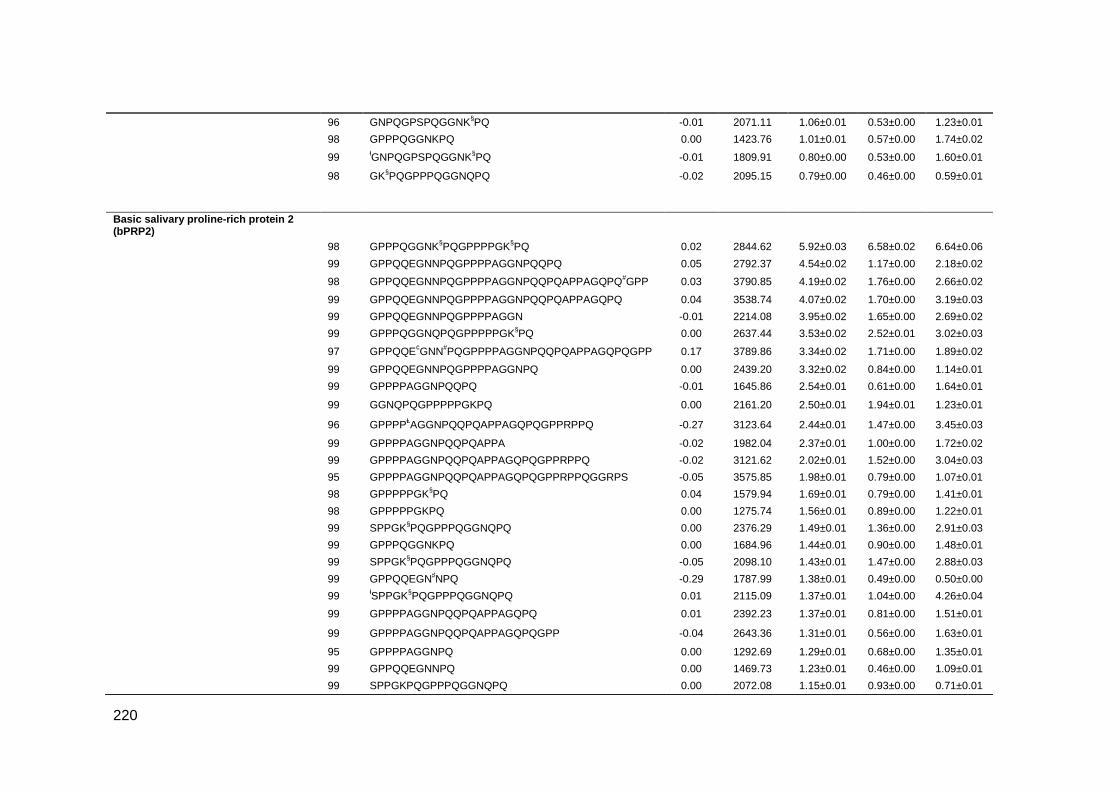
220
96 GNPQGPSPQGGNK
§PQ -0.01 2071.11 1.06±0.01 0.53±0.00 1.23±0.01
98 GPPPQGGNKPQ 0.00 1423.76 1.01±0.01 0.57±0.00 1.74±0.02
99
ⱡGNPQGPSPQGGNK
§PQ -0.01 1809.91 0.80±0.00 0.53±0.00 1.60±0.01
98 GK§PQGPPPQGGNQPQ
-0.02 2095.15 0.79±0.00 0.46±0.00 0.59±0.01
Basic salivary proline-rich protein 2 (bPRP2)
98 GPPPQGGNK§PQGPPPPGK
§PQ 0.02 2844.62 5.92±0.03 6.58±0.02 6.64±0.06
99 GPPQQEGNNPQGPPPPAGGNPQQPQ 0.05 2792.37 4.54±0.02 1.17±0.00 2.18±0.02
98 GPPQQEGNNPQGPPPPAGGNPQQPQAPPAGQPQ
#GPP 0.03 3790.85 4.19±0.02 1.76±0.00 2.66±0.02
99 GPPQQEGNNPQGPPPPAGGNPQQPQAPPAGQPQ 0.04 3538.74 4.07±0.02 1.70±0.00 3.19±0.03
99 GPPQQEGNNPQGPPPPAGGN -0.01 2214.08 3.95±0.02 1.65±0.00 2.69±0.02
99 GPPPQGGNQPQGPPPPPGK
§PQ 0.00 2637.44 3.53±0.02 2.52±0.01 3.02±0.03
97 GPPQQE
¢GNN
#PQGPPPPAGGNPQQPQAPPAGQPQGPP 0.17 3789.86 3.34±0.02 1.71±0.00 1.89±0.02
99 GPPQQEGNNPQGPPPPAGGNPQ 0.00 2439.20 3.32±0.02 0.84±0.00 1.14±0.01
99 GPPPPAGGNPQQPQ -0.01 1645.86 2.54±0.01 0.61±0.00 1.64±0.01
99 GGNQPQGPPPPPGKPQ 0.00 2161.20 2.50±0.01 1.94±0.01 1.23±0.01
96 GPPPP
ⱠAGGNPQQPQAPPAGQPQGPPRPPQ -0.27 3123.64 2.44±0.01 1.47±0.00 3.45±0.03
99 GPPPPAGGNPQQPQAPPA -0.02 1982.04 2.37±0.01 1.00±0.00 1.72±0.02
99 GPPPPAGGNPQQPQAPPAGQPQGPPRPPQ -0.02 3121.62 2.02±0.01 1.52±0.00 3.04±0.03
95 GPPPPAGGNPQQPQAPPAGQPQGPPRPPQGGRPS -0.05 3575.85 1.98±0.01 0.79±0.00 1.07±0.01
98 GPPPPPGK
§PQ 0.04 1579.94 1.69±0.01 0.79±0.00 1.41±0.01
98 GPPPPPGKPQ 0.00 1275.74 1.56±0.01 0.89±0.00 1.22±0.01
99 SPPGK
§PQGPPPQGGNQPQ 0.00 2376.29 1.49±0.01 1.36±0.00 2.91±0.03
99 GPPPQGGNKPQ 0.00 1684.96 1.44±0.01 0.90±0.00 1.48±0.01
99 SPPGK
§PQGPPPQGGNQPQ -0.05 2098.10 1.43±0.01 1.47±0.00 2.88±0.03
99 GPPQQEGN♯NPQ -0.29 1787.99 1.38±0.01 0.49±0.00 0.50±0.00
99
ⱡSPPGK
§PQGPPPQGGNQPQ 0.01 2115.09 1.37±0.01 1.04±0.00 4.26±0.04
99 GPPPPAGGNPQQPQAPPAGQPQ 0.01 2392.23 1.37±0.01 0.81±0.00 1.51±0.01
99 GPPPPAGGNPQQPQAPPAGQPQGPP -0.04 2643.36 1.31±0.01 0.56±0.00 1.63±0.01
95 GPPPPAGGNPQ 0.00 1292.69 1.29±0.01 0.68±0.00 1.35±0.01
99 GPPQQEGNNPQ 0.00 1469.73 1.23±0.01 0.46±0.00 1.09±0.01
99 SPPGKPQGPPPQGGNQPQ 0.00 2072.08 1.15±0.01 0.93±0.00 0.71±0.01

221
99 GNPQGAPPQGGNK
§PQ -0.02 2055.12 1.01±0.01 0.55±0.00 1.50±0.01
98
ⱡGPPPQGGNKPQ 0.00 1423.76 1.01±0.01 0.57±0.00 1.74±0.02
98 GK
§PQGPPPQGGNQPQ -0.02 2095.15 0.79±0.00 0.46±0.00 0.59±0.01
98
ⱡGNPQGAPPQGGNK
§PQ -0.01 1793.92 0.66±0.00 0.48±0.00 2.25±0.02
Basic salivary proline-rich protein 3 (bPRP3)
98 SQGPPPH
ƾPGK
§PE 0.00 1796.02 2.26±0.11 0.88±0.08 0.82±0.21
98 SQGPPPR
ƔPGK
§PE 0.00 1796.02 2.26±0.11 0.88±0.08 0.82±0.21
98
ⱡGPPPPPQGGRPHRPPQGQPPQ 0.08 2222.13 2.03±0.01 2.51±0.01 2.94±0.03
99 GPPPPPQGGRPHRPPQGQPPQ 0.07 2483.33 1.68±0.01 6.50±0.02 6.77±0.06
99 GPPPȵQEGNK
§PQ 0.00 1787.99 1.47±0.01 0.57±0.00 0.48±0.00
95 ¤QGPPPHPGK
§PE 0.00 1427.76 1.45±0.01 0.64±0.00 0.64±0.01
96 GRPHRPPQGQPPQ 0.00 1755.97 1.41±0.01 1.37±0.00 5.25±0.05
97 GGRPHRPPQGQPPQ -0.01 1812.99 1.12±0.01 0.91±0.00 1.67±0.01
97 ⱡGPPPPGGNPQQPLPPPAGK
§PQ -0.01 2375.28 1.10±0.01 0.86±0.00 1.84±0.02
99 GPPPPGGNPQQPLPPPAGK§PQ 0.00 2636.48 1.03±0.01 0.91±0.00 1.28±0.01
95 ⱡGPPPPPQGGRPHRPPQGQPPQ -0.06 2222.13 0.92±0.01 0.79±0.00 0.99±0.01
98
¤QSQGPPPRPGK
§PE 0.00 1661.89 0.87±0.00 0.45±0.00 0.39±0.00
96 SQGPPPRPGKPE -0.02 1855.06 0.78±0.00 0.33±0.00 0.63±0.01
97 GPPPQEGNKPQRPPPPGRPQ -0.92 2739.53 0.73±0.00 0.94±0.00 2.13±0.02
Histatin 1
99 GDYGSNYLYDN -0.01 1584.71 0.81±0.02 1.32±0.02 1.60±0.01
99 GDYGSNYLYDN# -0.10 1585.70 0.82±0.00 1.23±0.00 1.59±0.01
99 YGDYGSNYLYDN -0.01 1747.78 0.86±0.00 1.18±0.00 1.85±0.02
Salivary acidic proline-rich phosphoprotein 1/2 (aPRP)
96 GPPPQGGRPQGPPQGQSPQ -0.02 2171.13 2.10±0.01 11.17±0.03 12.61±0.11
99 SQPSAGDGNQDDGPQQGPPQQ 0.01 2412.10 2.08±0.01 1.58±0.00 1.38±0.01
99 SQPSAGDGNQDDGPQQGPPQQGGQ -0.02 2654.20 1.99±0.01 0.60±0.00 0.52±0.00
99 SQPSAGDGNQDDGPQQGPPQQGGQQ 0.03 2782.26 1.95±0.01 0.50±0.00 0.55±0.00
99 AGDGNQDDGPQQGPPQQGGQ 0.01 2255.02 1.65±0.01 0.41±0.00 0.88±0.01
98 QGPPPPPPGK
§PQ 0.01 1483.82 1.65±0.01 0.93±0.00 1.15±0.01
99 AGDGNQDDGPQQGPPQQGGQQQ -0.03 2511.14 1.56±0.01 0.78±0.00 0.66±0.01
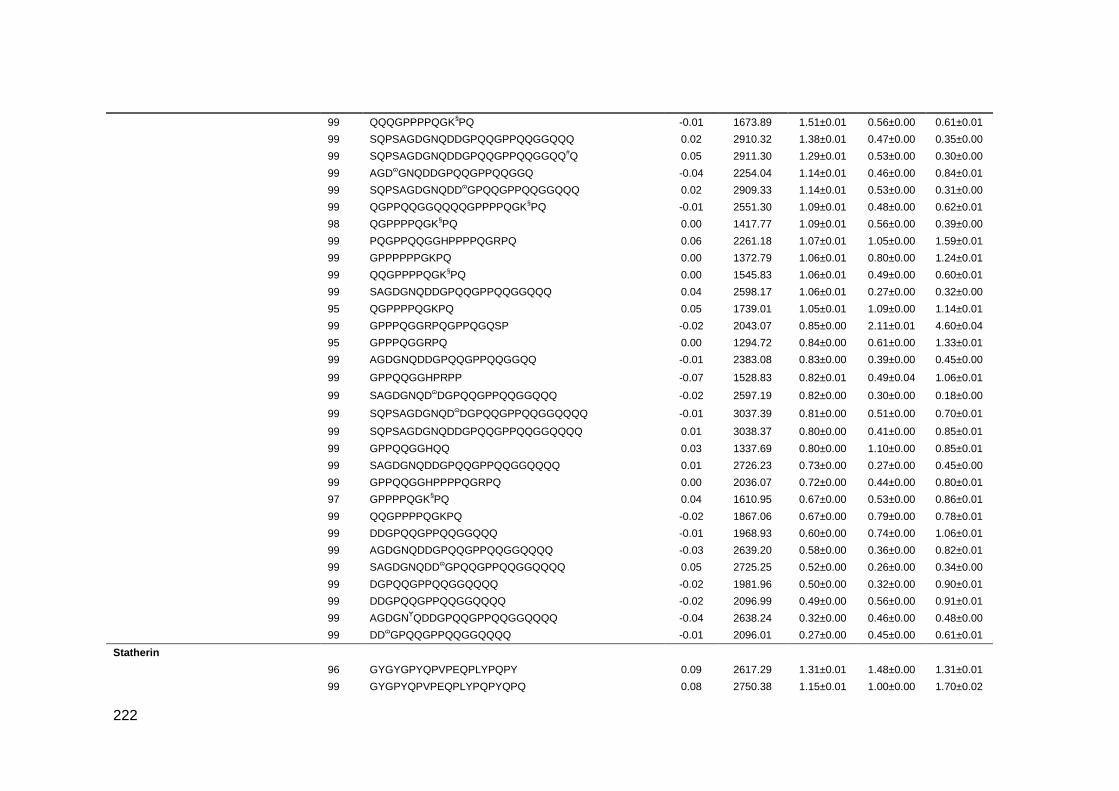
222
99 QQQGPPPPQGK§PQ -0.01 1673.89 1.51±0.01 0.56±0.00 0.61±0.01
99 SQPSAGDGNQDDGPQQGPPQQGGQQQ 0.02 2910.32 1.38±0.01 0.47±0.00 0.35±0.00
99 SQPSAGDGNQDDGPQQGPPQQGGQQ#Q 0.05 2911.30 1.29±0.01 0.53±0.00 0.30±0.00
99 AGDɷGNQDDGPQQGPPQQGGQ -0.04 2254.04 1.14±0.01 0.46±0.00 0.84±0.01
99 SQPSAGDGNQDDɷGPQQGPPQQGGQQQ 0.02 2909.33 1.14±0.01 0.53±0.00 0.31±0.00
99 QGPPQQGGQQQQGPPPPQGK§PQ -0.01 2551.30 1.09±0.01 0.48±0.00 0.62±0.01
98 QGPPPPQGK§PQ 0.00 1417.77 1.09±0.01 0.56±0.00 0.39±0.00
99 PQGPPQQGGHPPPPQGRPQ 0.06 2261.18 1.07±0.01 1.05±0.00 1.59±0.01
99 GPPPPPPGKPQ 0.00 1372.79 1.06±0.01 0.80±0.00 1.24±0.01
99 QQGPPPPQGK§PQ 0.00 1545.83 1.06±0.01 0.49±0.00 0.60±0.01
99 SAGDGNQDDGPQQGPPQQGGQQQ 0.04 2598.17 1.06±0.01 0.27±0.00 0.32±0.00
95 QGPPPPQGKPQ 0.05 1739.01 1.05±0.01 1.09±0.00 1.14±0.01
99 GPPPQGGRPQGPPQGQSP -0.02 2043.07 0.85±0.00 2.11±0.01 4.60±0.04
95 GPPPQGGRPQ 0.00 1294.72 0.84±0.00 0.61±0.00 1.33±0.01
99 AGDGNQDDGPQQGPPQQGGQQ -0.01 2383.08 0.83±0.00 0.39±0.00 0.45±0.00
99 GPPQQGGHPRPP -0.07 1528.83 0.82±0.01 0.49±0.04 1.06±0.01
99 SAGDGNQD
ɷDGPQQGPPQQGGQQQ -0.02 2597.19 0.82±0.00 0.30±0.00 0.18±0.00
99 SQPSAGDGNQD
ɷDGPQQGPPQQGGQQQQ -0.01 3037.39 0.81±0.00 0.51±0.00 0.70±0.01
99 SQPSAGDGNQDDGPQQGPPQQGGQQQQ 0.01 3038.37 0.80±0.00 0.41±0.00 0.85±0.01
99 GPPQQGGHQQ 0.03 1337.69 0.80±0.00 1.10±0.00 0.85±0.01
99 SAGDGNQDDGPQQGPPQQGGQQQQ 0.01 2726.23 0.73±0.00 0.27±0.00 0.45±0.00
99 GPPQQGGHPPPPQGRPQ 0.00 2036.07 0.72±0.00 0.44±0.00 0.80±0.01
97 GPPPPQGK§PQ 0.04 1610.95 0.67±0.00 0.53±0.00 0.86±0.01
99 QQGPPPPQGKPQ -0.02 1867.06 0.67±0.00 0.79±0.00 0.78±0.01
99 DDGPQQGPPQQGGQQQ -0.01 1968.93 0.60±0.00 0.74±0.00 1.06±0.01
99 AGDGNQDDGPQQGPPQQGGQQQQ -0.03 2639.20 0.58±0.00 0.36±0.00 0.82±0.01
99 SAGDGNQDD
ɷGPQQGPPQQGGQQQQ 0.05 2725.25 0.52±0.00 0.26±0.00 0.34±0.00
99 DGPQQGPPQQGGQQQQ -0.02 1981.96 0.50±0.00 0.32±0.00 0.90±0.01
99 DDGPQQGPPQQGGQQQQ -0.02 2096.99 0.49±0.00 0.56±0.00 0.91±0.01
99 AGDGN
ɎQDDGPQQGPPQQGGQQQQ -0.04 2638.24 0.32±0.00 0.46±0.00 0.48±0.00
99 DD
ɷGPQQGPPQQGGQQQQ -0.01 2096.01 0.27±0.00 0.45±0.00 0.61±0.01
Statherin
96 GYGYGPYQPVPEQPLYPQPY 0.09 2617.29 1.31±0.01 1.48±0.00 1.31±0.01
99 GYGPYQPVPEQPLYPQPYQPQ 0.08 2750.38 1.15±0.01 1.00±0.00 1.70±0.02

223
§-iTRAQ4plex; #-Deamidated; Ⱡ-Pro->Val; ♯- Asn->Lys; ⱡ-Carbamyl; #-Deamidated; ♯- Asn->Lys; ƾ-His->Pro; Ɣ-Arg->Pro; ¤-Gln->pyro-Glu; ȵ-Pro->Gln;¢-Glu->Gln; ɷ-Asp->Asn; Ɏ-Asn-
>Leu;*p<0.05; **p<0.01; ***p<0.001
99 YGYGPYQPVPEQPLYPQP 0.09 2397.21 1.12±0.01 1.47±0.00 1.12±0.01
99 GYGYGPYQPVPEQPL -0.02 1969.00 1.05±0.01 0.98±0.00 1.32±0.01
98 EQPLYPQPYQPQ -0.10 1791.92 0.76±0.00 0.52±0.00 1.03±0.01
Submaxillary gland androgen-regulated protein 3B (SMR3B)
98 GPGIFPPPPPQP 0.01 1504.85 1.65±0.01 1.45±0.00 1.11±0.01
96 GIFPPPPPQP 0.01 1350.77 1.33±0.01 1.79±0.00 0.79±0.01
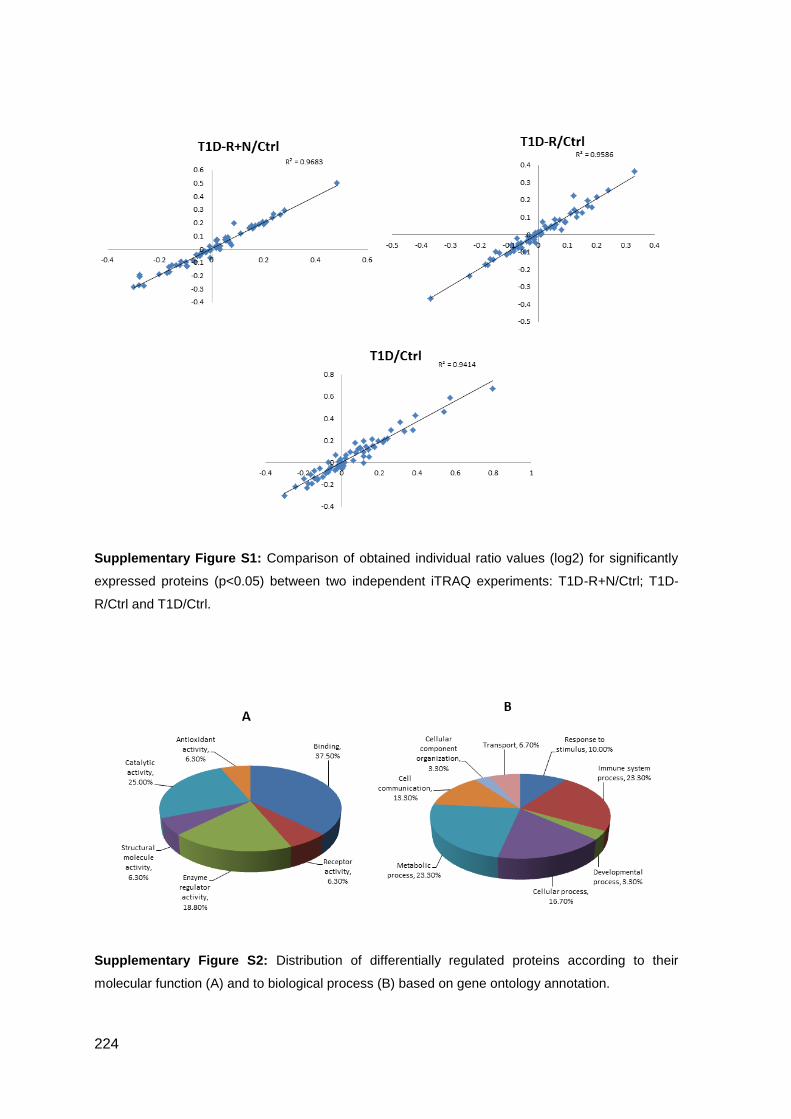
224
Supplementary Figure S1: Comparison of obtained individual ratio values (log2) for significantly
expressed proteins (p<0.05) between two independent iTRAQ experiments: T1D-R+N/Ctrl; T1D-
R/Ctrl and T1D/Ctrl.
Supplementary Figure S2: Distribution of differentially regulated proteins according to their
molecular function (A) and to biological process (B) based on gene ontology annotation.
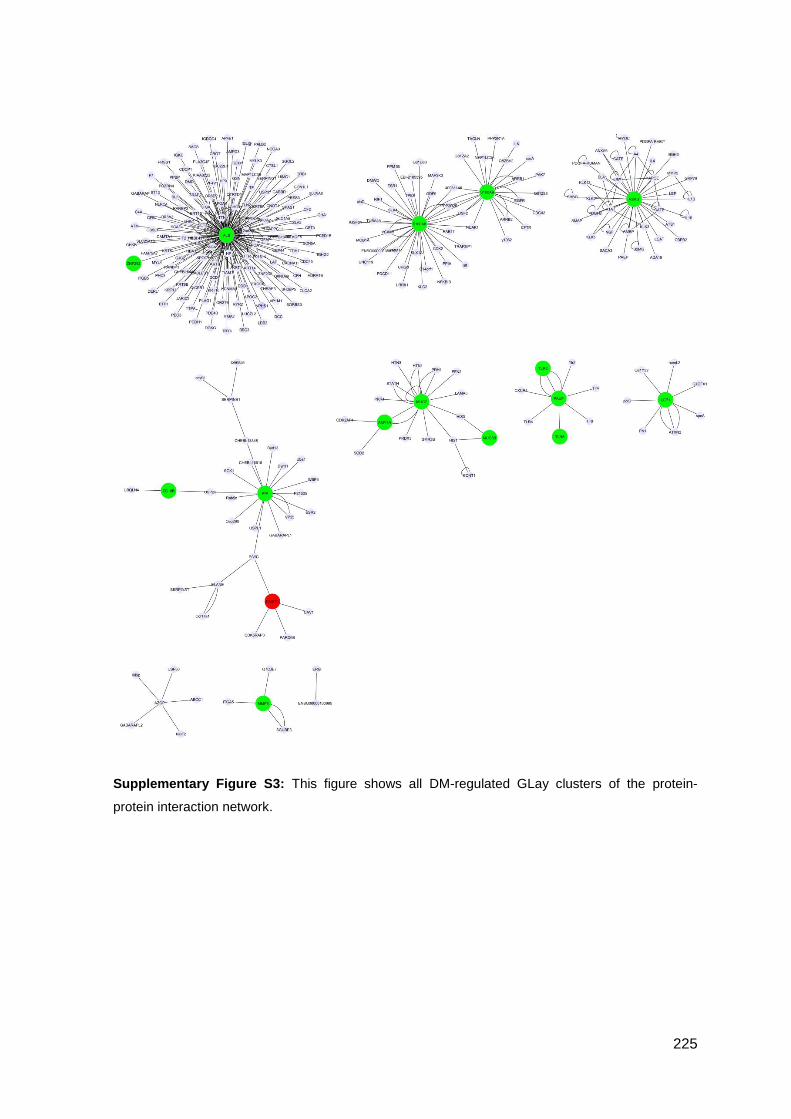
225
Supplementary Figure S3: This figure shows all DM-regulated GLay clusters of the protein-
protein interaction network.

226
Supplementary Figure S4: MALDI-MS/MS spectra of peptide 60
AGDGNQNDGPQ
QGPPQQGGQQQ81
from PRH2-1 with a m/z of 2204.94, corresponding to the replacement of Asp
by Asn in the peptide position 7.
Supplementary Figure S5: Comparative slot-blot analysis of whole saliva glycoproteins (A) and
phosphoproteins (B) among groups using specific staining methods (Emerald ProQ and Diamond
ProQ, respectively). Representative immunoblot images are presented above the corresponding
histograms. (*p<0.05 vs Ctrl).
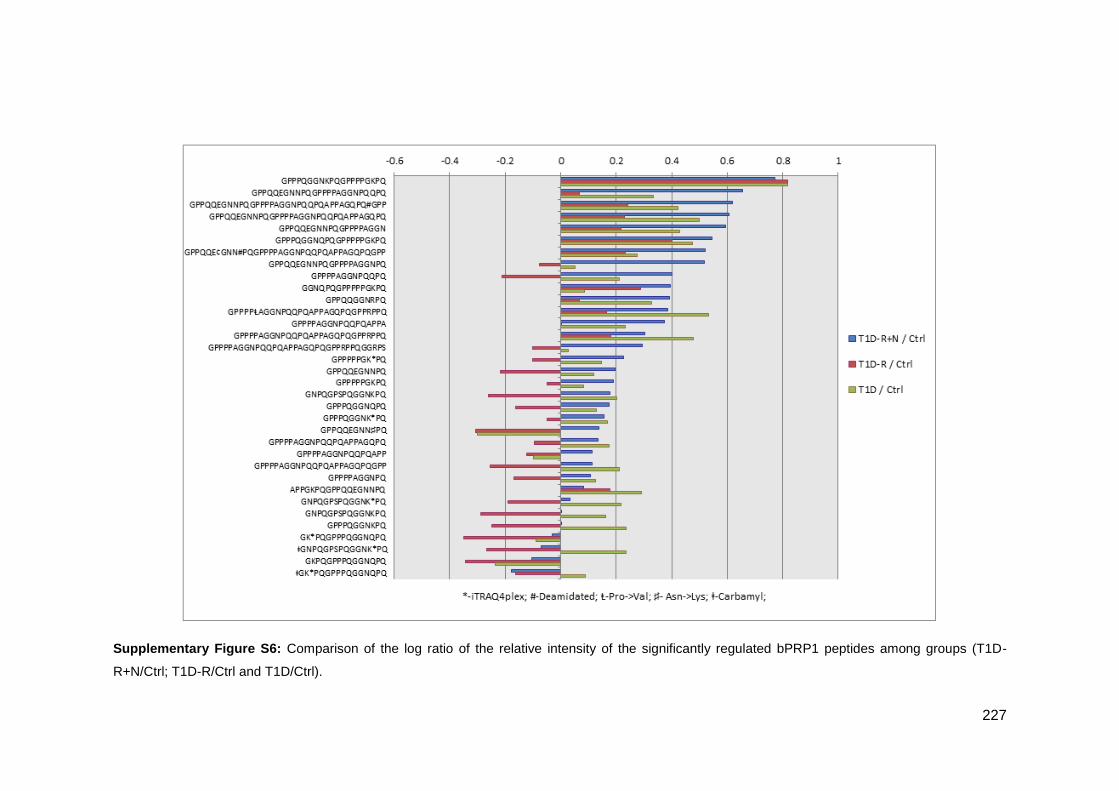
227
Supplementary Figure S6: Comparison of the log ratio of the relative intensity of the significantly regulated bPRP1 peptides among groups (T1D-
R+N/Ctrl; T1D-R/Ctrl and T1D/Ctrl).

228
Supplementary Figure S7: Comparison of the log ratio of the relative intensity of the significantly regulated bPRP2 peptides among groups (T1D-
R+N/Ctrl; T1D-R/Ctrl and T1D/Ctrl).
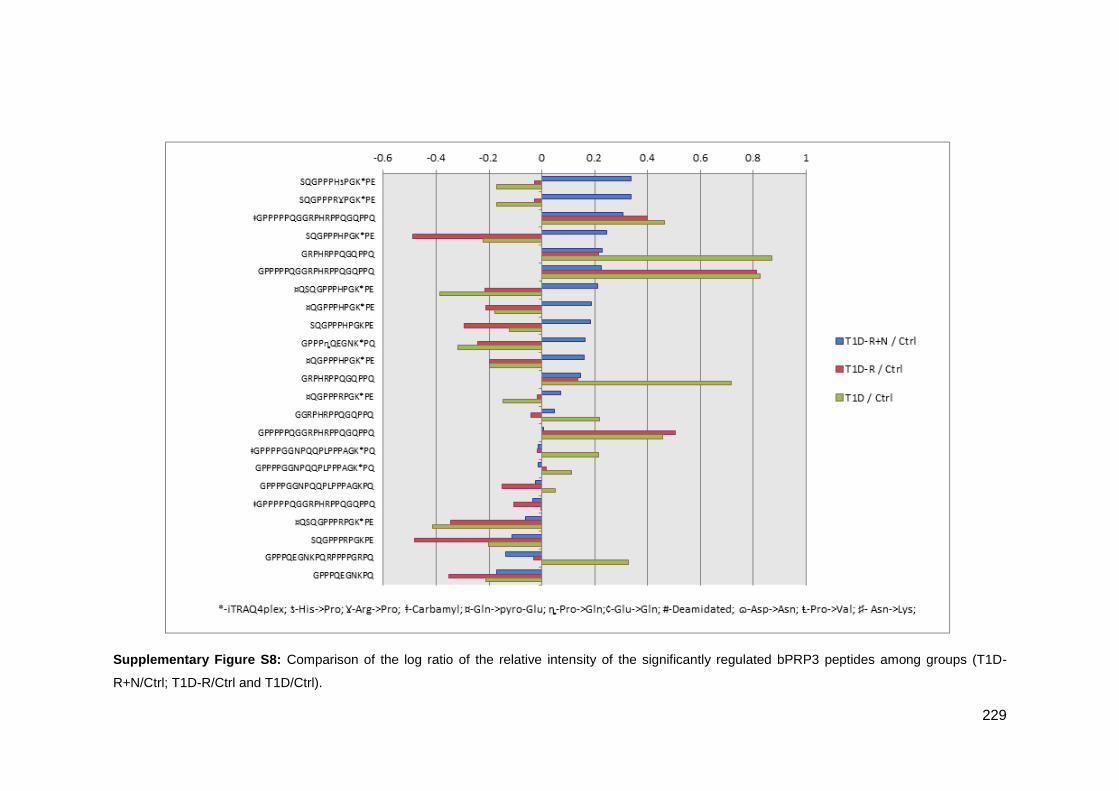
229
Supplementary Figure S8: Comparison of the log ratio of the relative intensity of the significantly regulated bPRP3 peptides among groups (T1D-
R+N/Ctrl; T1D-R/Ctrl and T1D/Ctrl).
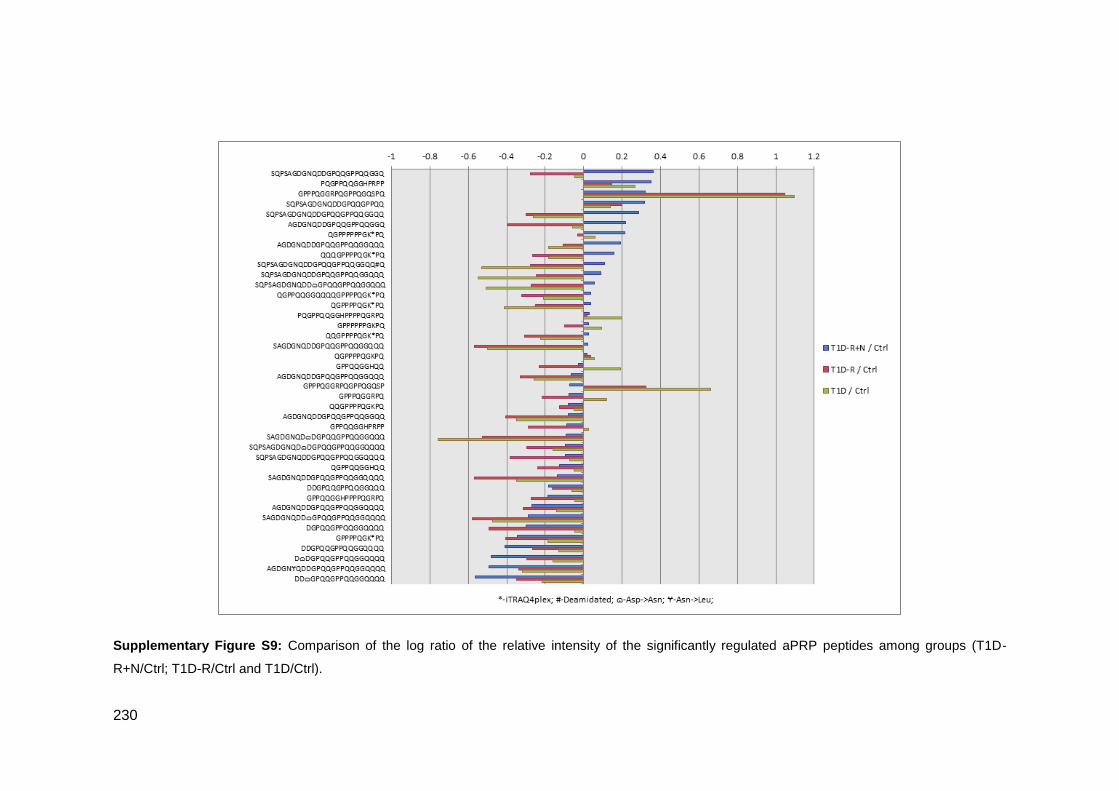
230
Supplementary Figure S9: Comparison of the log ratio of the relative intensity of the significantly regulated aPRP peptides among groups (T1D-
R+N/Ctrl; T1D-R/Ctrl and T1D/Ctrl).