


Idiomas
Páginas
Jurídico


Factores implicados en la respuesta inmunitaria en el ciervo ibérico
Trabajo presentado por la licenciada Dª Isabel García Fernández de Mera para optar al grado de Doctor por la Universidad de Castilla – La Mancha TUTOR: Christian Gortázar Schmidt DEPARTAMENTO: Ciencia y Tecnología Agroforestal y Genética CENTRO: Instituto de Investigación en Recursos Cinegéticos IREC, Unidad de Sanidad Animal PROGRAMA DE DOCTORADO: Biología y Tecnología de los Recursos Cinegéticos 3105.08 3105.08 3105.10 DIRECTORES: Christian Gortázar Schmidt José Manuel Pérez de la Lastra
Isabel García Fernández de Mera 2007


Los Dres. Christian Gortázar Schmidt y José Manuel Pérez de la Lastra, como
codirectores de la Tesis Doctoral “Factores implicados en la respuesta inmunitaria en el
ciervo ibérico” realizada en el Instituto de Investigaciones en Recursos Cinegéticos por el
Doctorando Dña. Isabel García Fernández de Mera, autorizan la presentación de la citada
Tesis Doctoral, dado que reúne las condiciones necesarias para su defensa.
En Ciudad Real, a 18 de Octubre de 2007
Vº Bº DE LOS DIRECTORES DE LA TESIS Fdo. Christian Gortázar Schmidt Fdo. José Manuel Pérez de la Lastra


La realización de este trabajo ha sido posible gracias a las siguientes entidades:
Yolanda Fierro
Grupo Santander-Fundación Marcelino Botín
Y se ha realizado en el marco de los siguientes proyectos:
Convenio Yolanda Fierro-UCLM: “Interacción entre nutrición e inmunidad en el ciervo ibérico”
Convenio Grupo Santander-Fundación M. Botín-UCLM: “Control de la tuberculosis en caza mayor”
Convenio Subdirección General Sanidad Animal (MAPA) - Organismo Autónomo de Parques Nacionales (MMA) - Instituto de Investigación en Recursos Cinegéticos (SCIC):
“Vigilancia sanitaria de las poblaciones de animales silvestres en las fincas y centros adscritos al Organismo Autónomo de Parques Nacionales”
Ministerio de Educación y Ciencia, Plan Nacional, INIA y FEDER: “Control de la tuberculosis bovina en su principal reservorio silvestre en
España, el jabalí, mediante vacunación” (FAU2006-00017-C03) “Epidemiología de las enfermedades compartidas entre ungulados silvestres y
ganado en España: aproximación multidisciplinar” (AGL2005-07401-C03-01/GAN) “Epidemiología y diagnóstico de las micobacteriosis de los mamíferos silvestres” (RTA03-074-C2-2)
Oklahoma Agricultural Experiment Station, Proyecto 1669
Junta Comunidades de Castilla la Mancha: Grupo Consolidado “Sanidad Animal” (GC05-006)
“Colaboración con la DGPA para el estudio de la prevalencia de enfermedades animales de especial vigilancia” (Preg-06-008)
“Establecimiento de un programa de vigilancia de enfermedades animales de especies de interés en Castilla-La Mancha” (198020001PR8)


A mi abuelo


A mis dos chicos
Al más pequeño por el gran cambio que ha supuesto en mi vida y a mi alrededor Al mayor, gracias por esa paciencia infinita, por esa ayuda, por estar siempre ahí
A mis padres, gracias por ese apoyo constante y por darme todo lo que soy A mi pequeña ahijada, Amelia, a mis hermanos
y a toda mi familia, en especial a mi tía


i
ÍNDICE
Organización de la Tesis ......................................................................................................
1
Introducción ............................................................................................................................. 5
El ciervo ibérico (Cervus elaphus hispanicus) ................................................................. 5
Biología general ................................................................................................... 5
Distribución ......................................................................................................... 7
El sistema inmunitario ................................................................................................. 8
Inmunidad innata y adquirida ........................................................................... 8
Componentes del sistema inmunitario ............................................................ 9
Complejo Mayor de Histocompatibilidad ....................................................... 13
Micobacteriosis en el ciervo ibérico ........................................................................... 17
Situación epidemiológica ................................................................................... 17
Diagnóstico de las micobacteriosis .................................................................. 18
Genómica funcional ........................................................................................... 19
Parasitosis del ciervo ibérico ....................................................................................... 21
Ectoparásitos ....................................................................................................... 23
Helmintos: Elaphostrongylus cervi, modelo de estudio ...................................... 24
Antecedentes: respuesta inmunitaria, tuberculosis y parasitosis en el ciervo
ibérico ............................................................................................................................. 25
Dicotomía en la asignación de recursos .......................................................... 25
Dicotomía entre condición nutricional y riesgo de infección ...................... 26
Bibliografía ..................................................................................................................... 28
Hipótesis y objetivos de la Tesis .......................................................................................
35
Capítulo 1: Factores que intervienen en la respuesta dérmica a la inyección de
antígenos ...................................................................................................................................
39
Determinación de la dosis óptima de PHA y tiempo hasta la lectura del
incremento del pliegue cutáneo en la intradermorreacción en ciervo
“Optimal dose and timing in phytohaemagglutinin skin-testing of deer”
Resumen ............................................................................................................... 41

ii
Abstract ................................................................................................................ 43
Introduction ......................................................................................................... 43
Material and Methods ........................................................................................ 43
Results .................................................................................................................. 44
Discussion ............................................................................................................ 44
References ............................................................................................................ 45
Efecto del sexo y la edad en el incremento de pliegue cutáneo en la
intradermorreacción con PHA en el ciervo ibérico
“The effects of sex and age on phytohaemagglutinin skin-testing of deer”
Resumen ............................................................................................................... 47
Abstract ................................................................................................................ 49
Introduction ......................................................................................................... 50
Material and Methods ........................................................................................ 50
Results .................................................................................................................. 52
Discussion ............................................................................................................ 53
References ............................................................................................................ 55
Inyección intradérmica de PPDb, PPDa y PHA en el ciervo ibérico:
Factores que afectan a la respuesta de la tuberculina
“Factors affecting red deer skin test responsiveness to bovine and avian tuberculin and to
phytohaemagglutinin in Spain”
Resumen ............................................................................................................... 59
Abstract ................................................................................................................ 61
Introduction ......................................................................................................... 61
Material and Methods ........................................................................................ 63
Results .................................................................................................................. 65
Discussion ............................................................................................................ 70
References ............................................................................................................
74
Capítulo 2: Relación entre condición nutricional y capacidad de respuesta
antiparasitaria ..........................................................................................................................
79

iii
Excreción fecal de Elaphostrongylus cervi en relación con la
suplementación experimental de alimento en el ciervo ibérico: ¿Afecta
la condición nutricional a la capacidad de respuesta antiparasitaria?
“Faecal excretion of Elaphostrongylus cervi (Nematoda) in relation to experimental
supplemental feeding in red deer (Cervus elaphus): Does nutritional condition improve anti
parasite response?”
Resumen ............................................................................................................... 81
Abstract ................................................................................................................ 83
Introduction ......................................................................................................... 83
Material and Methods ........................................................................................ 85
Results .................................................................................................................. 88
Discussion ............................................................................................................ 89
References ............................................................................................................
93
Capítulo 3: El factor genético: Polimorfismo del MHC II en ciervo ibérico …... 99
Polimorfismo del MHC II en una población aislada de ciervo ibérico
“Major histocompatibility complex class II polymorphism in a hunter-managed isolated
Iberian red deer (Cervus elaphus hispanicus) population”
Resumen ............................................................................................................... 101
Abstract ................................................................................................................ 103
Background .......................................................................................................... 104
Results .................................................................................................................. 105
Discussion ............................................................................................................ 111
Conclusions ......................................................................................................... 116
Methods ............................................................................................................... 117
Author’s contributions ....................................................................................... 121
References ............................................................................................................ 122
Relación del complejo mayor de histocompatibilidad de la clase II con
infecciones y algunos indicadores de condición en el ciervo ibérico
“Major histocompatibility complex class II polymorphism in relation to infections and life
history traits of management relevance in Iberian red deer”
Resumen ............................................................................................................... 129

iv
Abstract ................................................................................................................ 131
Introduction ......................................................................................................... 132
Material and Methods ........................................................................................ 134
Results .................................................................................................................. 138
Discussion ............................................................................................................ 142
References ............................................................................................................
147
Capítulo 4: Expresión diferencial de genes relacionados con respuesta inmune
en ciervos infectados y no infectados, expuestos de forma natural a
Mycobacterium bovis ............................................................................................................
155
Expresión génica diferencial de genes implicados en la respuesta
inmune e inflamatoria en linfonodos mesentéricos de ciervo ibérico
infectado de forma natural con Mycobacterium bovis
“Differential expression of inflammatory and immune response genes in mesenteric lymph
nodes of Iberian red deer (Cervus elaphus hispanicus) naturally infected with Mycobacterium
bovis”
Resumen ............................................................................................................... 157
Abstract ................................................................................................................ 159
Introduction ......................................................................................................... 159
Material and Methods ........................................................................................ 160
Results and Discussion ...................................................................................... 162
References ............................................................................................................ 165
Appendix A. Supplementary data ....................................................................
167
Síntesis y Conclusiones.......................................................................................................... 173
Síntesis ...........................................................................................................................
175
Conclusiones ................................................................................................................
179
Agradecimientos ..................................................................................................................... 181


___________________________________________________________________Tesis Doctoral
Organización de la Tesis
El presente trabajo de tesis ha sido estructurado con un primer apartado de introducción
seguido de la descripción de las hipótesis y objetivos que centran esta tesis. A
continuación se exponen los cuatro capítulos que componen esta tesis y que responden a
los correspondientes objetivos. Cada uno de estos capítulos consta de uno o varios
trabajos, de los que se expone previamente un resumen en castellano.
El primero de los capítulos de la tesis, denominado “Factores que intervienen en
la respuesta dérmica a la inyección de antígenos”, se basa en tres artículos:
1. “Optimal dose and timing in phytohaemagglutinin skin-testing of deer”
Fernández-de-Mera IG, Höfle U, Vicente J, García A, Rodríguez O, Gortázar C
New Zealand Veterinary Journal 54(6): 357-359, 2006
2. “The effects of sex and age on phytohaemagglutinin skin-testing of deer”
Fernández-de-Mera IG, Vicente V, Höfle U, Rodríguez O, García A, Gortázar C
New Zealand Veteriary Journal. En prensa.
3. “Factors affecting red deer skin test responsiveness to bovine and avian tuberculin and
to phytohaemagglutinin in Spain”
Fernández-de-Mera IG, Vicente J, Höfle U, Ruiz-Fons F, Gortázar G
El segundo capítulo, “Relación entre condición nutricional y capacidad de
respuesta antiparasitaria”, incluye el siguiente artículo:
4. “Faecal excretion of Elaphostrongylus cervi (Nematoda) in relation to experimental
supplemental feeding in red deer (Cervus elaphus): Does nutritional condition improve anti
parasite response?”
Fernández-De-Mera IG, Vicente J, Fierro Y, Gortázar C
El tercer capítulo, “El factor genético: polimorfismo del MHC II en ciervo
ibérico”, consta de dos trabajos:
5. “Major histocompatibility complex class II polymorphism in a hunter-managed isolated
Iberian red deer (Cervus elaphus hispanicus) population”
Fernández-de-Mera IG, Vicente J, Pérez de la Lastra JM, Mangold AJ, Naranjo V, Fierro Y,
de la Fuente J, Gortázar C

Organización de la Tesis____________________________________________________________
BMC Ecology. En evaluación.
6. “Major histocompatibility complex class II polymorphism in relation to infections and
life history traits of management relevance in Iberian red deer”
Fernández-de-Mera IG, Vicente J, Mangold AJ, Naranjo V, Fierro Y, Kocan KM, de la
Fuente J, Gortázar C
El último capítulo, “Expresión diferencial de genes relacionados con
respuesta inmune en ciervos infectados y no infectados, expuestos de forma natural
a Mycobacterium bovis”, incluye el siguiente artículo:
7. “Differential expression of inflammatory and immune response genes in mesenteric
lymph nodes of Iberian red deer (Cervus elaphus hispanicus) naturally infected with
Mycobacterium bovis”
Fernández-de-Mera IG, Pérez de la Lastra JM, Ayoubi P, Naranjo V, Kocan KM, Gortázar
C, de la Fuente J
Developmental & Comparative Immunology. En prensa
Finalmente, un último apartado engloba la síntesis y las conclusiones suscitadas
de los trabajos aquí presentados.

Introducción

___________________________________________________________________Tesis Doctoral
Introducción
En esta tesis doctoral se aborda el estudio de algunos de los factores implicados en
la respuesta inmunitaria en el ciervo (Cervus elaphus L., 1758). Se sabe que factores muy
distintos afectan a la capacidad inmunitaria en mamíferos (Ekkel et al. 1995; Hanlon et al.
1994). La condición corporal está estrechamente relacionada con la respuesta inmune
mediada por células T, lo que se ha medido en aves por medio de la intradermorreacción
con fitohemaglutinina (Alonso-Álvarez y Tella 2001; Cheema et al. 2001). También la edad
o el sexo del hospedador determinan una mayor o menor capacidad de respuesta a los
patógenos, particularmente en especies poligínicas y muy dimórficas como el ciervo
(Vicente et al. 2007a). Finalmente, el genotipo participa en la determinación de la mayor o
menor capacidad de respuesta de un hospedador a los patógenos, bien sea por efecto de la
variabilidad a nivel genómico o por el papel de genes concretos (Acevedo-Whitehouse et al.
2005).
Tal complejidad de factores resulta difícil de investigar, y requiere una perspectiva
multidisciplinar. Por consiguiente, en esta tesis se aplican técnicas de campo y de
laboratorio como la intradermorreacción, la parasitología, la genética poblacional y la
genómica. Se utilizan como modelos micobacterias como la tuberculosis bovina
(microparásito intracelular), y helmintos como el protoestrongílido Elaphostrongylus cervi,
(macroparásito de ciclo indirecto), todo ello con el fin de aportar conocimiento científico a
la interacción entre los citados patógenos y su hospedador el ciervo, mediada por la
respuesta inmunitaria.
1. El ciervo ibérico (Cervus elaphus hispanicus)
1.1 Biología general
Clasificación taxonómica
Clase: Mamíferos
Orden: Artiodactyla
Suborden: Ruminantia
Familia: Cervidae
Especie: Cervus elaphus
Subespecie: C. elaphus hispanicus

Introducción_____________________________________________________________________
6
Número de cromosomas: (2n)=68.
El ciervo, C. elaphus, es de origen euroasiático. Es una de las más de 40 especies de
cérvidos distribuidas por todo el mundo. La subespecie que habita el suroeste de España es
C. elaphus hispanicus (Erxleben 1777) y es una de las 13 subespecies repartidas por Europa,
siendo ésta una de las de menor tamaño de Europa. Su tamaño actual podría ser el
resultado de un proceso de reducción de tamaño corporal que ha tenido lugar a lo largo de
miles de años, como adaptación al entorno mediterráneo, caracterizado por un largo
período de estiaje (Soriguer et al. 1994).
Posee un pelaje con predominio del color castaño uniforme, con la zona ventral
más clara y un escudo anal casi blanco. La cola es corta, de color oscuro. La fórmula
dentaria del ciervo es: I0/3; C1/1; PM3/3; M3/3.
Al nacer, los cervatillos tienen un pelaje característico con fondo castaño y manchas
blancas que permanecen durante los tres primeros meses de vida. El dimorfismo sexual es
muy acentuado. El peso corporal medio es de 70 a 150 kg en machos adultos y de 50 a 100
kg en el caso de las hembras. En granjas y explotaciones cinegéticas con alimentación
suplementaria es fácil superar estos límites.
A partir del primer año los machos desarrollan anualmente unas cuernas que
utilizan en las luchas en el periodo de celo, y en cuyo desarrollo tendrán especial
importancia aspectos genéticos y de alimentación. Las hembras carecen de cuernas y
poseen dos pares de mamas en posición inguinal. El régimen alimentario de los ciervos es
herbívoro. La alimentación incluye una amplia variedad de especies tanto herbáceas como
arbustivas.
La estructura social es matriarcal, los machos y las hembras forman grupos
separados, excepto en época de celo. Los ciervos son poligínicos. La madurez sexual en las
hembras la pueden alcanzar en su segundo año de vida en función del peso alcanzado en la
época de berrea. La madurez sexual en los machos se alcanza al año y medio de edad,
aunque serán los machos más desarrollados los que primero cubran a las hembras.
El celo del ciervo o berrea dura unas tres o cuatro semanas, periodo que suele estar
comprendido entre finales de agosto y principios de octubre, aunque el manejo humano,
reintroducción, alimentación complementaria, caza, etc, puede alterar los ciclos naturales,
siendo en este sentido cada vez más frecuente encontrar poblaciones con periodos de celo
más largos de lo habitual (Soriguer 1994). La gestación dura entre doscientos treinta y
doscientos cuarenta días, los partos se producen durante el mes de mayo y principio de

___________________________________________________________________Tesis Doctoral
7
junio, coincidiendo con la época de mayor biomasa vegetal. La lactación de los gabatos
dura hasta noviembre o diciembre (Carranza 2002).
1.2 Distribución
En la Península Ibérica existen restos fósiles del género Cervus con varios millones de años
de antigüedad y C. elaphus está presente desde al menos el Pleistoceno superior (hace
120.000 años). De esta época también han sido encontrados restos de gamo (Dama dama) y
corzo (Capreolus capreolus), lo que indica que la especie ya estaba consolidada (Carranza 2002;
Cassinello en prensa).
La distribución original en la Península Ibérica pudo estar más localizada en la
mitad suroccidental. La distribución actual es reflejo de la expansión natural de las últimas
décadas y de las múltiples introducciones con fines cinegéticos, encontrándose hoy en día
por casi todo el territorio peninsular, excepto la parte más occidental de Galicia y la costa
levantina (Carranza 2002).
Actualmente, las mayores densidades de ciervos en España se dan en el centro y sur
del país. En estas zonas los manejos son cada vez más similares a la ganadería extensiva, lo
que podría afectar al estado sanitario de esta especie (Gortázar et al. 2006; Vicente et al.
2005b). Habría que destacar la abundancia de ciervo en zonas como la Cordillera
Cantábrica, donde se realizaron repoblaciones entre 1952 y 1970, o también las
reintroducciones en el Pirineo oscense y otras áreas montañosas de la mitad norte de la
Península Ibérica. A partir de estas reintroducciones, el ciervo ha ido expandiéndose
posteriormente de forma muy notable (Gortázar et al. 2000; Carranza 2002).
Hoy en día, el incremento de la demanda de caza se puede constatar con el
aumento de las explotaciones industriales dedicadas a la producción intensiva de piezas de
caza para su comercialización. Los traslados de ciervos están en auge, realizándose entre
fincas, entre comunidades autónomas y también desde otros países europeos. Esto ha
hecho que en España se hayan empezado a instalar desde 1980 un número considerable de
granjas cinegéticas cuya producción esta orientada a la repoblación de cotos de caza mayor
(Carranza 1999; Martínez 2000). Además de la existencia de estas granjas cinegéticas,
muchos cotos capturan ciervos para venderlos a otras fincas. Una de las soluciones que
proponen algunos gestores al problema que conllevan los cerramientos de las fincas es el
sistema de cría mixto, es decir, producir animales de manera intensiva y bajo condiciones
de manejo controlado, para que siendo individuos de calidad contrastada, sean trasladados
y cazados posteriormente. Estos manejos, desafortunadamente, no siempre siguen criterios

Introducción_____________________________________________________________________
8
sanitarios y de conservación suficientemente rigurosos. En particular, esto implica un
importante movimiento de animales que no se someten a un control veterinario suficiente,
ya que actualmente no existe una legislación que contemple de forma apropiada y completa
estos aspectos que exija tomar medidas de control sanitario.
2. El sistema inmunitario
La eficacia de una respuesta inmune depende principalmente del lugar donde se haya
producido la infección y del agente que la ha causado. Existen patógenos que invaden las
células huésped y aquellos que no son capaces de hacerlo, por lo que el sistema inmune ha
desarrollado una gran variedad de respuestas apropiadas para combatir cada tipo de
patógeno, al mismo tiempo que mantiene la tolerancia a componentes propios del
organismo.
2.1 Inmunidad innata y adquirida
Para combatir un patógeno lo primero que hace el sistema inmunitario es reconocerlo
como tal. Para ello ha desarrollado dos tipos de mecanismos: innatos y adaptativos, cuya
principal diferencia radica en las estructuras de reconocimiento del patógeno, ya que los
mecanismos efectores de la destrucción son similares.
La inmunidad innata está basada en mecanismos inespecíficos de acción inmediata,
carentes de memoria y encargados de combatir la infección en su inicio y durante las
primeras fases con gran eficacia. Si este tipo de mecanismo no consigue eliminar el
patógeno, al menos lo mantiene bajo control mientras se desarrollan los mecanismos
adaptativos que requieren más tiempo. Las células encargadas de esta primera línea de
defensa son los fagotitos (neutrófilos y monocitos) y macrófagos, que tienen receptores
innatos para reconocer estructuras comunes a múltiples patógenos, llamadas PAMP
(“Pathogen Associated Molecular Pattern”). Se incluye también en este grupo las llamadas células
“natural killer” (NK), una población linfocitaria con actividad lítica pero que carece de
receptor específico, y no necesita preactivación para lisar a la célula infectada.
La inmunidad adquirida está basada en mecanismos específicos. Estos mecanismos
presentan memoria y los responsables son los linfocitos B y T. Mientras que los linfocitos
B secretan anticuerpos que se unen específicamente al patógeno, los linfocitos T necesitan
de un procesamiento previo del agente extraño, para posteriormente reconocerlo asociado
a moléculas propias en otras células. Los linfocitos T tienen varias funciones: unos ayudan

___________________________________________________________________Tesis Doctoral
9
a los linfocitos B en la producción de anticuerpos, otros ayudan a los macrófagos y otros
destruyen directamente la célula infectada (Roit 1998).
2.2 Componentes del sistema inmunitario
El sistema inmunitario en vertebrados está formado por un conjunto de células encargadas
de la defensa frente a agentes infecciosos externos, y otras patologías como los procesos
neoplásicos. Estas células son los linfocitos, las células dendríticas del bazo, las células
epiteliales de Langerhans y también células especializadas del timo, médula ósea y demás
órganos linfoides. Las células se encuentran organizadas en tejidos concretos: bazo,
nódulos linfáticos, placas de Peyer, amígdalas, timo y médula ósea. Una pequeña población
de linfocitos y macrófagos puede localizarse en sangre y linfa circulante.
2.2.1 Sistema del complemento
El sistema del complemento está constituido por más de 30 proteínas que se encuentran en
el plasma y en la superficie de muchas células. Parte de los factores del complemento
potencian la inflamación y la fagocitosis y actúan produciendo la lisis de células y
microorganismos. Existen tres vías para la activación de este sistema: la vía clásica, la vía
alternativa y la vía de la lectina. En la activación del complemento se pone en marcha una
serie de reacciones consecutivas en cascada, de tal forma que a partir de cada una de ellas se
genera un producto activo que además de determinar que la reacción consecutiva prosiga,
puede tener diferentes acciones biológicas importantes en la defensa del organismo. Las
tres formas de activación confluyen en la ruptura enzimática de la molécula C3, que
conduce a la formación del complejo de ataque a la membrana, un complejo lipofílico de
proteínas plasmáticas que abre poros en la superficie celular y lleva a la lisis de las células.
La vía clásica del complemento se activa por la unión del complejo C1 a la región
Fc de los anticuerpos que se han unido a antígenos pertenecientes a los microorganismos.
Por su parte, la vía de la lectina se activa gracias a la unión del complejo conformado por la
lectina (MBP) y las proteínas de serina asociadas a la MBP (MASP1 y MASP2) con los
residuos de manosa presentes en la superficie de las células bacterianas. Finalmente, la vía
alternativa se inicia por la unión covalente de una cantidad pequeña de C3b a los grupos
hidroxilo de los carbohidratos y proteínas presentes en la superficie bacteriana; este C3b
está disponible gracias a una ruptura continua del C3 en el plasma (Janeway et al. 2003).
Introducción_____________________________________________________________________
10
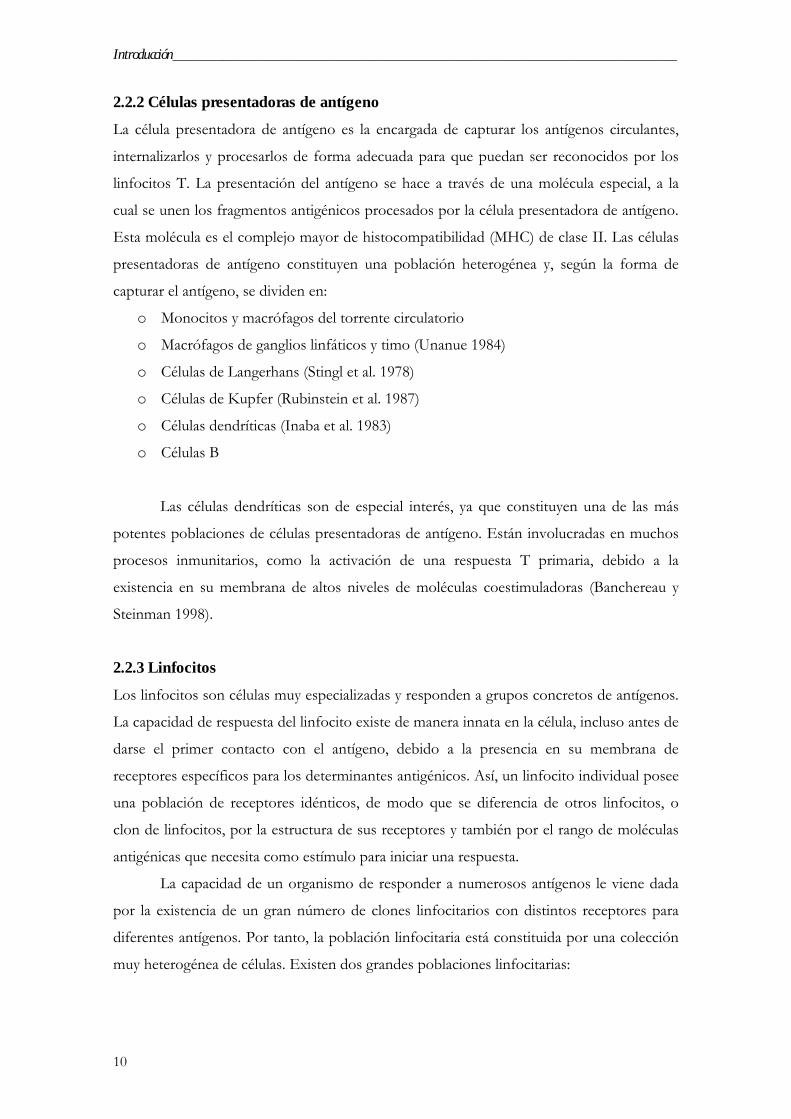
2.2.2 Células presentadoras de antígeno
La célula presentadora de antígeno es la encargada de capturar los antígenos circulantes,
internalizarlos y procesarlos de forma adecuada para que puedan ser reconocidos por los
linfocitos T. La presentación del antígeno se hace a través de una molécula especial, a la
cual se unen los fragmentos antigénicos procesados por la célula presentadora de antígeno.
Esta molécula es el complejo mayor de histocompatibilidad (MHC) de clase II. Las células
presentadoras de antígeno constituyen una población heterogénea y, según la forma de
capturar el antígeno, se dividen en:
o Monocitos y macrófagos del torrente circulatorio
o Macrófagos de ganglios linfáticos y timo (Unanue 1984)
o Células de Langerhans (Stingl et al. 1978)
o Células de Kupfer (Rubinstein et al. 1987)
o Células dendríticas (Inaba et al. 1983)
o Células B
Las células dendríticas son de especial interés, ya que constituyen una de las más
potentes poblaciones de células presentadoras de antígeno. Están involucradas en muchos
procesos inmunitarios, como la activación de una respuesta T primaria, debido a la
existencia en su membrana de altos niveles de moléculas coestimuladoras (Banchereau y
Steinman 1998).
2.2.3 Linfocitos
Los linfocitos son células muy especializadas y responden a grupos concretos de antígenos.
La capacidad de respuesta del linfocito existe de manera innata en la célula, incluso antes de
darse el primer contacto con el antígeno, debido a la presencia en su membrana de
receptores específicos para los determinantes antigénicos. Así, un linfocito individual posee
una población de receptores idénticos, de modo que se diferencia de otros linfocitos, o
clon de linfocitos, por la estructura de sus receptores y también por el rango de moléculas
antigénicas que necesita como estímulo para iniciar una respuesta.
La capacidad de un organismo de responder a numerosos antígenos le viene dada
por la existencia de un gran número de clones linfocitarios con distintos receptores para
diferentes antígenos. Por tanto, la población linfocitaria está constituida por una colección
muy heterogénea de células. Existen dos grandes poblaciones linfocitarias:

___________________________________________________________________Tesis Doctoral
11
o Linfocitos B. Son los encargados de la respuesta inmune humoral. Se encuentran en
la sangre y órganos linfoides. Se caracterizan por la presencia de inmunoglobulinas
(Ig) en su superficie. Estas Ig son sintetizadas por la propia célula y se insertan en la
membrana, donde actúan como receptores de antígeno. Esta población linfocitaria
ejerce también como célula presentadora y la existencia de este tipo de receptor
hace que su actuación sea mucho más específica que el resto de este tipo de células
(Lanzavecchia 1990). Sin embargo, las células B también pueden actuar de manera
inespecífica, presentando antígenos para los cuales no tienen Ig específica que los
reconozca (Lanzavecchia et al. 1985). Además de su papel como célula
presentadora de antígeno, los linfocitos B se definen clásicamente por ser los
responsables de la producción de anticuerpos. Reconocen específicamente un
determinado antígeno a través de sus inmunoglobulinas de membrana; una vez
reconocido, se dividen y diferencian a células plasmáticas que segregan anticuerpos
de la misma especificidad que la Ig de membrana. Los anticuerpos segregados se
unen al antígeno, y a su vez a diversas células y proteínas del complemento que se
encargan de neutralizarlo.
o Linfocitos T. Son los responsables de la respuesta inmune celular. Los patógenos
solo son accesibles a los anticuerpos en la sangre y los espacios extracelulares, pero
algunas bacterias y parásitos, y sobre todo los virus, se multiplican en el interior de
las células, donde no son detectados por los anticuerpos. La destrucción de las
células infectadas está mediada por los linfocitos T. Las células T son de origen
hematopoyético y después de un proceso de maduración en el timo, migran a los
órganos linfoides periféricos. A diferencia de los linfocitos B, las células T necesitan
que el antígeno sufra una serie de modificaciones para poder reconocerlo, de modo
que las proteínas antigénicas primero deben ser degradadas, y solo son reconocidos
pequeños fragmentos peptídicos tras unirse a moléculas de MHC en la superficie de
la célula presentadora. El receptor de membrana de las células T reconoce en las
células presentadoras al complejo MHC/péptido y se une a él, tras lo cual se
produce una señal de activación. Para efectuar sus actividades, ambos receptores
requieren de la expresión de un complejo proteico llamado CD3, compuesto por 5
proteínas denominadas alfa, delta, épsilon, dseta y eta, que en presencia de
interacción con el antígeno transduce señales a través de la membrana celular del
linfocito. El receptor de la célula T reconoce al antígeno asociado a moléculas de
histocompatibilidad clase I o II. Existen dos tipos fundamentales de linfocitos T,

Introducción_____________________________________________________________________
12
caracterizados por la expresión, en general mutuamente excluyente, de moléculas
CD4 y CD8 en la superficie celular. Así se distinguen linfocitos T cooperadores o
helper (Th), que expresan la molécula CD4, y linfocitos T líticos o citotóxicos (Tc),
portadores de la molécula CD8 en su membrana.
En rumiantes, particularmente en los animales jóvenes, existe una alta proporción
de linfocitos T circulantes, aproximadamente un 50% (Hein et al. 1991; Wyckoff et al.
2002). A diferencia de lo que ocurre en otras especies como el hombre o el ratón, existe
una población importante de linfocitos T gamma-delta. Aunque se desconoce el papel que
desempeñan estas células en rumiantes, parece que una de las principales funciones de
estos linfocitos podría ser el reconocimiento de células blanco alogénicas portadoras de
moléculas de histocompatibilidad clase I, no clásicas y poco polimórficas. También se ha
sugerido que estas células pueden reconocer moléculas de histocompatibilidad autólogas
clase I presentes en las células blanco dañadas. Otras evidencias sugieren que las células
gamma-delta tienen la capacidad de reconocer proteínas de stress micobacterianas en
presencia de células presentadoras de antígeno autólogas, tales como los linfocitos B.
El papel principal de los linfocitos T CD4 es la secreción de citoquinas con
funciones de ayuda diversa sobre otros tipos celulares. Estas citoquinas son indispensables
para la multiplicación y diferenciación de linfocitos B y linfocitos citotóxicos. Según las
citoquinas que se liberen, se han descrito dos fenotipos de linfocitos Th:
o Las células Th1, que producen preferentemente IL-2, IFN-γ y TNF-α, y están
asociadas a fenómenos de respuestas inmunitarias mediadas por células.
o Las células Th2, que producen principalmente IL-4, IL-5, IL-10 e IL-13, destinada
a ayudar a las células B en la producción de anticuerpos (Mosmann et al. 1986).
o Finalmente, se habla de un perfil Th0 cuando se producen los dos tipos de
citoquinas citadas, aunque es discutido si realmente existe esta tercera población de
Th o si es más bien una mezcla de linfocitos Th1 y Th2.
La función principal de los linfocitos T CD8 es interaccionar con la célula diana y
destruirla. Esta interacción se da a través de su receptor que reconoce de forma específica
antígenos asociados a moléculas de MHC clase I. Los linfocitos T citotóxicos son los
encargados, mediante mecanismos de lisis específica, de proteger al organismo frente al
ataque de virus y bacterias y frente a la aparición de células tumorales, frenando su

___________________________________________________________________Tesis Doctoral
13
crecimiento. También son los principales causantes de rechazos de tejidos y órganos,
además de estar implicados en fenómenos de autoinmunidad (Casares 2001).
2.3 Complejo mayor de histocompatibilidad
Una de las características más importantes de las células del sistema inmunitario es su
capacidad para distinguir entre lo propio y lo extraño. En mamíferos este hecho se
evidenció en experimentos de rechazo de tejidos entre cepas diferentes de ratones,
fenómeno que se atribuyó a un grupo de genes denominado Complejo Mayor de
Histocompatibilidad (MHC) (Yamazaki et al.1978).
Este grupo de genes se denomina H-2 en ratón y está situado en el cromosoma 17,
en humanos se llama HLA y se localiza en el cromosoma 6, mientras que en el caso de los
bovinos el MHC se conoce con el nombre de BoLA y está localizado en el cromosoma 23
(Tate 1997). Estos genes codifican tres clases de moléculas, clase I, II y III, aunque las
funciones de histocompatibilidad y reconocimiento antigénico son llevadas a cabo por los
genes de clase I y II, mientras que las moléculas de clase III son proteínas séricas que
forman parte del sistema del complemento.
El MHC posee dos propiedades que hacen difícil que los agentes patógenos
escapen a las respuestas inmunitarias. En primer lugar, el MHC es poligénico, es decir,
existen diversos genes de MHC clase I y II que codifican proteínas con diferentes
capacidades de unión. En segundo lugar, el MHC es altamente polimórfico, de tal forma
que existen múltiples alelos para cada gen, de hecho son los genes más polimórficos que se
conocen. (Yewdell y Bennink 1992)
2.3.1 Estructura
MHC clase I
Las moléculas de MHC I se expresan en la superficie de todas las células excepto en
neuronas. El MHC I está formado por una glicoproteína de membrana de 44 Kd que
constituye la cadena pesada α, unida de forma no covalente a la cadena ligera β que tiene un
peso de 12 Kd. La cadena α es altamente polimórfica, lo que hace que entre individuos de
una misma especie existan diferencias en esta molécula. La cadena ligera es necesaria para la
expresión en la superficie de las moléculas MHC I, así como para estabilizar su estructura.
La síntesis de las moléculas MHC I se da en el retículo endoplasmático, donde se unen
péptidos derivados del procesamiento de proteínas antigénicas. Las moléculas del MHC I
presentan péptidos intracelulares citosólicos (virales). La expresión de moléculas de MHC I

Introducción_____________________________________________________________________
14
está regulada por citoquinas, en particular por interferones derivados de las respuestas
inmunitarias. Algunos virus tienen la capacidad de disminuir la expresión del MHC I, al
igual que algunos tumores, lo que facilita su evasión al control del sistema inmunitario
(Casares 2001).
MHC clase II
El MHC II está compuesto por dos glicoproteínas transmembranales que forman la cadena
ligera β y la cadena pesada α, que se mantienen unidas de forma no covalente. Las dos están
codificadas por diferentes genes y son polimórficas. Durante su síntesis en el retículo
endoplasmático están asociadas a una tercera cadena, la cadena invariante. Las moléculas
del MHC II presentan péptidos extracelulares que han sufrido endocitosis. Al igual que en
las moléculas de clase I, su expresión también está regulada por citoquinas, principalmente
por los interferones (Swier et al. 1998).
2.3.2 Mecanismo de procesamiento y presentación al MHC
Las moléculas del MHC I y MHC II presentan antígenos en los macrófagos a las células T,
y como cada molécula une un espectro diferente de péptidos, la presencia de diferentes loci
hace posible que cada individuo esté equipado para presentar un amplio abanico de
péptidos diferentes y por tanto responder a diferentes antígenos. Este polimorfismo es de
crucial importancia en el reconocimiento de antígenos por células T, ya que estas
reconocen el péptido unido a una determinada variante alélica de la molécula de MHC, lo
que se denomina restricción por MHC (Zinkernagel y Doherty 1974).
Los agentes infecciosos se replican en dos compartimentos celulares: los virus se
replican en el citosol, mientras que la mayoría de las bacterias patógenas y algunos parásitos
se replican en el compartimento vesicular, es decir, en los fagosomas y endosomas de la
célula. El sistema inmune utiliza diferentes estrategias para deshacerse de ellos. Los agentes
infecciosos pueden llegar al compartimento vesicular de la célula de dos maneras. Algunas
bacterias, como las mycobacterias, tienen la capacidad de invadir macrófagos y proliferar en
las vesículas. Otras bacterias, de desarrollo extracelular, pueden producir toxinas y
productos que son internalizados por endocitosis o fagocitosis por los macrófagos y otras
células; o como en el caso del linfocito B pueden captarlos a través de sus
inmunoglobulinas de superficie. Los linfocitos T son capaces de reconocer de qué
compartimento celular proceden los agentes infecciosos mediante la presentación de los
péptidos extraños sobre la superficie celular en moléculas diferentes. Los procedentes del

___________________________________________________________________Tesis Doctoral
15
citosol se presentan sobre moléculas MHC de clase I y los provenientes de los endosomas
sobre las de Clase II.
El MHC I generalmente se presentan proteínas del citosol, que pueden ser
productos normales de la propia célula, de un virus ubicado en el interior celular o
producto de un agente infeccioso bacteriano que ha infectado la célula.
El sistema MHC II suele presentar proteínas extracelulares que entran por
fagocitosis, son transportadas en vesículas y degradadas en los lisosomas por enzimas
proteolíticos. Los gérmenes de desarrollo extracelular que son ingeridos por los
macrófagos, y aquellos que se multiplican en el interior de las vesículas de éstas células
(como las micobacterias) son degradados por las proteasas presentes en las vesículas en
peptidos que se unen a los MHC clase II, y posteriormente son presentados a los LT CD 4.
Lo mismo ocurre con cualquier proteína extracelular que sea internalizada por las células.
El descenso del pH en este compartimento, facilita la degradación de la proteína captada en
fragmentos peptídicos. El lisosoma podrá entonces fusionarse con vesículas procedentes
del retículo endoplasmático, donde se ha dado la síntesis del MHC II. La unión entre la
vesícula y el lisosoma provoca la degradación de la cadena invariante del MHC II,
quedando sus dos cadenas α y β con un surco accesible para la unión de los fragmentos
peptídicos del procesamiento del antígeno capturado. El complejo MHC/péptido es
transportado a la superficie celular, donde puede permanecer durante días, debido a la
estabilidad de su unión, antes de ser reconocido por las células Th (Cresswell 1994).
2.3.3 MHC II en ciervo
En 1999, Lewin realizó una revisión completa sobre el MHC de los bóvidos (BoLA), con
referencia específica a la organización genética, al polimorfismo y a la función de los genes
de la clase II. La región BoLA es diferente al MHC de seres humanos y de ratón, debido a
que, por medio de una gran inversión, se han movido varios genes de la clase II. Por lo
tanto, el acoplamiento cercano de los genes de MHC y otros genes asociados al MHC en
seres humanos y ratones no parece ser necesario para la función inmunológica normal. En
ciervo ibérico se sabe que el MHC tiene dos sitios de expresión, y no uno como en muchos
otros organismos.
Expresión de los genes del BoLA clase II y polimorfismo
Los bovinos expresan una pareja de haplotipos del gen DR (DRA y DRB3) y uno o dos
pares del gen DQ. La secuencia de codificación del DRA es monomórfica, mientras que el

Introducción_____________________________________________________________________
16
DRB3 tiene más de 70 alelos conocidos hasta ahora. En contraste, DQA y DQB son
polimórficos, con aproximadamente 40 alelos caracterizados (Nomenclatura del BoLA:
http://www2.ri.bbsrcac.nk/bola/). Alrededor de la mitad de los haplotipos comunes de la
clase II parece tener genes DQ duplicados, donde ambos juegos de genes DQ se expresan.
Esta duplicación, combinada con el polimorfismo de los genes DQA y DQB, tiene el
potencial de aumentar la variación en la superficie de la célula debido al inter- e intra-
acoplamiento de las cadenas α y β. Por lo tanto, es probable que todos los bovinos
expresen diferentes genes de la clase II, lo que puede contribuir positiva o negativamente
en la respuesta inmune a un antígeno en particular.
Existen muchas diferencias dentro del MHC de las diferentes especies. Así por
ejemplo, el gen DYA del BoLA no tiene ningún equivalente (ortólogo) humano
(Andersson et al. 1988). Se ha identificado este gen DYA en bovino, ovino y caprino, pero
no en cerdos, primates o roedores, lo que sugiere que el DYA se originó por la duplicación
del gen después de la divergencia de suidos y de bóvidos. La región que contiene el DYA se
denominó "clase IIb". Estos genes residen próximos al centrómero. La distancia física
entre el DYA y los genes de la clase I es muy grande, situándose el DYA cerca del
centrómero, y el resto del MHC cerca del centro del cromosoma. Por lo tanto, se deduce
que hubo un cambio importante hasta llegar a la actual organización del BoLA.
La pregunta que se surge es si esta organización tan radicalmente diferente del
MHC bovino tiene un significado funcional. Se ha postulado que determinadas
combinaciones de alelos que son importantes funcionalmente se han ido manteniendo por
medio de la selección, incluyendo los genes implicados en el procesamiento antigénico. En
este sentido, Casati et al. (1995) demostraron que la diferente respuesta inmune frente a
Mycobacterium bovis se asociaba con determinados haplotipos del BoLA clase II.
Un logro importante para la investigación es entender cómo el polimorfismo del
MHC contribuye a la resistencia y a la susceptibilidad a determinadas enfermedades, y al
desarrollo de respuestas inmunitarias eficaces, lo que requiere un trabajo interdisciplinario,
con estudios genómicos, moleculares, bioquímicos e inmunológicos. El aumento de la
disponibilidad de herramientas para el mapeado del genoma bovino, proporciona una gama
de oportunidades para mejorar nuestra comprensión en cuanto a las relaciones entre la
estructura y la función de los genes del BoLA. Así, el análisis de la organización, de la
estructura y de la secuencia génica dentro de diversos haplotipos del BoLA permite una
comprensión más detallada de la evolución y de la función del MHC (Lewin et al. 1999).

___________________________________________________________________Tesis Doctoral
17
3. Micobacteriosis en el ciervo ibérico
3.1 Situación epidemiológica
La tuberculosis en España es un grave problema, habiendo sido hace algunos años uno de
los países de mayor tasa de infección dentro de la Unión Europea (Caffrey 1994; Liébana et
al. 1995). La falta de éxito en las fases finales de los programas de erradicación en animales
de granja ha sido relacionada en ocasiones con el mantenimiento de reservorios de la
enfermedad en animales salvajes (Delahay et al. 2002; Caley y Hone 2004). En España, la
situación de la ganadería bovina en cuanto a tuberculosis ha mejorado sensiblemente en la
última década, pero ha alcanzado una fase asintótica en la cual conviene vigilar
particularmente las especies ganaderas no saneadas y los posibles reservorios silvestres
(Naranjo et al. en prensa).
Evolución reciente de las prevalencias de tuberculosis en ganado bovino en España. Fuente: MAPA
Las micobacterias, y en especial M. bovis, tienen un gran número de hospedadores
(O´Reilly et al. 1995; De Lisle et al. 2001). El ciervo en particular es sensible a las
micobacteriosis, y tanto la tuberculosis como la paratuberculosis constituyen problemas a
nivel mundial en la explotación comercial de este ungulado (Mackintosh et al. 2004). Entre
las micobacterias que pueden afectar a los cérvidos en España destaca fundamentalmente el
complejo Mycobacterium tuberculosis, incluyendo a los agentes causales de la tuberculosis
bovina y caprina (Aranaz et al. 2004; Gortázar et al. 2005).
En España, las prevalencias más altas de ciervos con lesiones compatibles con
tuberculosis se dan en el centro sur de la Península Ibérica, siendo la proporción media de
ciervos con lesiones compatibles con tuberculosis del 10-15 % en esta región. En áreas
situadas al norte de España, como Pirineos, Valle del Ebro o Sistema Cantábrico, no se han
encontrado animales con lesiones compatibles con tuberculosis, siendo Ávila y Teruel las

Introducción_____________________________________________________________________
18
provincias más norteñas donde se han identificado este tipo de lesiones con posterior
confirmación por cultivo y PCR (Vicente et al. 2006a).
La zona centro sur de la península es la que presenta mayores densidades de ciervo
y donde, desde las últimas décadas, se vienen incrementando los manejos, incluyendo el
vallado de fincas, la suplementación alimentaria o los traslados de animales (Vicente et al.
2007a), lo que complica el estudio epidemiológico y probablemente contribuya a dificultar
el éxito de los programas sanitarios de erradicación en ganado doméstico. La prevalencia de
dichas lesiones está relacionada positivamente con la edad del animal, y también con la
presencia de jabalí y con la agregación de éste en puntos determinados como comederos o
charcas. Además, más de la mitad de los individuos que presentan lesiones compatibles con
tuberculosis presentan un cuadro de lesiones generalizadas, hecho que aumenta igualmente
con la edad pero es independiente del sexo (Vicente et al. 2006a). Se sabe que también las
prácticas de manejo del monte pueden afectar a la agregación de hospedadores, y algunas
características de los hábitat mediterráneos pueden incrementar la frecuencia y la
probabilidad de la transmisión de la enfermedad (Vicente et al. 2007a).
Otras micobacterias, como M. avium avium, son diagnosticadas esporádicamente en
cérvidos en España (con frecuencia en ciervos de granja importados de Escocia). La
paratuberculosis, cuyo agente causal es M. avium paratuberculosis, ha sido citada en el ciervo
en Austria (Deutz et al. 2005), Italia (Nebbia et al. 2000) y en la República Checa
(Machackova et al. 2004), entre otros lugares de Europa. En Nueva Zelanda constituye un
importante problema para la cría de ciervos en granja (Mackintosh et al. 2004). En España
recientemente se han detectado casos clínicos en ciervos de granja, y los estudios
serológicos sugieren una amplia distribución de esta micobacteriosis en rumiantes
silvestres, que merece ser estudiada en mayor profundidad (Reyes et al. en evaluación).
3.2 Diagnóstico de las micobacteriosis
El diagnóstico de las micobacteriosis, de por sí complejo por las particularidades de estos
patógenos, es aún más difícil en fauna silvestre por la relativa novedad de algunas técnicas
en su aplicación a estas especies (ej. Griffin et al. 2004).
El diagnóstico rutinario en animales domésticos se lleva a cabo mediante la prueba
de intradermorreacción o prueba de la tuberculina, consistente en la inyección subcutánea
de un antígeno inactivado y posterior medición de la reacción defensiva en forma de
inflamación. La realización de este tipo de pruebas en animales salvajes es difícil en
condiciones naturales y su interpretación es comprometida en animales en semilibertad o

___________________________________________________________________Tesis Doctoral
19
durante operaciones de captura y traslado. La prueba requiere mantener a los animales en
cautividad hasta la realización de la lectura, que tiene lugar 72 horas después de la inyección
del antígeno. Este tiempo de retención y los dos manejos con su correspondiente
inmovilización física o química suponen una gran complejidad logística e implican riesgos
para el operario y para el animal.
Las pruebas serológicas no están aún bien desarrolladas en el caso de la
tuberculosis, ya que su sensibilidad es muy limitada. Por tanto, actualmente estas pruebas
solamente sirven como complemento de otras técnicas. La situación es distinta en el caso
de la paratuberculosis, ya que los test serológicos desarrollados permiten la detección de
animales positivos con unos niveles de sensibilidad y especificidad aceptables. No obstante,
apenas existen referencias sobre la aplicación de estos diagnósticos en especies silvestres,
por lo que resulta complicado establecer los puntos de corte y realizar una correcta
interpretación de los resultados (Reyes et al. en evaluación).
Lo más habitual es que la tuberculosis sea detectada durante la necropsia. Las
lesiones compatibles con tuberculosis pueden teñirse con la técnica de Ziehl-Nielssen, que
tiñe de color rosa las bacterias alcohol-ácido resistentes, pero el diagnóstico debe
corroborarse mediante pruebas más específicas como aislamientos, técnicas
inmunohistoquímicas o pruebas moleculares (PCR). En el caso de la paratuberculosis, la
PCR puede realizarse también sobre heces.
3.3 Genómica funcional
La genómica funcional puede ser utilizada como una herramienta de estudio en las
micobacteriosis. Tradicionalmente, ha asociado rasgos o características visibles (fenotipo)
con el gen o los genes que los producían (genotipo). Cada célula del organismo tiene el
mismo material genético durante toda su vida. Sin embargo, la expresión del gen (su
actividad) varía de unas células a otras, de unos estadios de desarrollo a otros, en procesos
normales o patológicos y en función de las condiciones ambientales. Sólo entendiendo los
pormenores de la expresión génica entenderemos los procesos biológicos moleculares en
los que intervienen los genes. Para ayudarnos con este propósito se aplica la técnica de los
chips de DNA (Microarrays), que permite en un solo experimento el análisis de muchos
genes, bajo diferentes condiciones experimentales. Además, un rasgo puede venir
determinado por un gen o varios genes pueden determinar un solo rasgo. Si alteramos esos
genes, se reflejará en la característica que expresan. Esta teoría ayuda a caracterizar la
función de los genes.

Introducción_____________________________________________________________________
20
3.3.1 Arrays
Los microarrays son una herramienta que está revolucionando el análisis genético desde
finales de los años 80, al poder estudiar un número elevado de genes en un solo análisis.
Los microarrays son una matriz bidimensional de material genético que permite la
automatización simultánea de miles de ensayos encaminados a conocer en profundidad la
estructura y funcionamiento de la dotación genética de un individuo, tanto en diferentes
estados de desarrollo como durante procesos patológicos que afecten al animal. El
microarray es una colección de ADN, consiste en un gran número de puntos
correspondientes a moléculas de ADN ordenados sobre un sustrato sólido, de manera que
formen una matriz de secuencias en dos dimensiones. Estos fragmentos de material
genético pueden ser un gen distinto, y el conjunto de ellos es un chip. A estos fragmentos
de ADN de una sola hebra inmovilizados en el soporte se les llama “sondas”. Los chips se
analizan añadiendo una copia complementaria de la población total de ARNm convertida a
ácido desoxirribonucleico (ADNc), permitiendo que se hibride con los ADN del chip. El
ADNc está marcado con sustancias con propiedades fluorescentes que pueden ser
visualizadas en un escáner o lector computarizado que mide la fluorescencia relativa de los
puntos con material génico. Si un gen fluorece más o menos en el tejido problema que en
el de referencia, significa que dicho gen estuvo más o menos activo y que probablemente es
importante para el proceso que se esté estudiando. Normalmente, el resultado son
imágenes con puntos rojos si hay hibridación, si el gen de la muestra problema se expresa
(presenta actividad), o verde si no la hay. Este método se aplica en el análisis de la
expresión genética, detección de mutaciones y polimorfismos, secuenciación, seguimiento
de terapia, toxicología de fármacos, diagnóstico molecular, diseño de fármacos, etc.
En especies salvajes hay muy poca información sobre la expresión diferencial de
genes en infecciones micobacterianas naturales. El estudio y la identificación de genes
diferentemente expresados en animales salvajes resistentes o susceptibles a la tuberculosis
contribuirían al entendimiento de la resistencia e inmunidad protectora frente a las
micobacteriosis que algunos individuos poseen. Una herramienta para ello sería caracterizar
la expresión de genes de la respuesta inmune e inflamatoria utilizando la hibridación con
microarrays en biopsias de ciervos naturalmente infectados con M. bovis y ciervos
resistentes a la enfermedad y analizar así los mecanismos de patogénesis y de inmunidad
frente a infecciones micobacterianas, lo que tendría una gran implicación en el control de la
tuberculosis.

___________________________________________________________________Tesis Doctoral
21
Hasta ahora, en ciervo se desconoce esta información, pero sí existen estudios en
nuestro país con otro ungulado silvestre como es el jabalí (Naranjo et al. 2006; 2007). En
jabalíes resistentes a la tuberculosis existen dos genes sobreexpresados, el componente 3
del complemento (C3) y el metilmalonil-CoA mutasa (MUT), genes que recientemente han
sido asociados con la resistencia a la tuberculosis en ratón (Keller et al. 2004). En estudios
genéticos en jabalí, MUT también ha sido asociado con la resistencia a la tuberculosis
(Acevedo-Whitehouse et al. 2005). Ambos genes podrían contribuir a la resistencia de los
jabalíes a la tuberculosis al modificar la inmunidad innata, limitándose la capacidad de la
micobacteria de infectar y persistir dentro de los macrófagos.
4. Parasitosis del ciervo ibérico
Los procesos parasitarios son una de las principales causas de enfermedad citadas en los
cérvidos europeos, siendo las nematodosis pulmonares e intestinales y las distomatosis
hepáticas las más importantes (Chroust 1989). Sin embargo no siempre queda claramente
demostrada la etiología parasitaria de estas muertes, y existen autores que sugieren que las
infestaciones parasitarias elevadas son más bien una consecuencia de otros procesos o de
deficiencias nutricionales (Sugar 1997, Knox et al. 2006).
Prácticamente todos los parásitos del ciervo presentan una ciclicidad en su
prevalencia, intensidad de parasitación o tasa de excreción de formas reproductivas
(huevos, larvas o quistes). En la mayoría de los casos las mayores tasas de infestación y/o
excreción se dan en primavera. Las parasitaciones más altas suelen darse en ejemplares
jóvenes o muy viejos, así como en condiciones de estrés por falta de recursos tróficos
(Rossi et al. 1997).
La mayoría de las helmintiasis y todas las protozoosis del tubo digestivo son
contraídas durante el consumo de vegetales herbáceos. Cuando los lugares de alimentación
de un ungulado son compartidos por otras especies (silvestres o domésticas) existe
normalmente un alto grado de solapamiento entre sus especies parásitas. En ocasiones se
ha comprobado que la lucha contra las parasitosis del ganado doméstico ha dado resultados
espectaculares en las prevalencias halladas en ungulados silvestres como el ciervo, así como
en la mortalidad atribuida a parasitosis. Si las zonas de alimentación de los ungulados se
hallan muy localizadas (comederos) o cuando las densidades poblacionales son elevadas, la
probabilidad de infestaciones masivas aumenta (Chroust 1989).

Introducción_____________________________________________________________________
22
Un animal deficientemente alimentado o estresado (celo, transporte, densidad
excesiva, etc.) o con escasas defensas (jóvenes, viejos, final de la gestación, enfermos) será
más propenso a infestaciones parasitarias graves. La calidad del medio, especialmente en lo
que se refiere a la disponibilidad de recursos tróficos, es por tanto determinante en la
gravedad de las enfermedades parasitarias del ciervo (Sugar 1997). Por este motivo los
parásitos, particularmente los nematodos gastrointestinales, han sido utilizados como
herramienta de monitorización sanitaria en poblaciones de ungulados silvestres (Eve y
Kellogg 1977; Sugar 1997; Rossi et al. 1997).
Los parásitos del ciervo en Europa se pueden clasificar a primera vista de la
siguiente forma (Boch y Schneidawind 1988):
Protozoos
Coccidios: Parásitos del intestino, del género Eimeria. También Cryptosporidium. Según
especies y grado de parasitación pueden ser patógenos.
Género Sarcocystis: Forman quistes en la musculatura esquelética y cardíaca. Tienen muy
escasa patogenicidad. Están presentes en la mayoría de los ciervos adultos.
Toxoplasma gondii: Parásito intracelular que aparece en el tejido nervioso, vísceras y músculo
de muchas especies animales y tiene por hospedador definitivo al gato. Carece de
importancia en el ciervo, pero es una zoonosis.
Hemoparásitos: Babesia motasi, B. capreoli y Theileria ovis entre otras, se han citado
regularmente en ciervos centroeuropeos. Algunas especies, como B. capreoli, pueden
excepcionalmente causar infecciones masivas con muerte y abortos. En el ciervo también
se ha citado la parasitación por Trypanosoma sp. y por Eperytrozoon ovis.
Helmintos (nematodos, cestodos y trematodos)
Trematodos (duelas, principalmente parásitos del hígado)
• Fasciola hepática y género Dicrocoelium en hígado, así como Paramphistomum cervi en
rumen.
Cestodos (helmintos segmentados)
• Fases larvarias: Cisticercos, cenuros, quistes hidatídicos.
• Adultos: Ténidos del género Moniezia.
Nematodos (vermes redondos)
• Nematodos pulmonares: Conjunto de especies que provocan bronconeumonías
verminosas en rumiantes. El género más patógeno es Dictyocaulus (D. viviparus, D. eckerti).

___________________________________________________________________Tesis Doctoral
23
• Nematodos meníngeos: Elaphostrongylus cervi es extremadamente común (Vicente y
Gortázar 2001; Vicente et al. 2006b) y aparentemente poco patógeno en el ciervo ibérico.
• Nematodos gastrointestinales: Conjunto de especies que provocan las llamadas
gastroenteritis parasitarias de los rumiantes. Su poder patógeno depende de la intensidad de
parasitación y de los géneros implicados, siendo Haemonchus el más patógeno.
• Otros nematodos incluyen los filáridos parásitos del hígado (Elaeophora elaphi) y del tejido
conjuntivo (Onchocerca sp., Setaria sp.).
Artrópodos
Insectos:
• Hipobóscidos: Dípteros picadores provistos de alas por lo cual no permanecen unidos al
cadaver.
• Oéstridos: Diferentes dípteros cuyas larvas se desarollan en las vías respiratorias altas
(Cephenemyia auribarbis, Pharyngomyia picta) o tejido subcuáneo (Hypoderma diana).
• Pulgas y malófagos (Cervicola meyeri).
Ácaros:
• Sarna (Sarcoptes scabiei).
• Neotrombicula autumnalis.
• Garrapatas: Hyalomma marginatum marginatum, Rhipicephalus (Boophilus) annulatus, R. Bursa,
Dermacentor marginatum, Ixodes ricinus.
4.1 Ectoparásitos (garrapatas)
Las enfermedades transmitidas por garrapatas son un buen modelo para el estudio de las
interacciones entre animales domésticos y silvestres, ya que los ungulados domésticos y
silvestres comparten las mismas especies de garrapatas y son susceptibles a la infección por
numerosos patógenos de forma similar (Estrada-Peña et al. 2004; Ruiz-Fons et al. 2006).
Los ungulados silvestres tienen un papel importante en el mantenimiento de las garrapatas,
pudiendo ser un reservorio de patógenos.
Son numerosos los agentes patógenos transmitidos por garrapatas, así como las
especies de garrapatas involucradas en su transmisión. En España existen, al menos, 10
especies diferentes de ixódidos que parasiten el ciervo ibérico, siendo las más frecuentes
Hyalomma marginatum marginatum, Ixodes ricinos, Rhipicephalus bursa o R. (Boophilus) annulatus,
esta última sólo ha sido identificada en la provincia de Cádiz (Ruiz Fons et al. 2006).
Algunas de estas especies también parasitan al jabalí. Se sabe que Hy. m. marginatum

Introducción_____________________________________________________________________
24
y R. bursa presentan un patrón inverso en cuanto a su frecuencia relativa mensual,
coincidiendo las frecuencias relativas más altas de Hy. m. marginatum con las más bajas de R.
bursa a lo largo del año, ambas especies se pueden encontrar durante todo el año en ciervo
y en jabalí en el centro sur de la península, presentando más de un ciclo de vida por año.
Todo esto habría que tenerlo presente para entender el papel de los ungulados silvestres en
el mantenimiento de las infestaciones de garrapatas y a la hora de mejorar los programas de
control sanitario en este campo (Ruiz-Fons et al. 2006).
4.2 Helmintos: Elaphostrongylus cervi, modelo de estudio
Este es un parásito altamente específico, coevolucionado y subletal. En el ciervo ibérico, la
prevalencia y la abundancia de excreción de larvas del género Elaphostrongylus varían de
forma inversamente proporcional a la condición física general (estado nutricional,
capacidad inmune, etc) de los ejemplares. Por tanto, el estudio de estos parámetros puede
tener utilidad para el seguimiento sanitario de las poblaciones naturales.
E. cervi pertenece a la familia Protostrongylidae (Nematoda: Metastrongyloidea), que
incluye parásitos pulmonares cuyos adultos frecuentemente forman pequeños nódulos
inflamatorios en la zona caudo-dorsal de los pulmones de rumiantes salvajes o domésticos
(Anderson 2000). Esta familia también incluye otros parásitos meníngeos de los géneros
Elaphostrongylus y Parelaphastrongylus, que se describen naturalmente en poblaciones
autóctonas de cérvidos eurasiáticas y americanas respectivamente (Mason 1995). El genero
Elaphostrongylus comprende tres especies: E. rangiferi Mitskevich 1958, en el reno (Rangifer
tarandus); E. alces Steen, Chabaud y Rehbinder 1989, en el alce Europeo (Alces alces); y E.
cervi Cameron 1931, en el ciervo rojo, el corzo (Capreolus capreolus) y el ciervo Sika (Cervus
nippon) (Mason 1995).
E. cervi fue descrito por primera vez en España recientemente (Vicente y Gortázar
2001; Valcárcel y Romero 2002). También ha sido descrito recientemente su patrón
estacional de excreción de larvas infectantes de primer estadío (Vicente et al. 2005a). Los
parásitos meníngeos o extrapulmonares, como pertenecientes a la familia
Protostrongylidae, necesitan un molusco terrestre como hospedador intermediario, así, en
la Península Ibérica, las babosas podrían estar principalmente implicadas. El ciervo ingiere
accidentalmente gasterópodos como hospedadores intermediarios que contienen estadios
larvarios infestantes 3 (L3), capaces de llegar al torrente sanguíneo desde las paredes
intestinales. Tras su paso y maduración en el espacio subaracnoideo (donde se pueden
encontrar ejemplares subadultos), los ejemplares adultos de E. cervi se localizan

___________________________________________________________________Tesis Doctoral
25
definitivamente en las fascias y tejidos conectivos vinculados a la musculatura esquelética,
donde viven en grupos o parejas. Principalmente se encuentran en la musculatura del
pecho, intercostal, axilas e ingle. En esta localización las hembras producen huevos que son
liberados al torrente sanguíneo y alcanzan los espacios capilares de los pulmones donde el
estadio larvario infestante 1 (L1) eclosiona, pasa al espacio alveolar, asciende por el árbol
bronquial y es deglutido. Finalmente L1 se excreta a través de las heces del ciervo al medio
ambiente, donde la larva es capaz de diseminarse activamente en medios húmedos (Boch y
Schneidawind 1988; Handeland et al. 2000) y penetrar activamente en el hospedador
intermediario (Rezac et al. 1994).
A pesar de su localización, estos parásitos son escasamente patógenos cuando la
infestación ocurre sobre su especie hospedadora habitual, pasando habitualmente
desapercibidos. Al igual que se da con otras especies parásitas, la patogenicidad de este
parásito en especies hospedadoras no adecuadas ha sido causa de que exista gran interés en
su diagnóstico, especialmente de cara a la exportación de ejemplares cervunos desde zonas
endémicas a otras zonas libres de la parasitación y donde existen otras especies de
ungulados autóctonos (Gajadhar et al. 1995).
La agregación de los animales, por ejemplo en torno a puntos de agua, está asociada
positivamente con la prevalencia de E. cervi (Vicente et al. 2006b), lo que puede ser debido
al aumento de la probabilidad de contacto con gasterópodos infectados. Dicha prevalencia
está también asociada positivamente con la edad, y las intensidades tienden a ser mayores
en machos que en hembras. La inmunidad adquirida podría tener aquí efecto, ya que en
hembras se ha comprobado que existe un ligero descenso de la intensidad de parasitación
con la edad (Vicente et al. 2006b).
En cuanto a los tratamientos antihelmínticos frente a este parásito, el uso de la
ivermectina, derivado de la avermectina con un amplio espectro frente a muchos
nematodos y artrópodos, está muy difundido entre algunos gestores de fincas. Sin embargo,
un estudio sobre la eficacia del tratamiento con este compuesto frecuentemente utilizado
demostró que, aunque es capaz de reducir el nivel de excreción, no conseguía la supresión
total de excreción larvaria, por lo que los nematodos adultos seguían siendo viables y
reproductivos (Rodríguez et al. 2006).

Introducción_____________________________________________________________________
26
5. Antecedentes sobre respuesta inmunitaria, tuberculosis y parasitosis en el ciervo
ibérico
5.1 Dicotomía en la asignación de recursos
Los recursos que se encuentran a disposición de los animales silvestres son limitados. Por
ello, éstos han evolucionado bajo la presión que supone invertir los recursos de la forma
más adecuada: ¿invertir en crecimiento y reproducción o invertir en capacidad inmune?
En el ciervo, y probablemente en otros mamíferos silvestres, el tamaño del bazo
constituye un indicador de capacidad inmune (Corbin et al. 2007). El tamaño de esta
víscera depende de la condición física de su portador, y puede verse afectado por la
asignación diferencial de recursos a capacidad inmune por un lado, y a crecimiento y
reproducción por otro (Vicente et al. 2007a).
En esta figura, tomada de Vicente et al. 2007a, se representa un diagrama con la
conexión entre las variables estudiadas. Así, las flechas con línea continua representan los
efectos positivos, mientras que las discontinuas corresponden a efectos negativos. U
representa las variables latentes (varianza inexplicada de la variable a la que afecta la flecha).
El diagrama muestra así la asignación diferencial de recursos a capacidad inmune por un
lado y a crecimiento y reproducción por otro, lo cual presenta marcadas diferencias entre
sexos y edades.
Figura tomada de Vicente et al. (2007a) en la que se representa la asignación diferencial de recursos

___________________________________________________________________Tesis Doctoral
27
5.2 Dicotomía entre condición nutricional y riesgo de infección
Según lo explicado anteriormente, podríamos pensar que la mejora de la condición
nutricional llevará a una menor carga parasitaria a través de una mejora en la capacidad de
respuesta inmunitaria del hospedador. Sin embargo, cuando la citada mejora se procura a
través de la alimentación suplementaria, el incremento de la agregación en torno a
comederos (y por tanto de la probabilidad de la transmisión de patógenos) puede
contrarrestar el beneficio esperado. Esto se ha observado en el caso de dos patógenos
ampliamente distribuidos en ciervos del centro y sur de la península: E. cervi y el complejo
M. tuberculosis (Vicente et al 2007b).
Figura tomada de Vicente et al. (2007b). A mayor densidad de ciervos, mayor prevalencia de lesiones compatibles con tuberculosis pero menor excreción de L1 de Elaphostrongylus. La contradicción se explica por la dicotomía entre condición nutricional, que mejora con la alimentación suplementaria en paralelo a la densidad, y riesgo de infección por TB, que aumenta con la agregación en torno a los comederos.
A efectos de gestión de las especies de fauna silvestre objeto de aprovechamiento
cinegético, la recomendación que se deriva del estado actual de conocimientos es que debe
procurarse mantener cargas ganaderas acordes con la capacidad de acogida del medio, y
que los elementos que produzcan agregación espacial (comederos y puntos de agua) deben
gestionarse con precaución. Desde el punto de vista científico, se requiere investigación
aplicada para encontrar formas de aporte de agua y alimento compatibles con la sanidad
animal, así como investigación básica para conocer mejor los complejos mecanismos
mediante los cuales se produce la relación entre capacidad inmune, condición física y
parasitismo.

Introducción_____________________________________________________________________
28
Bibliografía
Acevedo-Whitehouse K., Vicente J, Gortázar C, Höfle U, Fernández-de-Mera IG,
Amos W. 2005. Genetic resistance to bovine tuberculosis in the Iberian wild boar.
Molecular Ecology 14: 3209–3217.
Alonso-Álvarez C, Tella JL. 2001. Effects of experimental food restriction and
body-mass changes on the avian T-cell-mediated immune response. Canadian Journal Of
Zoology-Revue Canadienne de Zoologie 79: 101-105.
Andersson L, Lunden A, Sigurdardottir S, Davies CJ, Rask L. 1988. Linkage
relationships in the bovine MHC region. High recombination frequency between class II
subregions. Immunogenetics 27: 273-280.
Anderson RC. 2000. Nematode parasites of Vertebrates. Their development and
transmission. CABI Publishing. New York, USA.
Aranaz A, de Juan L, Montero N, Sánchez C, Galka M, Delso C, Álvarez J, Romero
B, Bezos J, Vela AI, Briones V, Mateos A, Domínguez L. 2004. Bovine tuberculosis
(Mycobacterium bovis) in wildlife in Spain. Journal of Clinical Microbiology 42: 2602-2608.
Banchereau J, Steinman RM. 1998. Dendritic cells and the control of immunity.
Nature 392:245.
Boch J, Schneidawind H. 1988. Krankheiten des jagdbaren Wildes. Parey. Berlin,
Alemania.
Caffrey JP. 1994. Status of bovine tuberculosis eradication programmes in Europe.
Veterinary Microbiology 40: 1–4.
Caley P, Hone J. 2004. Disease transmission between and within species, and the
implications for disease control. Journal Applied Ecology 41: 94–104.
Casares N. 2001. Vacunación contra un cáncer de colon murino utilizando péptidos
inductores de respuesta T helper y T citotóxicas. Universidad de Navarra. Tesis Doctoral.
Casati MZ, Longeri M, Polli M, Ceriotti G, Poli G. 1995. BoLA class II
polymorphism and immune response to Mycobactenum bovis antigens in vitro. Z Tierzuecht
Zuechtungsbiol 112: 391-400.
Cassinello J. En prensa. Manual para la Gestión Integral de los Ecosistemas
Mediterráneos en los Terrenos Cinegéticos de Andalucía. M Sáenz de Buruaga, J Carranza,
eds. Publicaciones de la Junta de Andalucía. Sevilla, España.
Carranza J. 1999. Aplicaciones de la etologia a manejo de las poblaciones de ciervo
del suroeste de la Península Ibérica: producción y conservación. Etologia 7: 5-18.

___________________________________________________________________Tesis Doctoral
29
Carranza J. 2002. Atlas de los mamíferos terrestres de España. Palomo LJ y Gisbert
J, eds. Dirección General de Conservación de la Naturaleza – Ministerio de Medio
Ambiente, Sociedad Española para la Conservación y Estudio de los Mamíferos, Sociedad
Española para la Conservación y Estudio de los Murciélagos. Madrid, España.
Corbin E, Vicente J, Martín-Hernando MP, Acevedo P, Pérez-Rodríguez L,
Gortázar C. En prensa. Spleen mass as a measure of immune strenght in mammals.
Mammal Review.
Cresswell P. 1994. Antigen presentation. Getting peptides into MHC class II
molecules. Current Biology 4: 541.
Cheema MA, Qureshi MA, Havenstein GB. 2001. A comparison of the immune
response of a 2001 commercial broiler with a 1957 randombred broiler strain when fed
representative 1957 and 2001 broiler diets. Poultry Science 82: 1519-1529.
Chroust K. 1989. Epizootiology and prevention of helminthiasis of game animals in
Czechoslovakia and its relationship to the parasitic dis eases of cattle. Angew Parasitology
30: 11-4.
De Lisle GW, Mackintosh CG, Bengis RG. 2001. Mycobacterium bovis in free-living
and captive wildlife, including farmed deer. Revue Scientifique Et Technique Office
International Des Epizooties 20: 86-111.
Delahay RJ, De Leeuw AS, Barlow AM, Clifton-Hadley RS, Cheeseman CL. 2002.
The status of Mycobacterium bovis infection in UK wild mammals: a review. Veterinary
Journal 164: 90–105.
Deutz A, Spergser J, Wagner P, Rosengarten R, Kofer J. 2005. Mycobacterium avium
subsp paratuberculosis in wild animal species and cattle in Styria/Austria. Berliner und
Munchener Tierarztliche Wochenschrift 118: 314-320.
Ekkel ED, Kuypers AH, Counotte GHM, Tielen MJM. 1995. The
phytohemagglutinin (PHA) skin-test as an indicator of stress-induced changes in immune
reactivity in pigs. Veterinary Quarterly 17: 143-146.
Estrada-Peña A, Quílez J, Sánchez Acedo C. 2004. Species composition,
distribution, and ecological preferentes of the ticks of grazing sheep in north-central Spain.
Medical and Veterinary Entomology 18: 123–133.
Eve JH, Kellogg FE. 1977. Management implications of abomasal parasites in
southeastern white-tailed deer. Journal of Wildlife Management 41: 169-177.

Introducción_____________________________________________________________________
30
Gajadhar AA, Tessaro SV. 1995. Susceptibility of mule deer (Odocoileus hemionus) and
two species of North American molluscs to Elaphostrongylus cervi. Journal Parasitology 81:
593–596.
Gortázar C, Fernández-De-Luco D, Frolich K. 1998. Keratoconjunctivitis in a free-
ranging red deer (Cervus elaphus) population in Spain. Zeitschrift für Jagdwissenschaft 44:
257-261.
Gortázar C, Herrero J, Villafuerte R, Marco J. 2000. Historical examination of the
status of large mammals in Aragon, Spain. Mammalia 64: 411-422.
Gortázar C, Vicente J, Fierro Y, León L, Cubero MJ, Gonzalez M. 2002. Natural
Aujeszky's disease in a Spanish wild boar population. Annals of the New York Academy
Science 969: 210-212.
Gortázar C, Vicente J, Gavier-Widen D. 2003. Pathology of bovine tuberculosis in
the European wild boar (Sus scrofa). Veterinary Record 152: 779-780.
Gortázar C, Vicente J, Samper S, Garrido JM, Fernández-de-Mera IG, Gavín P,
Juste RA, Martín C, Acevedo P, de la Puente M, Höfle U. 2005. Molecular characterization
of Mycobacterium tuberculosis complex isolates from wild ungulates in South-Central Spain.
Veterinary Research 36: 43-52.
Gortázar C, Acevedo P, Ruiz-Fons F, Vicente J. 2006. Disease risks and
overabundance of game species. European Journal of Wildlife Research 52: 81-87.
Griffin JF, Mackintosh M. 2000. Tuberculosis in deer: Percepcions, Problems and
Progress. The Veterinary Journal 160: 202-219.
Griffin JFT, Chinn DN, Rodgers CR. 2004. Diagnostic strategies and outcomes on
three New Zealand deer farms with severe outbreaks of bovine tuberculosis. Tuberculosis
84: 293-302.
Gunning RF. 1985. Bovine tuberculosis in roe deer [letter]. Veterinary Record 116:
300-301.
Handeland K, Gibbons LM, Skorping A. 2000. Aspects of the life cycle and
pathogenesis of Elaphostrongylus cervi in red deer (Cervus elaphus). Journal Parasitology 86:
1061–1066.
Hanlon AJ, Rhind SM, Reid HW. 1994. Relationship between immune-response,
liveweight gain, behavior and adrenal-function in red deer (Cervus elaphus) calves derived
from wild and farmed stock, maintained at 2 housing densities. Applied Animal Behaviour
Science 41: 243-255.
___________________________________________________________________Tesis Doctoral
31
Hein WR Mackay CR. 1991. Prominence of gamma delta T cells in the ruminant
immune system. Immunology Today 12: 30-4.
Inaba K, Steinman RM, Van Voorhis WC, Muramatsu S. 1983. Dendritic cells are
critical accessory cells for thimus-dependent antibody responses in mouse and in man.
Proceedings of the National Academy of Sciences USA 80: 6041.
Janeway CA, Travers P, Walport M, Shlomchik MJ. 2003. Inmunobiología: El
sistema inmunitario en condiciones de salud y enfermedad. Masson SA Ed. Barcelona,
España.
Knox MR, Torres-Acosta JFJ, Aguilar-Caballero AJ. 2006. Exploiting the effect of
dietary supplementation of small ruminants on resilience and resistance against
gastrointestinal nematodes. Veterinary Parasitology 139: 385-393.
Lauber J, Blumenthal A, Buer J, Ehlers S. 2004. Resistance and susceptibility to
tuberculosis analyzed at the transcriptome level: lessons from mouse macrophages.
Tuberculosis 84: 144–158.
Lanzavecchia A, Bove S. 1985. Specific B lymphocytes efficiently pick up, process
and present antigen to T cells. Behring Institute Mitteilungen 77: 82-7.
Lanzavecchia A. 1990. Receptor-mediated antigen uptake and its effect on antigen
presentation to class II-restricted T lymphocytes. Annual Review of Immunology 8:773.
Lewin HA, Russell GC, Glass EJ. 1999. Comparative organization and function
ofthe major histocompatibility complex of domesticated cattle. Immunological Reviews
167: 145-158.
Liébana E, Aranaz A, Mateos A, Vilafranca M, Gomez-Mampaso E, Tercero JC,
Alemany J, Suárez G, Domingo M, Domínguez L. 1995. Simple and Rapid Detection of
Mycobacterium tuberculosis complex organisms in bovine tissue samples by PCR. Journal
of Clinical Microbiology. 33: 33–36.
Machackova M, Svastova P, Lamka J, Parmova I, Liska V, Smolik J, Fischer OA,
Pavlik I. 2004. Paratuberculosis in farmed and free-living wild ruminants in the Czech
Republic (1999-2001). Veterinary Microbiology 101: 225-234.
Mackintosh CG, de Lisle GW, Collins DM, Griffin JFT. 2004. Mycobacterial
diseases of deer. New Zealand Veterinary Journal 52: 163-174.
Martínez Garrido E. 2000. La caza en la provincia de Ciudad Real: su análisis
geográfico como aprovechamiento reciente. Universidad Autónoma de Madrid. Tesis
Doctoral.

Introducción_____________________________________________________________________
32
Mason P. 1995. Elaphostrongylus cervi and its close relatives: a review of
protostrongylids (Nematoda: Metastrongyloidea) with spiny-tailed larvae. Surveillance 22:
19–24.
Mosmann TR, Cherwinski H, Bond MW, Giedlin MA, Coffman RL. 1986. Two
types of murine helper T cell clone. I. Definition according to profiles of lymphokine
activities and secreted proteins. Journal of Immunology 136: 2348.
Naranjo V, Ayoubi P, Vicente J, Ruiz-Fons F, Gortázar C, Kocan KM, de la Fuente
J. 2006. Characterization of selected genes upregulated in non-tuberculous European wild
boar as possible correlates of resistance to Mycobacterium bovis infection. Veterinary
Microbiology 116: 224–231.
Naranjo V, Villar M, Martín-Hernando MP, Vidal D, Höfle U, Gortázar C, Kocan
KM, Vazquez J, de la Fuente J. 2007. Proteomic and transcriptomic analyses of differential
stress/inflammatory responses in mandibular lymph nodes and oropharyngeal tonsils of
European wild boars naturally infected with Mycobacterium bovis. Proteomics 7: 220-231.
Naranjo V, Gortázar C, Vicente J, de la Fuente J. En prensa. Evidence of the role
of European wild boar as a reservoir of tuberculosis due to Mycobacterium tuberculosis
complex. Veterinary Microbiology Review.
Nebbia P, Robino P, Ferroglio E, Rossi L, Meneguz G, Rosati S. 2000.
Paratuberculosis in red deer (Cervus elaphus hippelaphus) in the Western Alps. Veterinary
Research Communications 24: 435-443.
O´Reilly LM, Daborn CJ. 1995. The epidemiology of Mycobacterium bovis infections
in animals and man: a review. Tuberculosis and Lung Disease 76: 1–46.
Reyes R, Pérez-de-la-Lastra JM, Vicente J, Ruiz-Fons J, Garrido JM, Gortázar C.
En evaluación. Large scale ELISA testing of Spanish red deer for paratuberculosis.
Veterinary Immunology and Immunopathology.
Rezac P, Palkovic L, Holasova E, Busta J. 1994. Modes of entry of the first-stage
larvae of Elaphostrongylus cervi (Nematoda: Protostrongylidae) into pulmonate snails Arianta
arbustorum and Helix pomatia. Folia Parasitol 41: 209–214.
Rodríguez O, Fernández de Mera IG, Vicente J, Peña A, Gortázar C. 2006. Efficacy
of in-feed-administered ivermectin on Elaphostrongylus cervi first-stage excretion in red deer
(Cervus elaphus). Parasitology Research 98: 176–178.
Roit J. 1998. Inmunología. Editorial Panamericana. Buenos Aires, Argentina.
Rossi L, Eckel B, Ferroglio E. 1997. A survey of the gastro-intestinal nematodes of
roe deer (Capreolus capreolus) in a mountain habitat. Parassitologia 39: 303-312.

___________________________________________________________________Tesis Doctoral
33
Rubinstein D, Roska AK, Lipsky PE. 1987. Antigen presentation by liver sinusoidal
lining cells after antigen exposure in vivo. Journal of Immunology 138: 1377.
Ruiz-Fons F, Fernández-de-Mera IG, Acevedo P, Höfle U, Vicente J, de la Fuente
J, Gortázar C. 2006. Ixodid ticks parasitizing Iberian red deer (Cervus elaphus hispanicus) and
European wild boar (Sus scrofa) from Spain: Geographical and temporal distribution.
Veterinary Parasitology 140: 133-142.
Soriguer RC, Fandos P, Bernáldez E, Delibes-Senna JR. 1994 El ciervo en
Andalucía. Ed. Junta de Andalucía. Sevilla, España.
Stingl G, Katz SI, Clement L, Green I, Shevach EM. 1978. Immunologic functions
of Ia-bearing epidermal Langerhans cells. Journal of Immunology 121: 2005.
Sugar L. 1997. Deer and their parasites: disease or coexistence? Parassitologia 39:
297-301.
Swier K, Brown DR, Bird JJ, Martín WD, Van Kaer L, Reiner SL. 1998. A critical,
invariant chain-independent role for H2-M in antigen presentatios. Journal of Immunology
160-540.
Tate M. 1997. Evolution of ruminant chromosomes. Dissertation. University of
Otago. Dunedin, Nueva Zelanda.
Unanue ER 1984. Antigen-presenting function of the macrophague. Annual
Review Immunology 2: 395.
Valcárcel F, Romero CG. 2002. First report of Elaphostrongylus cervi in Spanish red
deer (Cervus elaphus hispanicus). Journal of Helminthology 76: 91–93.
Vicente J, Gortázar C. 2001. High prevalence of large spiny-tailed protostrongylid
larvae in Iberian red deer. Veterinary Parasitology 96: 165-170.
Vicente J, Fierro Y, Gortázar C. 2005a. Seasonal dynamics of the fecal excretion of
Elaphostrongylus cervi (Nematoda, Metastrongyloidea) first-stage larvae in Iberian red deer
(Cervus elaphus hispanicus) from southern Spain. Parasitology Research 95: 60-64.
Vicente J, Ruiz-Fons F, Vidal D, Höfle U, Acevedo P, Villanúa D, Fernández-de-
Mera IG, Martín MP, Gortázar C. 2005b. Large-scale serosurvey on Aujezsky´s disease
virus infection in the European wild boar from Spain. Veterinary Record 156: 408-412.
Vicente J, Höfle U, Garrido JM, Fernández-De-Mera IG, Juste R, Barral M,
Gortázar C. 2006a. Wild boar and red deer display high prevalences of tuberculosis-like
lesions in Spain. Veterinary Research 37: 1-11.

Introducción_____________________________________________________________________
34
Vicente J, Fernández de Mera IG, Gortázar C. 2006b. Epidemiology and risk
factors analysis of elaphostrongylosis in red deer (Cervus elaphus) from Spain. Parasitology
Research 98: 77–85.
Vicente J, Pérez-Rodríguez L, Gortázar C. 2007a. Sex, age, spleen size and kidney
fat of red deer relative to infection intesnities of the lungworm Elaphostrongylus cervi.
Naturwissenschaften. 94: 581-587.
Vicente J, Höfle U, Fernández-De-Mera IG, Gortázar C. 2007b. The importance of
parasite life history and host density in predicting the impact of infections in red deer.
Oecologia 152: 655-664.
Wyckoff JH. 2002. Bovine T lymphocyte responses to Brucella abortus. Veterinary
Microbiology 90: 395-415
Yamazaki K, Yamaguchi M, Andrews PW, Peake B, Boyse EA. 1978. Mating
preferences of f2 segregants of crosses between mhc-congenic mouse strains.
Immunogenetics 6: 253-259.
Yewdell JW, Bennink JR. 1992. Cell biology of antigen processing and presentation
to major histocompatibility complex class I molecule-restricted T lymphocytes. Advances
in Immunology 52:1.
Zinkernagel RM, Doherty PC. 1974. Restriction of in vivo T cell-mediated
cytotoxicity in lymphocytic choriomeningitis within a syngeneic or semiallogeneic system.
Nature 248-701.

Hipótesis y objetivos


___________________________________________________________________Tesis Doctoral
Hipótesis y objetivos de la tesis
La respuesta inmunitaria es la forma en que el cuerpo reconoce y se defiende a sí mismo
contra las bacterias, virus y sustancias que parecen extrañas y dañinas para el organismo.
Este término se utiliza para describir una serie de eventos dinámicos que ocurren in vivo,
en el sistema inmune innato/constitutivo y adaptativo/inducible, originados por una
alteración de la homeostasis de los tejidos.
El ciervo ibérico (Cervus elaphus hispanicus) constituye un buen modelo para estudiar
las interrelaciones del triángulo recursos – hospedador – capacidad de respuesta. Utilizando
como principales ejemplos la tuberculosis y el nematodo parásito Elaphostrongylus cervi, en
esta tesis se plantea la hipótesis de que la capacidad de un individuo para controlar los
citados patógenos está condicionada por factores fisiológicos como sexo, edad y condición
física; y factores genéticos que modulan la resistencia o susceptibilidad a las infecciones.
En consecuencia, el objetivo general de esta tesis es aportar un mayor conocimiento
sobre los factores fisiológicos y genéticos que modulan la respuesta inmunitaria celular y
humoral en el ciervo ibérico, lo que se pretende mediante los siguientes objetivos parciales.
1º Evaluación de factores que intervienen en la respuesta dérmica a la inyección de
antígenos, como los derivados purificados de proteinas micobacterianas (PPDs) o la
fitohemaglutinina (PHA), un mitógeno derivado de Phaseolus vulgaris.
2º Experimentar con la relación entre condición física (estado nutricional) y capacidad del
sistema inmunitario para controlar los parásitos, utilizando como modelo la excreción de
parásitos protoestrongílidos.
3º Análisis del polimorfismo existente en el Complejo Mayor de Histocompatibilidad de
clase II en una población de ciervo ibérico. Implicación en respuesta inmunitaria en cuanto
a resistencia a determinados parásitos y enfermedades.
4º Estudio de la diferente expresión de genes relacionados con la respuesta inflamatoria e
inmunitaria, analizando linfonodos mesentéricos de ciervos ibéricos infectados
naturalmente con Mycobacterium bovis.


Capítulo 1
Factores que intervienen en la respuesta dérmica a la inyección de antígenos
Determinación de la dosis óptima de PHA y tiempo hasta la lectura del incremento del pliegue cutáneo en la intradermorreacción en ciervo
“Optimal dose and timing in phytohaemagglutinin skin-testing of deer”
Efecto del sexo y la edad en el incremento de pliegue cutáneo en la intradermorreacción con PHA en el ciervo ibérico
“The effects of sex and age on phytohaemagglutinin skin-testing of deer”
Inyección intradérmica de PPDb, PPDa y PHA en el ciervo ibérico: Factores que afectan a la respuesta de la tuberculina
“Factors affecting red deer skin test responsiveness to bovine and avian tuberculin and to phytohaemagglutinin in Spain”


___________________________________________________________________Tesis Doctoral
41
Determinación de la dosis óptima de PHA y tiempo hasta la lectura del incremento
del pliegue cutáneo en la intradermorreacción en ciervo
Resumen
En este trabajo se pretende establecer la dosis óptima de un mitógeno, la fitohemaglutinina
(PHA), y el tiempo óptimo de lectura del incremento del pliegue cutáneo tras la
intradermorreacción en el ciervo ibérico. Este mitógeno actuaría como indicador de la
respuesta inmune mediada por células.
Para ello se utilzaron 20 hembras de ciervo ibérico a las que se inyectó
intradérmicamente tres dosis de este mitógeno (10, 50 y 250 µg) en el lado derecho del
cuello. En un cuarto punto también se inyectó como control un tampón salino fosfatado
(PBS). El incremento de pliegue cutáneo se midió a las 0, 12, 24, 36, 48, 60, 72, 84 y 96
horas siguientes a la inyección.
La dosis más alta que se analizó (250 µg) fue la que originó una respuesta más clara
y más duradera en el tiempo. En cuanto al tiempo de lectura, hubo muy poca variación en
el incremento medido entre las 48 y 84 horas tras la inyección. Esta respuesta se
correlacionó positivamente con el peso corporal del animal. La correlación del incremento
del pliegue con el peso vivo no se apreció cuando se valoraron las dosis más bajas de PHA
o el PBS.
Esta técnica podría ser fácil de aplicar en el campo de la investigación ecológica e
inmunológica en ciervos, con un mínimo entrenamiento y sin requerir medios técnicos
especializados en el ciervo.


___________________________________________________________________Tesis Doctoral
43

Capítulo 1______________________________________________________________________
44

___________________________________________________________________Tesis Doctoral
45


___________________________________________________________________Tesis Doctoral
47
Efecto del sexo y la edad en el incremento de pliegue cutáneo en la
intradermorreacción con PHA en el ciervo ibérico
Resumen
El objetivo de este trabajo es determinar si en el ciervo ibérico (Cervus elaphus hispanicus)
existen diferencias relacionadas con el sexo y la edad en la respuesta a la inyección
intradérmica de un mitógeno, fitohemaglutinina (PHA).
Para ello se testaron 110 ciervos ibéricos de granja (51 machos y 59 hembras)
inyectándoles 250 µg de PHA intradérmicamente en el lado derecho del cuello. La edad de
estos animales oscilaba entre 21 meses y más de 5 años. El incremento de pliegue cutáneo
se midió a las 72 horas tras la inyección.
Se demostró un efecto significativo del sexo en el incremento del pliegue cutáneo,
de forma que los machos tendían a tener una mayor respuesta que las hembras (p=0.02).
En cambio, no hubo diferencias significativas en relación con la edad del animal.
Los valores de referencia propuestos permiten, en cuanto a dosis y tiempo de
lectura, la incorporación del mitógeno a la rutina de las pruebas de intradermorreacción con
antígenos micobacterianos. El sexo, probablemente debido a las características ecológicas
en el ciervo, debe ser tomado en cuenta a la hora de interpretar los resultados de la
intradermorreacción, tanto en ecología como en el control sanitario de la tuberculosis. Se
debe evaluar el incremento de pliegue relativo al grosor de la piel del animal más que el
incremento per sé, ya que la primera es una medida más apropiada de “incremento real”.
Este hecho puede tener trascendencia en la interpretación de los resultados de la prueba de
la tuberculina.


___________________________________________________________________Tesis Doctoral
49
The effects of sex and age on phytohaemagglutinin skin-testing of deer Fernández-de-Mera IG, Vicente V, Höfle U, Rodríguez O, García A, Gortázar C New Zealand Veterinary Journal. En prensa
Abstract
AIM: To determine if there are sex- or age-related differences in the skinfold thickness
increase in response to the mitogen phytohaemagglutinin (PHA) in red deer.
METHODS: Two hundred and fifty µg of PHA was injected intradermally of the right side
of the neck in 110 (51 males and 59 females) captive Iberian red deer (Cervus elaphus
hispanicus). The age range of these animals was from 21-month-old to ≥5-year-old. Skinfold
thicknesses were measured at 72 h following injection.
RESULTS: There was a significant effect of sex on the increase in skinfold thickness;
males tended to have greater increases than females after correcting for other confunding
variables (p=0.02). No age-related differences were statistically evident.
CONCLUSIONS AND CLINICAL RELEVANCE: Reference values are provided at a
dosage and time of measurement that are in accordance with the logistics of performing
comparative cervical tuberculin skin testing of red deer. Sex, probably due to life history
constraints in red deer, must be taken into account when interpreting skin-test data, both in
ecology and in TB control. Skinfold increase relative to the thickness of the skin rather
than skinfold increase per se should be evaluated as a more appropriate measure of ‘true
skinfold increase’, which would have clinical relevance in the interpretation of tuberculin
skin testing.
KEY WORDS: Cellular immunity, Cervus elaphus, mammalian immune response, wildlife
bioindicators, phytohaemagglutinin skin test
Abbreviations
CI = Confidence intervals
PBS = Phosphate buffered saline
PHA = Phytohaemagglutinin
SD = Standard deviation
SEM = Standard error of the mean
Tb = Tuberculosis

Capítulo 1______________________________________________________________________
50
Introduction
Measurement of immune reactivity is an important tool to define how animals cope with
environmental demands (Hessing et al 1995), and is also valuable by complementing
diagnostic tests based on the immune response. The phytohaemagglutinin (PHA) skin test
is an inexpensive and easy measurement of in-vivo cellular immune responses (Smits et al
1999). PHA, a lectin from Phaseolus vulgaris, is a mitogen. The skin test comprises injecting
PHA intradermally and measuring the change in skin thickness. The immune response is
considered to be proportional to the difference in swelling between the site injected with
PHA and a control site injected with phosphate buffered saline (PBS), or the increase in
swelling before and after injection of PHA (Kelley et al 1982, Ekkel et al 1995, Smits et al
1999, Hernández et al 2005).
In a previous study (Fernández-de-Mera et al 2006), we demonstrated a dose-
dependent in-vivo response in red deer hinds to PHA injected intradermally, and that
variation over time after injection required the establishment of a fixed time for
measurement of the cellular response. Using a fixed protocol and the same observer for the
measurement of skin thickness (a double measure) in deer provided reasonable reliability.
The results showed that a dose of 250 µg gave clear and long-lasting responses, and a time
of 72 h was proposed for PHA skin testing of deer, since tuberculin skin tests are also read
at 72 h post-injection (Waters et al 2004), and both techniques would most likely be used
concurrently, particularly under field conditions, with the purpose of detecting possible
false negatives in the tuberculin skin test, since PHA allows detecting anergic animals.
However, it is necessary to determine whether differences in reliability might also depend
on the sex and age of the individuals tested. Hence, in this study we used a large sample of
farmed Iberian red deer of different age groups and both sexes (51 males and 59 females)
to test for the effects of these factors on the skin test response to PHA.
Materials and methods
Study animals
A group of 110 Iberian red deer (51 males and 59 females), comprising 45 21-month-old
individuals named yearlings (24 males and 21 females), 13 3-year-old adults (11males and 2
females), 19 4-year-old adults (11 males and 8 females), and 33 ≥5-year-old adults (5 males
and 28 females), was kept on the Experimental Farm of the University of Castilla - La
Mancha, Albacete, Spain. All the study animals were apparently healthy. The farm is

___________________________________________________________________Tesis Doctoral
51
tuberculosis free, as no animals have tested positive to the comparative cervical tuberculin
test, clinical cases or post-mortem evidence of the disease. The animals were accustomed to
handling and experienced no detectable behavioural stress. They were individually
identified with an ear tag and transponder. All deer were kept in open-air enclosures during
the course of the study, which was conducted in February 2003. In this month, late winter
in Spain, the majority of stags drop their antlers and most of the hinds are pregnant. The
deer were immobilised in a hydraulic crush, for injection and measuring skin thickness. At
each injection point, hair was eliminated almost completely prior to intradermal injection
with an electric shaved (Moser® Avalon 1290, Valencia, España) in two areas of skin on
the right side of the neck, measuring 3 x 3 cm. Each animal was held in the crush for less
than 5 min. Animals were weighed to the nearest 0.05 kg, 10 g to 300 kg escale (KC 300 S,
Mettler-Toledo SAE, Spain). All use of animals in research was approved by Castilla-La
Mancha University Animal Ethics Committee, experiment number 11-100044-141628.
Handling procedures and sampling frequency were designed to reduce stress and health
risks for subjects, according to European (86/609) and Spanish law (RD 223/1988; RD
1021/2005), and current guidelines for ethical use of animals in research (ASAB, 2006).
PHA skin testing of cell-mediated immunity
Two injection sites were prepared in the right side of the neck. A volume of 0.1 ml was
injected intradermally in one site, with 250 µg/ml of PHA (Sigma-Aldrich, Missouri, USA).
A volume of 0.1 ml of PBS was injected intradermally in the other site as a control. One-ml
syringes fitted with a 25-G 1/2-inch needle were used. Immediately prior to injection, and
72 h after administration, skinfold thicknesses were measured twice, to the nearest 0.1 mm,
using a digital calliper (Mitutoyo, Cardiff, UK), by the same person.
Statistical analysis
To test the effect of sex and age while controlling for bodyweight on increases in skinfold
thickness (as a response variable), a generalised linear mixed model was used. Sex and age
(four levels: 21-month-old individuals named “yearlings”, 3 year old adults, 4 year old
adults, and ≥5 year old adults) were explanatory categorical factors (and the two-way
interaction), and live bodyweight was included as an explanatory continuous variable. The
effect of the skin thickness prior to injection and total body length (to the nearest 0.1 cm)
were also controlled for. Finally, we included in the model the skin thickness increased
measured at the negative control (PBS point, mm) to control for any possible increase as a

Capítulo 1______________________________________________________________________
52
consequence of mechanical irritation. The reliability of double measures has been
previously assessed by Fernández-de-Mera et al (2006). We represent the residuals of the
regression of skinfold increase on body weight across sex by age classes to visualize the
skinfold increase once corrected by the initial skinfold thickness. The residuals is the
difference (or left over) between the observed value of the variable and the value suggested
by the regression model, and provides a measure of the relative deviation (positive or
negative, which is interpreted in relative terms, but does not resemble a real response) of
the dependent variable (skinfold thickness increase) respect to explanatory factors (initial
skinfold thickness). We used the standardized residuals (the residual divided by the
standard error). Statistical uncertainty was expressed through 95% confidence intervals (CI)
of the standard error of the mean (SEM). We used SAS 9.0 Statistical package.
Results
Figure 1 shows the increase in skinfold thickness in response to PHA as a function of sex
and age, including group sizes. No individual deer had aberrant reactions, or lack of a
reaction to the test. There were statistical differences concerning sex (F=4.75, p=0.03, R2
for the model = 0.41); males tended to have greater skinfold increases (8.8 (SEM 0.57,
range 0.85-15.3) mm) than females (4.23 (SEM 0.39, range 0.5-9.35) mm) after correcting
for other confusing variables.
Figure 1. The increase in skinfold thickness (± 95% confidence intervals) in the neck of Iberian red deer 72 h after injection of 250 µg of phytohaemagglutinin, in relation to sex (○=males; □=females) and age class.
n=5
n=11
n=11
n=24
n=28
n=8
n=2
n=21
0
10
20
30
40
50
60
70
80
90
100
110
120
130
140
Year ling 3 4 ≥5
Age c l a ss ( y e a r s)
Incr
ease
in s
kinf
old
thic
knes
s (m
m x
10)
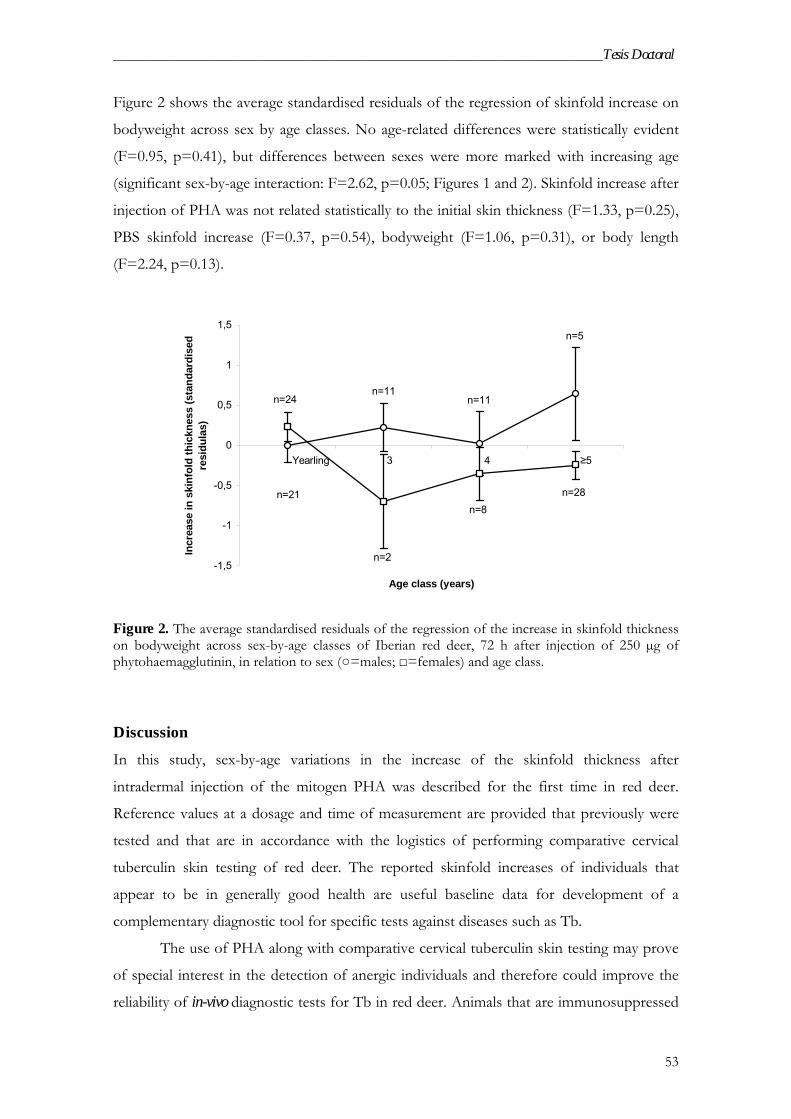
___________________________________________________________________Tesis Doctoral
53
Figure 2 shows the average standardised residuals of the regression of skinfold increase on
bodyweight across sex by age classes. No age-related differences were statistically evident
(F=0.95, p=0.41), but differences between sexes were more marked with increasing age
(significant sex-by-age interaction: F=2.62, p=0.05; Figures 1 and 2). Skinfold increase after
injection of PHA was not related statistically to the initial skin thickness (F=1.33, p=0.25),
PBS skinfold increase (F=0.37, p=0.54), bodyweight (F=1.06, p=0.31), or body length
(F=2.24, p=0.13).
n=5
n=11n=11
n=24
n=28n=8
n=2
n=21
-1,5
-1
-0,5
0
0,5
1
1,5
Yearling 3 4 ≥5
Age class (years)
Incr
ease
in s
kinf
old
thic
knes
s (s
tand
ardi
sed
resi
dula
s)
Figure 2. The average standardised residuals of the regression of the increase in skinfold thickness on bodyweight across sex-by-age classes of Iberian red deer, 72 h after injection of 250 µg of phytohaemagglutinin, in relation to sex (○=males; □=females) and age class.
Discussion
In this study, sex-by-age variations in the increase of the skinfold thickness after
intradermal injection of the mitogen PHA was described for the first time in red deer.
Reference values at a dosage and time of measurement are provided that previously were
tested and that are in accordance with the logistics of performing comparative cervical
tuberculin skin testing of red deer. The reported skinfold increases of individuals that
appear to be in generally good health are useful baseline data for development of a
complementary diagnostic tool for specific tests against diseases such as Tb.
The use of PHA along with comparative cervical tuberculin skin testing may prove
of special interest in the detection of anergic individuals and therefore could improve the
reliability of in-vivo diagnostic tests for Tb in red deer. Animals that are immunosuppressed

Capítulo 1______________________________________________________________________
54
and therefore non-responsive (or less responsive) to PHA (non specific response) may be
unable to also elicit a specific response to Tb antigens. This may encourage future research
as the volume of red deer translocated in Spain is high, and undiagnosed Tb can produce
uncontrollable spread of the disease to new areas (Vicente el al 2006).
Tuberculosis is an important disease in red deer both in Spain (Vicente et al 2007a)
as well as many other countries where red deer are farmed (de Lisle et al 2001). In Spain,
testing wild Iberian red deer from Tb endemic areas evidenced a correlation between the
skin test responses to PHA and to bovine tuberculin (the authors, unpublished data). Our
results suggest that the response to tuberculins could vary as the response to PHA does
according to the immunological status of the deer, and more research is needed on this
subject. Additionally, the PHA test could be useful in the future for monitoring the general
health of red deer populations, and for ecological studies of quantification of the immune
response. To the best of our knowledge, no adverse effects of PHA on mammals have
been reported, and in our experience there is no interaction between PHA and tuberculin
antigens during skin testing of deer.
Males had greater skinfold increases than females (after controlling for the effects
of weight, body size and skin thickness), thus when comparing the PHA test with reference
values it should take into account the effect of sex. Cellular immune responses may differ
between males and females in red deer because reproductive effort and reproductive
expectancies differ between sexes (Clutton-Brock et al 1982; Vicente et al 2007b).
Our study was conducted in February, at which time the males were recovering
after the strenuous rutting period (September-October), an energetically demanding time
(Johns et al 1984) even for animals in captivity. Therefore, they probably recently gained
immune function capacity. In the case of the females, they were gestating, which is also an
energetically costly period (Clutton-Brock et al 1982), which can be reflected in lower
activation of immune function as resources are allocated to reproduction. The fact that
gestation is especially costly in primiparous hinds (Landete-Castillejos et al 2004) could
explain the decrease evidenced in this group (Figure 2) and the significant sex-by-age
interaction, supporting the hypothesis that early reproduction investment in young hinds
which are still growing may negatively affect cell immune responses. These results are in
agreement with recent data on age by sex variation of spleen size (an indirect measure of
immune capacity, Corbin et al 2007) in wild Iberian red deer (Vicente et al 2007b). The
apparent absence of sex differences in non-reproductive individuals (calves) is also
consistent with this hypothesis. Nevertheless caution must be taken because of the low

___________________________________________________________________Tesis Doctoral
55
sample size. Future research is needed in order to determine seasonal differences in PHA
testing of red deer, which may vary across sexes.
We conclude remarking that sex and age should be taken into account when
measuring PHA skin test responsiveness in deer. Our findings also suggest that skinfold
increase relative to the thickness of skin rather than skinfold increase per se should be
considered a more appropriate measure of ‘true skinfold increase’. These facts could also
apply for the interpretation of skin reactions to injection of tuberculins. Future research
should focus on this issue, from immunological, biometrical and histopathological aspects.
Acknowledgements
Funding was provided for this project by Fondo Europeo de Desarrollo Regional, Instituto
de Investigación y Tecnología Agraria y Alimentaria (grant RTA03-074), and Ministerio de
Educación y Ciencia (grant AGL2005-07401), Madrid, Spain. This is also a contribution to
the agreements between University of Castilla – La Mancha (foundation) and Grupo
Santander – Fundación Marcelino Botín, Santander, Spain, and to the agreement between
Y. Fierro and the UCLM, Ciudad Real, Spain. We wish to thank the students and
colleagues at Instituto de Investigación en Recursos Cinegéticos for their help with the
laboratory and field work.
References
Clutton-Brock TH, Guinness FE, Albon SP. The breeding biology of hinds and The
evolutionary ecology of males and females. In: Red Deer: Behaviour and Ecology of Two
Sexes. Pp 51-74 and 286-7. University of Chicago Press, Chicago, USA, 1982
Clutton-Brock TH, Albon SP, Guinnes FE. Fitness cost of gestation and lactation in
wild mammals. Nature 337, 260-2, 1984
Corbin E, Vicente J, Martín-Hernando MP, Acevedo P, Pérez-Rodríguez L,
Gortázar C. Spleen mass as a measure of immune strength in mammals. Mammal
Review, in press
de Lisle GW, Mackintosh CG, Bengis RG. Mycobacterium bovis in free-living and captive
wildlife, including farmed deer. Revue Scientifique et Technique de L’ Office International Des
Épizooties 20, 86-111, 2001

Capítulo 1______________________________________________________________________
56
Ekkel ED, Kuypers AH, Counotte GHM, Tielen MJM. The phytohemagglutinin
(PHA) skin-test as an indicator of stress-induced changes in immune reactivity in pigs.
Veterinary Quarterly 17, 143-6, 1995
Fernández-de-Mera IG, Höfle U, Vicente J, García A, Rodríguez O, Gortázar C.
Optimal dose and timing in phytohaemagglutinin skin-testing of deer. New Zealand
Veterinary Journal 54, 357-9, 2006
Hernández A, Yager JA, Wilkie BN, Leslie KE, Mallard BA. Evaluation of bovine
cutaneous delayed-type hypersensitivity (DTH) to various test antigens and a mitogen
using several adjuvants. Veterinary Immunology and Immunopathology 104, 45-58, 2005
Hessing MJC, Coenen GJ, Vaiman M, Renard C. Individual differences in cell-
mediated and humoral immunity in pigs. Veterinary Immunology and Immunopathology 45,
97-113, 1995
Johns PE, Smith MH, Chesser RK. Annual cycles of the kidney fat index in a
southeastern white-tailed deer herd. Journal of Wildlife Management 48, 969-73, 1984
Kelley KW, Greenfield RE, Evermann JF, Parish SM, Perryman LE. Delayed-type
hypersensitivity, contact sensitivity, and phytohemagglutinin skin-test responses of
heat-stressed and cold-stressed calves. American Journal of Veterinary Research 43, 775-9,
1982
Landete-Castillejos T, Gortázar C, Vicente J, Fierro Y, García A, Gallego L. Age-
related foetal sex ratio bias in Iberian red deer (Cervus elaphus hispanicus): are male calves
too expensive for growing mothers? Behavioral Ecology and Sociobiology 56, 1-8, 2004
Smits JE, Bortolotti GR, Tella JL. Simplifying the phytohaemagglutinin skin-testing
technique in studies of avian immunocompetence. Functional Ecology 13, 567-72, 1999
Vicente J, Höfle U, Garrido JM, Fernández-de-Mera IG, Juste R, Barral M, Gortázar
C. Wild boar and red deer display high prevalences of tuberculosis-like lesions in Spain.
Veterinary Research 37, 107–19, 2006
Vicente J, Höfle U, Garrido JM, Fernández-de-Mera IG, Acevedo P, Juste R, Barral
M, Gortázar C. Risk factors associated with the prevalence of tuberculosis-like lesions
in fenced wild boar and red deer in south central Spain Source: Veterinary Research 38,
451-64, 2007a
Vicente J, Pérez-Rodríguez L, Gortázar C. Sex, age, spleen size, and kidney fat of red
deer relative to infection intensities of the lungworm Elaphostrongylus cervi.
Naturwissenschaften 94, 581-87, 2007b

___________________________________________________________________Tesis Doctoral
57
Waters WR, Palmer MV, Whipple DL, Slaughter RE, Jones SL. Immune responses of
white-tailed deer (Odocoileus virginianus) to Mycobacterium bovis BCG vaccination. Journal of
Wildlife Diseases 40, 66-78, 2004

___________________________________________________________________Tesis Doctoral
59
Inyección intradérmica de PPDb, PPDa y PHA en el ciervo ibérico: Factores que
afectan a la respuesta de la tuberculina
Resumen
La prueba de intradermorreacción con derivados purificados de proteínas micobacterianas
(PPDs) es hoy día el test estándar para el diagnóstico de tuberculosis en animales. Sin
embargo, no existen datos disponibles para el caso del ciervo en España, donde las
condiciones de manejo son muy variables, variando desde sistemas de granjas cinegéticas a
condiciones silvestres. La intradermorreacción con fitohemaglutinina (PHA) es una medida
in vivo de respuesta inmune celular que puede utilizarse combinándola con la tuberculina,
con el fin, por ejemplo, de identificar y descartar los individuos anérgicos. El objetivo de
este estudio es analizar el efecto del sistema de manejo sobre la capacidad de respuesta del
ciervo a la intradermorreacción con antígenos micobacterianos (PPD bovina y PPD aviar) y
no micobacterianos (PHA). Se observaron diferencias estadísticamente significativas en la
respuesta a la inyección intradérmica de PHA y PPDs entre los ciervos de granja y los
silvestres, mostrando los primeros un mayor incremento de pliegue cutáneo. También, e
independientemente de los resultados de la intradermorreacción, la respuesta a la PHA se
relacionó de forma positiva a la de las PPDs en los ciervos silvestres, pero no en los de
granja. Todo esto sugiere que la diferente condición física producida por un manejo
intensivo podría reflejarse en la capacidad de respuesta inmunológica. La presumible peor
alimentación en el caso de los ciervos silvestres podría hacer que la capacidad de respuesta
inmunitaria frente a los antígenos fuese más dependiente del estado inmunitario (como
podría reflejar el incremento de pliegue cutáneo tras la intradermorreacción con PHA).
Estos resultados proporcionan una información básica útil para contribuir en el diseño de
análisis de TB con una adecuada especificidad y sensibilidad en ciervos con diferentes
situaciones de manejo. La PHA ha demostrado ser un antígeno potencialmente útil como
control positivo en la prueba de la tuberculina en el ciervo, para establecer así los puntos de
corte sobre la respuesta inmunitaria en una determinada población sometida a unas
determinadas circunstancias, para detectar posibles individuos anérgicos y para interpretar
las reacciones no específicas a la PPD aviar. Además, la respuesta a la PHA podría ser una
medida de manejo útil para identificar “poblaciones de riesgo” con vistas a mejorar su
condición física y así la inmunocompetencia.


___________________________________________________________________Tesis Doctoral
61
Factors affecting red deer skin test responsiveness to bovine and avian tuberculin and to phytohaemagglutinin in Spain Fernández-de-Mera IG, Vicente J, Höfle U, Ruiz Fons F, Gortázar G
Abstract
Skin-testing with purified mycobacterial protein derived antigens (PPDs) is still the
standard test for tuberculosis in animals, but no data are available for red deer in Spain,
where management conditions are variable, ranging from farming to wild. The
phytohaemagglutinin (PHA) skin test is a measurement of in-vivo cellular immune
responses that can be used in combination with TB skin testing, for example in order to
identify and remove anergic individuals. The aim of this study is to test the effect of
management on the responsiveness of red deer to skin testing with mycobacterial (bPPD
and aPPD) and non-mycobacterial antigens (PHA). We evidenced a statistical different
immune response to PHA and PPD injections between captive and free-living deer, farmed
deer showing higher skinfold increases. Also, regardless of skin testing result, PHA
positively related to bPPD in wild conditions, but not in farms. We suggest that differences
in health condition promoted by intensive management could be reflected in
immunological responsiveness. The lower plane of nutrition expected for wild animals
could favour that immune response againts PPD was more dependent on immune status
(as PHA skinfold increase may reflect). This study provides useful baseline information to
help designing proper specificity and sensitivity studies of TB in red deer in different
management situations. PHA has proven to be a potential useful positive control antigen
for skin-testing in red deer to establish cut-off points for the immune reactivity in a given
population under given circumstances, to detect anergic reactors, and to interpret non-
specific reactions to PPDa. Also, intradermal reaction to PHA could be a useful
management tool for the identification of “risk populations” with view to the amelioration
of body condition and thus immunocompetence in these.
Key words: Cellular immunity, Cervus elaphus, paratuberculosis, phytohaemagglutinin, skin
test, tuberculosis.
Introduction
Deer farming is a growing activity in Spain. Most farms are devoted to producing red deer
(Cervus elaphus) for restocking rather than producing venison or velvet. Thus, increasing

Capítulo 1______________________________________________________________________
62
numbers of deer are released yearly from the farms to the field (usually to fenced estates)
for hunting purposes. In addition, over 10,000 wild deer are captured and translocated
between hunting estates yearly in Spain (Soriguer et al. 1998). In this context, testing of
deer prior to translocation in order to avoid sanitary risks becomes paramount.
Mycobacterial diseases, mainly bovine tuberculosis (bTB) caused by Mycobacterium
bovis and closely related mycobacteria of the Mycobacterium tuberculosis complex, and
paratuberculosis (PTB, Johne’s disease) caused by Mycobacterium avium subspecies
paratuberculosis, are among the most important health issues in deer farming (Riemann et al.
1979, Chiodini and Vankruiningen 1983, Cliftonhadley and Wilesmith 1991, Griffin and
Buchan 1994, Mackintosh et al. 2004). In Spain, bTB is highly prevalent among wild deer,
with 15% of red deer from southern Spain showing bTB compatible lesions at necropsy
(Vicente et al. 2006). The prevalence of paratuberculosis among Spanish deer is unknown,
but clinical cases have occasionally been reported in wild fallow deer (Dama dama) (Marco
et al. 2002, Álvarez et al. 2005) and in farmed red deer (the authors, unpublished data).
Skin-testing with purified mycobacterial protein derived antigens (PPDs) is still the
standard test for tuberculosis in man and domestic animals (OIE 2002). In farmed red
deer, studies carried out in New Zealand established 82-86% sensitivity and a 46-76%
specificity of the comparative skin test (Griffin et al. 1991, Corrin et al. 1993, Norden et al.
1996). No data are available for Spain, since TB testing of deer is not yet compulsory and
only sporadic information on post mortem analysis and recovery of mycobacteria by
culture of reactors and non-reactors is available (Vicente et al. 2003).
The phytohaemagglutinin (PHA) skin test is an inexpensive and easy measurement
of in-vivo cellular immune responses (Smits et al. 1999), that can be used in combination
with TB skin testing, for example in order to identify and remove anergic individuals
(Fernández-de-Mera et al. in press). PHA, a lectin from Phaseolus vulgaris, is a mitogen. The
skin test comprises injecting PHA intradermally and measuring the change in skin
thickness. The immune response is considered to be proportional to the difference in
swelling between the site injected with PHA and a control site injected with phosphate
buffered saline (PBS), or the increase in swelling before and after injection of PHA (Kelley
et al. 1982, Ekkel et al. 1995, Smits et al. 1999, Hernández et al. 2005). In previous studies,
we reported the optimal time and dose for studying the skinfold thickness increase in
response to the mitogen PHA in red deer, and showed that there was a significant effect of
sex but not of age on the increase in skinfold thickness; males tended to have greater

___________________________________________________________________Tesis Doctoral
63
increases than females after correcting for other confounding variables (Fernández-de-
Mera et al. 2006 and in press).
The aim of this study is to highlight the effect of management on the
responsiveness of red deer to skin testing with mycobacterial and non-mycobacterial
antigens. We used the PHA skin test to test the hypothesis that individuals of populations
of the same species under different management conditions (captive versus wild; different
farms) may have differing immune reactivity. We suggest that using PHA as a positive
control may help in the interpretation of between-farm differences in tuberculin responses.
Material and methods
Sample size, study sites and characteristics of the deer
Deer sampled in this study included 1.041 animals from 6 Spanish farms and 111 adult wild
deer captured by the National Parks Agency in south central Spain (calves have been
excluded from this sample).
Table 1. Deer sampled in this study (n = 1.041 animals from 6 Spanish farms, and n = 111 adult wild deer captured by the National Parks Agency in south central Spain). Farmed deer were sampled from 2002 to 2007 and wild deer from 2003 to 2005.
Site Type Sampling period Deer origin and management Information on mycobacterial diseases
1 Farm November 2005 Diverse geographic origin, including central Europe.
Two clinical PTB cases confirmed by culture and
PCR
2 Farm February 2004 Iberian red deer. Limited introductions from the wild.
One case of sublinical M. avium avium confirmed by
culture and PCR
3 Farm August 2005 Iberian red deer. Limited introductions from the wild.
M. bovis is tested yearly and reactors slaughtered.
No diagnosis.
4 Farm September 2002 August 2005
Iberian red deer. Limited introductions from the wild.
Two clinical M. bovis cases diagnosed by culture and PCR.
5 Farm September 2007 Diverse geographic origin, including central Europe. No information available.
6 Farm February 2005 Deer from Scotland introduced for venison production.
Two clinical M. avium avium cases diagnosed by
culture and PCR.
7 Wild June to September 2003 and 2005 Iberian red deer
TB-compatible lesions highly prevalent and several M. bovis cases
confirmed by culture and PCR (Vicente et al.
2006).

Capítulo 1______________________________________________________________________
64
Farmed deer were sampled from 2002 to 2007 and wild deer from 2003 to 2005
(Table 1). Deer farms have a semi-intensive management scheme, with pasture-rotation
and year-round food supplementation. These farmed deer are used to human presence and
are managed at least twice a year, including physical immobilisation for measurement,
sampling, and administration of antiparasitic drugs. In contrast, wild deer captured alive by
the National Parks Agency are usually handled only twice in their lives: the first time to take
them from the capture corral to the quarantine facility (in or close to the natural area), and
a second time when they are sold and translocated. No supplementary feeding takes place
in the areas managed by the National Parks Agency, and deer densities are estimated
between 10 and 30 deer per square kilometre.
Skin testing and sampling procedure
All deer were handled twice during the skin testing experiment, at time 0 h and time 72 h
(Table 2).
Table 2. Time sequence of handling of wild and farmed red deer hinds for tuberculin and PHA skin-testing.
Time since start of the experiment 0 h 0-72 h 72h
-Capture and physical restraint in a crash
-Weighing
-Identification: eartagging, ageing by tooth eruption and wear.
-Measurement of body length and thorax perimeter. Blood, fecal, and ectoparasite sampling.
-Shaving of four areas of 3x3 cm at the side of the neck.
-3 times repeat measurement of skinfold thickness at each injection site.
-Intradermal injection*
Maintenance of the animals in captivity:
-In paddocks (farm) or in the quarantine facilities (natural fenced areas).
-Daily observation.
-Food and water is provided ad libitum.
-Physical restraint in a crash.
-Identification: eartag number.
-Second blood, fecal, and ectoparasite sampling.
-3 times repeated measurement of skinfold thickness in each injection site.
-Release
*Intradermal injection of 0.1 ml avian PPD (Purified Protein Derivative, M. avium, Cooper-Zeltia, Spain), 0.1 ml bovine PPD (M. bovis, Cooper-Zeltia, Spain), 0.1 ml negative control Phosphate Buffered Saline solution (PBS) and 0.1 ml positive control phytohaemagglutinin (PHA, Sigma-Aldrich ref. L-8754 at 2.5 mg/ml, diluted in PBS).

___________________________________________________________________Tesis Doctoral
65
The deer were immobilised by physical restraint in a crash (hydraulic in the farm,
mechanic in the field). Each animal was blinded with a piece of cloth adapted to the
forehead with two elastic bands in order to reduce stress and handling risks. Time for
handling in the crash was less than 10 min. The detailed handling sequence and skin testing
procedures are summarized in Table 2. From each animal biometric data, ectoparasites,
faecal and blood samples were obtained. A deer with a skinfold increase ≥2mm to M. bovis
PPD and ≥ skinfold increase to M. avium PPD was considered positive bTB reactor
(Griffin et al. 1991, Corrin et al. 1993, Norden et al. 1996). All deer with a skinfold increase
to M. avium PPD 3 mm larger than the one to M. bovis PPD were considered positive M.
avium reactors (Kollias et al. 1982). Deer with skinfold increases of less than 0.5 mm to all 3
antigens were considered anergic animals.
Statistical Analysis
We used General Linear Models (GLM) to test the factors affecting PHA, bPPD and
aPPD skinfold increases as response variables, respectively. In the PHA model, we
included sex, management type (farm or wild), M. bovis skin testing (positive or negative as
aforementioned), and M. avium skin testing (positive or negative as aforementioned) as
factors. PBS, aPPD and bPPD skinfold increases were included as covariates, respectively.
For bPPD skinfold increase model, the model included sex and management type (farm or
wild), whereas PBS, aPPD and PHA skinfold increases were included as covariates,
respectively. M. avium skin testing (positive or negative as aforementioned) was considered
as factor. A similar model was built for aPPD as response variable, but interchanging aPPD
and bPPD skinfold as response variable and covariate, respectively. In this model, M. bovis
skin testing (positive or negative as aforementioned) was considered as factor. Spearman
rank order correlations were used to check for correlations between the reactions to
different antigens. We used the Chi square test to compare prevalences between groups.
We employed SPSS 10.0.6 program (SPSS Inc. 1999).
Results
Table 3 shows the mean values of skin tests according to site and sex, whereas Table 4
shows the mean values according to sex and management type, and Figure 1 displays the
mean values of skinfold increases against the antigens, PHA and PBS with the 95 %
confident interval non-outlier range. In 8 cases, reactions to all three agents were less than

Capítulo 1______________________________________________________________________
66
0.5 mm. Six out of these were wild deer (5.4%), and only 2 were farmed ones (<<1%;
Chi2=32.7, 1 d.f., p<0.001).
Table 3. Mean values of skin tests according to sampling site and sex (m: males, f: females).
bovis PPD avium PPD PHA
Site
Sex
n
Mea
n
SD
Ran
ge
+ve
re
at.
(n, %
)
Mea
n
SD
Ran
ge
+ve
re
at.
(n, %
)
Mea
n
SD
Ran
ge
1 m 0 f 48 8.8 7 0-26 0 36.2 18 10-79 17, 35.4 30.3 9 11-56 2 m 51 23.7 34 0-208 18, 35.3 26.7 32 0-167 6, 11.8 64.5 32 8-153 f 59 7.1 9 0-37 1, 1.7 15.5 16 0-71 4, 6.8 42.2 21 5-93 3 m 32 14.8 17 0-74 6, 18.7 23 19 0-63 3, 9.4 39 20 4-82 f 478 11.2 11 0-62 24, 5.0 22.8 15 0-78 25, 5.2 61.6 27 3-304 4 m 0 f 255 11.1 15 0-102 26, 10.2 17.9 17 0-91 23, 9.0 26.1 18 0-132 5 m 67 69.3 38 0-170 52, 77.6 37.5 35 0-148 7, 10.5 12.9 22 0-98 0 6 m 3 8 12 0-22 0 66.3 12 53-75 3, 100 47 11 39-59 f 48 5.5 11 0-56 1, 2.1 23.3 20 0-73 12, 25 43.3 20 0-85 7* m 58 16.2 26 0-89 16, 27.6 5.8 8 0-31 1, 1.7 25.1 18 0-77 f 53 6 11 0-51 5, 9.4 4.4 6 0-34 0 19.6 12 1-48 All m 153 41.7 41 0-208 77, 50.3 32 31 0-167 19, 12.4 37 33 0-153 farms f 888 10.7 12 0-102 52, 5.86 21.7 16 0-91 93, 10.5 47.1 28 0-304 Tot m 211 34.9 39 0-208 93, 44.1 25 29 0-167 20, 9.5 33.8 30 0-153 f 941 10.4 12 0-102 57, 6.1 20.8 16 0-91 96, 10.2 45.6 28 0-304 1152 14.7 22 0-208 150, 13 21.4 20 0-167 116, 10.1 43.2 29 0-304
*National Park Agency
Table 4. Mean values (± standard error) of skin tests according to management type (farmed versus wild) and sex (m: males, f: females).
bPPD aPPD PHA PBS
M F Tot M F Tot M F Tot M F Tot Farm (n=1041)
41.69 ±1.54
10.66 ±0.64
15.22 ±0.68
32.03 ±1.49
21.73 ±0.62
23.24 ±0.58
37.04 ±2.27
47.12 ±0.95
45.60 ±0.89
6.37 ±0.71
2.57 ±0.39
3.44 ±0.35
Wild (n=111)
17.20 ±2.50
6.27 ±2.62
11.98 ±2.07
6.48 ±2.42
4.54 ±2.58
5.57 ±1.79
25.36 ±3.68
19.63 ±3.89
22.65 ±2.69
0.70 ±1.03
1.50 ±1.09
1.08 ±0.76
Total (n=1152)
34.95 ±1.35
10.41 ±0.64
14.91 ±0.64
25.01 ±1.33
20.80 ±0.63
21.57 ±0.57
33.83 ±1.98
45.56 ±0.95
43.37 ±0.86
4.53 ±0.60
2.45 ±0.37
3.03 ±0.32

___________________________________________________________________Tesis Doctoral
67
aPPD PBS bPPD PHA
Granja Campo
Managem ent
-10
0
10
20
30
40
50
60
Ski
nfol
d in
crea
se (0
.1 m
m)
Figure 1. Mean increase of skinfold thickness after inoculation of bovis PPD, avium PPD, PHA and PBS in relation to management. 95 % confident interval non-outlier range is shown.
A total of 93 stags (44.1%) and 57 hinds (6.1%) were considered positive reactors
to bovine PPD. The difference in prevalence between sexes was significant (Chi2=220, 1
d.f., p<0.001). These positive bovine PPD reactors were identified in 5 of 6 farms and in
the wild deer. Prevalence among wild deer (18.9%) was not significantly higher than among
farmed deer (14.5%; Chi2=1.5, 1 d.f., p>0.05). One farm (site number 5), where only males
had been tested, yielded a 77.6% prevalence of positive bovine reactors. Twenty stags
(9.5%) and 96 hinds (10.2%) were considered positive reactors to avian PPD (Chi2=6.1, 1
d.f., p<0.05). Avian PPD reactors were found among all 7 study populations, but
prevalence was significantly lower among wild deer (<1%) than among farmed deer
(12.6%; Chi2=13.5, 1 d.f., p<0.001). Farm 1, a site with known clinical PTB cases, and farm
6, a site with known clinical avian TB cases, were the two sites with the highest percentage
of aPPD skin test reactors.
Results of the GLMs for bPPD, aPPD and PHA skinfold increases, respectively,
are shown in Table 5. Figure 2 shows mean least square values for bPPD, aPPD and PHA
skinfold increases after the GLMs. Concerning the model fitted for the skinfold increase to
bPPD, overall, the effects of management and sex were mediated by their interaction, so
Farm Wild

Capítulo 1______________________________________________________________________
68
that between-sex differences were evidenced only in farm conditions, whereas wild animals
presented similar response across sexes (Figure 2b).
Table 5. Test statistics of GLM for skinfold increase of PHA, bovis PPD and avium PPD, respectively.
PHA SS F Estimate p
Management 1738.6 3.90168 7.31 0.04 Sex 2254.2 5.05867 5.31 0.02 PBS 3418.3 7.67106 0.72 0.01 Management*Sex 1945.3 4.36539 2.96 0.04 Management*bPPD 1732.9 3.88868 -0.24 0.04
bPPD Management 11504.5 38.6662 10.17 <0.01 Sex 36666.6 123.2353 12.89 <0.01 aPPD 54966.0 184.7391 0.38 <0.01 PHA 1292.4 4.3438 0.12 0.04 Management*Sex 11236.5 37.7654 5.83 <0.01 Management*PHA 6906.2 23.2115 -0.27 <0.01 Sex*PHA 10610.6 35.6617 -0.14 <0.01
aPPD Management 3373.1 11.6605 5.57 <0.01 bPPD 53439.9 184.7391 0.37 <0.01 Sex 1498.0 5.1786 -2.74 0.02 Sex*PHA 2690.1 9.2997 0.07 <0.01
Skinfold increase to bPPD positively related to aPPD and PHA responses,
respectively. The relationship with PHA was more marked in females (rs=0.12, n=941,
p<0.001) than in males (significant sex by PHA skinfold increase interaction, rs=-0.19,
n=211, p<0.01). Also, there exists a statistically positive relationship between bPPD and
PHA responses in wild condition, but not in farms (Figure 3, significant management by
PHA skinfold increase interaction).
Results of the GLM for aPPD yielded that management statistically affected the
aPPD response since animals in farm condition presented higher values (Figure 2c). As
previously found, skinfold increase to aPPD positively related to bPPD. The relationship
with PHA was more marked in females (rs=0.14, n=941, p<0.001) than in males
(significant sex by PHA skinfold increase interaction, rs=0.13, n=211, p=0.05).
Finally, regarding the model on PHA response, sex (higher values in males) and
management (higher values under farm conditions) statistically related to the PHA skinfold
increase, although both effects were mediated by a significant sex by management

___________________________________________________________________Tesis Doctoral
69
interaction term. This interaction evidenced that between-sex differences existed only in
farm conditions, whereas wild animals presented similar response across sexes (Figure 2a).
Figure 2. Differences between wild and farmed red deer in the increase of skinfold thickness after inoculation of bovis PPD, avium PPD, and PHA in relation to sex. Values are shown as least square means, and therefore are corrected for other variables of the statistical models.
Management also interacted with the bPPD skinfold increase, and as
aforementioned, there was a statistically positive relationship between bPPD and PHA
responses in wild deer, but not in farms (Figure 2a, c). The skinfold increase to the
injection of the negative control positively related to PHA response. The farm with the
10
15
20
25
30
35
40
45
50
Farm Wild
PHA in
crea
se (l
east
squ
ared
mea Males
Females
0
5
10
15
20
2530
35
40
45
50
Farm Wild
bPPD
incr
ease
(lea
st s
quar
ed m
ea Males
Females
0
5
1015
20
25
30
3540
45
50
Farm Wild
aPPD
incr
ease
(lea
st s
quar
ed m
ea Males
Females
(a)
(b)
(c)

Capítulo 1______________________________________________________________________
70
highest proportion of bovine reactors (number 5) showed the lowest response to PHA
among all the study sites.
Figure 3. Relationship between skinfold thickness after inoculation of PHA and bovis PPD in relation to management (a: wild; b: farm)
Discussion
Different species of wild animals including ungulates such as the red deer have been
identified as reservoirs for bovine tuberculosis and are thought to be responsible for the
failure of eradication programs in cattle throughout Europe (Caffrey 1994, Hunter 1996).
Thus, especially in areas such as central Spain where ungulates are exploited as game
species in highly managed environments, tuberculosis skin-testing is becoming an
important tool for the management of bTb in these species (Lloydwebb et al. 1995, Griffin
et al. 2004, Cousins and Florisson 2005, Palmer et al. 2006).
However, deer skin testing is not yet compulsory throughout Spain, and
standardized procedures are urgently needed. This study provides useful baseline
information to help designing proper specificity and sensitivity studies. Data presented in
this paper belong to different farms and wildlife management situations and were collected
opportunistically in different seasons from 2002 to 2007. While the effect of age (less
0
100
200
0 50 100 150 200
PHA increase (0.1 mm)
bPPD
incr
ea
0
100
200
0 50 100 150 200
PHA increase ( 0.1 mm)
bPPD
incr
ea(a) Wild
(b) Farm

___________________________________________________________________Tesis Doctoral
71
relevant) and sex (more relevant) on (PHA) skin testing of deer is known (Fernández-de-
Mera et al. in press), no information is available on the effect of the season on skin testing.
Hence, results need to be interpreted with care as regards the skin test reactor prevalences
presented in this study. Nonetheless, the percentage of positive bPPD skin test reactors is
within prevalence figures given for TB-compatible lesions at necropsy in Spain (Vicente et
al. 2006). Only limited information exists on paratuberculosis in Spanish deer (Marco et al.
2002, Álvarez et al. 2005), and avian tuberculosis has been reported on very few occasions
from wild Spanish deer (the authors, unpublished data). Thus, the results of this study
suggest that PTB or avian TB may be widespread among Spanish deer farms, a fact that (if
confirmed) obliges to set up urgent preventive measures, since most farmed deer are
destined to restocking of hunting estates.
The most consistent result in the present study is that deer management (farmed
versus wild) was identified in all three models as a key factor affecting deer skinfold
thickness increase in response both to mycobacterial (bPD and aPPD) and non-
mycobacterial antigens (PHA). The differences occurred in the same sense, regardless of
some interactions, farmed deer showing higher values (Figures 1 and 2). These findings
may relate to two groups of factors. Firstly, differences in general health condition could be
reflected in immunological responsiveness. It is of general knowledge that different factors
such as nutritional condition and stress may affect immune capacity in mammals (Moller et
al. 1998, Coop and Kyriazakis, 1999, 2001, Lochmiller and Deeremberg 2000). For
example, wild birds (zebra finches) had lower PHA responses than their aviary-bred
counter-parts possibly because energetic costs limited a general resistance response
(Ewenson et al. 2001). Body condition is closely related to the T-cell mediated immune
response as measured by the PHA skin test in birds (e. g. Soler et al. 2003) which is
consistent with our findings in our mammalian model species (Fernández-de-Mera et al.
2006). This difference in immune reactivity may also reflect differences in
immunocompetence and in host resistance to diseases in general (Hawley et al. 2007).
Stress is also a strong immunsupressor and may alter cellular immune reaction, especially in
wild animals such as red deer when submitted to the stress of handling, thus rendering the
skin-testing less reliable (e. g. Tella et al. 2001). In this context a standardized positive
control would help to correct results of PPD-skin-testing for the immune capacitiy of a
particular population.
The second group of factors may relate to differences in the prevalence of
mycobacterial infections (or previous contact), and the subsequent effects on the skin
Capítulo 1______________________________________________________________________
72
responsiveness against PPDs. It is well known the use and sensitivity of PPD to
mycobacterial infections (e. g. Kollias et al. 1982). Also, one possibility is that mycobacterial
infections (or previous contact) could activate the immune system (especially the cell
mediated response) and therefore promote an increase in the responsiveness against
inespecific agents such as mitogen PHA. We did not evidence any effect of skin testing
positivity (neither M. avium nor M. bovis) on the PHA response, which suggests that
immune status (measured as PHA response) would determine the responsiveness against
PPDs than vice versa. Therefore, the statistical associations between responses to different
antigens (especially bPPD, and non-mycobacterial PHA) strongly support that skinfold
increase to response to mycobacterial antigen may be well affected by the immunological
status of the hosts.
Interestingly, we found that management interacted with the bPPD skinfold
increase so that there was a statistically positive relationship between bPPD and PHA
responses in wild conditions, but not in farms (Figure). This relationship, and particularly
in wild condition, is expected to occur if immune system function of the animals is limited
by resource availability (Hines et al. 2007). This is so because in the wild it is more difficult
for the immune system to reach such a good level that the variations in PHA response
would become not representative of real host immune availability. In the case of farm
conditions, on average, animals displayed a high PHA skinfold increase, which could
indicate a good condition of the immune system, and probably, a good body condition.
Therefore, we hypothesize that bPPD would be less determined by (or related to) the
immune system status once the animals are in a high plane of immune capacity.
Finally, a third group of factors underlying the differences between farm and wild
animals could relate to the red deer life-history (Vicente et al. 2007). It was very relevant
the effect of sex and its interactions in determining the responses to different antigens,
independently of the mycobacteria infection status. Particularly, we found, as previously
described by Fernández-de-Mera et al. (in press) that sex differences in skinfold increase of
the mitogen PHA between sexes were marked in farm conditions (in favour to males), but
not in the wild. As similar pattern for bPPD was found, and this supports the second
group of possible explanations. As suggested by Fernández-de-Mera et al. (in press) most
of the females were in gestation when sampling, an energetically costly period (Clutton-
Brock et al. 1984), which can be reflected in a lower activation of the immune function as
resources are allocated to reproduction. We speculate that males in farm condition
probably are less affected by resources shortage as males in the wild are during the

___________________________________________________________________Tesis Doctoral
73
strenuous period of rutting, which may relate to a good immunological status compared to
wild stags. Nevertheless we must be cautious because sample size in males was low and
future studies should account for seasonal effects.
PHA skinfold increase was not affected by the PPD skin test results. This suggests
that this measure is highly independent of the mycobacterial infection status of the animals,
and underlines its possible use as a positive control of general responsiveness to skin
testing. In humans, lack of skin induration to intradermal injection of PPD (PPD anergy) is
observed in a subset of patients with active tuberculosis (Delgado et al. 2002). In order to
detect anergic individuals, immunocompromised patients are screened not only with
tuberculin, but also with Candida and mumps antigen (Smirnoff et al. 1998). In domestic
animals, the existence of anergic individuals (false negatives in skin-testing) is one of the
major limits to the success of bTb erradication programs (Barlow et al. 1997), but to the
authors knowledge no alternative antigens are commonly used as controls. We used PHA
as a positive control, expecting to identify those animals that, being negative to both PPDs,
do also not respond to the non-mycobacterial antigen PHA. This use of PHA in
combination with comparative skin tests needs further research, but it is interesting to
observe that animals with no response to PHA nor to the PPD were detected, and that the
farm with the poorest PHA response is the one with the highest percentage of bPPD
reactors.
In this study, parameters for body condition, size and physiology were not assessed.
However, it may be expected that the ad-lib fed farmed deer were in better general
condition than wild deer captured in summer, during the dry season. The different immune
response to PHA and PPD injection between captive and free-living deer showed that the
two populations differed significantly in immune reaction to these antigens. This may have
implications for the interpretation of skin test results: “False-positive” reactions in
tuberculosis skin-testing are frequently observed in relation to infections with
environmental mycobacteria (Lloydwebb et al. 1995). But in addition to this source of false
positives, deer populations with a good response to the non specific PHA antigen may
have more false positive reactors to the mycobacterial PPDs, while undernourished or
otherwise immunocompromised deer may have more false negative skin-test reactors than
healthy deer populations.
In conclusion, the results of the present study prove that a positive control that
reflects the immune reactivity of the tested individual should be imperative in tuberculin
skin-testing in each species, even in domestic animals, as reactivity may vary between

Capítulo 1______________________________________________________________________
74
populations. It also underlines that skin-testing parameters standardized in domestic
animals should not be directly employed in wild animals even of the same species, as
handling stress or other factors may alter immune reactivity considerably. In this study
PHA has proven to be a useful positive control antigen for skin-testing in our model
species, the red deer, that allows a) to establish cut-off points for the immune reactivity in a
given population under given circumstances as needed, b) helps to detect anergic reactors
suffering from chronic tuberculosis and/or impaired immune function, and c) helps to
interprete non-specific reactions to PPDa that may result from exposure of wild animals to
unspecific nonpathogenic mycobacteria. Finally, the intradermal reaction to PHA could be
a useful management tool for the identification of “risk populations” with view to the
amelioration of body condition and thus immunocompetence in these.
Acknowledgements
This work was supported by projects “Control of Tuberculosis in Wildlife” of Grupo
Santander and Fundación Marcelino Botín (to C. G and J. F), CICYT – MEC research
grant AGL2005-07401, INIA – MEC research grant FAU2006-00017, and FEDER
(Spain). The authors thank, Óscar Rodríguez, Diego Villanúa, Pelayo Acevedo, Paqui
Talavera, Mª Paz Martín, Eloisa Chico, Vanesa Alzaga and many other students, likewise to
many gamekeepers and vets of the study sites for their assistance in the field.
References
Álvarez J, De Juan L, Briones V, Romero B, Aranaz A, Fernández-Garayzabal JF, Mateos.
2005. A Mycobacterium avium subspecies paratuberculosis in fallow deer and wild boar in
Spain. Veterinary Record 156: 212-213.
Barlow ND, Kean JM, Hickling G, 1997. A simulation model for the spread of bovine
tuberculosis within New Zealand cattle herds. Preventive Veterinary Medecine 32: 57-
75.
Caffrey JP. 1994. Status of bovine tuberculosis erradication programmes in Europe.
Veterinary Microbiology 40: 1-4.
Chiodini RJ, Vankruiningen HJ. 1983. Eastern white-tailed deer as a reservoir of ruminant
paratuberculosis. Journal of the American Veterinary Medical Association 182: 168-
169.

___________________________________________________________________Tesis Doctoral
75
Cliftonhadley RS, Wilesmith JW. 1991. Tuberculosis in Deer - A Review. Veterinary
Record 129: 5-12.
Clutton-Brock TH, Albon SP, Guinnes FE. 1984. Fitness cost of gestation and lactation in
wild mammals. Nature 337: 260-262.
Coop RL, Kyriazakis I. 1999. Nutrition-parasite interaction. Veterinary Parasitology 84:
187-204.
Coop RL, Kyriazakis I. 2001. Influence of host nutrition on the development and
consequences of nematode parasitism in ruminants. Trends in Parasitology 17: 325-
330.
Corrin KC, Carter CE, Kissling RC, de Lisle GW. 1993. An evaluation of the comparative
tuberculin skin test for detecting tuberculosis in farmed red deer. New Zealand
Veterinary Journal 41: 12-20.
Cousins DV, Florisson N. 2005. A review of tests available for use in the diagnosis of
tuberculosis in non-bovine species. Revue Scientifique et Technique-Office
International des Epizooties 24: 1039-1059
Delgado JC, Tsai EY, Thim S. 2002, Antigen-specific and persistent tuberculin anergy in a
cohort of pulmonary tuberculosis patients from rural Cambodia. Proceedings of the
National Academy of Science USA 99: 7576-7581.
Ekkel ED, Kuypers AH, Counotte GHM, Tielen MJM. 1995. The phytohemagglutinin
[PHA] skin-test as an indicator of stress-induced changes in immune reactivity in pigs.
Veterinary Quarterly 17: 143-146.
Ewenson EL, Zann RA, Flannery GR. 2001. Body condition and immune response in wild
zebra finches: Effects of capture, confinement and captive-rearing.
Naturwissenschaften 88: 391-394.
Fernández-de-Mera IG, Höfle U, Vicente J, García A, Rodríguez O and Gortázar C. 2006.
Optimal dose and timing in phytohaemagglutinin skin-testing of deer. New Zealand
Veterinary Journal 54: 357-359.
Fernández-de-Mera IG, Vicente J, Höfle U, Rodríguez O, Gaspar-López E, and Gortázar
C. 2007. The effects of sex and age on phytohaemagglutinin skin-testing of deer. New
Zealand Veterinary Journal. In press.
Griffin JFT, Nagai S, Buchan GS. 1991. Tuberculosis in domesticated red deer -
comparison of purified protein derivative and the specific protein MPB70 for invitro
diagnosis research. Veterinary Science 50: 279-285.

Capítulo 1______________________________________________________________________
76
Griffin JFT, Buchan GS. 1994. Etiology, pathogenesis and diagnosis of Mycobacterium-bovis
in deer. Veterinary Microbiology 40: 193-205.
Griffin JFT, Chinn DN, Rodgers CR. 2004. Diagnostic strategies and outcomes on three
New Zealand deer farms with severe outbreaks of bovine tuberculosis. Tuberculosis
84: 293-302.
Hawley, D.M., Jennelle, C.S., Sydenstricker, K.V., Dhondt, A.A. 2007. Pathogen resistance
and immunocompetence covary with social status in house finches (Carpodacus
mexicanus). Functional Ecology 21: 520-527
Hernández A, Yager JA, Wilkie BN, Leslie KE, Mallard BA. 2005. Evaluation of bovine
cutaneous delayed-type hypersensitivity (DTH) to various test antigens and a mitogen
using several adjuvants. Veterinary Immunology and Immunopathology 104: 45-58.
Hines AM, Ezenwa VO, Cross, P. 2007. Effects of supplemental feeding on
gastrointestinal parasite infection in elk (Cervus elaphus): Preliminary observations
Veterinary Parasitology 148: 350–355.
Hunter DL. 1996. Tuberculosis in free-ranging, semi-free-ranging and captive cervids.
Revue Scientifique et Technique de la Office Internationale des Epizooties 15: 171-181.
Kelley KW, Greenfield RE, Evermann JF, Parish SM, Perryman LE. 1982. Delayed-type
hypersensitivity, contact sensitivity, and phytohemagglutinin skin-test responses of
heat- and cold-stressed calves. American Journal of Veterinary Research 43: 775-779.
Kollias GV Jr, Thoen CO, Fowler ME. 1982. Evaluation of comparative cervical tuberculin
skin testing in cervids naturally exposed to mycobacteria. Journal of the American
Veterinary Medical Association 181: 1257-1262.
Lloydwebb EC, Campbell PH, Witt DJ. 1995. The specificity of the single cervical
intradermal tuberculosis test in a population of tasmanian fallow deer putatively free of
bovine tuberculosis preventive. Veterinary Medicine 21: 347-353.
Lochmiller RL, Deeremberg C. 2000. Trade-offs in evolutionary immunology: just what is
the cost of immunity? Oikos 88: 87-98.
Mackintosh CG, de Lisle GW, Collins DM, Griffin JFT. 2004. Mycobacterial diseases of
deer. New Zealand Veterinary Journal 52: 163-174.
Marco I, Ruiz M, Juste R, Garrido JM, Lavín S. 2002. Paratuberculosis in free-ranging
fallow deer in Spain. Journal of Wildlife Diseases 38: 629-632.
Moller AP, Christe P, Eritzoe J, Mavarez J. 1998. Condition, disease and immune defence.
Oikos 83: 301-306.

___________________________________________________________________Tesis Doctoral
77
Norden D. Essey, M. A., Meyer, R. 1996. Evaluation of tuberculin skin test in Cervidae.
CADIA Technical report 02-96. USDA, Animal and Plant Health Inspection Service,
Veterinary Services, Centers for Epidemiology and animal Health, Fort Collins, CO.
Office Internationale des Epizooties. 2002. Manual of standards Diagnostic Tests and
Vaccines. Part 2 Section 2.3 Chapter 2.3.3. World Organisation for Animal Health.
http://www.oie.int/
Palmer MV, Waters WR, Thacker TC, Stoffregen WC, Thomsen BV. 2006. Experimentally
induced infection of reindeer (Rangifer tarandus) with Mycobacterium bovis. Journal of
Veterinary Diagnostic Investigation 18: 52-60.
Riemann H, Zaman MR, Ruppanner R, Aalund O, Jorgensen JB, Worsaae H and Behymer
D. 1979. Paratuberculosis in cattle and free-living exotic deer. Journal of the American
Veterinary Medical Association 174: 841-843.
Smirnoff M, Patt C, Seckler B, Adler JJ. 1998, Tuberculin and anergy skin testing of
patients receiving long-term hemodialysis. Chest 113: 25-27.
Smits JE, Bortolotti GR, Tella JL. 1999. Simplifying the phytohaemagglutinin skin-testing
technique in studies of avian immunocompetence. Functional Ecology 13: 567-572.
Soler JJ, De Neve L, Perez-Contreras T, Soler M., Sorci G. 2003 Trade-off between
immunocompetence and growth in magpies: An experimental study. Proceedings of
the Royal Society of London - Biological Sciences 270: 241-248.
Soriguer RC, Márquez FJ, Pérez JM. 1998. Las translocaciones (introducciones y
reintroducciones) de especies cinegéticas y sus efectos medioambientales. Galemys, 10:
19-35.
Tella JL, Forero MG, Bertellotti M, Dona zar JA, Blanco G, Ceballos O. 2001 Offspring
body condition and immunocompetence are negatively affected by high breeding
densities in a colonial seabird: A multiscale approach. Proceedings of the Royal Society
- Biological Sciences (Series B) 268: 1455-1461.
Vicente J, Höfle U, Gortázar C. 2003. Análisis in vivo para el control sanitario de ciervos
(Cervus elaphus) en el Parque Nacional de Cabañeros, Lugar Nuevo y Selladores –
Contadero. Unpublished report to the Nacional Parks Agency, Madrid, Spain.
Vicente J, Höfle U, Garrido JM, Fernández-De-Mera IG, Juste R, Barral M, Gortázar C.
2006. Wild boar and red deer display high prevalences of tuberculosis-like lesions in
Spain. Veterinary Research 37: 1–11.

Capítulo 1______________________________________________________________________
78
Vicente J, Pérez-Rodríguez L, Gortázar C. 2007. Sex, age, spleen size and kidney fat of red
deer relative to infection intesnities of the lungworm Elaphostrongylus cervi.
Naturwissenschaften 94: 581-587.

Capítulo 2
Relación entre condición nutricional y capacidad de respuesta antiparasitaria
Excreción fecal de Elaphostrongylus cervi en relación con la suplementación experimental de alimento en el ciervo ibérico: ¿Afecta la condición
nutricional a la capacidad de respuesta antiparasitaria? “Faecal excretion of Elaphostrongylus cervi (Nematoda) in relation to
experimental supplemental feeding in red deer (Cervus elaphus): Does nutritional condition improve anti parasite response?”
Joaquín Vicente


___________________________________________________________________Tesis Doctoral
81
Excreción fecal de Elaphostrongylus cervi en relación con la suplementación
experimental de alimento en el ciervo ibérico: ¿Afecta la condición nutricional a la
capacidad de respuesta antiparasitaria?
Resumen
Los cambios ambientales en la disponibilidad de alimento pueden influir en la capacidad
del hospedador para responder frente a los parásitos (es decir, en su capacidad inmunitaria),
y por tanto, el nivel de infección podría ser un indicador fiable del estado de la población
en relación a la calidad del alimento disponible. En España, Elaphostrongylus cervi
(Nematoda) está ampliamente distribuido en el ciervo (Cervus elaphus), y un número de
estudios cada vez mayor sugiere que la excreción individual de este parásito se correlaciona
con la condición física del hospedador y con la historia natural de éste. Se utiliza un grupo
de ciervas a las que se somete durante 4 años a experimentación en cuanto a disponibilidad
de alimento, para evaluar así el efecto sobre la excreción de larvas 1 (L1) de E. cervi por
medio una monitorización con medidas no invasivas. Las condiciones ambientales de
ambos grupos experimentales (dos áreas valladas contiguas de 13.5 ha, bajo condiciones
ambientales mediterráneas, con 17 hembras de ciervo ibérico en cada una de ellas) fueron
similares en cuanto a hábitat y topografía (es decir, la disponibilidad de recursos
alimenticios naturales era similar). Los parámetros fisiológicos (longitud corporal, peso
corporal y hematología) y el nivel de excreción de parásitos al inicio del estudio no diferían
en ambos grupos. Durante el periodo de estudio se hicieron evidentes diferencias en la
excreción de parásitos de ambos grupos, de forma que las hembras sometidas a
suplementación de alimento mostraban unos niveles de excreción menores
estadísticamente significativos en los años 3 y 4. Principalmente, nuestros resultados
indican que la condición nutricional podría jugar un papel importante en la respuesta del
hospedador a la infección parasitaria, y las diferencias en la disponibilidad (suplementación)
de alimento entre ambos grupos podrían explicar por qué el grupo suplementado tiene una
excreción menor. Las modulaciones de la capacidad inmunitaria en respuesta a condiciones
nutricionales podrían tener un efecto significativo sobre la excreción larvaria de E. cervi, de
forma que el nivel de parasitación podría servir como indicador de la condición física de las
ciervas. La respuesta de E. cervi a la disponibilidad de alimentos, que en última instancia
depende de una base inmunológica, podría constituir una herramienta para la
monitorización no invasiva de las estrategias de gestión en poblaciones de ciervo.


___________________________________________________________________Tesis Doctoral
83
“Faecal excretion of Elaphostrongylus cervi (Nematoda) in relation to experimental
supplemental feeding in red deer (Cervus elaphus): Does nutritional condition
improve anti- parasite response?”
Fernández-De-Mera IG, Vicente J, Fierro Y, Gortázar C
Abstract
Environmental changes of food availability may have consequences in the host ability to
cope with parasites (i. e. immune capability), and therefore rates of infection maybe reliable
descriptors of population status in relation to forage quality. Elaphostrongylus cervi
(Nematoda) is wide spread in red deer (Cervus elaphus) in Spain, and an increasing body of
science suggests that individual excretion correlates with host life history and fitness traits
(body condition, immune status). We used a 4-years supplemental-feeding experiment in
red deer hinds to examine effects of food availability on the evolution of larval (L1) counts
of E. cervi by means of non-invasive monitoring. The environmental conditions of both
experimental groups (two 13.5 ha contiguous enclosures under Mediterranean conditions,
17 females in each) were similar in terms of habitat and topography (i.e. natural food
resource availability). Physiological parameters (body size, body weight and haematology)
and parasite excretion rates did not differ at the beginning of the study. Across the study
period, differences in E. cervi L1 excretion became evident, fed hinds showing statistically
lower rates in years 3 and 4. Overall, our results indicate that nutrition might have played a
role in host response to parasite infection, and the difference in available (supplemented)
food between groups could explain why the fed group had decreased parasite counts.
Adjustments in immune function in response to foraging conditions may have significant
effects on the larval output of E. cervi, and thus parasite rates would reflect fitness benefits
for fed hinds. The response of E. cervi to forage availability, which ultimately relies on an
immunological basis, may contribute to monitor management strategies for red deer.
Keywords: Elaphostrongylus cervi, red deer, supplemental feeding
Introduction
Parasites cause constant waste on the energetic resources of most free-living organisms by
significantly influencing their host’s behaviour, demography and evolution. (Minchella and

Capítulo 2______________________________________________________________________
84
Scott 1991; Sheldon and Verhulst 1996, Tompkins et al. 2002) Therefore, the ability of the
immune system to respond to any challenge is an important fitness-associated trait and it is
vital for defence against pathogens in vertebrates. On the other hand, from a management
perspective, parasitological indices can be useful as indicators of the population health
status (Citterio et al. 2004, Vicente et al. 2007a). In this sense, one of the main factors that
is expected to affect the host ability to cope with parasites is the environmental change of
food availability. This is so because host individual capacity to deal with parasites requires
metabolic resources, which in turn are highly dependent upon external resource availability.
The extent to which an individual partitions resources into immune defence and
other functions in relation to individual fitness has been the subject of much research and
debate in the last decade. Nevertheless, few “in situ” experimental studies have analysed
whether forage conditions, one of the ultimate factors, affect host-parasite relationship, and
in particular, in ungulate species (De Neve et al. 2007). Assessing the effects of
management on host–parasite interactions in wildlife remains as an important research
issue which would be very valuable to establish whether and how rates of infection become
reliable indicators of population status in relation to management and forage quality in
practical situations. Also, this approach specially applies for species in which disease
emergence or increased disease risk is also a frequent consequence of intensive
management and overabundance, such as many ungulates (Côté et al. 2004; Acevedo et al.
2006; Gortázar et al. 2006; Vicente et al. 2007b).
We selected a parasite system composed of Elaphostrongylus cervi Cameron 1931
(Nematoda: Metastrongyloidea) and the red deer (Cervus elaphus), the parasite endemically
persisting and wide spread in red deer populations from Spain. The development of novel
non-invasive survey methods of parasitological indices and the comparison of standard
samples among populations would be highly applicable for red deer in Mediterranean
habitats, where populations are locally overabundant, as a result of intensive game
management (Gortázar et al. 2006). Such management schemes mainly include
supplemental feeding, especially during critical summer periods (Vicente et al. 2007a). Also,
there exists an increasing and recent body of science which suggests that individual
excretion of E. cervi larvae correlates with red deer life history, fitness traits (such as body
condition and spleen size; Corbin et al. 2007; Vicente et al. 2007a) and management
strategies (in terms of food supplying, Vicente et al. 2007b), which would provide
consistent elements of discussion to understand underlying factors in a non-invasive
experimental design. The selected red deer population, where availability of resources in

___________________________________________________________________Tesis Doctoral
85
two experimental groups was initially similar, was manipulated to test whether parasite host
relationship was conditioned by supplemental feeding.
Concerning the selected parasite, previous research infections in cervids suggests
that host immune response is able to modulate the establishment and/or larval outputs of
extrapulmonary lungworms (Gaudernack et al. 1984; Corbin et al. 2007; Vicente et al.
2007a, b). In particular, E. cervi parasitizes the central nervous system and skeletal muscles
of red deer (Mason 1995; Lankester 2001). Red deer acquire infection by accidentally
ingesting gastropod intermediate host containing infective larvae. They are liberated in the
deer gut and mature during migration in the CNS (subarachnoid spaces), and subsequently
migrate into the fascia and connective tissue around skeletal muscles where they mature
and live in reproductive pairs and groups (Handeland et al. 2000). Presumably, adult
females lay eggs which by the haematogenous route, reach the lungs where they hatch as
first-stage larvae (L1). These travel up the bronchial tree, are swallowed, and dispersed in
the host faeces. In the environment, L1 penetrate the foot of terrestrial gastropods, where
they develop to the infective L3 (Rezac et al. 1994). Faecal examination of Protostrongylid
larvae extracted from faeces is a common method of diagnosis in wild ungulates (e. g.
Festa-Bianchet 1991; Arnett et al. 1993), and can provide a useful index of relative parasite
abundance (Todd et al. 1970; Mason 1989) and/or the resolution of host-parasite
interaction.
We used a 4-years supplemental-feeding experiment in red deer hinds to examine
effects of food availability on the evolution of larval (L1) counts of E. cervi by means of
non-invasive monitoring. As parasite resistance of individuals is expected to vary as body
resources do, we hypothesize that parasite abundance would become lower in the non
supplemented group as feeding advantages become evident in the fed group along the
study period.
Material and Methods
Study area and experimental design
The selected area was located in a hunting Estate in the province of Ciudad Real at the
Guadiana river valley (South Central Spain; 38º55’N; 0º36´E; 600-850 m above sea level,
see Figure 1). This Estate has largely been involved in ecological and sanitary studies of
Iberian red deer (Cervus elaphus hispanicus) for the last decade (more information can be seen
in Vicente et al. 2004; Vicente et al. 2005; Landete-Castillejos et al. 2004). The climate is

Capítulo 2______________________________________________________________________
86
Mediterranean, and therefore dry summer is a recurring phenomenon usually accompanied
by undernutrition in overabundant ungulate populations. Annual rainfall presents
considerable variation (300 to 700 mm), and during the study period was 397.4 mm (2003),
636.9 mm (2004), 226.9 mm (2005), 320.3 mm (2006). The rainfalls during April and May
were 154.9 mm (2004), 46.0 mm (2005), 76.2 mm (2006) and 208.7 mm (2007). We fenced
two contiguous areas (13.5 ha each, Figure 1) mainly composed by Quercus ilex and Cystus
ladanifer (in lower proportion Quercus coccifera, Rosmarinus oficínalis, Arbutus unedo, Lavandula
stoecha and Phillyrea angustifolia as predominant species) scrublands (3.2) and pastures (10.3
ha in each group). The design of the enclosures was assessed by a Digital model of land
uses so topographical conditions and orientation were similar. The study area had been
kept fenced to prevent from ungulate grazing for more than 10 years before the study
started.
Figure 1. Map of Ciudad Real province (South Central Spain) and detail (below) of the experimental area within the Estate.
PasturesWoodlands
Supplemented
Not supplemented

___________________________________________________________________Tesis Doctoral
87
In September 2003, 9 female red deer (2 calves and 7 hinds) were introduced in
each enclosure. The animals were kept during 3 day in quarantine before they were
definitively allocated in a given enclosure, during which individual biometry was performed,
and blood and faecal samples were taken to characterize individually parasitological and
physiological status. Mean parameters according to experimental group are shown in Table
1.
Table 1. Biometry, physiological parameters and E. cervi L1 mean faecal excretion in the individuals introduced in September 2003. Statistics of Mann-Whitney comparisons are shown in the right column. No significant differences between groups were evidenced for any parameter at the beginning of the experiment.
In November 2004, 9 female red deer hinds were randomly added to each group
since previous management was not possible. All the animals were free-living wild red deer
captured using permanent capture enclosures in Cabañeros National Park (50 km far) and
were immediately transported to the Estate facilities.
No supplementary feeding takes place in one of the group in the fenced area, these
animals only had the natural forage, whereas to the other group nutritional supplement rich
in protein was offered to them ad libitum.
Host sampling and laboratory analysis
We studied fortnightly periods comprised between April 2004 and May 2007, and
therefore, this time included 4 annual periods. We visited the experimental enclosures every
15 days to collect fresh fecal pellet groups (those with fresh mucus covering the pellets)
from 2 fixed transects within each enclosure. Small sized faecal group pellets coming from
calves were not collected. We avoided collecting samples in rainy days since E. cervi L1 may
Parameter Supplemented
(n = 9)
Not supplemented
(n = 9)
Mann-Whitney U
(p-value)
Live body weight (kg) 63.63 ± 5.20 65.06 ± 4.19 13.5 (0.96)
Body size (cm) 153.75 ± 6.09 157.16 ± 3.90 32 (0.99)
Total serum proteins (mg/dl)
8.45 ± 0.15 8.69 ± 0.17 21.5 (0.38)
Red blood cells (nº/Neubauer camera)
249.43 ± 12.31 235.71 ± 21.44 20.5 (0.34)
Packed red blood cells (%) 48.29 ± 1.98 46.00 ± 1.56 17.0 (0.45)
White blood cells (nº/Neubauer camera)
137.88 ± 16.42 135.00 ± 13.01 26.7 (0.82)
E. cervi L1 (nº/g) 117.99 ± 51.75 102.16 ± 43.67 27.2 (0.91)

Capítulo 2______________________________________________________________________
88
early migrate from faeces, thus the day of sampling varied slightly between months.
Sampling in the selected months of the year had the advantage of standardising seasonal
variation in parasite prevalence or intensity of excretion (Vicente et al. 2005). Sampling size
per experimental group and season is shown in Table 1.
Protostrongylid larvae were extracted in less than 24 h from 8-10 g of faces
collected using the Baermann beaker extraction method as described by Forrester and
Lankester (1997). Larvae were quantified in a Favatti counting chamber and expressed as
number of L1 per gram of faeces. Microscopic measurements were made with a calibrated
ocular micrometer and the larvae were identified to the genus level according to their
morphology and linear dimensions using the descriptions in Kutzer and Prosl (1975),
English et al. (1985), Demiaszkiewicz (1986), Rezac (1990), Mason (1995), Lankester
(2001), Vicente and Gortazar (2001). Results are expressed as number of L1 per gram of
faeces
Statistical analysis
We conducted analyses for the factors affecting parasite counts (faecal E. cervi L1
abundance) by means of a generalized linear model (Crawley 1993). The model included
individual faecal group E. cervi L1 counts (log-10 transformed) as a response variable. We
included the variables the type of group (control or not fed vs. experimental or food
supplemented) and year (from 2003 to 2007) as categorical explanatory factors. We
considered a Poisson error and an identity link function (Wilson and Grenfell 1997). We
controlled for overdispersion. The resulting saturated up to two interactions models was
reduced to their simplest form by eliminating in a backward stepwise manner any
explanatory variables or interactions that failed to explain significant variation in the
response. Non-parametric Mann-Whitney test were used to compare parasitic, biometry
and physiological parameters between experimental groups at the beginning of the
experiment. The level of significance was established at the 5 % level. Statistical parameters
and phenotypic traits in the text are expressed with SE..
Results
No significant differences between groups were evidenced for any parameter at the
beginning of the experiment (Table 1). Prevalence for the total sample was ± % (n = ) and
mean abundance was ± % E. cervi L1/g. Figure 2 displays prevalence and mean

___________________________________________________________________Tesis Doctoral
89
20
30
53
30
3257
31
20
0
50
100
150
200
250
2004 2005 2006 2007
Year
Mea
n E
. cer
vi a
bund
ance
(L1/
g)
Supplemented
Not supplemented
abundance according to experimental group through the study period. There were
statistical differences between groups (Wald = 9.33, p = 0.02) both groups showing an
increase of E. cervi L1 excretion up to 2006, and a marked decrease in 2007. Whereas the
experimental group itself was not statistically significant (Wald = 2.39, p = 0.12), we found
that the interaction between group and year was (Wald = 8.51, p = 0.03), so that the fed
group showed lower parasite excretion rates from 2006 onwards (Figure 2).
Figure 2. Evolution of the mean abundance of E. cervi L1 faecal excretion according to experimental group (intervals represent standard errors). Sampling size for not supplemented (above) and not supplemented (below) groups is shown.
Discussion
Only a few experimental studies have experimentally shown that artificial supplementation
of food reduces vulnerability to parasites. This research provides an example of how
environmental factors underlie host-parasite relationships. As we will discuss, the general
mechanism proposed for these relationships is an environment resource-dependent
immune system hypothesis, in which individuals with a higher availability of resources are
in better immunological status.
Numerous factors that can influence and/or mask host-parasite interactions. One
key point we must state is that our experimental design, regardless of the factor
“supplemental feeding”, allowed us controlling any environmental factor that could
differentially affect the excretion profile of E. cervi between experimental groups. Habitat,
topography, climate and host density were identical in both experimental contiguous areas.
Therefore, we can assume that our results reflect differences due to the factor

Capítulo 2______________________________________________________________________
90
“supplementary feeding”. Nonetheless, the main faw of our study design resides in the
absence of a second replica, so we can qualify our study as a pseudo-experimental
approach. From our point of view, even in the absence of a replica, our study resembled
“in situ” conditions and similar infection figures of naturally infected individuals, which is
exceptional in the literature. This is very valuable, since it provides a situation with direct
applications to practical management of red deer populations (Hines et al. 2007). In
addition to its practical value, our paper adds understanding to ecological aspects of the
host-parasite relationships and the immuno-epidemiology of wildlife populations.
Previous research in the study area has evidenced that at the individual level, E. cervi
L1 counts and body condition associates negatively (Vicente et al. 2007a, b), which is what
one would expect considering that individuals in prime body condition would invest more
(or more efficiently) in antiparasitic defences (Moller et al. 1998; Lochmiller and
Deeremberg 2000). In Mediterranean habitats from SCS (which is applicable to other
situation of ungulate management world-wide), high deer population densities are
maintained by artificially increasing the carrying capacity with supplemental feeding
(Vicente et al. 2007a). The consequence is that there is a disproportionally better condition
in animals from more intensively managed populations (more food provided), and a
subsequent improved resistance against E. cervi, or at least, reduced faecal larval excretion.
These findings support our environment resource-dependent immune system hypothesis,
in which individuals with a higher availability of resources are in better immunological
status.
It is well known that the nutritional status of the host can influence the rate of
acquisition of immunity to parasitic and other infections in man and many animal species,
including ruminants (e. g. Coop and Kyriazakis 1999; 2001). Low levels of dietary protein
have been associated with increased helminth faecal egg counts in both sheep and goats
(Theodoropoulos et al. 1998; Chartier et al. 2000), and low resource availability due to
climate drought also may increase faecal counts in wild ungulates (Ezenwa 2004). Host
nutrition (and subsequent improved body condition) can increase the ability of the host to
cope with the adverse consequences of parasitism, and also affects the development of the
host-immune response and the establishment and survival of parasite populations (Strain
and Stear 2001). The partitioning of available nutrients between immune responses and
other body functions could in part explain the immune unresponsiveness to E. cervi
infection and subsequent larval outputs since host immune response modulates the
establishment and fecundity of parasites (Gaudernack et al. 1984). Wild ungulates under

___________________________________________________________________Tesis Doctoral
91
drought conditions, like this seasonally prevalent in Mediterranean habitats, may be unable
to maintain adequate nutrition, and subsequently be less able to cope with parasite
infections Ezenwa 2004). Reduced nutrient intake, like proteins, and dietary deficiencies
may associate with declining resilience and resistance to infection. In our Mediterranean
environment, a limited availability of quality food in the non supplemented group along the
study period compared with the control group could relate to the exacerbated parasite
excretion rates in the latter. In fact, such densities of red deer in our study area may cause
to damages to the Mediterranean vegetation (the authors, personal observations).
Animals often face a trade-off between investment on anti-parasite defences and
other activities related to self-maintenance, survival and reproduction (Zuk and Stoehr
2002; Moller and Saino 2004). As food resources declined in the control group,
nutrient/protein deficient animals could have experienced a breakdown in immune
function (Coop and Kyriazakis 1999). For example, immune response against
gastrointestinal parasites in ruminants causes reductions in worm fecundity, resistance to
larval establishment and expulsion of adult nematodes (Balic et al. 2000; Claerebout and
Vercruysse 2000), and all three of these factors affect host faecal output. There is some
evidence that there is an interaction with nutrition such that animals in good condition can
afford to invest more in immunity and hence will have large spleens (Møller et al. 1998),
and this, particularly, has been suggested for red deer in relation to E. cervi infection
(Vicente et al. 2007a; Corbin et al. 2007). It also has been found that a positive relationship
between body condition and spleen size occurs in red deer (Vicente et al. 2007a). These
precedents indicate a greater investment in immune defence by animals of high body
condition since immune defence is costly to mount and maintain (Møller et al. 1998;
Lochmiller and Deeremberg 2000). Individuals in prime body condition would invest more
(or more efficiently) in antiparasite defences and parasite infection levels would be
determined by the immune system.). Therefore, E. cervi L1 outputs may reflect higher
investment in immunity by individuals in better condition as the relative cost (resource
mobilization relative to resource availability) for them is lower (Møller et al. 1998).
As alternative explanation to our results, control red deer may have been exposed
to more parasites if there was a higher density of infective intermediate hosts on the
enclosure, or if ingestion of intermediate hosts increased. These are unlikely explanations
of the results because both enclosures were contiguous and exposition to parasite
intermediate forms should be similar. In addition, after an initial infection, meningeal
worms are long lived parasites (with life-span similar to those of the hosts, Watson 1984),

Capítulo 2______________________________________________________________________
92
and parasite outputs during life is more dependent on the host-parasite relationship than
on the rate of parasite acquisition and reinfection.
We found inter-annual variation in E. cervi L1 abundance regardless of the
experimental group. This could relate to age-profile of infection as animals got older
through the study period. The majority of macroparasite systems show age-intensity curves
with an initial increase after the age at which an animal is first susceptible to infection
(Wilson et al. 2001). Mechanisms which may generate different age-infection profiles in the
hosts include parasite-induced mortality, age-dependent changes in exposure to parasites,
acquired immunity and age-related changes in predisposition to infection (Hudson and
Dobson 1995; Wilson et al. 2001). Epidemiological patterns suggestive of acquired
immunity have been found in red deer in our study area (Vicente et al. 2006), in the white
tailed deer against reinfection with Paralephastrongylus andersoni (Prestwood and Nettles 1977)
and Paralephastrongylus tenuis (Slomke et al. 1995), the reindeer/E. rangiferi system
(Gaudernack et al. 1984) and the caribou/E. rangiferi system (Ball et al. 2001). Also, inter-
annual variation may associate to climatic variations (Vicente et al. 2004), although this
seems unlikely as the annual precedent rainfall, and also the April to May rainfall patterns
during the study periods were different to mean annual parasite rates (see rainfalls in
Material and Methods section to compare with Figure 2).
Although host–parasite interactions are increasingly being considered in the
management of wildlife species (Gortazar et al. 2006), very little about the impact of
management on parasitism and infectious diseases in red deer is still known. In conclusion,
this research provided vital base line information for management of overabundant
populations of red deer through its distribution area. We based our research on a parasite
species for which an increasing body of science has been developed during recent years (e.
g. Corbin et al. 2007; Vicente et al. 2007 a, b, c), which allowed us discussing our non-
invasive study in terms of individual relationships of immune status, body condition and
parasite rates. Concerning the generalization of our results to other macroparasite
infections, the response to host densities, the mechanisms of host immune response
against different helminths to reduce their establishment, survivorship and fecundity are
similar in part (e. g. Paterson and Viney 2002; Maizels et al. 2004), which suggests that the
described pattern for E. cervi could present similarities to other low pathogenic helminths.
Nevertheless, the relative weight of exposition to parasite and reduced susceptibility due to
the effects of supplementary food may be different for parasites of direct transmission
which may be more favoured by host aggregation at feeders than those of indirect cycle.

___________________________________________________________________Tesis Doctoral
93
Hines et al. (2007) have reported that supplementally fed elk (Cervus elaphus nelsoni) had
significantly higher gastrointestinal nematode egg counts than unfed elk in January and
February, but significantly lower counts in April, which suggest that supplemental feeding
may both increase exposure and decrease susceptibility of elk to gastrointestinal nematodes,
resulting in differences in temporal patterns of egg shedding between fed and unfed elk.
Finally, we suggest that well-distributed parasitic species across the distribution range of
their hosts are good candidates to be used as parasitic indices of health condition (for
example, helminths are consistently present in wild ruminant populations worldwide and
have in general a subclinical impact). Their complementary use would improve our
understanding since multiple infection are the common feature in wildlife. The study of E.
cervi infection of red deer at population level and extended in time, together with other
ecological indicators, may contribute to monitor and develop management strategies. For
this purpose, it is critical understanding how environmental and density dependent factors
underlie host-parasite relationships.
Acknowledgments
This study was supported by the agreement between Yolanda Fierro and UCLM. We are
very grateful to the gamekeepers of “La Morera Estate”. Several students (Ricardo
Carrasco, Julio de La Calle, Maria Eugenia Sánchez, Juan Balbín) helped during field and
laboratory work.
Ethical statement
This study has been supported by Castilla-La Mancha Government and complies with the
Spanish and Castilla-La Mancha laws of animal experimentation.
References
Acevedo P, Escudero MA, Munoz R, Gortázar C. 2006. Factors affecting wild boar
abundance across an environmental gradient in Spain. Acta Theriologica 51: 327-336.
Arnett EB, Irby LR, Cook JG. 1993. Sex- and age-specific lungworm infection in Rocky
Mountain bighorn sheep during winter. Journal Wildlife Disease 29:90-93.
Balic A, Bowles V, Meeusen E. 2000. The immunobiology of gastrointestinal nematode
infections in ruminants. Advances in. Parasitology 45: 182–241.

Capítulo 2______________________________________________________________________
94
Ball MC, Lankester, MW, Mahoney SP. 2001. Factors affecting the distribution and
transmission of Elaphostrongylus rangiferi (Protostrongylidae) in caribou (Rangifer tarandus
caribou) of Newfoundland, Canada. Canadian Journal of Zoology 79:1265-1277.
Chartier C, Etter E, Hoste H, Pors I, Mallereau MP, Broqua C, Mallet S, Koch C, Masse A.
2000. Effects of the initial level of milk production and of the dietary protein intake on
the course of natural nematode infection in dairy goats. Veterinary Parasitology 92: 1-
13.
Citterio CV, Milani F, Tarantola M, Guastella F, Sartorelli P, Lanfranchi P. 2004.
Monitoring macroparasites in wild ruminant populations: Utility and limitations.
Parasitologgia 46: 270-272.
Claerebout E, Vercruysse J. 2000. The immune response and evaluation of acquired
immunity against gastrointestinal nematodes in cattle. A review. Parasitology 120: S25–
S42.
Coop RL, Kyriazakis I. 1999. Nutrition-parasite interaction. Veterinary Parasitology 84:
187-204.
Coop RL, Kyriazakis I. 2001. Influence of host nutrition on the development and
consequences of nematode parasitism in ruminants. Trends In Parasitology 17: 325-
330.
Corbin E, Vicente J, Martín-Hernando MP, Acevedo P, Pérez-Rodríguez L, Gortázar C.
2007. Spleen mass as a measure of immune strenght in mammals. Mammal Review, in
press.
Côté SD, Rooney TP, Tremblay JP, Dussault C, Waller DM. 2004. Ecological Impacts Of
Deer Overabundance. Annual Review of Ecology, Evolution, and Systematics 35: 113-
147.
Crawley MJ. 1993. GLIM for Ecologists. Blackwell. London, Reino Unido.
De Neve L, Soler JJ, Ruiz-Rodríguez M, Martín-Gálvez D, Pérez-Contreras T, Soler M.
2007. Habitat-specific effects of a food supplementation experiment on
immunocompetence in Eurasian Magpie (Pica pica) nestlings. Ibis, in press (doi:
10.1111/j.1474-919x.2007.00708.x)
Demiaszkiewicz A. 1986. Laboratory diagnosis of Protostrongylid infection in Cervidae.
Medycyna Weterynaryjna 41: 660–663.
English AW, Watt CF, Corrigall W. 1985. Larvae of Elaphostrongylus cervi in the red deer of
Scotland. Veterinary Record 116: 254–256.

___________________________________________________________________Tesis Doctoral
95
Ezenwa VO. 2004. Interactions among host diet, nutritional status and gastrointestinal
parasite infection in wild bovids. International Journal For Parasitology 34: 535-542.
Festa-Bianchet M. 1991. Numbers of lungworm larvae in feces of bighorn sheep: yearly
changes, influence of host sex, and effects on host survival. Canadian Journal of
Zoolofy 69: 547-554.
Forrester SG, Lankester MW. 1997. Extracting Protostrongylid nematode from ungulate
faeces. Journal of Wildlife Diseases 33:511–516.
Gaudernack G, Halvorsen O, Skorping A Stokkan KA. 1984. Humoral immunity and
output of first-stage larvae of Elaphostrongylus rangiferi (Nematoda, Metastrongyloidea) by
infected reindeer. Journal of Helminthology 58:13-18.
Gortázar C, Acevedo P, Ruiz-Fons F, Vicente J. 2006. Disease risks and overabundance of
game species. European Journal Of Wildlife Research 52: 81-87.
Handeland K, Gibbons LM, Skorping A. 2000. Aspects of the life cycle and pathogenesis
of Elaphostrongylus cervi in red deer. Journal of Parasitology 86: 1061-1066.
Hines AM, Ezenwa VO, Cross P. 2007. Effects of supplemental feeding on gastrointestinal
parasite infection in elk (Cervus elaphus): Preliminary observations. Veterinary
Parasitology 148: 350–355.
Hudson PJ, Dobson AP. 1995. Macroparasites: Observed patterns. En Grenfell BT y
Dobson AP (Eds). Ecology of Infectious Diseases in Natural Populations. pp. 144-176.
University Press Cambridge. Cambridge, UK.
Kutzer E, Prosl H. 1975. Zur Kenntnis von Elaphostrongylus cervi Cameron 1931. 1.
Morphologie und diagnose. Wiener Tierarztliche Monatsschrift 62: 258–266.
Landete-Castillejos T, Gortázar C, Vicente J, Fierro Y, García A, Gallego L. 2004. Age-
related foetal sex ratio bias in iberian red deer (Cervus elaphus hispanicus): are male calves
too expensive for growing mothers? Behavoiural Ecolology and Sociobiology 56: 1-8.
Lankester MW. 2001. Extrapulmonary lungworms of cervids In: Samuel WM, Pybus MJ,
Kocan AA (eds) Parasitic Diseases of Wild Mammals, pp 228-278. Iowa State
University Press. Iowa, USA.
Lochmiller RL, Deeremberg C. 2000. Trade-offs in evolutionary immunology: just what is
the cost of immunity? Oikos 88: 87-98.
Maizels RM, Balic A, Gómez-Escobar N, Nair M, Taylor MD, Allen JE. 2004. Helminth
parasites: Masters of regulation. Immunology Reviews 201: 89-116.
Mason P. 1989. Elaphostrongylus cervi. A review. Surveillance 16: 3–10.

Capítulo 2______________________________________________________________________
96
Mason P. 1995. Elaphostrongylus cervi and its close relatives: a review of protostrongylids
(Nematoda: Metastrongyloidea) with spiny-tailed larvae. Surveillance 22: 19–24.
Minchella DJ, Scott ME. 1991. Parasitism - a cryptic determinant of animal community
structure. Trends in Ecology & Evolution 6: 250-254.
Moller AP, Christe P, Eritzoe J, Mavarez J. 1998. Condition, disease and immune defence
Oikos 83:301-306.
Moller AP, Saino N. 2004. Immune response and survival. Oikos 104: 299-304.
Paterson S, Viney ME. 2002. Host immune response are necessary for density dependence
in nematode infections. Parasitology 125: 283-292.
Prestwood AK, Nettles VF. 1977. Repeated low-level infection of white-tailed deer with
Parelaphostrongylus andersoni. Journal of Parasitology 63: 974-978.
Rezac P. 1990. Diferenciální larev 1. Stadia hlístic Varestrongylus sagittatus a Elaphostrongylus
cervi. Veterinárstvi 40: 311-313.
Rezac P, Palkovic L, Holasova E, Busta J. 1994. Modes of entry of the first-stage larvae of
Elaphostrongylus cervi (Nematoda: Protostrongylidae) into pulmonate snails Arianta
arbustorum and Helix pomatia. Folia Parasitol 41: 209–214.
Sheldon BC, Verhulst S. 1996. Ecological immunology: Costly parasite defences and trade-
offs in evolutionary ecology. Trends In Ecology & Evolution 11: 317-321.
Slomke AM, Lankester MW, Peterson WJ. 1995. Infrapopulation dynamics of
Paralephastrongylus tenuis in white-tailed deer. Journal of Wildlife Diseases 31: 125-135.
Strain SAJ, Stear MJ. 2001. The influence of protein supplementation on the immune
response to Haemonchus contortus. Parasite Immunology 23: 527-531.
Theodoropoulos G, Koutsotolis K, Nikolaou E, Kalogiannis D, Petrakos G. 1998.
Seasonal variation of gastrointestinal nematodes of sheep in the region of Joannina,
Greece. International Journal For Parasitology 28: 1287-1292.
Todd KS, Levine ND, Andersen FL. 1970. An evaluation of the Baermann technic using
infective larvae of Haemonchus contortus. Proceedings of The Helminthological Society of
Washington 37: 57–63.
Tompkins DM, Dobson AP, Arneberg P, Begon ME, Cattadori IM, Greenman JV,
Heesetrbeek JAP, Hudson PJ, Newborn D, Rizzoli P, Rosa AP, Rosso R, Wilson K.
2002. Ecology of wildlife diseases. Ed by Hudson PJ et al. Oxford University Press.
Oxford, UK.
Vicente J, Gortázar C. 2001. High prevalence of large spiny-tailed protostrongylid larvae in
Iberian red deer. Veterinary Parasitology 96: 165-170.

___________________________________________________________________Tesis Doctoral
97
Vicente J, Fierro Y, Martínez M, Gortázar C. 2004. Long term epidemiology, effect on
body condition and interspecific interactions of concomitant infection by
nasopharyngeal bot fly larvae (Cephenemyia auribarbis and Pharyngomyia picta, Oestridae) in
a population of Iberian red deer (Cervus elaphus hispanicus). Parasitology 129: 349-361.
Vicente J, Fierro Y, Gortázar C. 2005. Seasonal dynamics of the faecal excretion of
Elaphostrongylus cervi (Nematoda, Metastrongyloidea) first stage larvae in Iberian red deer
from South Spain. Parasitology Research 95: 60-64.
Vicente J, Fernández de Mera IG, Gortázar C. 2006. Epidemiology and risk factors analysis
of elaphostrongylosis in red deer (Cervus elaphus) from Spain. Parasitology Research 98:
107-109.
Vicente J, Pérez-Rodríguez L, Gortázar C. 2007a. Sex, age, spleen size and kidney fat of red
deer relative to infection intesnities of the lungworm Elaphostrongylus cervi.
Naturwissenschaften. 94: 581-587.
Vicente J, Höfle U, Fernández-De-Mera IG, Gortázar C. 2007b. The importance of
parasite life history and host density in predicting the impact of infections in red deer.
Oecologia 152: 655-664.
Vicente J, Höfle U, Garrido JM, Fernández-de-Mera IG, Acevedo P, Juste R, Barral M,
Gortázar C. 2007c. Risk factors associated with the prevalence of tuberculosis-like
lesions in fenced wild boar and red deer in south central Spain. Veterinary Research 38:
451-464.
Watson TG. 1984. Tissue worm in red deer. Symptoms and control. In: AgLink Farm
Production and Practice 249. Ministry of Agriculture and Food New Zealand.
Wellington, New Zealand.
Wilson K, Bjornstad ON, Dobson AP, Merler S, Poglayen G, Randolph SE, Read AF,
Skorping A. 2001. Heterogeneities in macroparasite infections: patterns and processes.
In: Hudson PJ, Rizzoli A, Grenfell BT, Heesterbeek H, Dobson AP (eds) The Ecology
of Wildlife Diseases. Oxford University Press. Oxford, UK.
Wilson K, Grenfell BT. 1997. Generalized linear modelling for parasitologists. Parasitology
Today 13: 33-38.
Zuk M, Stoehr AM. 2002. Immune defence and host life history. American Naturalist 160:
9-22.

Capítulo 3
El factor genético: Polimorfismo del MHC II en ciervo ibérico
Polimorfismo del MHC II en una población aislada de ciervo ibérico (Cervus elaphus hispanicus)
“Major histocompatibility complex class II polymorphism in a hunter-managed isolated Iberian red deer
(Cervus elaphus hispanicus) population”
Relación del complejo mayor de histocompatibilidad de la clase II con infecciones y algunos indicadores de condición en el ciervo ibérico
“Major histocompatibility complex class II polymorphism in relation to infections and life history traits
of management relevance in Iberian red deer”


___________________________________________________________________Tesis Doctoral
101
Polimorfismo del MHC II en una población aislada de ciervo ibérico
Resumen
El complejo mayor de histocompatibilidad (MHC) contiene los genes funcionales más
variables descritos en vertebrados. Los individuos de poblaciones silvestres tienen
constantemente que tratar con una gama diversa de patógenos y el polimorfismo de los loci
del MHC es lo que determina la diversidad de los antígenos extraños que puede reconocer
el sistema inmunitario del hospedador. El polimorfismo en determinados loci podría
conllevar a haplotipos variables del MHC clase II. Así, en poblaciones naturales, existe una
asociación entre la variación genética de los loci del MHC y las características de la historia
natural de la población. En este trabajo se caracteriza por primera vez la diversidad alélica
del segundo exón de la cadena DRB-2 del MHC clase II en ciervo ibérico (Cervus elaphus
hispanicus). La población analizada fue muestreada en una finca vallada del centro sur de
España, sometida a manejos con fines cinegéticos, y podría proporcionar información del
efecto de las medidas de gestión cinegética sobre la diversidad genética de esta especie.
Los ciervos presentaron altos niveles de variación en el MHC II DRB-2 con 18
alelos diferentes detectados en los 94 individuos analizados. Sin embargo, el 92.5% de los
individuos de esta población aislada pero en régimen de cría en libertad eran homocigotos
para DRB-2. La proporción de heterocigotos era estadísticamente diferente entre sexos. El
índice de diversidad anual de los alelos del MHC II DRB-2 disminuyó significativamente a
lo largo de los 16 años del período del estudio. Se analizó también la diversidad genética de
tres microsatélites (como marcadores neutros) para diferenciar así los efectos selectivos y
los poblacionales en el MHC II de estos animales. La heterocigosidad esperada fue mayor
de 0.5 en los tres microsatélites y todos ellos se encontraban en equilibrio de Hardy-
Weinberg.
Se cree que el aporte artificial de alimento y la dispersión limitada por el vallado de
la finca podrían dar lugar a una endogamia localizada y a una subdivisión de la población.
Estos resultados apoyan la importancia de estudios inmunogenéticos para determinar
medidas de manejo, especialmente en poblaciones aisladas de ungulados.


___________________________________________________________________Tesis Doctoral
103
“Major histocompatibility complex class II polymorphism in a hunter-managed isolated Iberian red deer (Cervus elaphus hispanicus) population” Fernández-de-Mera IG, Vicente J, Pérez de la Lastra JM, Mangold AJ, Naranjo V, Fierro Y, de la Fuente J, Gortázar C BMC Ecology. En evaluación
Abstract
Background
The major histocompatibility complex (MHC) contains the most variable functional genes
described in vertebrates. Individuals from natural populations deal constantly with a diverse
range of pathogens and the polymorphism at MHC loci is what determines the diversity of
foreign antigens that the host immune system can recognize. Polymorphism at individual
loci may result in variable MHC class II haplotypes. Associations between genetic variation
at MHC loci and life history traits of individuals in natural populations exists. We
characterized for the first time the allelic diversity at the second exon of the b (DRB-2)
chain of the MHC class II locus in the Iberian red deer (Cervus elaphus hispanicus). The
studied population was sampled from a fenced estate in south-central Spain that has been
managed for hunting purposes and may provide information of the effect of game
management on the genetic diversity of this species.
Results
Deer presented high levels of variation at MHC class II DRB-2 with 18 different alleles
detected in 94 individuals analyzed. However, 92.5% of the individuals in this isolated but
free breeding population were homozygous for DRB-2. The proportion of heterozygotes
statistically differed between sexes. The annual diversity index of MHC class II DRB-2
alleles significantly decreased along the 16 year study period. Genetic diversity at three
microsatellite loci (as neutral markers) was analyzed to separate selective and demographic
influences on the MHC class II in this population. Expected heterozygosity was higher
than 0.5 in the three microsatellite loci, and all were in Hardy-Weinberg equilibrium.
Conclusions
We hypothesize that artificial food provisioning and constrained dispersal due to fencing
could result in localized inbreeding and sub-structured populations. These findings support
the importance of immunogenetic studies to assess management decisions, especially in
isolated ungulate populations.

Capítulo 3______________________________________________________________________
104
Background
The major histocompatibility complex (MHC) is a multigene family of the vertebrate
immune system comprised of highly polymorphic loci (Klein 1986). The primary role of
the MHC is to recognize foreign proteins, present them to specialist immune cells and
initiate an immune response. MHC genes encode cell surface glycoproteins which bind and
present antigenic peptides to T cells. The MHC class I (MHCI) genes are expressed on the
surface of all nucleated somatic cells and play an essential role in the immune defence
against intracellular pathogens by presenting endogenously derived peptides to CD8+
cytotoxic T cells (Klein and Horejsi 1987). MHC class II (MHCII) genes are expressed on
antigen-presenting cells of the immune system and present processed exogenous antigens
to CD4+ T helper cells.
The MHC contains the most variable functional genes described in vertebrates
(Piertney and Oliver 2006). The extensive polymorphism and unusual persistence of alleles
at the MHC loci suggests the action of balancing selection, i.e. natural selection works to
maintain genetic polymorphism at these loci. Individuals from natural populations deal
constantly with a diverse range of pathogens and the polymorphism at MHC loci is what
determines the diversity of foreign antigens that the host immune system can recognize to
subsequently trigger a specific immune response. Polymorphism at individual loci may
result in variable MHCII haplotypes. Recent studies of wild vertebrates suggest further that
specific MHCII genotypes confer resistance to a variety of pathogens (Hedrick et al. 2001).
In addition to the MHC function in immune response, a large number of studies have
reported associations between genetic variation at MHC loci and life history traits (Finch
and Rose 1995; Lochmiller 1996; Von Schantz et al. 1996) and behaviour (Penn and Potts
1999) of individuals in natural populations. Therefore, the study of MHC polymorphism
has become relevant in ecology and conservation.
Wildlife management for hunting has diverse impacts on the ecology and genetics
of vertebrates. It may cause a loss of genetic variation and may lead to short-term reduction
of fitness components (Keller and Waller 2002; Altizer et al. 2003). Selective harvests in
particular, including trophy hunting, can have important implications for sustainable
wildlife management if they target heritable traits. This has been shown in bighorn sheep
(Ovis canadensis), where declines in mean breeding values for weight and horn size occurred
in response to unrestricted trophy hunting (Coltman et al. 2003).
The Iberian red deer (Cervus elaphus hispanicus) is a subspecies of red deer inhabiting
the Iberian Peninsula. Many red deer populations from South Central Spain have been

___________________________________________________________________Tesis Doctoral
105
managed during the last decades for hunting purposes. Interventions have included
fencing, isolation and subsequent disruption of the interconnectivity among populations,
along with supplementary feeding and selective hunting. In spite of the current high
densities of this game species, such management schemes have probably affected its
genetic diversity leading to increased population genetic clustering and to reduced effective
population sizes (Slate et al. 2000; Martínez et al. 2002; Zachos et al. 2007). Therefore
humans might be selecting unknowingly for rapid changes in the relationships between
Iberian red deer and its pathogens (Altizer et al. 2003). In this context, it is important to
investigate the genetic diversity of genes that can mediate disease resistance since a
reduction in the degree of variation in such genes may have a particularly adverse effect on
population viability and conservation.
Here we characterize the polymorphism at the second exon of the b (DRB-2) chain
of MHCII in hunter-harvested Iberian red deer from an isolated fenced population in
south-central Spain. This red deer population has been managed for hunting purposes and
may provide information on the effect of management schemes on the genetic structure
and diversity of this species.
Results
The SSCP and sequence analyses revealed 18 unique DRB-2 sequences among 94 Iberian
red deer from a single hunter-managed population in south-central Spain (Fig. 1, Table 1).
DRB-2 sequences were confirmed by sequencing the same allele from different individuals
and by sequencing several clones from the same PCR. Furthermore, some SSCP
conformations were corroborated by F-SSCP analysis of both strands using labeled
forward and reverse primers (Fig. 2).
Figure 1. Amino acid sequence alignment of 18 Iberian red deer DRB-2 alleles. The standard one-letter amino acid code was used. Numbering of amino acid positions was based on white-tailed deer OdviDRB sequences (Van Den Bussche et al. 1999). Asterisks denote amino acids identical to CeelHap1. Variable amino acid positions are indicated with a cross (+).
9++ + +++ + ++ + ++ + + ++ ++ + ++ + 91 CeelHap1 EYAKSECHFSNGTQRVQFLQRYFYNGEEYVRFDSDWGEFRAVTELGRPDAKYWNSQKEILEQKRAEVDRYCRHNYGVIESFTV CeelHap2 ****************R**H********F*******************V*E**************A**T************** CeelHap3 **H*R***********G**D********T*********Y************L**********A**A**T********F***** CeelHap4 *HL**************Y*D********F*********************************N******************** CeelHap5 ****************G**D********F*********Y******************************************** CeelHap6 **H*************G**D********F*********Y************L*********RA**A**T************** CeelHap7 **Y*R***********G**D***S****T*********Y***********EL**********A*****T********F***** CeelHap8 **H*G***********G**D******************Y************F*********RA*****T************** CeelHap9 *HL*************RY*E********F*********************************N******************** CeelHap10 **H*************GY*E**IH****F*********Y**********************R***D**T********F***** CeelHap11 **H*************G**E********F*********Y**********************R******T********F***** CeelHap12 **P*************R**D********F*********Y******************************************** CeelHap13 **L************GG**E********F************************************D***************** CeelHap14 **V*************R********R***********************************DN**A**T************** CeelHap15 *******************H**I**R***A*******************************RA*****TV************* CeelHap16 ****************R**D********F*********Y******************************************** CeelHap17 ****************R**D*********************************************A**T************** CeelHap18 *******************D*****************************************R******T**************

Capítulo 3______________________________________________________________________
106
Table 1. Allelic frequencies (2n=188) and haplotype frequencies (n= 94 individuals) for the 18 alleles found.
Figure 2. F-SSCP peak profiles of Iberian red deer DRB-2 alleles.
Forward and reverse strands for selected heterozygous and homozygous individuals.
However, although F-SSCP was useful to corroborate homozygous and
heterozygous genotypes it was not suitable for distinguishing between different allelic
variants.
Allele Frequency Percent Haplotype Frequency Percent
5 35 18.62 5-6 17 18.09 4 28 14.36 4-4 12 12.77 6 27 14.36 6-6 12 12.77 2 20 10.64 2-2 10 10.64 7 15 7.98 7-7 7 7.45 1 12 6.38 1-1 6 6.38 3 11 5.85 3-3 5 5.32 17 10 5.32 17-17 5 5.32 8 6 3.19 8-8 3 3.19 12 4 2.13 12-12 2 2.13 16 4 2.13 16-16 2 2.13 18 4 2.13 18-18 2 2.13 11 3 1.60 10-10 1 1.06 14 3 1.60 11-11 1 1.06 10 2 1.06 13-13 1 1.06 13 2 1.06 14-14 1 1.06 9 1 0.53 3-6 1 1.06 15 1 0.53 4-5 1 1.06 4-6 1 1.06 4-9 1 1.06 4-11 1 1.06 6-15 1 1.06 7-14 1 1.06
Total 188 Total 94
Forward strand Reverse strand
Heterozygous B12-24 sample (CeelHap3 & CeelHap6)
Homozygous C3-27 sample (CeelHap3)
A

___________________________________________________________________Tesis Doctoral
107
The analysis of the DRB-2 locus found polymorphic MHCII loci in Iberian red
deer. Seventeen percent of nucleotide and 25% of amino acid positions were polymorphic
among the 18 alleles identified. Nonsynonymous substitutions occurred at a significantly
lower frequency than synonymous substitutions (dN=0.0453±0.0250; dS=0.0761±0.0361;
P<0.0001).
Figure 3. Allelic frequency of Iberian red deer MHCII DRB-2 loci. Observed frequency of CeelHap alleles (2n = 188).
Allelic frequencies for the 18 unique Iberian red deer alleles ranged from 0.5 % to
18.6 % (Table 1, Fig. 3). Except for alleles CeelHap9 and CeelHap15, which only appeared
once as heterozygotes, the rest of the alleles appeared at least once as homozygotes (Table
1, Fig. 4). Overall, 23 different genotypes out of the possible 170 were found within the 94
sampled individuals, ranging in frequency from 1.1 to 18.1 % (Table 1, Figure 4).
Figure 4. Allelic frequency of Iberian red deer MHCII DRB-2 loci. Observed versus expected counts of different genotypes for the MHC-II DRB-2 locus in Iberian red deer (n = 94). Only genotypes for which at least one individual was found are shown.
35
28 27
20
15
12 11 10
64 4 4 3 3 2 2 1 1
0
5
10
15
20
25
30
35
5 4 6 2 7 1 3 17 8 12 16 18 11 14 10 13 9 15Allele
Alle
le c
ount
DRB-2 allele (CeelHap)
17
1312
10
76
5 5
32 2 2
1 1 1 1 1 1 1 1 1 1 1
32 2
1 1 0 0 0 0 0 0 0
6
2
4
0 0 0 0 0 0 0 00
2
4
6
8
10
12
14
16
18
5-5
4-4
6-6
2-2
7-7
1-1
3-3
17-17
8-8
12-12
16-16
18-18
4-5
3-6
4-6
4-9
10-10
4-11
11-11
13-13
7-14
14-14
6-15
Haplotypes for MCH-II DRB-2 locus
Hap
loty
pe c
ount
Observed
Expected
DR
B-2
alle
le c
ount
DRB-2 genotypes

Capítulo 3______________________________________________________________________
108
The proportion of genotypes that were found in this deer population differed
statistically from expected H-W proportions (Chi2 = 1248.3, d. f. = 153, P<0.001). This
disequilibrium was mainly due to homozygous genotypes being observed at much higher
proportion than expected (Fig. 4). Observed heterozygosity was 7.5 % (7/94), whereas
expected heterozygosity was 89.1 %. Four genotypes out of the 23 genotypes found which
appeared as homozygotes represented 55% of the 94 individuals analyzed: CeelHap2 (n =
10, 10.6 %), CeelHap4 (n = 12, 12.8 %), CeelHap5 (n = 17, 18.1 %) and CeelHap6 (n = 12,
12.8 %). The F-SSCP analysis of individuals introduced and hunted before 1991 revealed
that only one of the six samples analyzed was heterozygous for the DRB-2 locus (Fig. 5).
Figure 5. F-SSCP peak profiles of Iberian red deer DRB-2 alleles. Forward strand for samples derived from individuals introduced and hunted before 1992.
This proportion of heterozygotes did not differ from that found in animals sampled
after 1991 (Chi2 = 0.65, d. f. = 1, P = 0.41). All the heterozygotes were males (7 out of 61,
11.5 %), whereas no heterozygotes were evidenced among females.
Homozygous jaw C11-35 sample
Heterozygous jaw C7-31 sample
Homozygous jaw C9-33 sample
Homozygous jaw C8-32 sample
Homozygous jaw C12-36 sample
Homozygous jaw C10-34 sample

___________________________________________________________________Tesis Doctoral
109
Figure 6. Annual diversity index of MCHII DRB-2 alleles. Annual diversity for the 18 unique Iberian red deer alleles found according to individual year of birth across the study period.
The proportion of heterozygotes statistically differed between sexes (Fisher exact
test, P = 0.04). The annual diversity index of MCHII DRB-2 alleles significantly decreased
along the study period (2-tailed Spearman correlation, RS = -0.62, P < 0.01, n = 17 from
1989 onwards; Fig. 6).
Table 2. Allelic frequencies (2n=188) for the alleles found according to individual year of birth across the study period. Year 1988 includes animals born prior to population founding.
Hapl. 1988
1989
1990
1991
1992
1993
1994
1995
1996
1997
1998
1999
2000
2001
2002
2003
2004
2005
1 2 0 2 0 0 0 0 0 0 2 0 0 0 0 0 2 4 0 2 0 0 0 0 0 0 2 0 0 0 0 0 4 2 2 2 4 4 3 2 0 0 0 2 1 0 4 0 0 0 2 0 0 0 0 0 0 4 4 0 2 2 0 0 0 0 3 0 2 1 4 2 2 0 2 4 5 2 2 0 0 2 0 2 4 1 0 4 2 0 4 6 0 2 4 6 0 1 0 0 4 3 0 2 0 4 0 1 2 0 0 6 4 0 7 2 0 0 2 0 0 0 2 0 2 0 0 0 0 2 2 1 2 8 0 0 0 0 0 0 0 2 0 0 0 0 0 2 0 0 2 0 9 0 0 0 0 0 0 0 0 0 0 0 0 0 0 0 0 1 0 10 0 0 0 0 0 0 0 0 0 0 0 0 0 2 0 0 0 0 11 0 0 0 0 0 0 0 0 0 0 0 0 2 0 0 0 1 0 12 0 0 2 0 0 2 0 0 0 0 0 0 0 0 0 0 0 0 13 0 0 0 0 0 0 0 0 0 0 0 0 0 0 0 2 0 0 14 0 0 0 0 0 0 0 0 0 0 0 0 2 0 0 0 1 0 15 0 1 0 0 0 0 0 0 0 0 0 0 0 0 0 0 0 0 16 0 0 0 0 2 0 2 0 0 0 0 0 0 0 0 0 0 0 17 2 0 0 0 2 0 0 0 4 2 0 0 0 0 0 0 0 0 18 0 0 0 0 0 0 2 0 2 0 0 0 0 0 0 0 0 0
14
22
12121214
6
6
1010148
6
12
46
4y = -0.014x + 0.55
0.0
0.1
0.2
0.3
0.4
0.5
0.6
0.7
0.8
1989
1990
1991
1992
1993
1994
1995
1996
1997
1998
1999
2000
2001
2002
2003
2004
2005
Alle
le d
iver
sity
(Nº d
iffer
ent a
llele
s/nº
sam
pled
indi
vidu
als)

Capítulo 3______________________________________________________________________
110
Nonetheless, no temporal patterns were identified for any single allele, especially
when attending to the more frequent ones (Table 2). Phylogenetic analysis of Iberian red
deer DRB-2 alleles together with other cervid sequences revealed monophyletic
relationships for moose (AlalDRB) alleles (Fig. 7). Although some of the Iberian red deer
alleles (CeelHap) tend to cluster together (CeelHap4, 5, 9, 12, 13, 16), CeelHap alleles were
paraphyletic with respect to white-tailed deer (OdviDRB) and red deer (CeelDRB) sequences
(Fig. 7). OdviDRB13
OdviDRB17
OdviDRB03
OdviDRB15
OdviDRB04
OdviDRB14
OdviDRB01
OdviDRB09
OdviDRB12
OdviDRB18
OdviDRB08
OdviDRB05
OdviDRB10
AlalDRB1
AlalDRB6
AlalDRB8
AlalDRB2
AlalDRB5
AlalDRB10
AlalDRB7
AlalDRB4
AlalDRB9
AlalDRB3
CeelDRB39U
CeelDRB37U
CeelDRB48U
CeelDRB21U
CeelDRB32U
CeelDRB30U
CeelDRB28U
CeelDRB29U
CeelDRB27U
CeelDRB24U
CeelDRB23U
CeelDRB10U
CeelHap14
CeelDRB20U
CeelHap15
CeelDRB19U
CeelDRB44U
CeelDRB43U
CeelDRB42U
CeelHap17
CeelDRB13U
CeelHap2
CeelDRB17U
CeelDRB16U
CeelDRB33U
CeelDRB14U
CeelDRB36U
CeelDRB9U1
CeelDRB25U
CeelHap18
CeelDRB40U
CeelHap1
CeelHap5
CeelHap16
CeelHap12
CeelHap4
CeelHap9
CeelHap13
CeelHap11
CeelDRB35U
CeelDRB15U
CeelHap10
CeelDRB3
CeelHap7
CeelHap6
CeelHap8
CeelDRB49U
CeelDRB41U
CeelDRB47U
CeelDRB08U
CeelDRB05U
CeelDRB07U
CeelDRB06U
CeelDRB03U
CeelDRB02U
CeelDRB04U
CeelDRB01U
CeelDRB26U
CeelDRB34U
CeelDRB46U
CeelDRB31U
OdviDRB11
OdviDRB16
OdviDRB02
OdviDRB07
OdviDRB06
CeelDRB38U
CeelDRB18U
CeelDRB12U
CeelDRB11U
CeelDRB45U
CeelDQB3
CeelDQB10
CeelDQB1
CeelDQB2
CeelDQB9
CeelDQB8
CeelDQB6
CeelDQB4
99
82
38
46
51
99
54
99
97
88
86
98
6841
99
92
96
80
92
80
97
62
89
81
78
74
68
61
94
4598
81
91
56
75
83
40
40
68
55
77
49
73
75
42
49
83
65
44
75
12
20
86
61
45
2743
51
31
25
30
46
27
21
20
5
16
9
17
9
20
14
4
24
4
0
23
1
0
4
3
0
6
36
0
0
10
4
4742
0
0
3
0
0
21
0
0
0
0.02
CeelHap3
Figure 7. Unrooted neighbor-joining tree of cervid DRB-2 alleles. DNA sequences of DRB-2 alleles from Iberian red deer (CeelHap; Cervus elaphus hispanicus), red deer (CeelDRB; Cervus elaphus), white-tailed deer (OdviDRB; Odocoileus virginianus), and moose (AlalDRB; Alces alces) were included in the analysis.

___________________________________________________________________Tesis Doctoral
111
Genetic diversity at three microsatellite loci was analyzed as genetic reference of
neutral markers to separate selective and demographic influences on the MHCII in this
population (Table 3). Expected heterozygosity (HO) was higher than 0.5 in all three
microsatellite loci (Table 3). Microsatellite loci CSSM22, ETH225 and CSSM19 were in H-
W equilibrium at the α = 0.01 level with a sequential Bonferroni correction (P<0.003).
Table 3. Charactetization of the microsatellite loci used in this study. Genotyping was performed on 96 deer DNA samples as described by Frantz et al. (2006). Abbreviations: A, number of alleles, HE, expected heterozygosity; HO, observed heterozygosity. The test for Hardy-Weinberg equilibrium was performed at each locus at the α = 0.01 level with a sequential Bonferroni correction (P<0.003).
Micro.
Dye
Primer sequences 5’-3’
Allele size
range (bp)
A
HE
HO
H-W equilibrium
CSSM22 6-Fam
F: TCTCTCTAATGGAGTTGGTTTTTG
R: GTTTCTTATATCCCACTGAGGATAAGAATTC213-227 4 0,52 0,50 Yes
ETH225 6-Fam
F: ACATGACAGCCAGCTGCTACT
R: GTTTCTTGATCACCTTGCCACTATTTCCT 140-173 12 0,85 0,90 Yes
CSSM19 Hex
F: TTGTCAGCAACTTCTTGTATCTTT
R: GTTTCTTTGTTTTAAGCCACCCAATTATTTG 140-166 10 0,81 0,79 Yes
Discussion
An isolated population of Iberian red deer managed for hunting purposes in south-central
Spain was selected to evaluate the effect of hunting management schemes on the genetic
diversity of this species. This deer population has been studied by our group over the last
16 years and the population dynamics are well known (Landete-Castillejos et al. 2004;
Vicente et al. 2005). The MHCII DRB-2 locus was selected for genetic analysis because it
composes part of the functional important peptide binding groove, which has been shown
to be the most polymorphic part in MHCII genes (Klein 1986) and its polymorphisms have
been related to variation in parasite burdens in deer (Ditchkoff et al. 2005).
The high levels of allelic diversity found within the studied Iberian red deer
population were similar to that found in red deer (Swarbrick et al. 1995) and white-tailed
deer (Van Den Bussche et al. 1999). In contrast, the DRB-2 genetic diversity reported in
moose and reindeer is greatly reduced (Mikko and Andersson 1995; Mikko et al. 1999;
Wilson et al. 2003), possibly due to reduced parasite exposure in boreal ecosystems and/or
bottlenecks (Mikko and Andersson 1995; Ellegren et al. 1996; Mainguy et al. 2007.

Capítulo 3______________________________________________________________________
112
The number and distribution of polymorphisms within the Iberian red deer DRB-2
amino acid sequence was similar to that detected in white-tailed deer and red deer alleles
(Swarbrick et al. 1995; Van Den Bussche et al. 1999). This fact denotes a strong selection
pressure on certain amino acids within the DRB-2 sequence. However, in contrast to
reports in other deer species (Swarbrick et al. 1995; Van Den Bussche et al. 1999), DRB-2
alleles were not under positive Darwinian selection in the Iberian red deer population
analyzed herein. Positive Darwinian selection involves a selective pressure favouring
change so that only a small number of mutational events are retained in a population, the
retention of mutations being much closer to the rate of mutation. In our sample,
synonymous substitutions occurred more frequently than non-synonymous substitutions,
suggesting that positive selection is not acting on the selected protein sequence.
It has been suggested that the high level of MHC allelic diversity is primarily
maintained by pathogen-driven positive Darwinian selection and may be the underlying
reason for MHC-based mating preferences, a mechanism that evolved to avoid inbreeding
(Van Den Bussche et al. 1999; Potts et al. 1991; Hedrick 1992; Paterson et al. 1998;
Carrington et al. 1999; Lohm et al. 2002; Wegner et al. 2003; Harf and Sommer 2005;
Schad et al. 2005). However, the DRB-2 genotype composition of the Iberian red deer in
this study cannot be explained by positive Darwinian selection, leaving other factors acting
as selection pressures on these individuals. Possible factors are discussed below.
As in the Iberian red deer population studied herein, white-tailed deer (Ditchkoff et
al. 2005), Canadian moose (Wilson et al. 2003) and African buffalo (Wenink et al. 1998)
populations have been reported to comprise DRB genotypes in H-W disequilibrium with
homozygous individuals at higher frequency than expected. Selective advantage of
heterozygotes over homozygotes would not explain the extreme deficiency of
heterozygotes (Penn et al. 2002).
With our observational data we can only guess which management factors may
have caused the strong homozygosity of this particular deer population. Founder effects in
the form of the introduction of highly homozygous deer is suggested by the 1991 data, only
one of six analyzed founders being heterozygous for DRB-2. Given that the recent samples
are also highly homozygous; factors that negatively affect genetic pooling (mixing) in this
population may still exist.
One possible hypothesis predicts low observed heterozygosity because of pooling
of discrete subpopulations with different allele frequencies that do not interbreed as a
single randomly mating unit, even if the subpopulations are in Hardy-Weinberg

___________________________________________________________________Tesis Doctoral
113
equilibrium, i.e. a Wahlund effect (Excoffier 2001). This effect has been suggested in
populations of white-tailed deer (Kollars et al. 2004; Van Den Bussche et al. 2002) and
moose (Wilson et al. 2003). In the case of the Iberian red deer analyzed in the present
study, the underlying causes of population subdivision would be not geographic but
behavioural barriers to gene flow, which may be followed by some degree of genetic drift
in the subpopulations. Those hypothetical behavioural barriers could be explained by
factors such as female philopatry and constrained natal dispersal in young males, which can
result in clustering of related individuals, inbreeding and structuring of nuclear genotypes
across continuous space (Nussey et al. 2005). Some management factors could promote
clustering of breeding in our study deer population. It has been shown that the spatial
aggregation of resources (such as the fixed feeding places in this estate) induces the
aggregation of females (at least during the period of the day they forage), and therefore
males defend territories instead of mobile harems of females (Sánchez-Prieto et al. 2004;
Carranza et al. 1990). This in turn may lead to an increase of the level of polygyny and a
decrease in the effective population size. However, we would expect a higher proportion of
heterozygous individuals than we found if dominant stags mate with a large number of
females during the rut season regardless of their degree of relatedness, resulting in
dissimilar MHC mating rather than positive non-assortative mating. In contrast, our results
would be explained if (i) dominant stags predominantly mate with related hinds (i.e. a,
positive non-assortative mating hypothesis) or (ii) non dominant stags mate more often
than expected and almost exclusively with related females.
We first consider the positive non-assortative mating hypothesis. Any deviation
from H-W equilibrium may indicate assortative mating, which may be positive (increases
homozygosity, which is our case) or negative (increases heterozygosity). The latter is
commonly found in vertebrates and it is accepted that it occurs because inbreeding
avoidance and choice of mating partner are interconnected processes. Although some
semi-wild ruminant populations seem to mate randomly, despite the presence of pathogen-
induced selection on MHC genes (Paterson and Pemberton 1997; Holand et al. 2007), no
evidence for positive non-assortative mating has been previously observed. Therefore,
although inbreeding avoidance through mating choice seems not to occur in our study
population, positive non-assortative mating may be more a consequence than a cause of
the observed MHC patterns, and other underlying factors may be responsible.
We now consider the second non exclusive possibility (the non-dispersing spiker
hypothesis). Red deer populations are structured by matrilineal clans with adult males

Capítulo 3______________________________________________________________________
114
segregating most of the year (Clutton-Brock et al. 1982). Female red deer are philopatric,
which means that offspring, mothers, sisters and aunts remain near their dams for life. At
finer spatial scales, female philopatry can result in clustering of related individuals and
structuring of nuclear genotypes across continuous space (Kurt et al. 1993; Nussey et al.
2005). Male dispersal from matrilineal clans is suggested as a means to reduce the chance of
inbreeding; the inclusive fitness of mothers may benefit most from dispersal of their male
offspring, leading to a situation in which mothers force their male offspring to leave
(Holzenbein and Marchinton 1992). Nevertheless, male dispersal may be constrained in
fenced estates and social pressure may be not sufficient, even attenuated (Shaw et al. 2006).
This fact may increase the possibility for within kin breeding if other favourable
circumstances occur.
Deer stags typically attempt to sneak matings when young, but switch to defending
harems when they grow older (Clutton-Brock et al. 1982). Thus, a possible mechanism
explaining increased homozygosis is that food clumping may produce an increase in male
harassment towards females (Sánchez-Prieto et al. 2004) due to the presence of a large
number of competitive males. Our study population is characterized by intense high quality
deer management, and there is a high proportion of mature males (6 to 10 years) that
congregate at feeding places during the rut season. Feeding stations in our study area are
located in open pasture areas. Harassment avoidance may lead females to use feeding
stations of dominant males for short time and almost exclusively for foraging, and favour
scrublands where subordinate males, possibly related, may have an increased chance to
mate with these females, which would explain increased inbreeding. Our findings could
reflect a conflict between hierarchy establishment in adult competitive stags (which is
complicated by a probable excess of males at feeding places) and gaining of females for
mating. Both are probably performed with difficulty in open areas of our study estate
because it could be difficult for adult males to establish hierarchy (i. e. displaying agonistic
behaviour) in woodlands. In contrast, due to the food scarcity of the Mediterranean
summer in natural unmanaged populations in South Spain, females stay in the few
meadows remaining in a stag’s exclusively defended territory. There being proportionally
fewer adult stags than in most high quality management estates, this may prove a good
strategy in terms of hind harvest (Carranza and Valencia 1999).
Finally, a simpler explanation is based on the hypothetical effect of selective
hunting on deer genetics. Keeping in mind that annually almost one fourth of the animals
are removed from the population following trophy-quality criteria (Fierro et al. 2002), it

___________________________________________________________________Tesis Doctoral
115
seems plausible that the cumulative effect of selective hunting has had an adverse effect on
genetic variability of this deer, as has been seen in other ungulates (Coltman et al. 2003). If
there is any relationship between heterozygosity at MHC-DRB-2 this locus and individual
hunter-targeted traits, then the selective culling of stags could lead to increased or reduced
heterozygosity depending on the sense of the relationship. For example, if heterozygosity at
this locus relates to large antler size, then we would expect an increase in homozygosity,
due to the hunted stags being removed. If there is any relationship between homozygosity
at this locus and poor condition or disease susceptibility, then the selective culling of
animals in poor condition would lead to increased heterozygosity. Other non-hunting
explanations could lie in the presence of a disease in the population for which selective
pressure is high and a homozygous locus is an advantage.
In the context of overall low homozigosity in the study population, the proportion
of heterozygotes was statistically higher in males (7 out of 61, 11.5 %), than in females (0
%, n = 34). In fact, all the detected heterozygotes were males. Different non-exclusive
explanations, which cannot be tested in this study, could contribute to this finding. Firstly,
heterozigosis may prone more advantageous in males than in females, and therefore
selecting heterozygous males. Secondly, sex allocation may be influenced by offspring
MHC heterozigosity. Thirdly, hunting strategy, which is undergone using different criteria
in males (selective or trophy) but not in females, could favour retaining more heterozygotes
among males than in females. Higher sample size and correlational studies with fitness
parameters in our study population are needed to elucidate this aspect.
The Iberian red deer, red deer and white tailed deer DRB-2 alleles represented
paraphyletic groups. As previously discussed by (Van Den Bussche et al. 1999), this result
reflects the high sequence identity that exists among artiodactyls DRB-2 alleles.
It has been suggested that red deer contain two expressed DRB loci (Swarbrick et
al. 1995). In the study of a different Iberian red deer population using the same
experimental procedures described herein, we found two expressed DRB loci in this
species (unpublished results). However, this was not observed in our study, as the SSCP
and F-SSCP analyses of Iberian red deer samples evidenced the presence of no more than
two predominant bands on each individual, a result that was confirmed with the sequence
analysis of cloned DRB-2 amplicons. It is likely that these results reflect the presence of
identical sequences in both DRB-2 loci and support a high DRB-2 homozygosis in this
Iberian red deer population. Alternatively, unless less likely, it is possible that in some

Capítulo 3______________________________________________________________________
116
samples we did not amplify all loci to a level to be detectable by SSCP or cloning and
sequencing analyses.
Genetic analysis using neutral microsatellite markers suggested that the results of
MHCII DRB-2 characterization reflect selective and not demographic influences on this
locus in this population. Values of HE for the microsatellite loci analyzed in this study were
higher than those reported by (Frantz et al. 2006) in a continuous red deer population.
We provided data suggesting that non selective forces may contribute to define the
MHC population pattern in a red deer population, and further may lead to the removal of
MHC allelic variants. We hypothesised that the effects of intensive management on the
mating structure may be highly influential, generating a deficit of MHCII DRB-2
heterozygous haplotypes. This deficit is very rarely found in free breeding mammal
populations. As a consequence, non-adaptive changes in MHC genetics constitution may
predominate rather than natural selection favouring genetic variants as a function of their
biological effectiveness. If this is the case, we have identified a negative consequence for
Iberian red deer conservation because host genetic diversity plays an important role in
buffering populations against pathogens and widespread epidemics (e. g. Spielman et al.
2004).
A previous study on neutral loci in Iberian red deer suggests that there are
differences between red deer populations in South Central Spain due to differing allele
frequencies and/or the number of alleles (Martínez et al. 2002), which indicates that genetic
goals in the management of Iberian deer populations have to avoid inbreeding to maintain
potentially adaptive genetic variation. Previous research confirms that increase of
inbreeding in artificially restored red deer populations may easily be higher than the
threshold at which natural selection is believed to counteract the fixation of deleterious
alleles in the gene pool (Zachos et al. 2007). Although our study population originated
from a relatively high number of founders, genetic clustering may increase the probability
of allele losses (Figures 3, 4, 6, Table 2). Additional research is needed in many other genes
involved in shaping the immune repertoire, either solely or in conjunction with MHC
(Acevedo-Whitehouse et al. 2006).
Conclusions
In conclusion, our findings raise concern about the ecological consequences of the
management of wildlife on deer life history. The efficacy of selection in maintaining genetic

___________________________________________________________________Tesis Doctoral
117
diversity can vary substantially with the degree of population subdivision (Muirhead 2001).
In particular, management of game species may involve a risk of alteration of their genetic
properties (Carranza et al. 2003). Intensive game management situations may be analogous
to bottlenecks, which increase the risk of loss of rare alleles and probably the risk of
outbreaks of severe diseases as a consequence of decreased MHC variation (Carranza et al.
2003; O’Brien and Evermann 1988). Therefore, although red deer is an abundant and
widespread species in Spain, its MHC polymorphism (and overall genetic variability), may
be threatened by (i) increasing habitat fragmentation and barriers to gene flow (Carranza et
al. 2003), (ii) by any alteration of mating substructures within managed populations
favouring positive assortative mating, or (iii) by selective hunting.
Methods
Study site and Iberian red deer population
The study was conducted in a 900 ha hunting estate in the province of Ciudad Real, south-
central Spain (38º55’N; 0º36´E; 600-850 m above sea level). The habitat is composed of
Mediterranean scrublands (mainly evergreen oak Quercus ilex) with scattered pastures and
small crops (Vicente et al. 2004; Acevedo et al. 2007). The climate is Mediterranean and
most annual rainfall is concentrated between September and May. The dry season is
characterized by high temperatures. Deer numbers were estimated yearly through repeated
direct counts at the feeding places at the end of July and during the rutting season and
resulted in a mean±SD of 306±27 individuals with a mean density of 0.35 individuals/ha.
The sex-ratio was 1 to 1.3 hinds per male in September and the population density
moderately increased during the study period (2000-2006) from 0.30 ind/ha in 2000 to 0.43
ind/ha in 2006.
Deer reproduce naturally in the estate and should be regarded as one single
population where no introduction of individuals has been performed since 1991. In 1989,
the estate had 5 females and 2 calves. Between 1989 and 1991, 126 individuals (85 females
and 41 males) were introduced from three different locations. Management schemes for
hunting purposes in the estate include fencing in order to restrict movement of wildlife,
artificial water holes, supplemental feeding in troughs, and selective hunting of a mean of
80 ± 13 deer each year (8.89 per square km), mostly by the same single hunter. Criteria for
selective shooting of deer included obvious poor condition in both sexes, lack of a fawn in
females, and poor trophy characteristics in males (e.g. short spikes in yearlings or lack of

Capítulo 3______________________________________________________________________
118
second tines in stags, Fierro et al. 2002). Prime males were shot as trophies only after
participating in several rutting seasons.
Sample collection and DNA extraction
Samples were collected from 94 selectively harvested Iberian red deer (34 females and 60
males) between 2000 and 2006, during the main hunting season from October to February.
This sample represented approximately 30% of the population living in the estate. Lymph
node tissue fragments of approximately 2 cm3 were prepared and stored at -80ºC for DNA
extraction and genetic analyses. Genomic DNA was extracted from mesenteric lymph node
samples using Tri Reagent (Sigma, St. Louis, MO, USA) and following manufacturer’s
recommendations.
DNA was extracted from lower jaw bone remains of 6 deer introduced and hunted
before 1992. DNA was extracted from 2 cm2 jaw sections following the procedure
described by (Lleonart et al. 2000) for human remains.
Single-stranded conformation polymorphism (SSCP) analyses
The DRB-2 locus was amplified by polymerase chain reaction (PCR) using primers LA31
and LA32 (Sigurdardottir et al. 1991) in a 50-µl volume PCR (1.5 mM MgSO4, 0.2 mM
dNTP, 1X AMV/Tfl reaction buffer, 5u Tfl DNA polymerase) employing the Access RT-
PCR system (Promega, Madison, WI, USA). Reactions were performed in an automated
DNA thermal cycler (Techne, Cambridge, England, UK) PCR machine (model TC-512)
for 35 cycles. After an initial denaturation step of 2 min at 95oC, each cycle consisted of a
denaturing step of 1 min at 95oC, an annealing for 30 sec at 50oC and an extension step of
1 min at 68oC. Negative control reactions were performed with the same procedures, but
adding water instead of DNA to monitor contamination of the PCR. The allelic diversity of
DRB-2 was characterized using a modification of the single-stranded conformation
polymorphism (SSCP) analysis (Van Den Bussche et al. 1999), without isotopic labelling of
PCR products and using gel silver staining (Amersham Biosciences, Sweden).
A sub-sample of the heterozygous and homozygous individuals identified by SSCP
and the deer introduced and hunted before 1992 were also analyzed by fluorescent SSCP
(F-SCCP). Samples were prepared for F-SSCP following the procedure of Lento et al.
(2003) using FAM-labeled primers and the ABI 310 manual (Applied Biosystems). A 2µl
aliquot of a 1:5 dilution of the DQB amplicon in ddH2O was mixed with 10.5 µl deionized
formamide (Gibco), 0.5 µl of freshly made 0.3 N NaOH and 1.0 µl GeneScan-500 TAMRA
dye standard (ABI Prism). The samples were denatured at 96°C for 2–4 min and then

___________________________________________________________________Tesis Doctoral
119
snap-cooled on wet ice slurry for 2–4 min before electrophoresis on an ABI 310 automated
capillary sequencer running 3% GeneScan (ABI Prism) polymer in 1×TBE. Runs were
conducted for 18 min and the heating mantle set at a constant temperature of 29°C. SSCP
peak profiles were analyzed using ABI 310 data collection and peak scanner software
(v1.0). The relative position of each SSCP peak was calculated with peak scanner by
standard interpolation between peaks of the TAMRA standard run in each lane. As in
manual SSCP, this relative position does not represent an absolute size of the fragment and
was used only to identify unique alleles across runs. The F-SSCP profile was analyzed on
both strands by comparing the results obtained with forward- and reverse-labelled primers.
Sequence analyses
All unique SSCP conformations were cloned for subsequent sequence analysis. Amplified
fragments were resin purified (Wizard, Promega) and cloned into the pGEM-T vector
(Promega) for sequencing both strands by double-stranded dye-termination cycle
sequencing (Core Sequencing Facility, Department of Biochemistry and Molecular Biology,
Noble Research Center, Oklahoma State University). At least five independent clones were
sequenced for each cloned allele.
For phylogenetic analysis of the 18 Iberian red deer DRB-2 alleles (CeelHap)
identified here, we included published DNA sequences of 56 DRB-2 alleles from red deer
(CeelDRB; Swarbrick et al. 1995), 18 DRB-2 alleles from white-tailed deer (OdviDRB; Van
Den Bussche et al. 1999), and 10 DRB-2 alleles from moose (AlalDRB; Mikko and
Anderson 1995). Multiple sequence alignment was performed using the program AlignX
(Vector NTI Suite V 5.5, InforMax, North Bethesda, MD, USA) with an engine based on
the Clustal W algorithm (Thompson et al. 1994). Nucleotides were coded as unordered,
discrete characters with five possible character-states: A, C, G, T, or N and gaps were
coded as missing data. Phylogenetic analyses were implemented using MEGA version 3.0
(Kumar et al. 2004). Genetic distances among all DRB-2 alleles were calculated based on
Kimura two-parameter model. A neighbor-joining phylogenetic tree (Saitou and Nei 1987)
was constructed under the minimum evolution criteria with equal weights for all characters
and substitutions, heuristic searches with 5 random additions of input taxa and tree
bisection-reconnection (TBR) branch-swapping. Stability or accuracy of inferred
topology(ies) were assessed via bootstrap analysis (Felsenstein 1985) of 1000 replications.
Relative frequencies of nonsynonymous (dN) and synonymous substitutions (dS) within
and among all pairwise comparisons of Iberian red deer DRB-2 alleles were estimated

Capítulo 3______________________________________________________________________
120
following the method of Nei and Gojobori (Nei and Gojobori 1986) and applying the
Jukes and Cantor (Jukes and Cantor 1969) correction for multiple substitutions.
The detection of 18 alleles among the 94 individuals sampled in this population
indicated 170 possible DRB-2 genotypes. A Chi2 test was performed to evaluate whether
the observed heterozygosity was in H–W equilibrium, using GenAlEx 6 Software (Peakall
and Smouse 2006). As an estimation of MHC DRB-2 loci diversity, we used the number of
different alleles identified in relation to the number of individuals studied. The level of
significance was established at P=0.05.
Genotyping with microsatellite loci
Genotyping was performed on 96 deer DNA samples extracted as described above using
microsatellite loci CSSM22, ETH225 and CSSM19 (Frantz et al. 2006). To avoid linkage,
microsatellite loci from different chromosomes were chosen in this study
(http://www.marc.usda.gov/genome/cattle/references/twintable.html). None of these
loci is linked to MHC. In order to avoid noise from cariable adenylation during the PCR,
the “pigtail” sequence GTTTCTT was added to the 5’-end of each reverse primer
(Brownstein et al. 1996). The multiplex PCR was done with labelled forward (F)
oligonucleotide primers (Table 3) in a 50-µl volume (1.0 mM MgSO4, 1 X avian
myeloblastosis virus (AMV) RT/Thermus flavus (Tfl) reaction buffer, 0.2 mM each
deoxynucleoside triphosphate (dNTP), 5 u Tfl DNA polymerase, 0.22, 0.09 and 0.12 µM of
each oligonucleotide primer for microsatellite CSSM22, ETH225 and CSSM19,
respectively) employing the Access RT-PCR system (Promega, Madison, WI, USA).
Reactions were performed in an automated DNA thermal cycler (Techne model TC-512,
Cambridge, England, UK). The PCR consisted of an initial step of 5 min at 95oC followed
by 37 cycles of a denaturing step of 45 sec at 95oC and annealing step of 60 sec at 53 ºC
and an extension step of 45 sec at 68 ºC. The reaction was terminated after a final
extension at 68ºC for 10 min. Control reactions were done using the same procedures, but
without DNA added to control contamination of the PCR reaction. PCR products were
electrophoresed on 1% agarose gels to check the size of amplified fragments by
comparison to a DNA molecular weight marker (1 Kb Plus DNA Ladder, Promega,
Madison, WI, USA). Fragments were separated using an ABI 3730 authomated DNA
sequencer (Applied Biosystems, Inc. Foster City, CA, USA) and sized relative to a ROX-
labelled size marker with bands of known size (G500LIZ -250). The data were analyzed
using program Peak Scanner (Applied Biosystems).

___________________________________________________________________Tesis Doctoral
121
The expected (HE) and observed (HO) heterozygosity were estimated with
GENETIX 4.05.2 (Belkhir et al. 1996-2004). The exact test for deviation from Hardy-
Weinberg (H-W) equilibrium at each locus was performed with GENEPOP on the Web
v1.2 (http://genepop.curtin.edu.au/genepop_op1.html; Raymond and Rousset 1995) and
significance was tested with 10000 dememorizations, 1000 batches, and 10000 iterations.
Author’s contributions
IGFM and JV generated the molecular data and performed the data analyses. IGFM, JMPL
and VN carried out the laboratory work. AJM participated to data analysis. YF provided all
the animals of the study and helped with the first processing of them. IGFM, JV, JF and
CG wrote the manuscript. JF and CG conceived the study and participated in its desing
and coordination. All authors helped to draft the manuscript, also all of them read and
approved the final manuscript.
Acknowledgements
We thank Ester Ferrero and Joaquín Ortego (IREC) for technical assistance. This work
was supported by a grant from Grupo Santander (Spain) to C. Gortázar and J. de la Fuente.
Support was also provided by Ministerio de Educación y Ciencia, Plan Nacional and
FEDER, projects INIA FAU06-016 and AGL2005-07401. V. Naranjo was funded by
Junta de Comunidades de Castilla – La Mancha (JCCM), Spain.
References
Acevedo P, Vicente J, Höfle U, Cassinello J, Ruiz-Fons F, Gortázar C. 2007.
Estimation of European wild boar relative abundance and aggregation: a novel
method in epidemiological risk assessment. Epidemiology and Infection 135: 519-
527.
Acevedo-Whitehouse K, Cunningham AA. 2006. Is MHC enough for
understanding wildlife immunogenetics? Trends in Ecology and Evolution 21: 433-
438.
Altizer S, Harvell D, Friedle E. 2003. Rapid evolutionary dynamics and disease
threats to biodiversity. Trends in Ecology and Evolution 18: 589-596.

Capítulo 3______________________________________________________________________
122
Belkhir K, Borsa P, Chikhi L, Raufaste N, Bonhomme F (2001) GENETIX
4.03, Logiciel Sous Windows Pour la Génétique des populations. Laboratoire
Génome, Populations, Interactions. CNRS UMR 5000, Université de Montpellier II,
Montpellier, France.
Brownstein MJ, Carpten JD, Smith JR. 1996. Modulation of non-templated
nucleotide addition by Taq polimerase: primer modifications to facilitate genotyping.
Biotechniques 20: 1004-1010.
Carranza J, Álvarez F, Redondo T. 1990. Territoriality of a mating strategy in
red deer. Animal Behaviour 40: 79-88.
Carranza J, Valencia J. 1999. Red deer females collect on male clumps at
mating areas. Behaviour and Ecology 10: 525-532.
Carranza J, Martínez JG, Sánchez–Prieto CB, Fernández–García JL, Sánchez–
Fernández B, Álvarez–Álvarez R, Valencia J, Alarcos S. 2003. Game species:
extinction hidden by census numbers. Animal Biodiversity and Conservation 26.2:
81–84.
Carrington M, Nelson GW, Martin MP, Kissner T, Vlahov D, Goedert JJ,
Kaslow R, Buchbinder S, Hoots K, O'Brien SJ. 1999. HLA and HIV-1: heterozygote
advantage and B*35-Cw*04 disadvantage. Science 283: 1748–1752.
Clutton-Brock TH, Guinness FE, Albon SD. 1982. Red Deer: Behaviour and
Ecology of Two Sexes. University of Chicago Press. Chicago, USA.
Coltman DW, O'Donoghue P, Jorgenson JT, Hogg JT, Strobeck C, Festa-
Bianchet M. 2003. Undesirable evolutionary consequences of trophy hunting. Nature
426(6967): 655-658.
Ditchkoff SS, Hoofer SR, Lochmiller RL, Masters RE, Van Den Bussche RA.
2005. MHC-DRB evolution provides insight into parasite resistance in white-tailed
deer. The Southwestern Naturalist 50: 57–64.
Ellegren H, Mikko S, Wallin K, Andersson L. 1996. Limited polymorphism at
major histocompatibility complex (MHC) loci in the Swedish moose (Alces alces).
Molecular Ecology 5: 3–9.
Excoffier L. 2001. Analysis of population subdivision. In Handbook of
Statistical Genetics. Edited by Balding DJ, Bishop M, Cannings C. United Kingdom:
Wiley Chichester 271-307.
Felsenstein J. 1985. Confidence limits on phylogenies: an approach using the
bootstrap. Evolution 39: 783-791.

___________________________________________________________________Tesis Doctoral
123
Fierro Y, Gortázar C, Landete-Castillejos T, Vicente J, García A, Gallego L.
2002. Baseline values for cast antlers of Iberian red deer (Cervus elaphus hispanicus).
Zeitschrift Fur Jagdwissenschaft 48: 244-251.
Finch CE, Rose MR. 1995. Hormones and the physiological architecture of
life history evolution. Quarterly Review of Biology 70: 1–70.
Frantz AC, Tigel Pourtois J, Heuertz M, Schley L, Flamand MC, Krier A,
Bertouille S, Chaumont F, Burke T. 2006. Genetic structure and assignment tests
demostrate illegal translocation of red deer (Cervus elaphus) into a continuous
population. Molecular Ecology 15: 3191-3203.
Harf R, Sommer S. 2005. Association between MHC Class II DRB alleles and
parasite load in the hairy-footed gerbil, Gerbillurus paeba, in the Southern Kalahari.
Molecular Ecology 14: 85-91.
Hedrick PW. 1992. Female choice and variation in the major
histocompatibility complex. Genetics 132: 575-581.
Hedrick PW, Kim TJ, Parker KM. 2001. Parasite resistance and genetic
variation in the endangered Gila topminnow. Animal Conservation 4: 103–109.
Holand Ø, Askim KR, Røed KH, Weladji RB, Gjøstein H, Nieminen M. 2007.
No evidence of inbreeding avoidance in a polygynous ungulate: the reindeer (Rangifer
tarandus). Biology Letters 3: 36–39.
Holzenbein S, Marchinton RL. 1992. Spatial integration of maturing-male
white-tailed deer into the adult population. Journal of Mammalogy 73: 326-334.
Jukes TH, Cantor CR. 1969. Evolution of protein molecules. In Mammalian
protein metabolism. Edited by Munro HN. Academic Press. New York, USA.
Keller L, Waller D. 2002. Inbreeding effects in wild populations. Trends in
Ecology and Evolution 17: 230-241.
Klein J. 1986. Natural History of the Major Histocompatibility Complex.
Wiley and Son. New York, USA.
Klein J, Horejsi V. 1997. Immunology. Blackwell Science. Oxford, UK.
Kollars PG, Beck ML, Mech SG, Kennedy PK, Kennedy ML. 2004. Temporal
and spatial genetic variability in white-tailed deer (Odocoileus virginianus). Genetica 121:
269-276.
Kumar S, Tamura K, Nei M: MEGA3. 2004. Integrated software for
Molecular Evolutionary Genetics Analysis and sequence alignment. Briefings
Bioinform 5: 150-163.

Capítulo 3______________________________________________________________________
124
Kurt F, Hartl GB, Volk F. 1993. Breeding strategies and genetic variation in
European roe deer (Capreolus capreolus) populations. Acta Theriologica 38: 187-194.
Landete-Castillejos T, Gortázar C, Vicente J, Fierro Y, García A, Gallego L.
2004. Age-related foetal sex ratio bias in Iberian red deer (Cervus elaphus hispanicus), are
male calves too expensive for growing mothers? Behaviour Ecology and Sociobiology
56: 1-8.
Lento GM, Baker CS, David V, Yuhki N, Gales NJ, O’brien SJ. 2003. Primer
Note Automated single-strand conformation polymorphism reveals low diversity of a
Major Histocompatibility Complex Class II gene in the threatened New Zealand sea
lion. Molecular Ecology Notes 3: 346-349.
Lleonart R, Riego E, Saínz de la Pena MV, Bacallao K, Amaro F, Santiesteban
M, Blanco M, Currenti H, Puentes A, Rolo F, Herrera L, de la Fuente J. 2000.
Forensic identification of skeletal remains from members of Ernesto Che Guevara's
guerrillas in Bolivia based an DNA typing. International Journal of Legal Medicine
113: 98-101.
Lochmiller RL. 1996. Immunocompetence and animal population regulation.
Oikos 76: 594–602.
Lohm J, Grahn M, Langefors A, Andersen O, Storset A, von Schantz T. 2002.
Experimental evidence for major histocompatibility complex-allele-specific resistance
to a bacterial infection. Proceedings of the R Society of London B Royal 269: 2029–
2033.
Mainguy J, Worley K, Côté SD, Coltman DW. 2007. Low MHC DRB class II
diversity in the mountain goat: past bottlenecks and possible role of pathogens and
parasites. Conservation Genetics 8: 885-891.
Martínez JG, Carranza J, Fernández-Garcia JL, Sánchez-Prieto CB. 2002.
Genetic variation of red deer populations under hunting exploitation in southwestern
Spain. Journal of Wildlife Management 66: 1273-1282.
Mikko S, Andersson L. 1995. Low major histocompatibility complex class II
diversity in European and North American moose. Proceedings of the National
Academy of Sciences of The United States of America 92: 4259–4263.
Mikko S, Roed K, Schmutz S, Andersson L. 1999. Monomorphism and
polymorphism at MHC DRB loci in domestic and wild ruminants. Immunological
Reviews 167: 169-178.

___________________________________________________________________Tesis Doctoral
125
Muirhead CA. 2001. Consequences of population structure on genes under
balancing selection. Evolution 55: 1532-1541.
Nei M, Gojobori T. 1986. Simple methods for estimating the numbers of
synonymous and nonsynonymous nucleotide substitutions. Molecular Biology and
Evolution 3: 418–426.
Nussey DH, Coltman DW, Coulson T, Kruuk LE, Donald A, Morris SJ,
Clutton-Brock TH, Pemberton J. 2005. Rapidly declining fine-scale spatial genetic
structure in female red deer. Molecular Ecology 14: 3395-3405.
O’Brien SJ, Evermann JF. 1988. Interactive influence of infectious disease and
genetic diversity in natural populations. Trends in Ecology and Evolution 3: 254–
259.
Paterson S, Pemberton JM. 1997. No evidence for major histocompatibility
complex-dependent mating patterns in a free-living ruminant population.
Proceedings of the R Society of London B-Biological Sciences 264: 1813-1819.
Paterson S, Wilson K, Pemberton JM. 1998. Major histocompatibility complex
variation associated with juvenile survival and parasite resistance in a large
unmanaged ungulate population. Proceedings of the National Academy of Sciences
of The United States of America 95: 3714–3719.
Peakall R, Smouse PE: GENALEX 6. 2006. genetic analysis in Excel.
Population genetic software for teaching and research. Molecular Ecology Notes 6:
288-295.
Penn DJ, Potts WK. 1999. The Evolution of Mating Preferences and Major
Histocompatibility Complex Genes Identifiers. The American Naturalist 153: 145–
164.
Penn DJ, Damjanovich K, Potts WK. 2002. MHC heterozygosity confers a
selective advantage against multiple-strain infections. Proceedings of the National
Academy of Sciences of The United States of America 99: 11260-11264.
Piertney SB, Oliver MK. 2006. The evolutionary ecology of the major
histocompatibility complex. Heredity 96: 7–21.
Potts WK, Manning CJ, Wakeland EK. 1991. Mating patterns in seminatural
populations of mice influenced by MHC genotype. Nature 352: 619-621.
Raymond M, Rousset F. 1995. GENEPOP (version 1.2): population genetics
software for exact tests and ecumenicism. Journal of Heredity 86: 248-249.

Capítulo 3______________________________________________________________________
126
Saitou N, Nei M. 1987. The Neighbor-Joining Method - A New Method For
Reconstructing Phylogenetic Trees. Molecular Biology and Evolution 4: 406-425.
Sánchez-Prieto CB, Carranza J, Pulido FJ. 2004. Reproductive behavior in
female Iberian red deer: Effects of aggregation and dispersion of food. Journal of
Mammalogy 85: 761-767.
Schad J, Ganzhorn JU, Sommer S. 2005. MHC constitution and parasite
burden in the Malagasy mouse lemur, Microcebus murinus. Evolution 59: 439-450.
Shaw JC, Lancia RA, Conner MC, Rosenberry CS. 2006. Effect of population
demographics and social pressures on white-tailed deer dispersal ecology. Journal of
Wildlife Management 70: 1293-1301.
Sigurdardottir S, Borsch C, Gustafsson K, Andersson L. 1991. Cloning and
sequence analysis of 14 DRB alleles of the bovine major histocompatibility complex
by using the polymerase chain reaction. Animal Genetics 22: 199–209.
Slate J, Kruuk LEB, Marshall TC, Pemberton JM, Clutton-Brock TH. 2000.
Inbreeding depression influences lifetime breeding success in a wild population of
red deer (Cervus elaphus). Proceedings of the Royal Society B: Biological Sciences 267:
1657-1662.
Spielman D, Brook BW, Briscoe DA, Frankham R. 2004. Does inbreeding and
loss of genetic diversity decrease disease resistance? Conservation Genetics 5: 439-
448.
Swarbrick PA, Schwaiger FW, Epplen JT, Buchan GS, Griffin JFT, Crawford
AM. 1995. Cloning and sequencing of expressed DRB genes of the red deer (Cervus
elaphus) MHC. Immunogenetics 42: 1-9.
Thompson JD, Higgins DG, Gibson TJ: CLUSTAL W. 1994. improving the
sensitivity of progressive multiple sequence alignment through sequence weighting,
positions-specific gap penalties and weight matrix choice. Nucleic Acids Research 22:
4673-4680.
Van Den Bussche RA, Hoofer SR, Lochmiller RL. 1999. Characterization of
MHC-DRB allelic diversity in white-tailed deer (Odocoileus virginianus) provides insight
into MHC-DRB allelic evolution within Cervidae. Immunogenetics 49: 429–437.
Van Den Bussche RA, Ross TG, Hooper SR. 2002. Genetic variation at a
major histocompatibility locus with and among populations of white-tailed deer
(Odocoileus virginianus). Journal of Mammalogy 83: 31–39.
___________________________________________________________________Tesis Doctoral
127
Vicente J, Fierro Y, Martínez M, Gortázar C. 2004. Long-term epidemiology,
effect on body condition and interspecific interactions of concomitant infection by
nasopharyngeal bot fly larvae (Cephenemyia auribarbis and Pharyngomyia picta, Oestridae)
in a population of Iberian red deer (Cervus elaphus hispanicus). Parasitology 129: 349-
361.
Vicente J, Fierro Y, Gortázar C. 2005. Seasonal dynamics of the fecal
excretion of Elaphostrongylus cervi (Nematoda, Metastrongyloidea) first stage larvae in
Iberian red deer (Cervus elaphus hispanicus) from South Spain. Parasitology Research 95:
60-64.
Von Schantz T, Wittzell H, Go Ransson G, Grahn M, Persson K. 1996.
MHC genotype and male ornamentation: genetic evidence for the Hamilton-Zuk
model. Proceedings of the Royal Society of London B 263: 265–271.
Wegner KM, Reusch TBH, Kalbe M. 2003. Multiple parasites are driving
major histocompatibility complex polymorphism in the wild. Journal of Evolutionary
Biology 16: 224–232.
Wenink PW, Groen AF, Roelke-Parker ME, Prins HHT. 1998. African
buffalo maintain high genetic diversity in the major histocompatibility complex in
spite of historically known population bottlenecks. Molecular Ecology 7: 1315–1322.
Wilson PJ, Grewal S, Rodgers A, Rempel R, Saquet J, Hristienko H, Burrows
F, Peterson R, White BN. 2003. Genetic variation and population structure of moose
(Alces alces) at neutral and functional DNA loci. Can J Zool - Revue Canadienne de
Zoologie 81: 670–683.
Zachos FE, Althoff C, Steynitz YV, Eckert I, Hartl GB. 2007. Genetic analysis
of an isolated red deer (Cervus elaphus) population showing signs of inbreeding
depression. European Journal of Wildlife Research 53: 61–67.


___________________________________________________________________Tesis Doctoral
129
Relación del complejo mayor de histocompatibilidad de la clase II con infecciones
y algunos indicadores de condición en el ciervo ibérico
Resumen
La diversidad genética del hospedador juega un importante papel en poblaciones naturales,
tamponando la acción de los patógenos. En este trabajo se caracteriza la diversidad alélica
en el segundo exón de la cadena DRB-2 del complejo mayor de histocompatibilidad
(MHC) clase II en una población de ciervo ibérico (Cervus elaphus hispanicus) en relación a
infecciones de naturaleza diversa (macroparásitos y un microparásito causante de
tuberculosis) y de algunos indicadores de condición relevantes de la historia natural de la
población (tamaño del bazo y engrasamiento). También se estudia la hipótesis de que la
calidad del MHC debería reflejarse en características dependientes de la condición.
Ningún haplotipo confirió una resistencia general o una mayor susceptibilidad
contra la totalidad de infecciones. Se observaron correlaciones específicas significativas
entre algunos de los alelos del DRB-2 y determinadas infecciones. Se detectaron relaciones
entre los alelos del DRB-2, la condición física y el tamaño del bazo.
Estos resultados demuestran un significado funcional de los genes del MHCII en la
protección del ciervo ibérico contra los patógenos, revelando que la variación en un sólo
locus del MHCII DRB es la base de la diferente resistencia contra la gama de patógenos
encontrados en este complejo escenario epidemiológico. Nuestros hallazgos correlacionales
también apoyan la idea del papel del MHCII como un elemento genético en la mejora de la
condición, lo que se evidencia por los efectos de los parásitos sobre los indicadores
fisiológicos con una base genética.
Se concluye que los estudios inmunogenéticos del MHC son de importancia a la
hora de tomar decisiones sobre las medidas de manejo en poblaciones de ciervo, ya que (i)
la pérdida genética puede conducir al aumento en la aparición de diversas enfermedades, y
(ii) las infecciones y la condición física pueden reflejar el estado genético de las poblaciones.
Habría que discutir así las medidas de manejo diseñadas para mantener la variación del
MHC, lo que proporcionaría una ventaja genética contra las diversas enfermedades en el
ciervo ibérico.


___________________________________________________________________Tesis Doctoral
131
Major histocompatibility complex class II polymorphism in relation to infections and life history traits of management relevance in Iberian red deer Fernández-de-Mera IG, Vicente J, Mangold AJ, Naranjo V, Fierro Y, Kocan KM, de la Fuente J, Gortázar C
Abstract
1. Host genetic diversity plays an important role in buffering populations against
pathogens. We characterized the allelic diversity at the second exon of the b (DRB-2)
chain of the major histocompatibility complex class II (MHCII) locus in a population
of Iberian red deer (Cervus elaphus hispanicus) in relation to infections of diverse nature
(macroparasites and a microparasite causing tuberculosis) and relevant life history traits
(spleen size and body condition). We also explored the hypothesis that MHC quality
should be apparent in expression of condition-dependent traits.
2. No haplotype conferred general resistance or susceptibility against the overall plethora
of infections. There were specific significant correlations between some DRB-2 alleles
and specific infections. We detected associations between DRB-2 alleles and body
condition and spleen size.
3. Our results evidenced a functional significance of MHCII genes in the defence of
Iberian red deer against pathogens, revealing that variation in a single MHCII DRB
locus differently underlies resistance against the range of pathogens found in such
complex epidemiological scenarios. Our correlational findings also support a role of
MHCII as a fitness-enhancing genetic element which is mediated by parasite effects on
life traits with genetic basis.
4. We conclude that MHC immunogenetic studies are relevant to assess management
decisions in red deer populations since (i) genetic loss may lead to increased disease
occurrence, and (ii) infection and life history traits may reflect genetic status of
populations. We discuss in the context of management schemes designed to maintain
MHC variants that provide a genetically advantage against diseases in the Iberian red
deer.
Key words: Wildlife disease, life history trait, major histocompatibility complex, parasite,
red deer, tuberculosis.

Capítulo 3______________________________________________________________________
132
Introduction
The major histocompatibility complex (MHC) is a multigene family comprised by highly
polymorphic loci of the vertebrate immune system (Klein 1986). The primary role of the
MHC is to recognise foreign proteins, present them to specialist immune cells and initiate
an immune response. MHC genes encode cell surface glycoproteins which hind and
present antigenic peptides to T cells. The MHC class I (MHCI) genes are expressed on the
surface of all nucleated somatic cells and play an essential role in the immune defence
against intracellular pathogens (such as viruses) by presenting endogenously derived
peptides to CD8+ cytotoxic T-cells (Klein 1996). MHC class II (MHCII) genes are
expressed on antigen-presenting cells of the immune system and present processed
exogenous antigens to CD4+ T-helper cells. Class II molecules are associated with immune
response derived from extracellular pathogens (most bacteria, nematodes, cestodes;
Villadangos 2001).
The MHC contains the most variable functional genes described in vertebrates
(Piertney and Oliver 2006). The extensive polymorphism and unusual persistence of alleles
at the MHC suggests the action of balancing selection, which means that somehow natural
selection works to maintain genetic polymorphisms (for a review of the main types of
balancing selection in humans and other vertebrates see Takahata and Nei 1990; Hedrick
1999; Penn et al. 2002). It have been suggested that the high level of MHC variability is
primarily maintained by parasite (pathogen)-driven selection (e. g. Paterson et al. 1998;
Carrington et al. 1999; Lohm et al. 2002; Wegner et al. 2003; Harf and Sommer 2005;
Schad et al. 2005). In contrast, directional selection favours a single allele and non selective
forces, such as genetic drift and inbreeding depression, would reduce genetic variation in
MHC and increase susceptibility to diseases (Sommer 2005; The authors, submitted).
Individuals from wild populations deal constantly with a diverse range of pathogens
and the polymorphism at MHC loci is what determines the diversity of foreign antigens
that the host immune system can recognize and subsequently trigger a specific immune
response. Polymorphism at individual loci may result in variable MHCII haplotype
composition. Recent studies suggest further that specific MHCII genotypes may confer
resistance to a variety of pathogens in wild vertebrates (Hedrick et al. 2001). In particular,
some MHCII haplotypes have been associated with macroparasite rates in ruminants
(Paterson et al. 1998; Ditchkoff et al. 2005), which indicates the existence of functional
significance of MHCII genes in defence against macroparasites. Although Mycobacterium
tuberculosis complex are intracellular pathogens, CD4+ T cells are critical for control of

___________________________________________________________________Tesis Doctoral
133
micobacterial infections in animals and humans and they are activated when mycobacterial
antigens are processed and presented by MHCII molecules (Noss et al. 2000; Amirzargar et
al. 2004; Torres et al. 2006). Most of these studies found associations between certain
MHC alleles and infection with single viral, bacterial or parasitic agents (e. g. Paterson et al.
1998; Meyer and Thomson 2001; Wegner et al. 2003), but little is known for
multipathogen-one host systems, especially when pathogens of diverse nature are involved
(Meyer-Lucht and Sommer 2005), which is the common situation in wild population
naturally exposed to a wide range of pathogens. Studies combining two or more pathogens
would be very valuable to improve the understanding of MCH variability in wildlife
species, and would provide support for management decisions depending on the life
history or conservation importance of a given host-pathogen system.
In addition to the MHC function in immune response, a large number of studies
have reported associations between genetic variation at MHC loci and life history traits (e.
g. Finch and Rose 1995; Lochmiller 1996) and behaviour (kin recognition, inbreeding
avoidance, mate choice; e. g. Penn and Potts 1999) of individuals in natural populations.
This confers an extra-value to the study of MHC and pathogens in applied ecology and
conservation. Therefore, empirical studies examining MHC type and parasite load in
concomitance with life history traits of ecological relevance are needed.
Wildlife management for hunting often causes a loss of genetic variation of
vertebrates and may lead to short-term reduction of fitness components (Keller and Waller
2002; Altizer et al. 2003) and disease susceptibility (Acevedo-Whitehouse et al. 2005). The
Iberian red deer (Cervus elaphus hispanicus) is a subspecies of red deer inhabiting the Iberian
Peninsula. Many red deer populations from South Central Spain have been managed during
the last decades for hunting purposes, which included fencing, isolation and subsequent
disruption of the interconnectivity among populations. In spite of the current high
densities of this game species, such management schemes have probably affected the
genetic diversity of the red deer, and have lead to increased population genetic clustering
and to reduced effective population sizes (Slate et al. 2000, Martínez et al. 2002, Zachos et
al. 2007). Since humans might be selecting unknowingly for rapid changes in the
relationships between red deer and its pathogens (Altizer et al. 2003) and the reduction in
the degree of variation in such genes may have a particularly adverse effect on population
viability and conservation, it is imperative investigating the diversity of genes that can
mediate disease resistance in the Iberian red deer.

Capítulo 3______________________________________________________________________
134
We compared MHCII DRB-2 locus polymorphism with data on infections with
different pathogens and life history traits obtained from hunter-harvested Iberian red deer.
The objectives of this research were (i) to study the relationships between DRB-2
polymorphism and pathogen infection, (ii) to assess the relationships between DRB-2
polymorphism and life history traits such as body condition and spleen size, and (iii) to
explore the hypothesis that MHC quality should be apparent in expression of condition-
dependent traits.
Materials and Methods
Study site and animals
The study was conducted in a 900 ha hunting estate in the province of Ciudad Real, south-
central Spain (38º55’N; 0º36´E; 600-850 m above sea level). The habitat is composed of
Mediterranean scrublands (mainly evergreen oak Quercus ilex) with scattered pastures and
small crops (Vicente et al. 2004; Acevedo et al. 2007). The climate is Mediterranean and
most annual rainfall is concentrated between September and May. The dry season is
characterized by high temperatures. Deer numbers were estimated yearly through repeated
direct counts at the feeding places at the end of July and during the rutting season and
resulted in a mean±SD of 306±27 individuals with a mean density of 0.35 individuals/ha.
The sex-ratio was 1 to 1.3 hinds per male in September and the population density
moderately increased during the study period (2000-2006) from 0.30 ind/ha in 2000 to 0.41
ind/ha in 2005.
Data were collected between 2000 and 2005 from 94 hunter harvested red deer. Sex
and total body length to the nearest 0.1 cm and were recorded. The spleens were collected
and the mass was measured to the nearest 0.1 g using an electronic-digital scale (Vicente et
al. 2007a, b). Body condition was estimated using the kidney fat index (KFI) since whole
body fat levels in cervids highly correlate with KFI (Finger et al. 1981). KFI is defined as
the percent of fat weight that surrounds the kidney in relation to kidney weight. The age of
deer was determined by histology from incisors (Matson´s Laboratory, Montana). For
statistical purposes, animals where grouped in age classes as follows: (1) calves (<1 year),
(2) yearlings (1-3 years), (3) subadults (3-4 years) and (4) adults (≥ 4 years).

___________________________________________________________________Tesis Doctoral
135
Parasitism quantification and TB diagnosis
The multi host-parasite system analyzed is endemically persistent in red deer populations
from South Central Spain (e.g. Vicente et al. 2006; 2007a). Namely, the abundance of 2
different Metazoan parasite taxa and the presence of one bacterial disease were determined.
Elaphostrongylus cervi (Nematoda: Protostrongylidae) is widespread in Spanish populations of
red deer (Vicente and Gortázar 2001; Vicente et al. 2006), and adults are found in the fascia
and connective tissue around skeletal muscles. Fresh faecal samples were collected directly
from the rectum during field necropsy and first-stage (L1) larvae were extracted in less than
24 h from 8 g of faeces (Forrester and Lankester 1997) and were expressed as number of
larvae per gram of faeces. The head, neck, ears and ventral surface of animals were
inspected for tick counting and collection. Tick species (Acari: Ixodidae) in the study area
included Hyalomma m. marginatum, Rhipicephalus bursa, Hy. lusitanicum and D ermacentor
marginatus (de la Fuente et al, 2004a; Ruiz-Fons et al. 2006). Parasite abundance was defined
as mean number of ticks (larvae, nymphs and adults) per deer.
Mycobacterium bovis infection was diagnosed by the presence of granulomatous
lesions, which was confirmed by culture and spoligotyping of mycobacteria (Gortázar et al.
2005; Vicente et al. 2006). For this purpose, parotidean, retropharyngeal and
submandibular lymph nodes in the head, tracheobronchial and mediastinic lymph nodes
and lungs in the thorax, and hepatic and mesenteric lymphnodes, ileocecal valve, kidneys,
liver and spleen in the abdomen were analyzed for granulomatous lesions. Pools of lymph
nodes samples were cultured in Coletsos medium (Bio-Mérieux, Marcyl’Étoile, France) as
described previously (Gortázar et al. 2005). Animals with lesions and positive cultures were
classified as positive for tuberculosis (TB) infection.
Genetics
The sample (n=94) represented approximately 30% of the population living in the estate.
Lymph node tissue fragments of approximately 2 cm3 were prepared and stored at -80ºC
for DNA extraction and genetic analyses. Genomic DNA was extracted from mesenteric
lymph node samples using Tri Reagent (Sigma, St. Louis, MO, USA) and following
manufacturer’s recommendations. The DRB-2 locus was amplified by polymerase chain
reaction (PCR) using primers LA31 and LA32 (Sigurdardottir et al. 1991) in a 50-µl volume
PCR (1.5 mM MgSO4, 0.2 mM dNTP, 1X AMV/Tfl reaction buffer, 5u Tfl DNA
polymerase) employing the Access RT-PCR system (Promega, Madison, WI, USA).
Reactions were performed in an automated DNA thermal cycler (Techne, Cambridge,

Capítulo 3______________________________________________________________________
136
England, UK) PCR machine (model TC-512) for 35 cycles. After an initial denaturation
step of 2 min at 95ºC, each cycle consisted of a denaturing step of 1 min at 95ºC, an
annealing for 30 sec at 50ºC and an extension step of 1 min at 68ºC. Negative control
reactions were performed with the same procedures, but adding water instead of DNA to
monitor contamination of the PCR. The allelic diversity of DRB-2 was characterized using
a modification of the single-stranded conformation polymorphism (SSCP) analysis (Van
Den Bussche et al. 1999), without isotopic labelling of PCR products and using gel silver
staining (Amersham Biosciences, Sweden).
Statistical analyses
Eighteen alleles were detected among 94 individuals sampled from this population. To
guarantee statistical power, analyses were performed for the most frequent (n ≥ 8) DRB-2
alleles. In our statistical models, individual allele was fitted as categorical explanatory
variable with four levels and we tested for associations with (i) TB infection status (as
categorical binary response variable, 0 = negative, 1 = positive), (ii) parasite abundances
(faecal E. cervi L1 counts and ticks; respectively), and (iii) life-traits (body condition as KFI
and spleen mass, as continuous explanatory variables, respectively). We also included as
categorical explanatory variables sex, age (excluding calves), season (defined as wet season
from October to March, and dry season for the rest of the year), and the interactions of
alleles by season since differences between genetic groups could arise only during a
particular season (Vicente et al. 2005; Ruiz-Fons et al. 2006). In the case of the spleen
model, we added the continuous explanatory variable body length to control for body size
effects. Sampling year (2000-2005) was incorporated as random categorical effect.
We tested the relationships between infections and life traits; and between life traits
(body condition and spleen mass). We firstly tested the relationships KFI (as response
variable) and each parasite abundance (as explanatory continuous variables), respectively,
and TB presence (as explanatory categorical variable). Secondly, we tested the relationships
between each pathogen (parasite abundances and TB presence as response variables) and
spleen mass (as explanatory categorical variable). Finally, we tested the relationship between
spleen (continuous response variable) and KFI (continuous explanatory variable). All these
models controlled for sex, age and body length; and year was included a random factor.
The models for which the binary response variable was TB status were build with a
binomial distribution and analysis carried out on the logit transform, whereas a Poisson
distribution and a log link was used for the remaining analyses (parasite abundances and life

___________________________________________________________________Tesis Doctoral
137
traits, Wilson and Grenfell 1997). We used a Poisson distribution and a log link because (i)
the spread in the residuals increased for the larger fitted values and (variance increases with
the mean) and (ii) the absence of normality in dependent variables (Wilk-Shapiro and
Lilliefors tests). We controlled for overdispersion when the overdispersion parameter of
the model (deviance/d.f.) was > 1. All analyses were carried out as generalised linear mixed
models (GLMMs) in SAS (Glimmix Procedure; SAS version 9.1.3. SAS Institute Inc., Cary,
NC, USA). Statistics concerning infections and life traits are shown as least squares means
of the respective models, and therefore the partial effects of the other explanatory variables
upon the selected ones are accounted for. Paired T-test comparisons between the least
squares means of the different haplotypes were performed. We performed Chi2 to tests
whether the observed heterozygosity did agree with the Hardy–Weinberg equilibrium using
GenAlEx 6 Software (Peakall and Smouse 2006). The level of significance was established
at 5 %.
Figure 1. (a) Observed frequency of alleles (2n = 188). (b) Observed vs expected counts of different haplotypes for MHC-II DRB-2 locus in red deer (n = 94). Absent haplotypes (for which also there exist expected values) are not graphically shown since a total of 170 different combinations are possible. Observed counts are indicated at the top of the bar.
17
1312
10
76
5 5
32 2 2
1 1 1 1 1 1 1 1 1 1 1
32 2
1 1 0 0 0 0 0 0 0
6
2
4
0 0 0 0 0 0 0 00
2
4
6
8
10
12
14
16
18
5-5
4-4
6-6
2-2
7-7
1-1
3-3
17-17
8-8
12-12
16-16
18-18
4-5
3-6
4-6
4-9
10-10
4-11
11-11
13-13
7-14
14-14
6-15
Haplotypes for MCH-II DRB-2 locus
Hap
loty
pe c
ount
Observed
Expected
35
28 27
20
15
12 11 10
64 4 4 3 3 2 2 1 1
0
5
10
15
20
25
30
35
5 4 6 2 7 1 3 17 8 12 16 18 11 14 10 13 9 15Allele
Alle
le c
ount
(a)
(b)

Capítulo 3______________________________________________________________________
138
Results
Descriptive
The SSCP and sequence analyses revealed 18 unique DRB-2 sequences among 94 Iberian
red deer from a single hunter-managed population in south-central Spain (Fig. 1). DRB-2
sequences were confirmed by sequencing the same allele from different individuals and by
sequencing several clones from the same PCR. The proportion of genotypes that were
found in this deer population differed statistically from expected Hardy–Weinberg
proportions (Chi2 = 1248.3, d. f. = 153, p<0.001). This disequilibrium was mainly due to
homozygous genotypes being observed at much higher proportion than expected (Fig. 1).
Observed heterozygosity was 7.5 % (7/94), whereas expected heterozygosity was 89.1 %.
Four genotypes out of the 23 genotypes found which appeared as homozygotes
represented 55% of the 94 individuals analyzed: CeelHap2 (n = 10, 10.6 %), CeelHap4 (n =
12, 12.8 %), CeelHap5 (n = 17, 18.1 %) and CeelHap6 (n = 12, 12.8 %).
Table 1. Prevalence of tuberculosis and parasitic infections, and mean abundance of such parasites
of red deer (excluding calves) from a population in Southwestern Spain with different MCH
haplotype. Sample size is indicated.
The association between DRB-2 genotypes and infections were estimated including
the 4 most common alleles (Table 1, Fig. 1). Whereas ticks and counts of E. cervi L1 were
widely spread across the individuals, TB infection was more restricted, only reaching
Prevalence ± S.E. (n) Mean abundance ± S.E
CeelHap2 CeelHap4 CeelHap5 CeelHap6 CeelHap2 CeelHap4 CeelHap5 CeelHap6
Tu
ber
culo
sis
10.0±10.0 (10)
16.7±11.0 (12)
5.88±6.0 (17)
25.0±13.0 (12) --- --- --- ---
Tic
ks
30.0±15.3 (10)
58.3±14.9 (12)
58.8±12.3 (17)
66.7±14.2 (12) 1.0±0.6 21.8±9.4 10.7±4.5 13.6± 4.7
E. c
ervi
(L
1)
20.0±13.3 (10)
58.3±14.9 (12)
46.7±13.3 (15)
41.7±14.9 (12) 1.2±1.0 19.8±11.6 7.7±3.0 3.5±1.6

___________________________________________________________________Tesis Doctoral
139
comparable figures to those of parasites in individual with CeelHap5. Average values for
spleen size and body condition in relation to the haplotype are shown in Table 2.
Table 2. Mean spleen mass (g) and body condition (kidney fat index, as %) of red deer (excluding calves) from a population in Southwestern Spain with different MCH haplotype. Standard error and sample size (n) are indicated. It should be noted that values do not account for the partial effects of the other explanatory variables sex, age, body size and season (Table 4, Figure 2b).
Associations between MHC-II genotypes and infections
After controlling by epidemiological predictors and body size, TB infection, the abundance
of ticks, and the abundance of E. cervi L1 statistically differed among the 4 main genotypes
(Table 3).
Table 3. Test statistics of GLMM for effects of haplotype (2, 4, 5, 6) on tuberculosis infection, different abundances of parasites (E. cervi, tricostrongylid, ticks) and life traits (spleen mass and KFI) of red deer (excluding calves). All the models were fitted by year (2000-2005, P > 0.05 in every model). Degree of freedom refers to the maximum value in the model. n.s. not significant. * p < 0.05, ** p < 0.01, *** p < 0.001.
Response variable ► Tuberculosis
(df=37)
E. cervi
(df=35)
Ticks
(df=37)
Spleen mass
(df=37)
Body condition
(df=37)
Explanatory variable▼ F P F P F P F P F P
Sex 11.19 ** 51.67 *** 116.4 *** 1.94 n.s 23.21 ***
Age 4.93 ** 11.75 *** 25.60 *** 26.26 *** 18.39 ***
Season 0.01 n.s. 50.04 *** 0.01 n.s 273.9 *** 130.83 ***
Body length 11.93 ** 65.67 *** 2.44 n.s 147.4 *** 2.19 n.s.
HAPLOTYPE 8.17 *** 19.34 *** 7.85 *** 84.72 *** 3.52 *
Season*Haplotype 5.64 ** 15.42 *** 9.44 *** 3.33 * 21.81 ***
CeelHap2 CeelHap4 CeelHap5 CeelHap6
Spleen mass (g) 320.0±32.0 (10) 338.6±34.8 (12) 343.5±31.4 (15) 416.7±35.3 (11)
KFI (%) 51.1±13.0 (8) 44.9±10.7(11) 46.2±7.8 (17) 46.0±7.0 (12)

Capítulo 3______________________________________________________________________
140
Overall, the results of paired comparisons (Table 4 displays the least square means,
see also Fig. 2a) indicated that: (i) CeelHap2 showed low infection rates of the E. cervi L1
infection; (ii) CeelHap4 presented the highest abundance of infection by macroparasites (E.
cervi L1 and ticks); (iii) CeelHap5 showed low prevalence of TB, whereas CeelHap6 showed
high prevalence; (iv) Individuals with CeelHap6 presented high prevalence of TB and low E.
cervi scores, whereas individuals bearing CeelHap5 presented a opposite trend.
Table. 4. This table shows the least square means ± S.E. of the respective models for tuberculosis infection status, parasitic infections (abundances of faecal E. cervi L1, faecal trichotrongylids eggs and ticks) and some life-traits (KFI and spleen) of red deer (excluding calves), which account for the partial effects of the other explanatory variables. Significant p-values of T-tests for paired comparisons between least squares means of the different haplotypes (involving the haplotype at the bottom, and the respective haplotype at the top right) are indicated in parenthesis.
Associations between MHC-II genotypes and life history traits
After controlling by individual factors (including body size), spleen mass and body
condition (KFI) differed between genotypes (Table 5 displays the least square means, see
also Fig. 2b).
Table 5. Summary of infection susceptibility and life traits of red deer with the four more frequently found MCH haplotypes.
CeelHap2 CeelHap4 CeelHap5 CeelHap6
Infections Low E. cervi High E. cervi High ticks
High E. cervi, low ticks Low TB
High TB Low E. cervi
Life traits High Small spleen Low High
Variable CeelHap2 CeelHap4 CeelHap5 CeelHap6
Tuberculosis (n=51) -13.6±49.6 -1.7±3.5(H5,
CeelHap6)
-8.4±3.32(H4,
H 6)
2.3±3.17(H4,
CeelHap5)
E. cervi (n=49) -4.2±1.2(H4,
CeelHap5)
-0.9±1.1(H2,
CeelHap5,
CeelHap6)
-1.5±1.1(H2
,H4, CeelHap6) -3.6±1.2( CeelHap4,
CeelHap5)
Ticks (n=51) -6.3±53.5 1.1±0.4(H5,H6)-
0.2±0.5(H4,H
6)
0.6±0.4(H4,
CeelHap5)
Spleen (n=53) 6.0±0.1(H4,
CeelHap5)
5.7±0.1(H2,
CeelHap5,
CeelHap6)
5.8±0.1(H2,
H4, CeelHap6) 6.0±0.1(H4,
CeelHap5)
KFI (n=53) 3.8±0.1(H5) 3.6±0.1 3.5±0.1(H2,
CeelHap6) 3.7±0.1(H5)

___________________________________________________________________Tesis Doctoral
141
0
5
10
15
20
25
30
35
40
Haplot 2 Haplot 4 Haplot 5 Haplot 6
Mea
n ab
unda
nce
/ pre
vale
nce
Abundance of Ticks (nºx10)Abundance of E. cervi L1 (nºx10)Prevalence of tuberculosis (%)
3,0
3,5
4,0
4,5
5,0
5,5
6,0
6,5
Haplot 2 Haplot 4 Haplot 5 Haplot 6
Leas
t squ
ares
mea
ns
Body condition
Spleen mass
Figure 2. (a) Prevalence of tuberculosis and mean abundance of E. cervi L1 and ticks of red deer (excluding calves) from a population in Southwestern Spain with different MCH haplotype. It should be noted that the partial effects of the other explanatory variables are not accounted for (see least square means in Table 4). (b) Mean least squares for spleen mass and body condition (KFI) of red deer (excluding calves) from a population in Southwestern Spain with different MCH haplotype.
Paired comparisons between genotypes indicated that individuals with CeelHap2
and CeelHap6 had high relative spleen mass (statistically higher than individuals with
CeelHap4 and CeelHap5, CeelHap4 individuals having the smallest relative spleen mass).
Similarly, individuals with CeelHap2 and CeelHap6 showed high body condition scores (both
statistically higher than individuals with CeelHap5).
(a)
(b)

Capítulo 3______________________________________________________________________
142
Associations between infections and life history traits
A statistical negative relationship was found between KFI and E. cervi L1 counts (F =
19.26, p < 0.001, parameter estimate = -0.01); tick counts (F = 48.19, p < 0.001, parameter
estimate = -0.01), and TB presence (F = 14.00, p < 0.001, parameter estimate for the level
absence = 0.24 considering a parameter estimate for the level presence = 0). Concerning
spleen models, a statistical negative relationship was found between spleen mass and E.
cervi L1 counts (F = 58.41, p < 0.001, parameter estimate = -0.01); and tick counts (F
=7.36, p < 0.01, parameter estimate = -0.003). We did not evidenced statistical relationship
between spleen mass and TB prevalence (F = 0.03, p < 0.88, parameter estimate = 0.00).
KFI and spleen mass statistically positively correlated (F = 1062.86, p < 0.01, parameter
estimate = 0.004).
Discussion
We characterized individual genetic resistance to pathogens (looking at MHCII DRB-2
locus) while controlling epidemiological factors inherent to individuals in a single red deer
population. Firstly, our results indicated functional significance of MHCII genes in
regulating the defence of red deer against pathogens, although no single haplotype
conferred general resistance against the complete range of pathogens. This may indicate
that variation in the immune function associated to a single MHCII DRB locus differently
underlies resistance against different pathogens. Secondly, the relationship between MHC
genetics and life traits are the expected according to the relationships found between
parasites and life traits, which confirms an important role to pathogens and host MHC in
the viability of managed red deer populations.
MHCII DRB-2 polymorphism and infections
Each of the four most common haplotypes was characterized by specific
resistance/susceptibility (according to infection rates) against certain pathogen/s (Tables 3
and 4, Fig. 1). Each MHC molecule has a different set of binding properties, and as a
consequence, different peptides will be bound by these different molecules and each MHC
allele will provide an infected individual with the ability to present a particular set of
antigens (Hedrick 2002). Specific MHC alleles are especially effective at presenting antigens
from a particular infection, and, hence, in combating specific pathogens (examples for
single infections in a wide range of hosts: Langefors et al. 2001; Lohm et al. 2002, Paterson

___________________________________________________________________Tesis Doctoral
143
et al. 1998; Harf and Sommer 2005; Meyer-Lucht and Sommer 2005; Schad et al. 2005). If
MHCII molecules fail to bind or present some peptides derived from foreign proteins, an
effective immune response cannot be achieved and further infection is likely. Therefore,
our results can be explained by the variation in the pathogenesis of infection and in the
specific host immune response against the considered pathogens.
Previous studies suggest that resistance of ungulates to intestinal nematodes might
be associated with allelic variation at MHCII-DRB (MHCII DRB-2 locus in white tailed
deer Odocoilus virginianus, Ditchkoff et al. 2005; in sheep, Schwaiger et al. 1995). Only
indirect evidence suggests the involvement of DRB (or any MHC locus) in resistance
against extrapulmonary lungworms in cervids (Paralephastrongylus tenuis in moose, Wilson et
al. 2003). The importance of immunogenetics studies in relation to E. cervi resides in that it
is wide spread and abundant in red deer across our study area (Vicente et al. 2006), it has
demonstrated to interact with hosts body condition (Vicente et al. 2007a; b), and even it
may prove a good immunological indicator in cervids (Gaudernack et el. 1984).
Similarly, Ditchkoff et al. (2005) evidenced resistance to ticks associated to MHCII
DRB-2 in white tailed deer. Also host genetic factors (antigens of the bovine MHC also
called bovine lymphocyte antigens, BoLA system) in cattle have been associated with tick
resistance (Stear et al. 1984) and some BoLA class II alleles determine at least partly the
susceptibility to tick infestation (Acosta-Rodríguez et al. 2005). Male sand lizards (Lacerta
agilis) with a specific restriction fragment length polymorphism fragment in their MHC
genotype are more resistant to Ixodes ricinus than are males lacking this fragment (Olsson et
al. 2005). Genetics basis to control tick is important because they can cause severe direct
impact on red deer and transmit a range of microparasitic infections of clinical relevance
across our study area (e. g. Höfle et al. 2004; de la Fuente et al. 2004a, b).
We found that the risk of presenting TB statistically depended on the haplotype.
Control of tuberculosis depends critically on the recognition and elimination of infected
cells by sensitized CD4+ T cells. It is now well established that intracellular proteins can be
also presented by MHC-II molecules (Chicz et al. 1993; Lechler et al. 1996), although the
underlying processes are less clear (Dengjel et al. 2006). Crosstalk between MHC I and II
pathways has been observed (Dengjel et al. 2005), which explain the existence of DRB
protective haplotypes. CD4+ T cells, activated through MHC class II molecules, are
essential for protection against tuberculosis by producing lymphokines such as IFN-g
(Flory et al. 1992). For example, experimental studies in rodents showed that alveolar
epithelial cells use the MHCII pathway to process and present mycobacterial antigens to

Capítulo 3______________________________________________________________________
144
immune CD4+ T cells, serving as antigen-presenting cells during the early events of TB
pathogenesis (Debbabi et al. 2005), which may determine the subsequent process.
Population studies in humans have identified allelic associations between disease
phenotypes and polymorphisms within the genes not only encoding class I (A,B,) but also
class II (DR, DQ, DP) molecules of the MHCII (Papiha et al. 1987; Newport and
Blackwell 1997; Ravikumar et al. 1999; Amirzargar et al. 2004). The predominant subset of
lymphocytes that proliferated in response to in vitro stimulation with PPD was the CD4+
subset in white tailed deer (Waters et al. 2000), which is associated to the MHCII pathway.
Also strong labelling of MHCII antigen in badger tubercles has been found in
immunohistochemical studies in TB infected badgers, and bronchial epithelium expressed
MHCII antigen strongly (Canfield et al. 2002). Our findings are important because TB
progressively causes fatal wasting disease in red deer with very low rate of recovery, with
high morbidity and mortality in our study area (Vicente et al. 2007c). In this sense, previous
research in our study area suggests that some individuals may be genetically refractory
(measured in neutral markers) to TB implantation or may display some degree of disease
contempt (wild boar in our study area, Acevedo-Whitehouse et al. 2005; Naranjo et al.
2006a, b).
Our study system may well resemble the inherent complexity to natural systems
since included parasites of different epidemiology and pathogenesis (macroparasites and
microparasites, Nokes 1992, Maizels et al. 2004). We remark that no single haplotype
conferred general resistance against the whole range of pathogens, which may indicate that
variation in the immune function associated to a single MHC locus differently underlies
resistance/susceptibility against different pathogens. Different alleles involved
resistance/susceptibility to one class or group of parasites, either metazoan macroparasites
(E. cervi and ticks) or tuberculosis. In particular, whereas CeelHap5 showed low levels of TB
and high abundance of E. cervi L1, the trend was the opposite in CeelHap4 (Table 4). This
may represent an immune trade-off the genetic basis to mount an appropriate immune
response to different pathogens, as suggested for different MHCII DRB-2 variants, ticks
and gastrointestinal nematodes in white tailed deer (Ditchkoff et al. 2005). We also found
that specific haplotypes associated with high macroparasite infection, whereas other
associated with low levels of them (Tables 4 and 5). Activation of immune response to
suppress macroparasites may relay in part in similar mechanisms as they are extracellular
pathogens and MHCII molecules are involved mainly in pathogen presentation of
extracellular pathogens to CD4+ T-helper cells. Finally, it may be indicative of the

___________________________________________________________________Tesis Doctoral
145
complexity of the immunogenetics relationships between hosts and pathogens that
CeelHap5 showed high levels of E. cervi L1, and low levels of ticks.
Population substructure (see discussion bellow) with subsequent increased contact
within family groups (sharing a “family” genotype) could contribute to explain differences
in infection rates rather than actual genetic differences (Blanchong et al. 2007). We found
that haplotypes also related to indirectly transmitted (Vicente et al. 2006 in relation to E.
cervi in watering areas), and to ubiquitous pathogens (apparently exposition did not differ
between groups), which supports that differences related to genetics constitution.
MHCII DRB-2 polymorphism and life history traits
After controlling by individual factors (including body size), body condition and spleen
mass statistically differed between MHCII DRB haplotypes (Table 5). To our knowledge
this is the first time that specific relationships between MHC variations and life traits are
reported in red deer. Interestingly, we found a statistical negative relationship between KFI
and E. cervi L1 counts, tick counts, and TB presence; respectively. Also, after controlling by
individual factors, CeelHap2 and CeelHap6 showed high KFI and relative spleen mass, with
low levels of macroparasites (Table 5). These correlational results are consistent with
increased parasitism or disease because due to individual genetic characteristics may lead to
reduce fitness components. In white tailed deer there have been detected associations
between genetic characteristics at Odvi-DRB and antler development and body mass,
suggesting that they may associate with pathogen resistance in deer (Ditchkoff et al. 2001).
How host genetics interaction with host nutrition and macroparasites? We hypothesize that
if red deer with a particular configuration for DRB MHC locus have an immunologic
advantage because of resistance to certain pathogens, MHC quality should be apparent in
expression of condition-dependent traits, like KFI and spleen mass (Vicente et al. 2007a).
Macroparasites have a negative impact on several red deer life-history traits such as
nutritional status (Irvine et al. 2006; Vicente et al. 2007a, b), and therefore KFI varied as
parasite did. A non-mutually exclusive possibility is that a particular MHC configuration
also may confer more efficiency at obtaining food and greater metabolic efficiency, and
subsequent good condition. It is well known that the nutritional status of the host can
influence the rate of acquisition of immunity to parasitic and other infections in many
animal species, including ruminants (e. g. Coop and Kyriazakis 1999; 2001; Strain and Stear
2001). Experimental approaches are needed to test the directionality of these relationships.

Capítulo 3______________________________________________________________________
146
We evidenced statistical negative relationships between spleen mass and E. cervi L1
counts and ticks; respectively. Also, spleen mass and E. cervi L1 statistically and positively
correlated. As previously reported, this is compatible with spleen mass being a condition-
dependent trait (Vicente et al. 2007a), which is what one would expect considering that
individuals in prime body condition would invest more (or more efficiently) in antiparasitic
defences (Moller et al. 1998; Lochmiller and Deeremberg 2000). In summary, the spleen
mass could reflect immune capacity in red deer, and individuals with larger spleens are
apparently more capable of maintaining lower parasite levels. We stress that the
interpretation of the relationships between MHC variants and life traits need to take into
account variation in the relationships between MHC variants and specific parasite taxa.
Management implications of host genetics and pathogens
Red deer populations in South Central Spain display considerable variance in the
prevalence and abundance of arthropods, helminths, and microbial pathogens that will
each interact with the MHC. Some of them, like the widely spread TB, may impede current
schemes of management of red deer populations (Gortázar et al. 2006; Vicente et al.
2007c). We should consider that schemes designed to maintain rare alleles (such as some
MHC variants) or those providing a genetically advantage against diseases in wildlife could
be operationally extremely difficult, we should have in mind that it could be as well
counter-productive, for examples regarding the maintenance of genetic variation in the rest
of the genome (Haig 1998; Hedrick and Miller 1994). Nevertheless, if it is possible to
determine what alleles (especially those in risk to disappear) are advantageous, neutral, or
detrimental; and planned translocations of individual carrying particular haplotypes could
contribute to restore original genetic diversity and to increase population resistance to
diseases. Also, if specific MHC alleles are known or suspected to be important for
adaptation, then an approach to increase these alleles may be considered. A previous study
on neutral loci in Iberian red deer suggests that differences among red deer populations in
South Central Spain may rely on allele frequencies and/or the number of alleles (Martínez
et al. 2002), which indicates that genetic goals in the management of Iberian deer
populations have to avoid inbreeding to maintain potentially adaptive genetic variation.
Host–pathogen interactions are dynamic (Altizer et al. 2003) in such a way that
‘protective’ genotypes will not necessarily be so over longer time periods and geographical
areas; hence, it would be necessary more studies before to attempt selection for particular
genotypes. At this point, we suggest that immunogenetic data can help complement

___________________________________________________________________Tesis Doctoral
147
management decisions in the context of genetic losses in such a managed ungulate. The
combination with an experimental approach under standardized laboratory conditions is
needed to prove the causal relationships behind correlations observed in the field. Also,
complement research is needed in many other genes involved in shaping the immune
repertoire, either solely or in conjunction with MHC (Acevedo-Whitehouse et al. 2007).
Acknowledgements
This study was supported by MEC and FEDER-EU proyect AGL2005-07401.This is also
a contribution to the agreement between FG-UCLM and Grupo Santander, to the
agreement between Yolanda Fierro and UCLM, and to project INIA RTA03-074-C2,
MEC.
Literature
Acevedo P, Vicente J, Höfle U, Cassinello J, Ruiz-Fons F, Gortázar C. 2007. Estimation of
European wild boar relative abundance and aggregation: a novel method in
epidemiological risk assessment. Epidemiology and Infection 135: 519-527.
Acevedo-Whitehouse K, Vicente J, Gortázar C, Höfle U, Fernández-de-Mera IG, Amos
W. 2005. Genetic resistance to bovine tuberculosis in the Iberian wild boar. Mol Ecol.
14: 3209-3217.
Acevedo-Whitehouse K, Cunningham AA. 2007. Is MHC enough for understanding
wildlife immunogenetics? Trends in Ecology and Evolution (in press).
Acosta-Rodríguez R, Alonso-Morales R, Balladares S, Flores-Aguilar H, García-Vázquez Z,
Gorodezky C. 2005. Analysis of BoLA class II microsatellites in cattle infested with
Boophilus microplus ticks: class II is probably associated with susceptibility. Veterinary
Parasitology 127: 313–321.
Altizer S, Harvell D, Friedle E. 2003. Rapid evolutionary dynamics and disease threats to
biodiversity. Trends in Ecology and Evolution 18: 589-596.
Amirzargar A, Yalda A, Hajabolbaghi M, Khosravi F, Jabbari H, Rezaei N, Niknam MH,
Ansari B, Moradi B, Nikbin B. 2004. The association of HLA-DRB, DQA1, DQB1
alleles and haplotype frequency in Iranian patients with pulmonary tuberculosis.
International Journal of Tuberculosis and Lung Diseases 8:1017–1021.

Capítulo 3______________________________________________________________________
148
Blanchong JA, Scribner KT, Kravchenko AN, Winterstein SR. 2007. TB-Infected deer are
more closely related than non-infected deer. Biology Letters 3: 103-105.
Canfield PJ, Day MJ, Gavier-Widen D, Hewinson RG, Chambers MA 2002.
Immunohistochemical Characterization of Tuberculous and Non-tuberculous Lesions
in Naturally Infected European Badgers (Meles meles). Journal of Comparative Pathology
126: 254-264.
Carrington M, Nelson GW, Martín MP. 1999. HLA and HIV-1: heterozygote advantage
and B*35-Cw*04 disadvantage. Science 283: 1748–1752.
Chicz RM, Urban RG, Gorga JC, Vignali DA, Lane WS, Strominger JL. 1993. Specificity
and promiscuity among naturally processed peptides bound to HLA-DR alleles. Journal
of Experimental Medicine 178: 27–47.
Coop RL, Kyriazakis I. 1999. Nutrition-parasite interaction. Veterinary Parasitology 84:
187-204.
Coop RL, Kyriazakis I. 2001. Influence of host nutrition on the development and
consequences of nematode parasitism in ruminants. Trends In Parasitology 17: 325-
330.
De la Fuente J, Naranjo V, Ruiz-Fons F, Vicente J, Estrada-Peña A, Almazán C, Kocan K
M, Martín M P and Gortázar C. 2004a. Prevalence of tick-borne pathogens in ixodid
ticks (Acari: Ixodidae) collected from European wild boar (Sus scrofa) and Iberian red
deer (Cervus elaphus hispanicus) in central Spain. European Journal of Wildlife Research
50: 187-196.
De La Fuente J, Vicente J, Höfle U, Ruiz-Fons F, Fernández-de-Mera IG, Van Den
Bussche RA, Kocan KM, Gortázar C. 2004b. Anaplasma infection in free-ranging Iberian
red deer in the region of Castilla-La Mancha, Spain. Veterinary Microbiology 3: 163-
173.
Debbabi H, Ghosh S, Kamath AB, Alt J, deMello DE, Dunsmore S, Behar SM. 2005.
Primary type II alveolar epithelial cells present microbial antigens to antigen-specific
CD4 T cells. American Journal of Physiology-Lung Cellular And Molecular Physiology
289: 274–279.
Dengjel J, Schoor O, Fischer R, Reich M, Kraus M, Muller M, Kreymborg K, Altenberend
F, Brandenburg J, Kalbacher H, Brock R, Driessen C, Rammensee HG, Stevanovic S.
2005. Autophagy promotes MHC class II presentation of peptides from intracellular
source proteins. Proceedings of the National Academy of Sciences of the U S A 31:
7779-7780.

___________________________________________________________________Tesis Doctoral
149
Dengjel J, Nastke MD, Gouttefangeas C, Gitsioudis G, Schoor O, Altenberend F, Muller
M, Kramer B, Missiou A, Sauter M, Hennenlotter J, Wernet D, Stenzl A, Rammensee
HG, Klingel K, Stevanovic S. 2006. Unexpected abundance of HLA class II presented
peptides in primary renal cell carcinomas. Clinical Cancer Research 12: 4163-4170.
Ditchkoff SS, Lochmiller RL, Masters RE, Hoofer SR, Van Den Bussche RA. 2001. Major-
histocompatibility-complex-associated variation in secondary sexual traits of white-
tailed deer (Odocoileus virginianus): evidence for good-genes advertisement. Evolution 55:
616–625.
Ditchkoff SS, Hoofer SR, Lochmiller RL, Masters RE, Van Den Bussche RA. 2005.
MHC-DRB evolution provides insight into parasite resistance in white-tailed deer. The
Southwestern Naturalist 50: 57–64.
Finch CE, MR Rose. 1995. Hormones and the physiological architecture of life history
evolution. Quarterly Review of Biology 70: 1–70.
Finger SE, Brisbin IL Jr, Smith MH. 1981. Kidney fat s a predictor of body condition in
white tailed deer. Journal of Wildlife Management 45: 964-968.
Flory CM, Hubbard RD, Collins FM. 1992. Effects of in vivo T-lymphocyte subset
depletion on mycobacterial infections in mice. Journal of Leukocyte Biology 51: 225–
229.
Forrester SG, Lankester MW. 1997. Extracting Protostrongylid nematode from ungulate
faeces. Journal of Wildlife Disease 33: 511–516.
Gaudernack G, Halvorsen O, Skorping A, Stokkan KA. 1984. Humoral immunity and
output of first-stage larvae of Elaphostrongylus rangiferi (Nematoda, Metastrongyloidea) by
infected reindeer, Rangifer tarandus tarandus. Journal of Helminthology 58: 13-18.
Gortázar C, Vicente J, Samper S, Garrido JM, Fernández-de-Mera IG, Gavín P, Juste RA,
Martín C, Acevedo P, De La Puente M , Höfle U. 2005. Molecular characterization of
Mycobacterium tuberculosis complex isolates from wild ungulates in South-Central Spain.
Veterinary Research 36: 43-52.
Gortázar C, Acevedo P, Ruiz-Fons F, Vicente J. 2006. Disease risks and overabundance of
game species. European Journal of Wildlife Research 52: 81-87.
Haig SM. 1998. Molecular contributions to conservation. Ecology 79: 413-425.
Harf R, Sommer S. 2005. Association between MHC Class II DRB alleles and parasite load
in the hairy-footed gerbil, Gerbillurus paeba, in the Southern Kalahari. Molecular Ecology
14: 85-91.

Capítulo 3______________________________________________________________________
150
Hedrick PW, Miller PS. 1994. Rare alleles, MHC and captive breeding. Conservation
genetics 187-204.
Hedrick P W. 2002. Pathogen resistance and genetic variation at MHC loci. Evolution 56:
1902–1908.
Hedrick PW. 1999. Balancing selection and the MHC. Genetica 104: 207-214.
Hedrick,PW, Kim TJ, Parker KM. 2001. Parasite resistance and genetic variation in the
endangered Gila topminnow. Animal Conservation 4: 103–109.
Höfle U, Vicente J, Nagore D, Hurtado A, Peña A, De la Fuente J, Gortázar C. 2004. The
risks of translocating wildlife Pathogenic infection with Theileria sp and Elaeophora elaphi
in an imported red deer. Veterinary Parasitology 126:387–395.
Irvine RJ, Corbishley H, Pilkington JG, Albon SD. 2006. Low-level parasitic worm burdens
may reduce body condition in free-ranging red deer (Cervus elaphus). Parasitology 133:
465-475.
Keller L, Waller D. 2002. Inbreeding effects in wild populations. Trends in Ecology and
Evolution 17: 230-241.
Klein J. 1986. Natural History of the Major Histocompatibility Complex. New York, Wiley
and Son.
Klein J, Horejsi V. 1996. Immunology. Blackwell Science. Oxford, UK.
Langefors A, Lohm J, Grahn M, Andersen O, von Schantz T. 2001. Proceedings of the
Royal Society of London, Series B 268: 479–485.
Lechler R, Aichinger G, Lightstone L. 1996. Immunology Review 151: 51–79.
Lochmiller RL. 1996. Immunocompetence and animal population regulation. Oikos 76:
594–602.
Lochmiller RL, Deeremberg C. 2000. Trade-offs in evolutionary immunology: just what is
the cost of immunity? Oikos 88: 87-98.
Lohm J, Grahn M, Langefors A, Andersen O, Storset A, von Schantz T. 2002.
Experimental evidence for major histocompatibility complex-allele-specific resistance
to a bacterial infection. Proceedings of the R Society of London B Royal 269: 2029–
2033.
Maizels RM, Balic A, Gomez-Escobar N, Nair M, Taylor MD, Allen JE. 2004. Helminth
parasites: Masters of regulation. Immunology Reviews 201: 89-116.
Martínez JG, Carranza J, Fernández-García JL, Sánchez-Prieto CB. 2002. Genetic variation
of red deer populations under hunting exploitation in southwestern Spain. The Journal
of Wildlife Management 66: 1273-1282.

___________________________________________________________________Tesis Doctoral
151
Meyer D and Thomson G. 2001. How selection shapes variation of the human major
histocompatibility complex: a review. Annals of Human Genetics 65: 1-26.
Meyer-Lucht Y, Sommer S. 2005. MHC diversity and the association to nematode
parasitism in the yellow-necked mouse (Apodemus flavicollis). Molecular Ecology 14:2233-
2243.
Moller AP, Christe P, Eritzoe J, Mavarez J. 1998. Condition, disease and immune defence
Oikos 83: 301-306.
Naranjo V, Höfle U, Vicente J, Martín MP, Ruiz- Fons F, Gortázar C, Kocan KM, de la
Fuente J. 2006a. Genes differentially expressed in oropharyngeal tonsils and mandibular
lymph nodes of tuberculous and non-tuberculous European wild boars naturally
exposed to Mycobacterium bovis. FEMS Immunology and Medical Microbiology 46: 298-
312.
Naranjo V, Ayoubi P, Vicente J, Ruiz-Fons F, Gortázar C, Kocan KM, de la Fuente J.
2006b. Characterization of selected genes upregulated in non-tuberculous European
wild boar as possible correlates of resistance to Mycobacterium bovis infection. Veterinary
Microbiology 25: 224-231.
Newport MJ, Blackwell JM. 1997. Genetic susceptibility to tuberculosis. Baillieres Clinical
Infectious Diseases 4: 207-229
Nokes DJ. 1992. Viruses and bacteria. In: Crawley MJ (ed) The population Biology of
predators, parasites and diseases. Blackwell. London, UK.
Noss EH, Harding CV, Boom WH. 2000. Mycobacterium tuberculosis Inhibits MHC Class II
Antigen Processing in Murine Bone Marrow Macrophages. Cellular Immunology 201:
63-74.
Olsson M, Wapstra E, Madsen T, Ujvari B, Rugfelt C. 2005. Costly parasite resistance: A
genotype-dependent handicap in sand lizards? Biology Letters 1: 375-377.
Papiha SS, Singh BN, Lanchbury JS, Roberts DF, Parsad CE, Wentzel J, Murty KJ. 1987.
Association of HLA and other genetic markers in South Indian patients with
pulmonary tuberculosis. Tubercle 68: 159-167.
Paterson S, Wilson K, Pemberton JM. 1998. Major histocompatibility complex variation
associated with juvenile survival and parasite resistance in a large unmanaged ungulate
population. Proceedings of the National Academy of Sciences of the USA 95: 3714–
3719.
Peakall R, Smouse PE. 2006. GENALEX 6: genetic analysis in Excel. Population genetic
software for teaching and research. Molecular Ecology Notes 6: 288-295.

Capítulo 3______________________________________________________________________
152
Penn DJ, Potts WK. 1999. The Evolution of Mating Preferences and Major
Histocompatibility Complex Genes Identifiers. The American Naturalist 153: 145–164.
Penn DJ, Damjanovich K, Potts WK. 2002. MHC heterozygosity confers a selective
advantage against multiple-strain infections. Proceedings of the National Academy of
Sciences of the USA 99: 11260-11264.
Piertney SB, Oliver MK. 2006. The evolutionary ecology of the major histocompatibility
complex. Heredity 96: 7–21.
Ravikumar M, Dheenadhayalan V, Rajaram K, Lakshmi SS, Kumaran PP, Paramasivan
CN, Balakrishnan K, Pitchappan RM. 1999. Associations of HLA-DRB1, DQB1 and
DPB1 alleles with pulmonary tuberculosis in south India. Tuberculosis Lung Disease
79: 309-17.
Ruiz-Fons F, Fernández-de-Mera IG, Acevedo P, Höfle U, Vicente J, de la Fuente J,
Gortázar C. 2006. Ixodid ticks parasitizing Iberian red deer (Cervus elaphus hispanicus)
and European wild boar (Sus scrofa) from Spain: geographical and temporal distribution.
Veterinary Parasitology 31: 133-142.
Schad J, Ganzhorn JU, Sommer S. 2005. MHC constitution and parasite burden in the
Malagasy mouse lemur, Microcebus murinus. Evolution 59: 439-450.
Schwaiger FW, Gostomski D, Stear M, Duncan JL, McKellar QA, Epplen JT, Buitkamp J.
1995. An ovine major histocompatibility complex DRB1 allele is associated with low
faecal egg count following natural, predominantly Ostertagia circumcincta infection.
International Journal of Parasitology 25: 815-822.
Sigurdardottir S, Borsch C, Gustafsson K, Andersson L. 1991. Cloning and sequence
analysis of 14 DRB alleles of the bovine major histocompatibility complex by using the
polymerase chain reaction. Animal Genetics 22: 199–209.
Slate J, Kruuk LEB, Marshall TC, Pemberton JM, Clutton-Brock TH. 2000. Inbreeding
depression influences lifetime breeding success in a wild population of red deer (Cervus
elaphus). Proceedings of the Royal Society B: Biological Sciences 267: 1657-1662.
Sommer S. 2005. The importance of immune gene variability (MHC) in evolutionary
ecology and conservation. Frontiers in Zoology 2: 16.
Stear MJ, Newman MJ, Nicholas FW, Brown SC, Holroyd RG. 1984. Tick resistance and
the major histocompatibility system. Australian Journal of Experimental Biology and
Medical Science 62: 47–52.
Strain SA, Stear MJ. 2001. The influence of protein supplementation on the immune
response to Haemonchus contortus. Parasite Immunology 23: 527-531.

___________________________________________________________________Tesis Doctoral
153
Takahata N, Nei M. 1990. Allelic genealogy under overdominant and frequency-dependent
selection and polymorphism of major histocompatibility complex loci. Genetics 124:
967-978.
Torres M, Ramachandra L, Rojas RE, Bobadilla K, Thomas J, Canaday DH, Harding CV,
Boom WH. 2006. Role of phagosomes and major histocompatibility complex class II
(MHC-II) compartment in MHC-II antigen processing of Mycobacterium tuberculosis in
human macrophages. Infection and Immunity 74: 1621–1630.
Van Den Bussche RA, Hoofer SR, Lochmiller RL. 1999. Characterization of Mhc-DRB
allelic diversity in white-tailed deer (Odocoileus virginianus) provides insight into Mhc-DRB
allelic evolution within Cervidae. Immunogenetics 49: 429–437.
Vicente J and Gortázar C. 2001. High prevalence of large spiny-tailed protostrongylid
larvae in Iberian red deer. Veterinary Parasitology 96: 165-170.
Vicente J, Fierro Y, Gortázar C. 2005. Seasonal dynamics of the fecal excretion of
Elaphostrongylus cervi (Nematoda, Metastrongyloidea) first stage larvae in Iberian red deer
(Cervus elaphus hispanicus) from South Spain. Parasitology Research 95: 60-64.
Vicente J, Fernández-de-Mera IG, Gortázar C. 2006. Epidemiology and risk factors
analysis of elaphostrongylosis in red deer (Cervus elaphus) from Spain. Parasitology
Research 98: 77-85.
Vicente J, Pérez-Rodríguez L, Gortázar C. 2007a. Sex, age, spleen size, and kidney fat of
red deer relative to infection intensities of the lungworm Elaphostrongylus cervi.
Naturwissenchaften 94: 581-587.
Vicente J, Höfle U, Fernández-de-Mera IG, Gortázar C. 2007b. The importance of parasite
life-history and host density in predicting the impact of infections in red deer.
Oecologia 152: 655-664.
Vicente J, Höfle U, Garrido JM, Fernández-de-Mera IG, Acevedo P, Juste R, Barral M,
Gortázar C. 2007c. Risk factors associated with the prevalence of tuberculosis-like
lesions in fenced wild boar and red deer in South Central Spain. Veterinary Research
38: 451-464.
Villadangos JA. 2001. Presentation of antigens by MHC class II molecules: getting the most
out of them. Molecular Immunology 38: 329-346.
Waters WR, Palmer MV, Pesch BA, Olsen SC, Wannemuehler MJ, Whipple DL. 2000.
MHC class II-restricted, CD4+ T-cell proliferative responses of peripheral blood
mononuclear cells from Mycobacterium bovis-infected white-tailed deer. Veterinary
Immunology and Immunopathology 76: 215-229.

Capítulo 3______________________________________________________________________
154
Wegner KM, Reusch TBH, Kalbe M. 2003. Multiple parasites are driving major
histocompatibility complex polymorphism in the wild. Journal Evolutionary Biology
16: 224–232.
Wilson PJ, Grewal S, Rodgers A, Rempel R, Saquet J, Hristienko H, Burrows F, Peterson
R, White BN. 2003. Genetic variation and population structure of moose (Alces alces) at
neutral and functional DNA loci. Canadian Journal of Zoology 81: 670–683.
Wilson K, Grenfell BT. 1997. Generalised linear modelling for parasitologists. Parasitology
Today 13: 33-38.
Zachos FE, Althoff C, Steynitz YV, Eckert I, Hartl GB. 2007. Genetic analysis of an
isolated red deer (Cervus elaphus) population showing signs of inbreeding depression.
European Journal of Wildlife Research 53: 61-67.

Capítulo 4
Expresión diferencial de genes relacionados con respuesta inmune en ciervos infectados y no infectados, expuestos de forma natural a Mycobacterium bovis
Expresión génica diferencial de genes implicados en la respuesta inmune e inflamatoria en linfonodos mesentéricos de ciervo ibérico (Cervus
elaphus hispanicus) infectado de forma natural con Mycobacterium bovis “Differential expression of inflammatory and immune response
genes in mesenteric lymph nodes of Iberian red deer (Cervus elaphus hispanicus) naturally infected with Mycobacterium bovis”
José Ardaiz


___________________________________________________________________Tesis Doctoral
157
Expresión génica diferencial de genes implicados en la respuesta inmune e
inflamatoria en linfonodos mesentéricos de ciervo ibérico infectado de forma
natural con Mycobacterium bovis
Resumen
Se dispone de muy poca información sobre la expresión de genes en infecciones
micobacterianas naturales en especies de fauna salvaje. El ciervo ibérico puede actuar como
reservorio de Mycobacterium bovis en España, aumentando así el riesgo de la tuberculosis
bovina (TBb) en seres humanos y en la cabaña ganadera. En este trabajo se caracteriza la
expresión diferencial de genes de la respuesta inmune e inflamatoria en linfonodos
mesentéricos de ciervos infectados de forma natural con M. bovis usando la hibridación con
un microarray. Estos resultados fueron validados con la determinación de concentraciones
de proteínas séricas y/o de RT-PCR en tiempo real. De los 600 genes analizados en el
microarray, 17 mostraron una expresión 1.7 veces mayor en ciervos infectados o no
infectados (Pp≤0.05). Estos genes incluían proteínas de unión, IL-11R, bactenecina,
CD62L, CD74, el desmogleina, IgA e IgM, lo que constituye nuevos hallazgos y sugiere
nuevos mecanismos por los que M. bovis podría modular la respuesta inmunitaria e
inflamatoria del hospedador. Estos resultados contribuyen al conocimiento básico de los
mecanismos de patogénesis e inmunitarios de las infecciones micobacterianas naturales,
pudiendo tener implicaciones importantes en el control de la TBb.

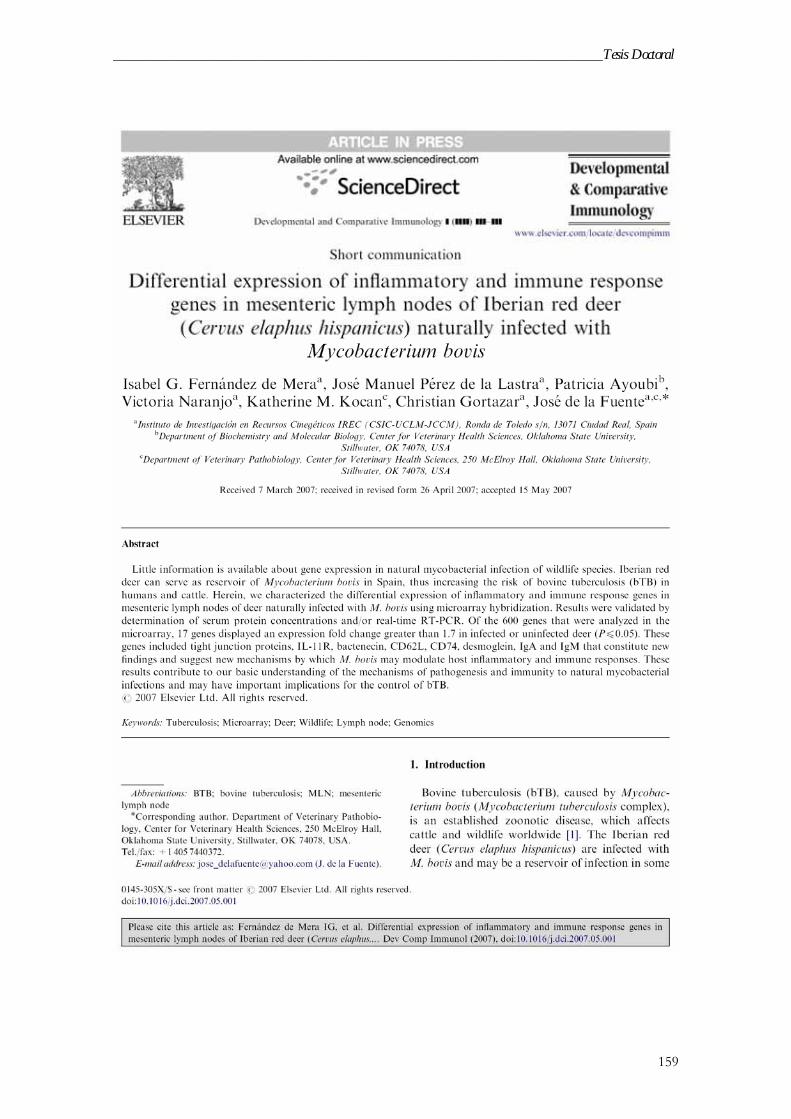
___________________________________________________________________Tesis Doctoral
159

Capítulo 4______________________________________________________________________
160

___________________________________________________________________Tesis Doctoral
161

Capítulo 4______________________________________________________________________
162

___________________________________________________________________Tesis Doctoral
163

Capítulo 4______________________________________________________________________
164

___________________________________________________________________Tesis Doctoral
165

Capítulo 4______________________________________________________________________
166

___________________________________________________________________Tesis Doctoral
167
Appendix A. Tabla S1. Datos suplementarios
Supplementary material for Fernández de Mera et al. Table S1. Genes with ≥ 50% good spots differentially expressed in M. bovis-infected and uninfected deer.
Gene ID and Descriptiona Ave Log2 Ratiob Fold Changec % Good Spotsd SDe CVf P-valueg AJ313187: Z02 2,1165473 4,3365486 100 1,015 0,479 0,000022M20818: interleukin 2RA (CD 25 or Tac a 1,2718945 2,4147846 56 1,288 1,026 0,000849X54962: casein kinase II 1,1596878 2,2340908 89 1,183 1,032 0,000466AJ313182: occludin 1,0464072 2,0653799 56 1,7 1,744 0,054658L46854: bactenecin (SMAP-29) 1,0361277 2,0507160 78 1,287 2,406 0,010038L20311: J chain 1,0357869 2,0502316 100 0,907 0,852 0,000172X59994: Immunoglobulin M 0,9969873 1,9958278 56 0,373 0,374 0,000000U32324: interleukin 11RA 0,9337036 1,9101734 100 0,423 0,452 0,000001AF024645: Immunoglobulin A 0,8600808 1,8151400 100 0,819 0,956 0,000487NM_018402: interleukin 26 0,7156695 1,6422452 100 0,47 0,946 0,015624X97608: Cathelicidin -6 0,7079274 1,6334558 67 1,333 1,88 0,050291AF224266: interleukin 20 0,6992525 1,6236633 67 0,567 1 0,001629AB004061: Stat 2 0,6608464 1,5810099 78 0,702 1,042 0,001744AB011010: trappin 6 0,6505333 1,5697484 89 1,203 2,593 0,069446L34270: CD62P (P-selectin/PECAM) 0,6422356 1,5607459 56 1,416 2,962 0,130226X97609: Cathelicidin -5 0,6409421 1,5593471 100 0,38 0,704 0,000731U38942: neuropeptide Y receptor 3 0,6373422 1,5554609 56 0,994 1,373 0,085701AF105370: beta-defensin 12,4,1,2,5 0,6172958 1,5339971 78 0,613 0,904 0,020899M57765: interleukin 11 0,5946227 1,5100776 100 0,223 0,375 0,001722U14944: ENaC-alpha 0,5891831 1,5043947 89 0,384 0,763 0,001182AF290886: DC-SIGN 0,5831889 1,4981571 78 0,565 0,958 0,001796NM_011414: SLPI 0,5793917 1,4942190 89 0,692 1,688 0,019130M13973: protein kinase C 0,5640252 1,4783883 100 0,3 0,488 0,000103TC133381: Complement Factor D 0,5538633 1,4680115 100 1,013 1,829 0,046958AF010231: laminin A1 0,5366160 1,4505661 67 1,131 2,253 0,069140M14362: CD2 0,5344889 1,4484289 100 0,689 1,852 0,030645M89787: insulin-like growth factor 1 0,5317885 1,4457204 100 1,317 2,476 0,084070X54110: Immunoglobulin kappa chain 0,5141518 1,4281542 67 0,649 0,997 0,020286D16680: c-kit 0,5112174 1,4252524 67 0,666 1,327 0,008096AF254069: interleukin 21 0,4982537 1,4125028 89 0,59 1,178 0,005212AB039957: CD166 (ALCAM) 0,4946195 1,4089491 67 0,693 11,361 0,114301AF068837: caspase 3 0,4786211 1,3934112 100 0,736 1,559 0,023765U60601: bactenecin 5 0,4722233 1,3872456 100 0,87 1,843 0,039880AF025303: insulin-like growth factor 1 0,4633570 1,3787462 56 1,209 3,368 0,239020E00135: interferon a3 0,4545287 1,3703351 78 0,827 2,047 0,040971Z48469: CD154 (CD40 ligand) 0,4542968 1,3701148 67 0,868 1,736 0,059371U31628: interleukin 15RA 0,4515390 1,3674982 100 0,555 1,225 0,010850M12807: CD4 0,4468372 1,3630488 67 0,677 1,45 0,032035AJ251357: MHC class II DYA 0,4450659 1,3613763 56 0,957 2,334 0,082592AF270512: lutheran glycoprotein 0,4412721 1,3578010 56 0,601 1,884 0,028399BM433105: Complement C1q alpha 0,4393046 1,3559505 78 0,438 1,005 0,004062U63311: leukaemia inhibitory factor 0,4305380 1,3477361 56 0,768 1,833 0,108379L46854: bactenecin (SMAP-29) 0,4298294 1,3470742 78 1,287 2,406 0,150503AJ276489: Stat 3 0,4283013 1,3456482 67 0,681 2,948 0,051987X59068: interferon alpha-II Amy 49 0,4222415 1,3400079 100 0,744 1,738 0,033549AF113925: NOD1 0,4157125 1,3339573 89 0,462 1,855 0,050925AF162274: Complement C7 0,4116294 1,3301873 78 0,565 1,865 0,040313M25897: platelet factor 4 human 0,4055457 1,3245899 56 0,686 1,677 0,064255AF079765: polycomb ECP1 0,4050970 1,3241779 67 0,504 20,16 0,335014AW652849: interleukin 10 receptor 0,4042202 1,3233734 67 1,057 2,977 0,250990AF317803: erythroid associated factor A21 0,4034037 1,3226246 67 0,907 1,98 0,115339AY026859: SOCS3 (suppressor of cytokine 0,3882777 1,3088300 67 0,61 1,658 0,130997AF245702: TLR7 0,3823598 1,3034722 78 0,482 1,272 0,019334AB055841: CD49d 0,3762137 1,2979310 67 0,117 0,669 0,124075U59863: TRAF1 0,3736538 1,2956300 100 0,362 0,774 0,019443Y18205: FcERa 0,3720600 1,2941995 67 0,522 1,434 0,026348M89789: insulin-like growth factor 2 0,3699675 1,2923237 89 0,503 1,74 0,036824U76873: MAP kinase 0,3693372 1,2917593 56 1,051 2,695 0,185479M25897: CXCL4 0,3666177 1,2893265 56 0,749 2,035 0,084985NM_005283: CCXCR1 0,3631229 1,2862070 100 0 0 0,031054AF213396: fibroblast growth factor 10 0,3626400 1,2857766 89 0,428 1,166 0,020326U09861: HSP70 0,3566516 1,2804506 56 0,658 2,129 0,078124CB222525: CD19 0,3499005 1,2744727 78 0,332 1,328 0,042286AF109158: Duffy chemokine 0,3469469 1,2718662 78 0,844 2,425 0,102815AW428020: interleukin 7 receptor 0,3448402 1,2700103 89 0,436 1,29 0,084581Y09471: Cathelicidin -3 0,3410790 1,2667037 56 0,541 2,847 0,081365F14582: CD35 (CR1) 0,3391961 1,2650515 56 0,278 1,645 0,078302TC139946: Complement C8b 0,3387115 1,2646266 89 0,482 2,181 0,094662L41844: ICAM-3 0,3342884 1,2607554 78 0,577 1,702 0,056159U53484: thromboxane A2 receptor 0,3247331 1,2524327 78 0,549 5,49 0,206034AF279437: interleukin 22 0,3131278 1,2423983 67 1,021 3,57 0,246627

Capítulo 4______________________________________________________________________
168
Table S1. Cont AF349458: CD49d (integrin alpha 4) 0,3040675 1,2346204 89 0,493 1,638 0,162970AF207860: bradykinin receptor 0,3035560 1,2341827 100 0,543 1,892 0,066439D16412: B cell receptor 0,3008653 1,2318831 89 0,598 2,743 0,117438AF349462: integrin beta 3 0,3001702 1,2312896 67 0,571 5,387 0,140904AF214525: MHC class I LMP7 0,2982169 1,2296237 100 0,602 2 0,089144L31581: CCR7 (G protein-coupled receptor) 0,2980183 1,2294545 78 0,509 3,242 0,118063U65979: interferon alpha/beta receptor 0,2822548 1,2160941 100 0,479 2,207 0,086624TC129928: interleukin 17 0,2816781 1,2156080 56 0 0 0,307782U16261: interleukin 24 (MDA-7) 0,2801662 1,2143348 67 0,929 3,117 0,233665AY040566: interleukin 22 binding protein 0,2778884 1,2124191 100 0,206 1,364 0,047074U85589: interleukin 2R alpha chain 0,2650914 1,2017121 67 0,259 2,123 0,130594M59818: GCSF receptor 0,2590437 1,1966852 56 0,665 2,578 0,174251X60149: interleukin 2RB 0,2590275 1,1966718 78 0,76 5,891 0,245992S63356: interleukin 9 0,2589436 1,1966022 56 0,515 2,164 0,116008Y13248: CXCR6 0,2589176 1,1965806 100 0,427 1,271 0,097625AF245219: DC-SIGNR 0,2559262 1,1941021 89 0,537 2,131 0,121130U77845: TRIP 0,2544895 1,1929136 89 0,349 1,369 0,062242BE480577: GMCSFRa/b (BARC 5BOV 5) 0,2541097 1,1925995 56 0,492 2,016 0,252485L36232: transforming growth factor alpha 0,2537522 1,1923041 100 0,553 4,127 0,203141X54183: macrophage scavenger receptor 0,2468419 1,1866067 56 0,214 0,82 0,203480NM_010553: interleukin 18 receptor activated protein 0,2427183 1,1832200 67 0,299 8,081 0,305215M15477: interferon beta1 0,2386643 1,1798997 56 0,483 4,391 0,064399Z28518: MHC class II DQA cosmid 39.1 0,2367960 1,1783727 56 0,676 2,889 0,270525AF110317: MHC class I TAP2 partial 0,2295752 1,1724897 100 0,486 1,573 0,221134AF215981: CCR10 0,2196108 1,1644194 89 0,649 2,617 0,243394Y08133: mast cell protease-2 0,2195368 1,1643597 67 0,503 2,418 0,198128J04196: p21 Ras 0,2190527 1,1639690 56 0 0 0,238751M15479: interferon beta3 0,2188676 1,1638197 89 1,04 4,749 0,362899AF110028: proteasome subunit LMP2 0,2182231 1,1632999 89 0,808 3,741 0,369072AF063109: carboxypeptidase E 0,2153223 1,1609632 78 0,364 1,19 0,165094L04797: secretory component 0,2018882 1,1502027 89 0,493 1,536 0,290504AJ313183: Z01 (tight junction protein 1) 0,1999090 1,1486259 56 0,705 2,217 0,361483AF254067: interleukin 21R 0,1961086 1,1456041 89 0,593 15,605 0,402615AB047030: beta-neuronatin 3 0,1926227 1,1428394 67 0,52 6,933 0,308470AF069053: SUG1 0,1851549 1,1369390 100 1,145 8,419 0,497455U62124: leptin receptor 0,1851209 1,1369122 56 0,758 3,867 0,335000TC133725: Complement Factor B 0,1820845 1,1345219 67 0,526 2,711 0,243203AF245704: TLR9 0,1815892 1,1341325 100 0,497 2,644 0,260354U10089: interleukin 7 0,1729635 1,1273719 56 0,823 4,378 0,423658AJ133642: prostaglandin D2 synthase 0,1726629 1,1271370 78 0,752 4,132 0,408825AF310951: TLR2 0,1715992 1,1263063 78 0,447 4,912 0,304222AF170490: fibroblast growth factor receptor 0,1714800 1,1262133 89 0,479 9,58 0,344306U68486: prostaglandin H synthase 0,1711841 1,1259822 67 0,326 1,663 0,324342AB070717: interferon-gamma-inducible protein 0,1690835 1,1243440 78 0,706 4,331 0,403034NM_005508: CCR4 0,1689571 1,1242455 100 0,35 1,598 0,214552X98240: CD13 0,1657657 1,1217613 78 0,46 460 0,373101E00136: interferon a4 0,1609322 1,1180093 78 0,506 3,329 0,321783S67956: monocyte chemoattractant protein 0,1604512 1,1176366 56 0,21 2,625 0,493337AF000362: enteric prepro-beta-defensin 0,1597885 1,1171233 67 0,933 3,029 0,565035Y15747: c-fos 0,1586000 1,1162034 89 0,521 3,361 0,319664AF458059: interleukin 25 0,1574579 1,1153202 89 0,583 14,575 0,433224M84356: Immunoglobulin E 0,1564372 1,1145314 89 0,881 5,372 0,504621S52657: insulin-like growth factor binding protein 0,1554445 1,1137647 78 0 0 0,559794AY050252: MIP1 alpha 0,1550106 1,1134298 56 0,262 1,016 0,289270AF180389: PrP 0,1527695 1,1117015 89 0,403 2,634 0,264435AF228446: interferon regulatory factor 0,1500318 1,1095940 56 0,425 3,269 0,313435AF196327: interferon tau 0,1492421 1,1089867 100 0,567 3,831 0,403234U35038: interleukin 5 0,1441320 1,1050656 56 0,403 2,963 0,570035X52993: CD3 delta 0,1415621 1,1030989 67 0,667 39,235 0,513459AJ291475: CD86 0,1415072 1,1030569 89 0,417 2,957 0,303748X59067: interferon alpha-1 Amy 124 0,1401288 1,1020035 100 0,866 1,942 0,679415AF141017: FcgN 0,1380518 1,1004181 89 0,732 4,946 0,472233X72308: macrophage chemoattractant protein 0,1365648 1,0992845 89 0,527 3,711 0,386897AF349461: CD29 0,1362806 1,0990679 100 0,662 4,868 0,476186M97935: Stat 1 0,1324807 1,0961770 89 0,377 1,545 0,388963BE693211: Complement C6 0,1292080 1,0936931 78 0,416 2,993 0,335259AB042274: CD6 0,1255350 1,0909122 89 0,403 10,605 0,424054J03599: prostaglandin G/H synthase 0,1236718 1,0895042 67 0,495 3,367 0,388071D87918: macrophage-colony stimulating factor 0,1234585 1,0893432 67 0,845 5,951 0,606271AF213380: fibroblast growth factor receptor 0,1204285 1,0870577 89 0,637 4,977 0,506033U65978: interferon alpha/beta receptor 0,1190204 1,0859972 89 0,789 2,3 0,702467AF004944: cyclooxygenase-2 0,1182540 1,0854204 67 0,371 7,894 0,435934AJ308426: interleukin 12R beta2 0,1165467 1,0841367 89 0,838 7,351 0,604661U75250: beta defensin 1 0,1141475 1,0823353 89 0,877 6,695 0,690769M13439: fibroblast growth factor - acid 0,1136542 1,0819653 89 0,384 3,459 0,376804

___________________________________________________________________Tesis Doctoral
169
Table S1. Cont AB031323: matrilysin 0,1096074 1,0789346 78 0,281 1,319 0,424250X98697: Complement Factor H 0,1083079 1,0779632 78 0,468 3,714 0,459662U88540: TLR1 0,1068969 1,0769094 56 0,803 8,543 0,657926X52945: heparin-binding growth factor 0,0933369 1,0668349 89 0,892 10,747 0,689893X14150: transforming growth factor-beta 0,0925664 1,0662653 67 0,208 5,073 0,408170D50323: elafin 0,0914168 1,0654159 56 0,561 3,281 0,619358AF144097: Mcl-1 partial 0,0899696 1,0643477 100 0,313 2,675 0,540388AY124007: TLR3 0,0894395 1,0639568 100 0,525 5,899 0,676862AF383946: caspase 13A 0,0894314 1,0639508 78 0,956 13,278 0,712695M36271: transforming growth factor-beta 0,0885571 1,0633062 89 0,551 6,407 0,589629D84333: Complement C5 0,0796740 1,0567792 67 0,606 8,417 0,735366U57745: CD40 0,0796226 1,0567415 78 0,535 6,688 0,709887AB008156: Complement C8a 0,0787335 1,0560905 89 0,356 7,12 0,622989S51402: CD3 eta 0,0765921 1,0545241 67 0,294 1,246 0,642895Z49058: Complement Factor D 0,0752918 1,0535741 56 1,228 3,601 0,755311AJ131185: histamine H2 receptor 0,0718096 1,0510342 78 0,496 12,4 0,703523AB020984: Stat 4 0,0707842 1,0502874 78 0,552 5,935 0,654937AF132036: CD16 (FcgRIII) 0,0699049 1,0496475 89 0,32 11,852 0,682464U87539: annexin 6 0,0689123 1,0489255 56 0,357 5,409 0,595019AF072807: interleukin 13 0,0673914 1,0478203 89 0,604 31,789 0,684792D16109: phospholipase A2 receptor 0,0641472 1,0454667 100 0,547 8,415 0,739796M26809: nerve growth factor 3 0,0595233 1,0421213 67 0,558 27,9 0,736506AF092533: granulocyte colony-stimulating factor 0,0588409 1,0416286 78 0,697 5,957 0,810120Z46236: keratinocyte growth factor 0,0580796 1,0410790 89 0,498 9,396 0,740571Z29533: MHC class II DN A 0,0576321 1,0407562 100 0,806 15,208 0,795600AF223942: iNOS 0,0573010 1,0405173 100 0,862 4,585 0,802761Z14137: tumour necrosis factor-beta 0,0542370 1,0383098 78 0,513 9,5 0,736951AF213398: c-met 0,0501904 1,0354016 67 0,473 9,653 0,769552M98498: Ezrin 0,0497445 1,0350816 67 0,549 8,318 0,786922Z12963: T cell receptor Cd 0,0497379 1,0350769 78 0,528 21,12 0,778823AF288823: Complement C1s 0,0469148 1,0330534 67 0,726 4,84 0,823203AF141313: CD14 0,0468390 1,0329991 67 0,856 11,889 0,856123AY124008: TLR9 0,0451415 1,0317844 89 0,294 4,523 0,774674AB011671: CD95 (fas) 0,0373092 1,0261981 78 0,332 4,548 0,812326unsub: tumour necrosis factor receptor 0,0359676 1,0252442 56 0,703 26,037 0,852785X60167: interleukin 1 alpha 0,0357068 1,0250589 78 0,424 12,471 0,793782AF228059: CD55 0,0344764 1,0241850 78 0,413 7,121 0,842344U20418: CF transmembrane conductance receptor 0,0333400 1,0233786 78 0,489 20,375 0,826315AF109677: MHC class II LMP7 0,0321305 1,0225210 89 1,419 15,767 0,939254M25648: oxytocin 0,0320319 1,0224511 67 0,647 18,486 0,894356U28934: CX3CR1 0,0296399 1,0207573 67 0,813 38,714 0,893201U76739: nNOS 0,0282879 1,0198012 78 0,489 27,167 0,861046M84747: interleukin 9R 0,0273264 1,0191218 78 0,466 5,065 0,886103AF417637: annexin 8 0,0238155 1,0166446 89 0,632 18,588 0,890453X68149: CXCR5 0,0232723 1,0162619 78 0,663 10,694 0,901463Z24681: erythropoeitin 0,0220732 1,0154176 67 0,654 34,421 0,903420AB055312: cathepsin D 0,0219746 1,0153482 100 0,247 2,186 0,898763L42977: bactenecin 7 0,0207005 1,0144519 100 0,886 24,611 0,926681AF354057: Lymphotactin precursor (SCYA1) 0,0183629 1,0128095 89 0,465 5 0,916507AJ007043: RANTES 0,0174243 1,0121508 78 0,35 4,795 0,906227L06320: interferon alpha receptor 0,0163398 1,0113903 67 0,875 17,157 0,937167NM_145751: TRAF4 0,0151858 1,0105816 78 0,752 10,592 0,927410NM_021258: interleukin 22 receptor 0,0151618 1,0105648 78 0,327 3,442 0,915877M33304: MHC class II DQ A1 3 0,0096239 1,0066931 67 0,611 3,942 0,966105U88329: Mx-1 0,0094438 1,0065674 56 0,386 18,381 0,961504L03546: urokinase-type plasminogen activator -0,0014380 -1,0009972 100 0,459 5,961 0,992169Z28424: MHC class II DQB1 cosmid 39.1 -0,0047868 -1,0033235 100 0,869 86,9 0,982513M15477: interferon beta1 -0,0056037 -1,0038917 56 0,483 4,391 0,981826AX244221: CCR11 -0,0074856 -1,0052021 56 0,314 44,857 0,951468AF165719: Stat 5 -0,0103439 -1,0071956 89 0,386 7,018 0,942178AF215907: interleukin 18 binding protein -0,0163883 -1,0114242 89 0,475 27,941 0,911298BF075672: CD27 MARC 2BOV -0,0182552 -1,0127339 67 0,552 19,714 0,912198AF307971: CD62E (E-selectin/ELAM) -0,0192835 -1,0134560 78 0,509 4,072 0,918728M96651: interleukin 5 receptor -0,0231794 -1,0161965 67 0,425 2,237 0,904556AF287008: TREM 1 -0,0260384 -1,0182123 78 0,261 2,806 0,838190AF092740: CD152 -0,0292490 -1,0204808 67 0,935 66,786 0,903155AY029231: erythropoeitin receptor -0,0303154 -1,0212354 56 0,387 3 0,865001X75671: CD32 (FcgRII) -0,0365878 -1,0256850 78 0,469 2,727 0,848578NM_003855: interleukin 18 receptor -0,0392743 -1,0275968 67 0,38 8,837 0,766431AY040367: interleukin 19 -0,0418726 -1,0294492 78 0,476 8,815 0,842274Z12967: T cell receptor Cy4 -0,0442481 -1,0311456 100 0,79 9,753 0,848792TC143747: Complement C2 -0,0445369 -1,0313521 89 0,595 24,792 0,792162M21097: CD19 -0,0472821 -1,0333164 67 0,585 14,625 0,841225Y09950: CD80 -0,0477968 -1,0336851 67 0,284 2,869 0,702889AF149249: granulocyte chemotactic factor -0,0482663 -1,0340216 78 1,181 6,827 0,898487

Capítulo 4______________________________________________________________________
170
Table S1. Cont U19947: interleukin 8 receptor (CXCR1) -0,0503875 -1,0355430 67 0,536 12,465 0,768282AF327651: insulin-like growth factor binding protein -0,0527510 -1,0372409 67 0,446 5,868 0,756543L26547: CDK1 -0,0616181 -1,0436356 67 0,644 12,385 0,732137AF038131: CD21 (CR2) -0,0648547 -1,0459796 78 0,396 9,9 0,678884AY197339: insulin-like growth factor binding protein -0,0685470 -1,0486600 78 0 0 0,699614AF164518: bak -0,0686024 -1,0487003 67 0,709 8,542 0,714164AF272828: CD69 -0,0727725 -1,0517359 100 0,654 46,714 0,695942AF134814: ceruloplasmin -0,0738614 -1,0525300 67 0,631 8,195 0,674597M73245: interferon omega -0,0753808 -1,0536391 67 0,576 8,348 0,694548AF305562: peroxiredoxin 2 -0,0788966 -1,0562099 78 0,368 2,103 0,601501AF298809: calpain 3 -0,0790984 -1,0563577 89 0,399 5,466 0,554100TC142843: Complement C1s -0,0791158 -1,0563704 78 0,225 0,869 0,619729AJ313188: Z01 (tight junction protein 1) -0,0811055 -1,0578283 78 0,572 2,542 0,692531D14085: conglutinin -0,0823540 -1,0587441 89 0,451 3,027 0,528976X06367: a-lactalbumin -0,0847789 -1,0605252 100 0,33 1,602 0,585506AF004024: interleukin-12 p40 -0,0860873 -1,0614875 78 0,244 27,111 0,599253AF173557: interleukin 12p35 -0,0863228 -1,0616608 89 0,562 11,957 0,685027D76416: MHC class II DM A -0,0881955 -1,0630397 89 0,555 7,115 0,651062U33748: interleukin 2RG -0,0912937 -1,0653251 89 0,534 2,825 0,653066Z28422: MHC class II DQ B1/2 -0,0913938 -1,0653990 89 0,612 3,171 0,613883C94604: Complement C1r -0,0924180 -1,0661556 78 0,567 15,75 0,635763AJ278010: Prnpd dopple -0,0928608 -1,0664829 100 0,744 6,47 0,628283Z12968: CD3 zeta -0,0972045 -1,0696987 100 0,65 6,019 0,578015AF105370: beta-defensin 12,1,2,4 -0,0980057 -1,0702929 78 0,518 5,286 0,611836AF252548: galectin -0,0999248 -1,0717176 78 0,532 5,32 0,512700S78869: mucin -0,1004377 -1,0720987 67 0,383 19,15 0,539720AF071015: vascular endothelium growth factor -0,1030918 -1,0740728 89 0,631 5,584 0,564869L36136: fibroblast growth factor 2 -0,1054072 -1,0757980 67 0,427 1,817 0,574008L25886: CD49b -0,1062292 -1,0764111 78 0,386 2,169 0,489245X52994: CD3 gamma -0,1077351 -1,0775353 67 0,479 2,36 0,534974M55622: T cell receptor Ca VJC region -0,1117335 -1,0805258 78 0,735 2,732 0,620946U45984: CCR6 -0,1120286 -1,0807468 89 0,729 7,439 0,581321X66999: Complement C4 -0,1144659 -1,0825742 100 0,226 1,378 0,302262M81129: superoxide dismutase -0,1171908 -1,0846208 100 0,333 1,86 0,395144AF251146: alpha-tubulin -0,1185797 -1,0856655 89 0,369 3,101 0,338153U26024: pigpen -0,1198762 -1,0866416 78 0,58 4,874 0,495095U88879: TLR3 -0,1210345 -1,0875144 78 0,467 3,924 0,432865AF283892: NFkB -0,1218005 -1,0880919 56 0 0 0,700763AF282985: Flt3l (isoform 1) -0,1249370 -1,0904601 78 0,652 5,216 0,494243D17395: prostaglandin F2a receptor -0,1279991 -1,0927770 67 0,331 1,663 0,316175AF109199: chloride channel p64 -0,1289512 -1,0934985 100 0,353 2,736 0,473081M82802: annexin XI -0,1299124 -1,0942273 100 0,559 24,304 0,494105BG937885: CD59 -0,1309320 -1,0950009 78 0,622 4,859 0,459274AJ297965: integrin beta 3 -0,1322270 -1,0959842 100 0,501 2,227 0,444547AB000509: TRAF5 -0,1342138 -1,0974946 56 0,375 2,641 0,303528Y12420: peroxisome proliferator-activator -0,1393386 -1,1014000 56 0,331 2,527 0,558292Z13986: T cell receptor Cy5 -0,1403168 -1,1021471 78 0,576 4,8 0,406119Z28523: MHC class II DQB2 cosmid 9 -0,1412669 -1,1028732 56 0,949 4,721 0,545997AF210380: nexin -0,1413969 -1,1029726 67 0,296 1,109 0,329139AF081273: interleukin 4RA -0,1415087 -1,1030580 89 0,394 1,498 0,421346AF296673: Toll-like receptor 10 -0,1423291 -1,1036855 100 0,505 1,863 0,453577BE685522: interleukin 6 receptor -0,1454845 -1,1061020 67 0,411 2,957 0,306426AJ439062: integrin beta 6 -0,1468736 -1,1071676 67 0,408 2,935 0,293966AF241243: T-bet -0,1469975 -1,1072626 78 0,276 0,942 0,396183AF327650: insulin-like growth factor binding protein -0,1471368 -1,1073696 100 0,532 4,189 0,360661BM431251: Complement C5 -0,1498041 -1,1094188 89 0,636 4,609 0,385609U52221: melatonin-related receptor -0,1517190 -1,1108923 89 0,512 3,346 0,398177X56972: interleukin 1 beta -0,1534449 -1,1122221 100 0,619 1,799 0,476520AF213397: hepatocyte growth factor -0,1571508 -1,1150828 67 0,443 1,885 0,329043U97485: transforming growth factor-beta -0,1594198 -1,1168379 67 0,364 1,625 0,265748L36854: mucin-like glycoprotein (GLYCAM) -0,1614294 -1,1183947 67 0,769 5,093 0,449309M81233: CD18 -0,1618270 -1,1187030 100 0,355 2,191 0,217730BE750305: CD8 beta -0,1683320 -1,1237585 67 0,574 4,071 0,299093U16031: Stat 6 -0,1691858 -1,1244237 89 0,676 4,361 0,359329U17836: ribosomal protein P2 -0,1695531 -1,1247100 78 0,359 1,973 0,320793Z12966: T cell receptor Cy3 -0,1709271 -1,1257817 67 1,238 7,987 0,583451F14494: Complement C9 -0,1741246 -1,1282796 100 0,473 2,718 0,367204M64923: C10 (laminin receptor) -0,1751473 -1,1290796 78 0,481 28,294 0,400414M73983: MHC class II DR A -0,1768757 -1,1304332 67 0,461 2,918 0,435115AF329970: CD150 (SLAM) -0,1777426 -1,1311126 89 0,653 65,3 0,471504AJ132003: eotaxin -0,1796636 -1,1326197 100 0,449 2,494 0,384064AF228061: DAF -0,1821906 -1,1346054 89 0,538 2,989 0,314263TC135908: Complement C1q receptor -0,1847450 -1,1366160 89 0,512 1,369 0,429931M11507: CD71 (transferrin receptor) -0,1851336 -1,1369223 56 0,399 4,03 0,272156AB021662: CD34 -0,1854558 -1,1371762 100 0,336 1,077 0,289118

___________________________________________________________________Tesis Doctoral
171
Table S1. Cont J03143: interferon gamma receptor -0,1868159 -1,1382487 78 0,351 1,819 0,213545AB038383: Stat 6 -0,1884674 -1,1395525 67 0,295 1,372 0,329040AF233077: Flt-1 (VEGFR) -0,1917157 -1,1421211 67 0,494 2,823 0,222483BF601810: CD11c -0,1925322 -1,1427678 89 0,437 1,379 0,320327AF239241: fibroblast growth factor 7 -0,1959769 -1,1454996 56 0,3 1,515 0,131659AF284499: C5a receptor -0,1970367 -1,1463413 78 0,395 1,348 0,215157U26010: MHC class I antigen gene, alpha -0,1975062 -1,1467145 100 1,159 23,653 0,530906AF030379: Flt-4 -0,2016193 -1,1499884 89 0,472 4,538 0,225958AB099893: CXCR3 -0,2061243 -1,1535850 78 0,513 2,29 0,299874Z12969: CD3 epsilon -0,2105409 -1,1571219 67 0,522 1,657 0,245086AF399642: CXCR4 -0,2126660 -1,1588276 56 0,563 1,671 0,281367J03137: phosphoinositide-specific phosphatase -0,2136232 -1,1595967 100 0,493 1,409 0,270723AJ006722: CD1 D -0,2142007 -1,1600610 78 0,481 2,369 0,188724AF005380: NRAMP1 -0,2183837 -1,1634294 89 0,369 1,281 0,136957X59416: CD8 alpha -0,2205399 -1,1651695 100 0,785 3,204 0,269636AF149700: interleukin 15 -0,2212956 -1,1657801 67 0,419 1,1 0,276720X12497: interleukin 1 alpha -0,2233108 -1,1674096 78 0,35 0,994 0,134076AF008307: beta-defensin 4,2,1,12 -0,2304960 -1,1732383 67 0,495 2,152 0,252962M74782: interleukin 3 receptor A -0,2323140 -1,1747176 56 0,464 7,484 0,243240M18243: cyclooxygenase-1 -0,2357033 -1,1774806 78 0,284 11,833 0,360426AB055107: pBAM-2 adrenomedullin-1 -0,2370238 -1,1785588 100 0,844 3,336 0,278952Z27401: MHC class II DYB exon 3 -0,2441263 -1,1843753 100 0,698 2,861 0,313653AJ010711: perforin -0,2456542 -1,1856303 56 0,858 4,105 0,409458L03545: Urokinase receptor -0,2461889 -1,1860698 56 0,812 3,087 0,272255Af143722: CD23 -0,2704065 -1,2061477 67 0,468 1,272 0,094047X51689: macrophage scavenger receptor t -0,2747963 -1,2098232 67 0,601 1,287 0,245095AJ400864: CD45 -0,2778193 -1,2123610 67 0,558 2,067 0,094705AF461422: interleukin 23 receptor -0,2797491 -1,2139837 89 0,662 2,443 0,132371U03882: CCR2 -0,2821954 -1,2160440 89 0,83 3,074 0,211925AY077840: macrophage inflammatory protein -0,2838224 -1,2174161 78 0,405 0,938 0,087376AF310952: TLR4 -0,2883202 -1,2212175 67 0,493 1,833 0,066657Af266468: CCR3 -0,2932285 -1,2253794 78 0,652 2,38 0,244972X95876: CXCR3 -0,2941369 -1,2261512 67 0,564 1,945 0,116658AF019384: scavenger receptor class B -0,3063447 -1,2365707 78 0,424 1,804 0,052085AF099674: platelet activating factor receptor -0,3072332 -1,2373325 56 0,391 1,245 0,057226Z37506: FcG2R -0,3081642 -1,2381312 78 0,562 2,044 0,080779X60065: beta-2-gpI mRNA for beta-2-glycoprotein -0,3096771 -1,2394303 78 0,67 2,012 0,157795NM_003853: interleukin 18 receptor activation protein -0,3114327 -1,2409394 56 0,582 2,035 0,203474AF038130: Complement C3 -0,3219817 -1,2500464 78 0,315 1,265 0,023986Z11520: MHC class II DR B1 -0,3227502 -1,2507125 78 0,955 2,809 0,167882AF210382: annexin 5 -0,3298747 -1,2569042 78 0,533 1,62 0,044174AJ414557: IkB kinase-gamma -0,3300089 -1,2570211 78 0,661 2,021 0,086337AB005287: thrombospondin 1 -0,3300576 -1,2570636 67 0,876 2,647 0,251809L15344: interleukin 14 -0,3331340 -1,2597470 67 0,481 1,411 0,037894U90937: tumour necrosis factor receptor -0,3362618 -1,2624811 67 0,616 2,007 0,063715Y12815: CCBP2 (D6) -0,3405323 -1,2662237 67 0,518 2,977 0,109220Z49880: MHC class II DO B -0,3406361 -1,2663148 56 0 0 0,109980U21092: TRAF3 (CRAF1) -0,3428375 -1,2682485 67 0,357 0,892 0,016957AW353414: CD11b1 -0,3484424 -1,2731853 78 0,532 1,556 0,038822Z12965: T cell receptor Cy2 -0,3494907 -1,2741107 89 0,758 1,681 0,109840M59240: Complement Factor B -0,3565091 -1,2803241 78 0,325 0,7 0,021340AF092739: CD28 -0,3595895 -1,2830608 89 0,627 1,727 0,056131AF251147: vimentin -0,3596835 -1,2831444 100 0,564 2,051 0,047222AF349459: CD49e (integrin alpha 5) -0,3658078 -1,2886029 78 0,522 1,178 0,047853X94298: tyrosine kinase receptor Flk1 -0,3660612 -1,2888293 100 0,445 1,216 0,013387AF257235: eIF-4E -0,3748347 -1,2966910 67 0,991 2,423 0,141616X96540: thrombospondin 2 -0,3756994 -1,2974684 100 0,585 1,556 0,033291L13938: phospholipase C -0,3799192 -1,3012690 89 0,176 0,354 0,051837M15478: interferon beta2 -0,3847455 -1,3056294 89 0,535 1,023 0,051863U89874: stem cell factor (1) -0,3874751 -1,3081021 67 0,35 0,933 0,006358AF076633: pulmonary surfactant-associated protein -0,3901697 -1,3105476 78 0,547 1,413 0,018482L34208: prostaglandin synthase -0,3909997 -1,3113018 67 0,797 4,025 0,135805AF228445: interferon regulatory factor -0,3991559 -1,3187361 78 1,422 3,656 0,268458U57840: CCR5 -0,4118385 -1,3303801 78 0,378 0,892 0,006000AJ250464: CD44 -0,4221649 -1,3399367 100 0,696 1,326 0,053219D78178: annexin 4 -0,4293908 -1,3466648 56 0,444 0,8 0,017024: mptA-F-komplett ABC transporter -0,4333650 -1,3503796 78 0,724 1,68 0,036264AF000137: connective tissue growth factor -0,4415417 -1,3580548 78 0,449 1,035 0,002440AF178930: NOD2 -0,4442737 -1,3606290 78 0,412 2,368 0,107481AF257464: c-jun -0,4489705 -1,3650658 67 0,459 0,983 0,005525AF201926: eNOS -0,4725595 -1,3875690 89 0,579 1,204 0,009224Y11045: Myd-1 (a) -0,4730009 -1,3879935 78 1,128 2,605 0,134022Y00750: prostaglandin endoperoxide synthetase -0,4732590 -1,3882419 100 0,523 1,083 0,011017Z68501: c-myc -0,5004380 -1,4146430 100 0,494 1,202 0,009268M99367: AM-derived chemotactic factor -0,5035137 -1,4176620 67 0,383 0,764 0,014893

Capítulo 4______________________________________________________________________
172
Table S1. Cont U92569: bax-alpha -0,5123968 -1,4264180 78 0,679 2,135 0,044482AF119571: macrophage migration inhibition factor -0,5132894 -1,4273008 100 0,398 0,776 0,008199BF654844: CD11a (LFA-1 alpha chain) MAR -0,5170119 -1,4309883 78 0,5 1,002 0,035777X81705: p53 -0,5332305 -1,4471661 78 0,649 1,363 0,034676BE750928: interleukin 11 receptor -0,5337302 -1,4476674 56 0,643 1,419 0,045786AB005148: interleukin 1RA -0,5723195 -1,4869122 67 0,681 1,027 0,008858AF166488: interleukin 17 -0,5787861 -1,4935920 89 0,656 0,91 0,025523AF140667: stromal-derived factor -0,6024389 -1,5182810 78 0,386 0,643 0,000205AF074402: interleukin 13RA -0,6269478 -1,5442944 67 0,638 1,981 0,063168AF272837: glyceraldehyde 3 phosphate dehydrogenase -0,6337900 -1,5516359 89 0,437 0,771 0,000201E00134: interferon a1 -0,6527473 -1,5721591 78 0,421 0,646 0,000345S77394: insulin-like growth factor-binding protein -0,6613082 -1,5815161 100 0,518 0,935 0,000707Z12964: T cell receptor Cy1 -0,6670001 -1,5877680 67 0,444 0,675 0,000206Z36890: CD1 B (A25) -0,7008676 -1,6254820 89 0,663 0,927 0,000822TC135848: perforin -0,7057366 -1,6309772 56 0,484 0,75 0,008941U95814: GRO -0,7238125 -1,6515406 56 0,486 0,585 0,000406AJ012589: CD63 -0,8113255 -1,7548229 56 0,572 0,707 0,001855X62882: CD62L (L-selectin/LECAM) -0,8389047 -1,7886917 78 0,776 1,121 0,002323AJ318335: FcERg -1,0366877 -2,0515121 67 0,557 0,762 0,003688D83962: CD74 invariant chain -1,0595428 -2,0842709 89 0,85 0,802 0,001943X69797: Immunoglobulin G1 -1,1192732 -2,1723750 100 1,543 1,51 0,007093M58165: desmoglein -1,2949276 -2,4536469 89 1,365 1,452 0,019836X70983: Immunoglobulin G2 -1,4071122 -2,6520577 100 1,448 1,24 0,000770AF109678: small subunit ribosomal RNA -1,4369299 -2,7074409 56 1,508 1,088 0,000709
aAccession number from NCBI and description of the gene represented by the oligo in the spot/feature.
bAverage log2 ratio is the Lowess print-tip normalized ratio (log2(635/532)) of background-corrected means averaged between valid biological replicates (Uninfected/Infected).
cFold change of Lowess print-tip normalized log2 ratio of valid background-corrected means averaged between valid biological replicates (Uninfected/Infected).
dPercent of valid spots between and within slides included in ratio formulation.
eSD is the standard deviation determined from the normalized average log2 ratio.
fCV is the coefficient of variation determined from the normalized average log2 ratio.
gP-value determined from the average log2 ratio using Bioconductor (http://www.bioconductor.org).

Síntesis y Conclusiones


___________________________________________________________________Tesis Doctoral
175
Síntesis
En el presente apartado se exponen de manera sintética las principales conclusiones
del trabajo de tesis, con especial atención a los factores implicados en la respuesta
inmunitaria en el ciervo ibérico.
Capítulo 1.- Factores que intervienen en la respuesta dérmica a la inyección de
antígenos
Los experimentos que componen el primer capítulo de esta tesis han permitido
conocer que la respuesta in vivo al mitógeno fitohemaglutinina y a los derivados
purificados de proteínas micobacterianas en ciervos ibéricos depende principalmente de
dos factores, el sexo y la condición física. En cambio, no se han detectado diferencias
importantes en función de la edad.
Los machos de ciervo tienden a mostrar respuestas de incremento del pliegue
cutáneo mayores que las hembras. Esta diferencia resulta especialmente marcada en
condiciones de granja, presumiblemente porque la limitación de recursos tróficos es mucho
mayor en las poblaciones silvestres que en cautividad. La mayor respuesta a los antígenos
por parte de los machos ha sido comprobada en dos experimentos distintos (trabajos 2 y
3). El otro factor que influye fuertemente en la capacidad del ciervo para responder a las
pruebas de intradermorreacción es su condición física. Esto se ha puesto de manifiesto en
el trabajo 1, donde se comprobó que las hembras de mayor peso (a igualdad de otros
factores) respondían mejor a la fitohemaglutinina que las hembras más ligeras. Este
hallazgo se ha confirmado en el trabajo 3, al observar que los ciervos salvajes,
presumiblemente en peor condición física, responden peor a los antígenos testados que sus
homólogos de granja, mejor alimentados. En cuanto a la ausencia de efecto de la edad
comprobada en el trabajo 2, es importante hacer constar que no han sido testados gabatos.
Esta clase de edad podría tener una capacidad de respuesta diferente a la de los ciervos de
más edad. Los gabatos normalmente no son objeto de testaje intradérmico hasta que
alcanzan su primer invierno de vida, por lo que no fueron incluidos en este estudio.
En el plano más aplicado, estos trabajos contribuyen a la futura puesta a punto de
criterios para la realización de pruebas de intradermorreacción en ciervos en España. Se
trata de una herramienta necesaria en el marco de traslados de fauna silvestre y de la

Síntesis________________________________________________________________________
176
producción en granjas cinegéticas. En el plano más teórico, se aporta información científica
que respalda la hipótesis de que la capacidad de respuesta inmune en el ciervo ibérico está
condicionada por su condición física, particularmente por su estado nutricional (Vicente et
al. 2007 a y b)1,2.
Capítulo 2.- Relación entre condición nutricional y capacidad de respuesta
antiparasitaria
El experimento detallado en el segundo capítulo de esta tesis ha permitido constatar
que la excreción fecal de larvas 1 del nematodo protostrongílido Elaphostrongylus cervi es
mayor en ciervos que se encuentran en peor condición nutricional.
En igualdad de otros factores fisiológicos y ambientales, las ciervas que disponen de
aporte suplementario de alimento presentan niveles de excreción de larvas sensiblemente
inferiores a los que presentan las ciervas no suplementadas. Estos resultados coinciden con
hallazgos anteriores de nuestro grupo, basados en necropsias. En concreto, se conocía que
el tamaño del bazo (un indicador de la capacidad inmunitaria, Corbin et al. 2007)3 varía de
forma inversamente proporcional a los niveles de excreción de E. cervi (Vicente et al. 2007
a)1, y que el tamaño del bazo y la excreción de E. cervi dependen del nivel de engrasamiento
renal, un indicador de condición nutricional (Vicente et al. 2007 a)1. Una novedad
importante es el carácter no invasivo de la técnica de estudio aplicada en esta tesis.
De forma práctica, los resultados obtenidos permiten utilizar los niveles de
excreción de E. cervi (y por extensión posiblemente de otros parásitos en hospedadores
similares) como indicador de condición en poblaciones silvestres. Esta utilidad de los
análisis parasitológicos debe combinarse, en su caso, con otros indicadores del estado de
una población de fauna silvestre (Gortázar et al. 2006)4. Desde un punto de vista evolutivo,
el experimento del capítulo 2 apoya, igual que el capítulo 1, la hipótesis de que la capacidad
de respuesta inmune en el ciervo ibérico está condicionada por su condición física,
particularmente por su estado nutricional (Vicente et al. 2007 a y b)1,2.
Capítulo 3.- El factor genético: Polimorfismo del MHC II en ciervo ibérico
Los estudios sobre polimorfismo del complejo mayor de histocompatibilidad de
clase II en una población aislada de ciervo ibérico, gestionada con fines cinegéticos, han
permitido constatar una variabilidad genética limitada y en regresión, dentro de la cual unos
pocos genotipos aparecen con frecuencia muy superior a la esperada. Algunos de estos

___________________________________________________________________Tesis Doctoral
177
genotipos dominantes resultaron estar asociados a mayores o menores prevalencias de
tuberculosis o de parasitosis.
Además, los resultados obtenidos en el trabajo 6 demuestran que el nivel de
infección de una población de ciervo por un determinado patógeno, por ejemplo
Mycobacterium bovis o Elaphostrongylus cervi, puede variar sensiblemente en función de las
características genéticas de dicha población, y particularmente de los genes del MHC II. El
genotipo, por tanto, debe considerarse como un factor más que modula la relación
patógeno-hospedador en el ciervo ibérico. Estos resultados coinciden en cierta medida con
hallazgos previos en otras especies, como por ejemplo el jabalí (Acevedo-Whitehouse et al.
2005)5.
Los resultados del capítulo 3 tienen implicaciones prácticas en gestión cinegética, ya
que ponen de manifiesto que la variabilidad genética es un factor importante en la relación
patógeno-hospedador, y puede encontrarse limitada o incluso empeorar en poblaciones
valladas como las que abundan en España. Los resultados también tienen aplicación
potencial en la selección a nivel de granjas y en la elección de animales en el marco de
traslados, si bien es importante considerar aspectos éticos y de conservación de la
biodiversidad. Desde el punto de vista teórico, el hallazgo de que determinados tipos de
MHC II están relacionados no sólo con la probabilidad de infección por M. bovis o por
parásitos, sino también con la condición física (engrasamiento renal) y la capacidad
inmunitaria (tamaño del bazo), completa el círculo de los resultados de los primeros dos
capítulos: la capacidad de respuesta inmunitaria estaría mediada (en el ciervo) al menos por
los factores “sexo”, “condición física” y “genotipo”.
Capítulo 4.- Expresión diferencial de genes relacionados con respuesta inmune en
ciervos infectados y no infectados, expuestos de forma natural a Mycobacterium
bovis
El análisis de RNA extraído de linfonodos mesentéricos de ciervos ibéricos ha
detectado diferencias en la expresión de numerosos genes, de entre los 600 genes testados e
implicados en la respuesta inmunitaria o inflamatoria en rumiantes. Entre los genes
identificados, varios tienen relación directa con los mecanismos de respuesta inmunitaria y
el complejo mayor de histocompatibilidad.
La expresión del gen del receptor para la interleucina 2 se encuentra inhibida en
ciervos infectados con M. bovis, lo que sugiere que podría tratarse de un mecanismo por el
que las micobacterias disminuyen la capacidad de respuesta inmunitaria del hospedador.

Síntesis________________________________________________________________________
178
También el gen SMAP-29 que expresa la bactenecina, un péptido antimicrobiano que
participa en la respuesta humoral innata, se encuentra inhibido en los ciervos infectados.
Igualmente, la expresión de los genes de las inmunoglobulinas A, M y G varió entre ciervos
infectados y no infectados, estando sobreexpresadas las de tipo G e inhibidas las de tipo A
y M. La sobreexpresión del gen CD62L en ciervos infectados sugiere capacidad de M. bovis
para alterar la respuesta inmunitaria, en este caso afectando a la función antimicrobiana de
los macrófagos. Finalmente, se ha detectado en ciervos infectados por M. bovis la sobre
expresión del gen de la cadena no variable del MHC-II (CD74). Esta glicoproteina
intracelular no polimórfica evita la unión entre los péptidos y las moléculas de clase II,
regulando por tanto la presentación de antígenos por parte de MHC-II. Esto podría
constituir un mecanismo, hasta ahora desconocido, de las micobacterias para evitar la
respuesta inmunitaria del hospedador.
En el aspecto aplicado, los resultados del capítulo 4 podrían resultar de interés para
la caracterización de la respuesta inmunitaria protectora en ciervo y otros rumiantes, así
como para el desarrollo de vacunas. En el aspecto teórico, los resultados expuestos
sugieren que a los factores ya descritos que modulan la capacidad de respuesta del
hospedador (sexo, condición física y genotipo), cabe añadir las características del agente
patógeno, ya que al menos M. bovis es capaz de interferir algunos de los mecanismos de la
respuesta inmunitaria del ciervo. Estos resultados, junto con los hallazgos recientes en
jabalí (Naranjo et al. 2006 y 2007)6,7 contribuyen al conocimiento de la expresión génica
diferencial en respuesta a la tuberculosis en especies de fauna salvaje que podrían actuar
como reservorio de tuberculosis.
1Vicente J, Pérez-Rodríguez L, Gortázar C. 2007a. Sex, age, spleen size and kidney fat of red deer relative to infection intesnities of the
lungworm Elaphostrongylus cervi. Naturwissenschaften 94: 581-587. 2Vicente J, Höfle U, Fernández-de-Mera IG, Gortázar C. 2007b. The importance of parasite life history and host density in predicting the
impact of infections in red deer. Oecologia 152: 655-664. 3Corbin E, Vicente J, Martín-Hernando MP, Acevedo P, Pérez-Rodríguez L, Gortázar C. Spleen mass as a measure of immune strenght
in mammals. Mammal Review, en prensa. 4Gortázar C, Acevedo P, Ruiz-Fons F, Vicente J. 2006. Disease risks and overabundance of game species. European Journal of Wildlife
Research 52: 81-87. 5Acevedo-Whitehouse K., Vicente J, Gortázar C, Höfle U, Fernández-de-Mera IG, Amos W. 2005. Genetic resistance to bovine
tuberculosis in the Iberian wild boar. Molecular Ecology 14: 3209–3217. 6Naranjo V, Ayoubi P, Vicente J, Ruiz-Fons F, Gortázar C, Kocan KM, de la Fuente J. 2006. Characterization of selected genes
upregulated in non-tuberculous European wild boar as possible correlates of resistance to Mycobacterium bovis infection. Veterinary
Microbiology 116: 224–231. 7Naranjo V, Villar M, Martín-Hernando MP, Vidal D, Höfle U, Gortázar C, Kocan KM, Vázquez J, de la Fuente J. 2007. Proteomic and
transcriptomic analyses of differential stress/inflammatory responses in mandibular lymph nodes and oropharyngeal tonsils of European
wild boars naturally infected with Mycobacterium bovis. Proteomics 7: 220-231

___________________________________________________________________Tesis Doctoral
Conclusiones
1. Siguiendo las pautas descritas en esta tesis, el uso del mitógeno fitohemaglutinina, como medida independiente de la capacidad de respuesta inmunitaria, es adecuado para su empleo en ciervos. 2. El sexo y la condición física son dos factores que afectan a la intensidad de la respuesta del ciervo a la prueba de intradermorreacción frente a la fitohemaglutinina. Así, los machos muestran una mayor capacidad de respuesta que las hembras, y los animales en mejor condición nutricional muestran una mayor capacidad de respuesta que aquellos en peor condición. 3. La condición física, y en particular el estado nutricional del ciervo, puede influir en su capacidad de respuesta frente al parásito Elaphostrongylus cervi. 4. En poblaciones aisladas de ciervo ibérico, la pérdida de variabilidad en genes relacionados con la respuesta inmunitaria podría verse facilitada por determinadas herramientas de gestión, como los vallados o la alimentación suplementaria. 5. En el ciervo ibérico, la condición física, y la presencia de macroparásitos, (como garrapatas y Elaphostrongylus cervi) y microparásitos (como Mycobacterium bovis) están estadísticamente relacionados con determinados alelos del gen DRB3 del complejo mayor de histocompatibilidad. 6. Existe una expresión génica diferencial en linfonodos mesentéricos de ciervos infectados y no infectados con Mycobacterium bovis. Algunos de los genes sobreexpresados, como (CD74, gen asociado a la cadena no variable del MHC II), o inhibidos, como (IL2_R), sugieren que existen diversos mecanismos por los que esta bacteria sería capaz de modular y evitar la respuesta inmunitaria de su hospedador. 7. Finalmente, en esta tesis se comprueba que la compleja relación entre el ciervo y sus macro- y micro-parásitos, mediada por la respuesta inmunitaria viene determinada por complejos factores individuales, ambientales y genéticos.


Agradecimientos


___________________________________________________________________Tesis Doctoral
Agradecimientos
En este apartado me gustaría agradecer, de forma general, a toda la gente que de un
modo u otro ha contribuido a la realización de este trabajo, aunque será difícil recopilar
todo aquí siendo tantas las personas que han ayudado a que esto salga adelante.
Antes de nada quiero dar las gracias a mis directores, Christian y José Manuel, por
dirigir mi trabajo, por discutirlo, por disfrutar de él, por tanta ayuda recibida. Especialmente
quiero agradecer a Christian la confianza inicial puesta en mi, su dedicación, sus consejos y
su infinita ayuda. Ha sido clave para que este trabajo sea una realidad. También a José
Manuel, por introducirme en el mundo de la inmunología, por su apoyo y sus muchas ideas
propuestas, por estar siempre que se le necesita.
A Yolanda. Gracias a ella tuve la oportunidad de disfrutar de una beca durante
cuatro años y de tener ahora aquí este trabajo. Muchas horas hemos pasado en La Morera,
haciendo un poco de todo, aprendiendo un poco de todo, desde meticulosas necropsias
hasta intentar identificar los pobres bichejos que nos traía de vez en cuando el niño de
Alfonso, incluyendo censos, recechos, y un interminable etc, incluso largas charlas sobre la
vida misma. Gracias por compartir con nosotros todos tus datos recopilados con tanto
esfuerzo, por poner tantas veces a nuestra disposición el personal de la finca y la misma
finca, por intentar infinitas veces hacer ver a Ricardo el sentido de nuestras “ideas
científicas”. Gracias por tu dedicación y por brindarme todo lo que ha estado a tu alcance.
Qué decir de Joaquín. Cómo te admiro, super-xuacu. Profesionalmente no conozco
una persona con más dedicación y que ponga tanto empeño y esfuerzo en hacer las cosas
bien. Gracias. Has participado de lleno en este trabajo desde el principio hasta el final.
A Pepe le agradezco profundamente haberme hecho un hueco en su laboratorio y
haber depositado su confianza en mí. Los trabajos hechos hasta ahora con él han sido para
mí todo un lujo, espero que a partir de ahora salgan muchos más.
Considero un privilegio poder trabajar con vosotros.
Fran y Pelayo han sido, y son, un motor estupendo. Eso sí, me costará perdonarles
el haber puesto un listón tan alto. ¡Qué buena gente sois, parejilla! Gracias por todos los
consejos y aportaciones, y mil gracias por la inmensa ayuda en la maquetación de la tesis,
pero sobre todo, por ejercer tan fielmente el papel de compañeros. Mª Paz, gracias por
regalarme hace tiempo esa curiosa brujilla, parece que empieza a surtir efecto (aunque te
aseguro que me está dando más de un sofocón), me alegro cada vez más de haber tenido
que compartir tantas cosas contigo, desde el despacho y parte de mi tesis hasta esos meses

Tesis doctoral____________________________________________________________________
184
de embarazo y los primeros logros de nuestros peques. A los tres, gracias por todos los
buenos momentos que hemos pasado juntos, encantada de haber compartido con vosotros
tantos y tantos ratos.
Muy pocos a mi alrededor en el IREC son los que no han pringado alguna vez en
los interminables días de manejos de ciervos, tuberculinas, capturas, etc., etc. La verdad es
que, quitando alguna coz, cabezazo o accidente con final eutanásico, sí que hemos pasado
muy buenos ratos y hemos echado bastantes risas. Entre los más asiduos Joaquín, Óscar,
Fran, Diego, Pelayo, Manolo, Vane, Paqui, Eli, Jesús, Eloisa, Cris, Ángela, Pablo R, Raquel,
Salva, Félix… En fin, esta lista sería interminable, y hay que añadir mucha más gente de
prácticas que ha ido pasando por el irec y que nos han socorrido en más de una
tuberculinización, incluso parientes del irec, entre los que no puedo evitar destacar a
Francis, que supo poner en muchas ocasiones un toque gracioso al asunto (me costará
olvidar su ofrecimiento como responsable de la base de datos de osos polares). Muchas
gracias a todos.
Gracias también a mis compañeros más recientes del irec, Álvaro, José Antonio,
Jorge, Rafa, Ricardo, Tamara, Mariana, Sandra, Raquel…, y a los algo más veteranos,
Úrsula, Javi, Dolo, Encarni (tienes el cielo ganado soportando mis despistes con tan buen
agrado). Gracias también a Vidal, a Andrés, a Julián y a Tomás. A la gente de Genómica y
Toxi, Victoria, Mario, Bianky, Ruth, Ester, Cristina, Rafa, Mónica, Pablo C (jeje, nuestro
siempre dispuesto macgyver del irec), Lidia, Inés… Al resto de gente del Irec, Dávila,
Loren, Ester, Joaquín, Rocío, Milagros, Jota, Miguel, Paco, Gustau, Fabián, Paqui, Luisen,
Carlos, Jorge, Nacho, Maria, Marisa… Sí, la lista sería interminable, lo bueno es guardar
muchos buenos recuerdos de todos y saber que a todos tengo que agradecer muchas cosas.
Gracias a todos los guardas de caza que han colaborado en este trabajo, en especial
a Bernardo, a Alfonso y a Paco, entre otros muchos, gracias por vuestra gran ayuda de
forma desinteresada, gracias por vuestra constante buena disposición a hacer las cosas.
Agradecer también a los encargados y dueños de fincas y granjas cinegéticas el acceso a las
muestras y a toda la información que se ha requerido para este trabajo, y por supuesto a los
veterinarios responsables, gracias por toda vuestra ayuda y por vuestra colaboración, en
especial a José Antonio O., Vicente C., Javier C, …y cómo no iba a recordar aquí a
Alfredito P., esa intensa semana en Lousã marcó mi trayectoria, qué primer congreso!
Gracias a Katy, Ed, Pepe, Karelia, Juan-John, Raúl, y cómo no a Victoria, mi
hospedadora, gracias por esa acogida en la OSU, por esos días tan provechosos, fue una

___________________________________________________________________Tesis Doctoral
185
experiencia ideal. El poder combinar el laboratorio con excursiones al campo, salidas
diversas o sorpresas como el baby shower no tiene precio. Gracias.
A la gente de Neiker, a Marta Barral y a Joseba Garrido, por su importante
colaboración, y en especial a Olaia y a Xeider, por hacerme tan agradable mi estancia allí y
por saber ayudar y escuchar cuando es necesario.
A las Elenas, gracias por vuestra alegría casi constante y ese toque divertido en cada
visita al despacho.
A Jorge y a Luis Ernesto, de la universidad de León, por toda la información
compartida y los trabajos hechos en conjunto.
A mis amiguetes de Jaén, especialmente a Juanma y a Emilio, por seguir siendo tan
buena gente conmigo a pesar de que os cambiase una visita guiada a Almagro por una
necropsia en toda regla de ocho ciervos en La Morera. Sí, soy consciente de que costó
trabajo perdonarlo y de que a Inma la dejó marcada para toda su vida. Intentaré compensar
a partir de ahora. Gracias también a mis compañeros de Ciudad Real, a Puri y a Félix, por
tanto ánimo en todo este tiempo.
A mis amigos, Julián y Natalia (gracias por estar ahí en tantos momentos, gracias, de
verdad), a Conchi, Toni, Ana, Dolo, Antonio, Gema V, Dolores G, Dolores P, Carmen,
Gema, Yoli, Juli, Pili, Pepillo… es muy difícil terminar la lista, así que daos por incluidos
todos. Sí, sé lo que pensáis, ahora tengo menos excusas para no quedar (de lo cual me
alegro enormemente).
Me gustaría aprovechar esta ocasión para dar mi enhorabuena a la gente que tiene
un papel de madre y además trabaja, y además hace bien ambas cosas, y además disfruta de
la vida con ellos… Intentaré aprender.

Top Related