


Idiomas
Páginas
Jurídico

Incidencia fiscal de los impuestos y transferencias en América Latina
Maynor Cabrera
Director Asociado para América Latina y el Caribe
XXIX Seminario de Política Fiscal CEPAL
Santiago de Chile Marzo 24, 2017
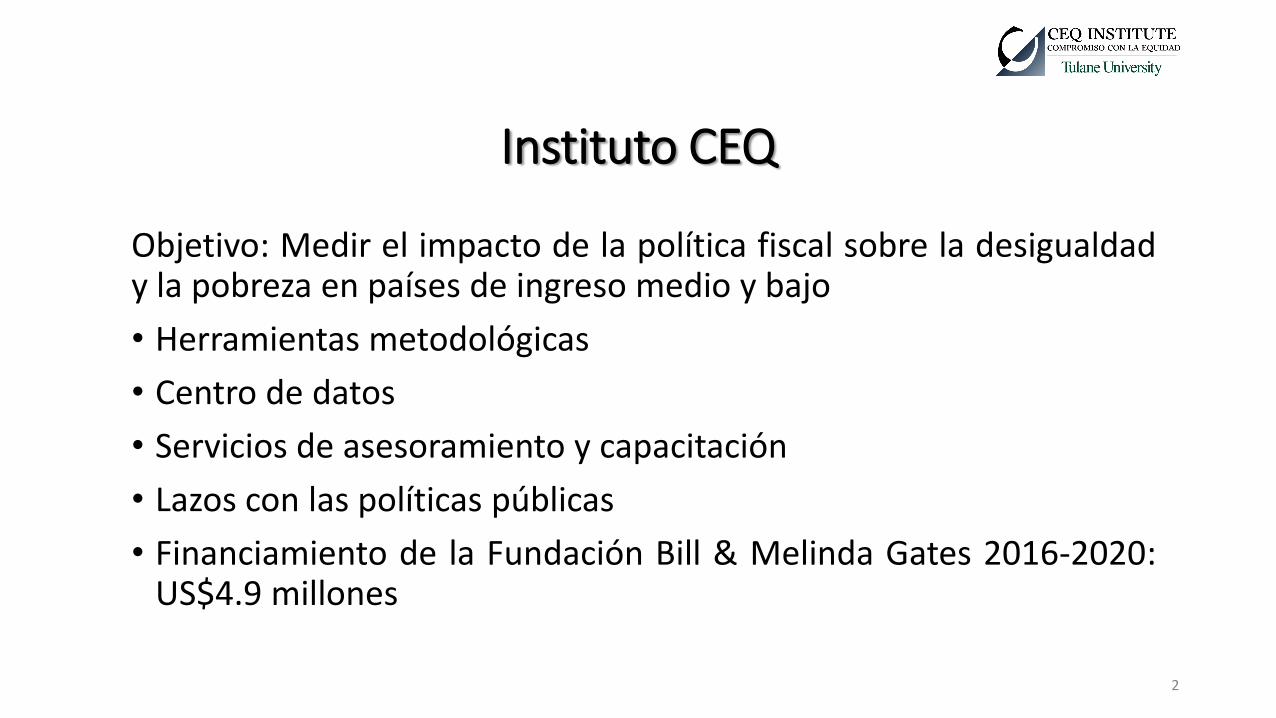
Instituto CEQ
Objetivo: Medir el impacto de la política fiscal sobre la desigualdad y la pobreza en países de ingreso medio y bajo
• Herramientas metodológicas
• Centro de datos
• Servicios de asesoramiento y capacitación
• Lazos con las políticas públicas
• Financiamiento de la Fundación Bill & Melinda Gates 2016-2020: US$4.9 millones
2
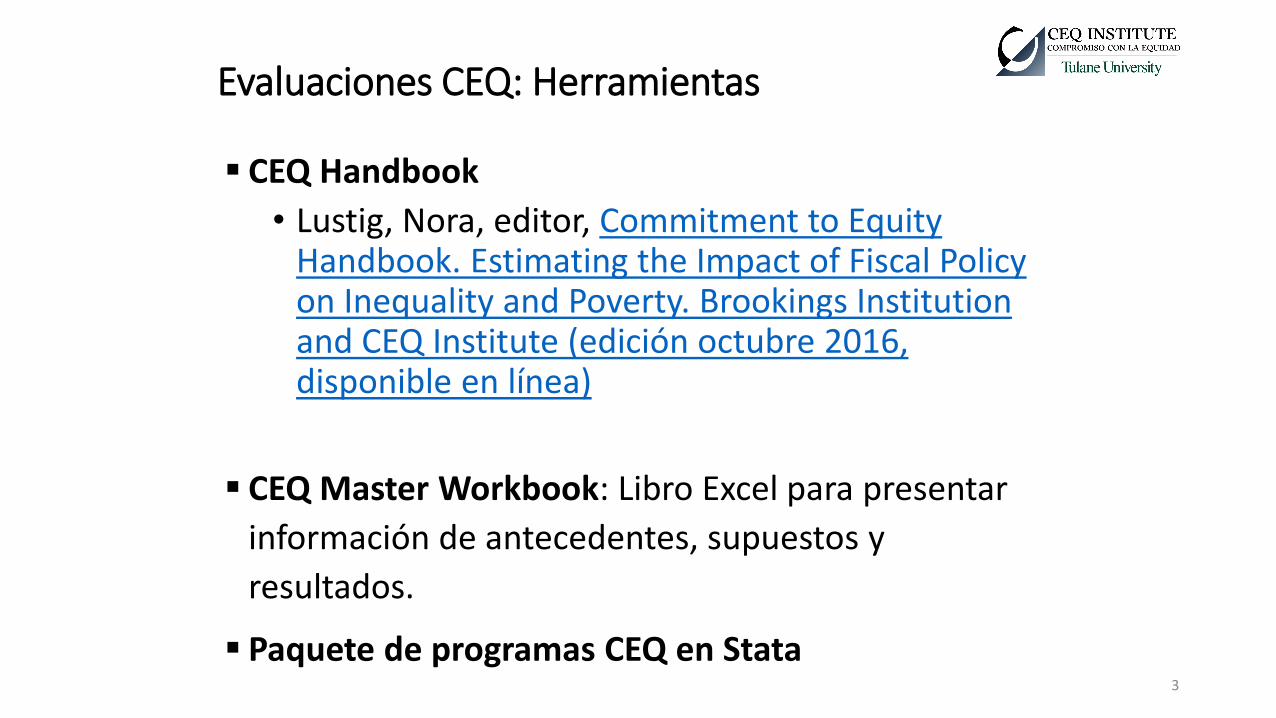
Evaluaciones CEQ: Herramientas
CEQ Handbook
• Lustig, Nora, editor, Commitment to Equity Handbook. Estimating the Impact of Fiscal Policy on Inequality and Poverty. Brookings Institution and CEQ Institute (edición octubre 2016, disponible en línea)
CEQ Master Workbook: Libro Excel para presentar
información de antecedentes, supuestos y
resultados.
Paquete de programas CEQ en Stata 3
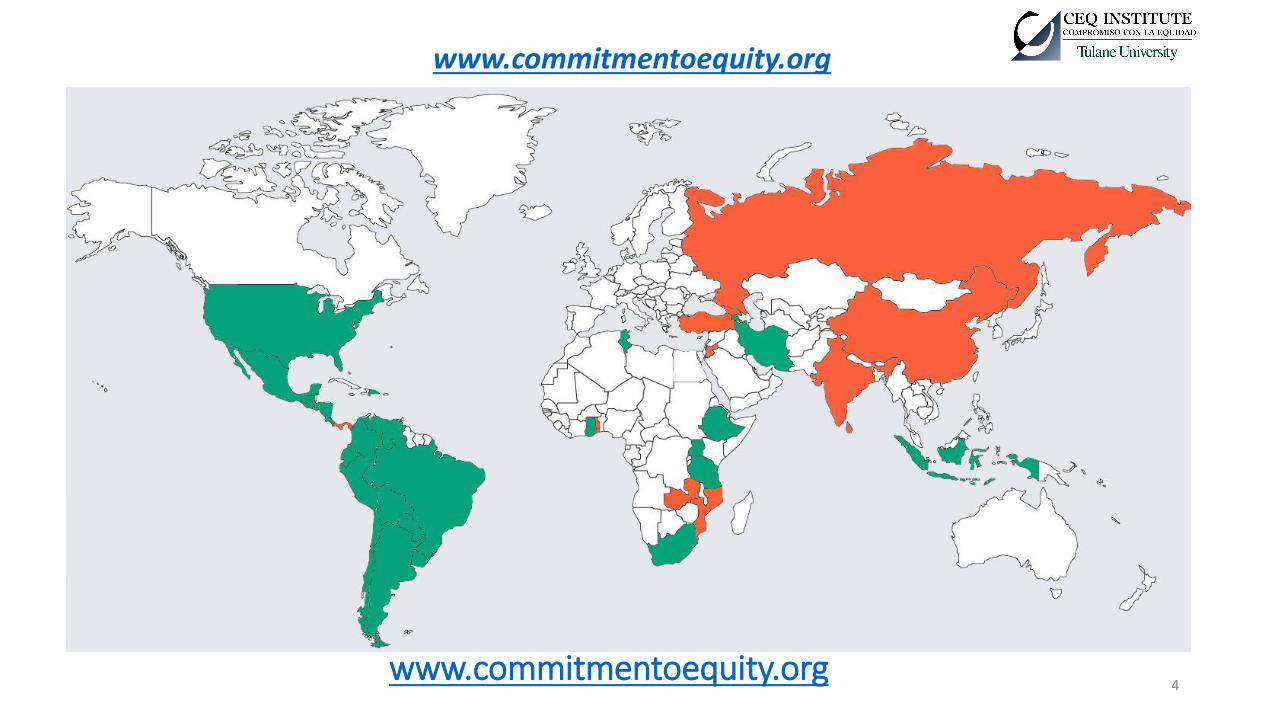
www.commitmentoequity.org
www.commitmentoequity.org
4
Instituto CEQ
• Estudios realizados en cerca de 40 países que cubren alrededor de dos tercios de la población mundial.
• Más de 100 colaboradores en todas partes del mundo
• Esfuerzos de colaboración y asociaciones con múltiples organizaciones : AfDB, Banco Mundial, BID, CAF, FMI, ICEFI, OECD, Oxfam, PNUD, UNICEF
• Herramienta está siendo utilizada por gobiernos
• Serie de documentos de trabajo
• Numerosas publicaciones académicas
5
Enfoque metodológico: Principales características
6
Basado en los capítulos 1 (Lustig y Higgins), 5 (Higgins y Lustig) y 7
(Higgins) en Lustig, Nora, editor. Forthcoming. Commitment to Equity
Handbook. Estimating the Impact of Fiscal Policy on Inequality and
Poverty (Brookings Institution Press and CEQ Institute, Tulane University).
Versión del 31 de Octubre 2016, disponible en línea aquí.
Evaluaciones CEQ: principales preguntas • ¿Cuánta redistribución del ingreso y reducción de la pobreza se está
logrando a través de la política fiscal?
• ¿Cuán igualadoras y favorables a los pobres son los impuestos y el gasto público?
• ¿Cuán efectivos son los impuestos y el gasto público en la reducción de la desigualdad y la pobreza?
• ¿Cuál es el impacto de las reformas fiscales que cambian el tamaño y/ o la progresividad de un impuesto o beneficio en particular?
3/24/2017 8
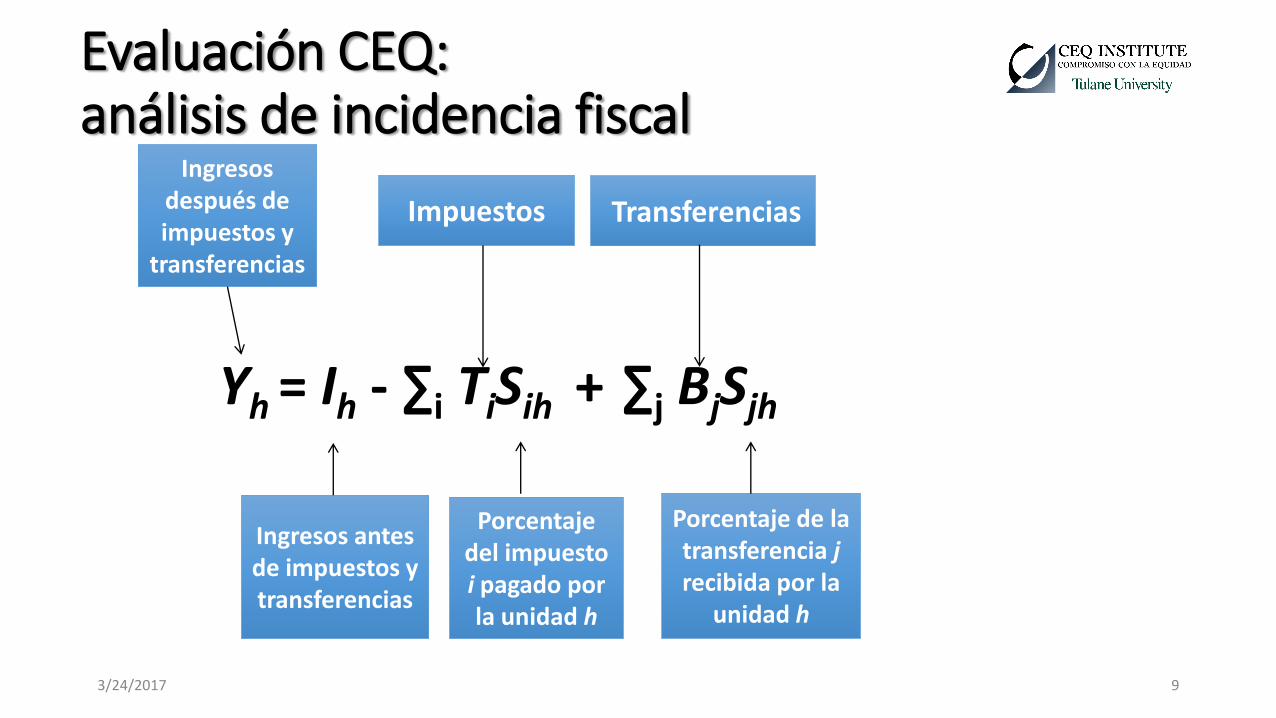
Evaluación CEQ: análisis de incidencia fiscal
Yh = Ih - ∑i TiSih + ∑j BjSjh
3/24/2017 9
Ingresos después de impuestos y
transferencias
Ingresos antes de impuestos y transferencias
Impuestos Transferencias
Porcentaje del impuesto i pagado por la unidad h
Porcentaje de la transferencia j recibida por la
unidad h
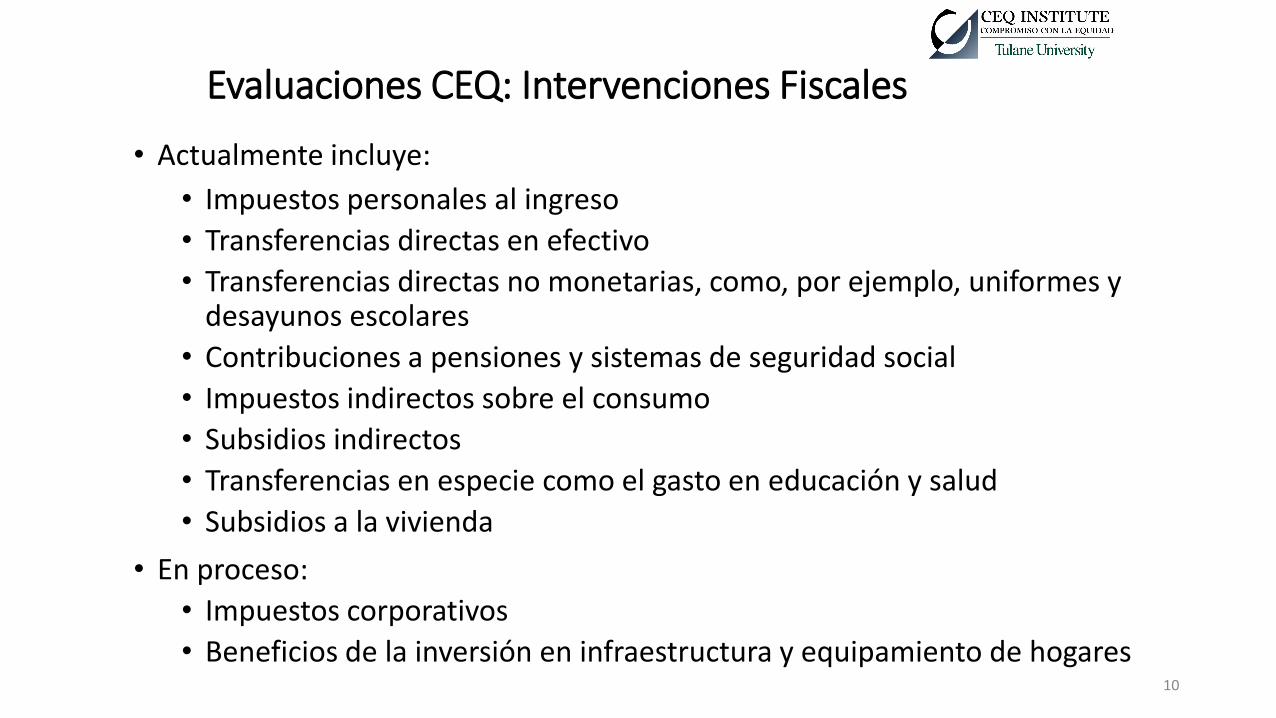
Evaluaciones CEQ: Intervenciones Fiscales
• Actualmente incluye:
• Impuestos personales al ingreso
• Transferencias directas en efectivo
• Transferencias directas no monetarias, como, por ejemplo, uniformes y desayunos escolares
• Contribuciones a pensiones y sistemas de seguridad social
• Impuestos indirectos sobre el consumo
• Subsidios indirectos
• Transferencias en especie como el gasto en educación y salud
• Subsidios a la vivienda
• En proceso:
• Impuestos corporativos
• Beneficios de la inversión en infraestructura y equipamiento de hogares
10
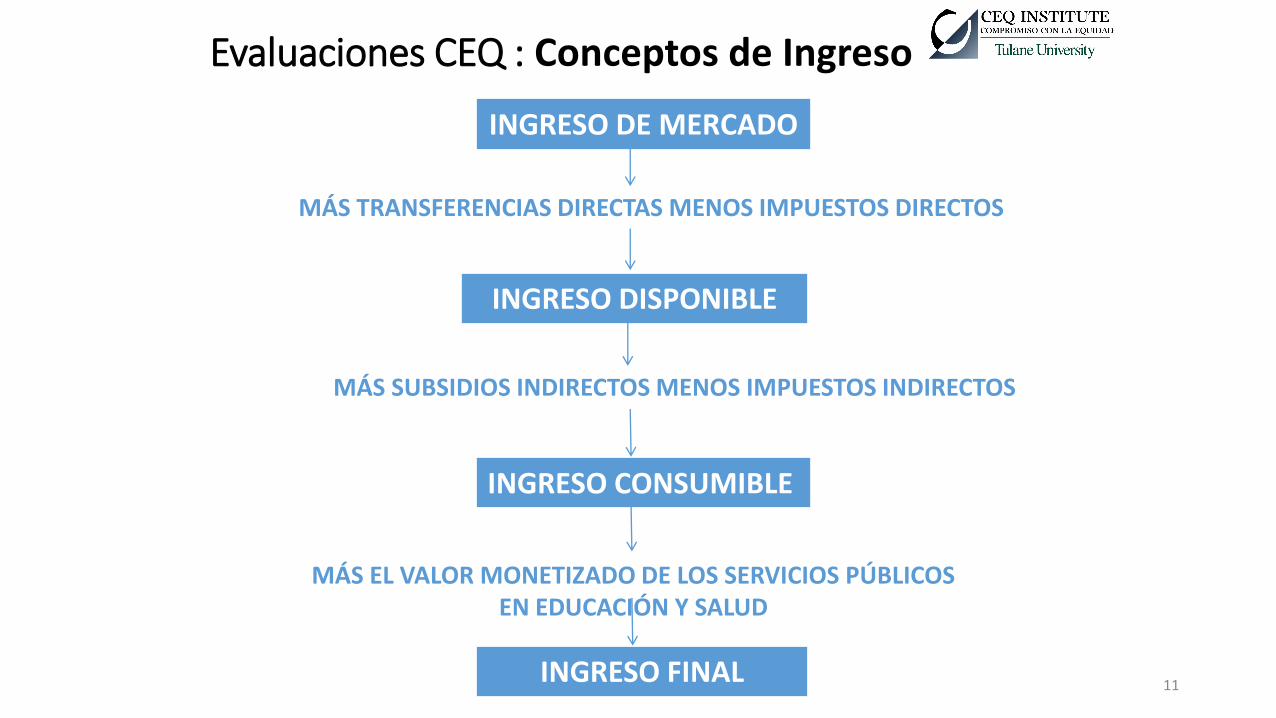
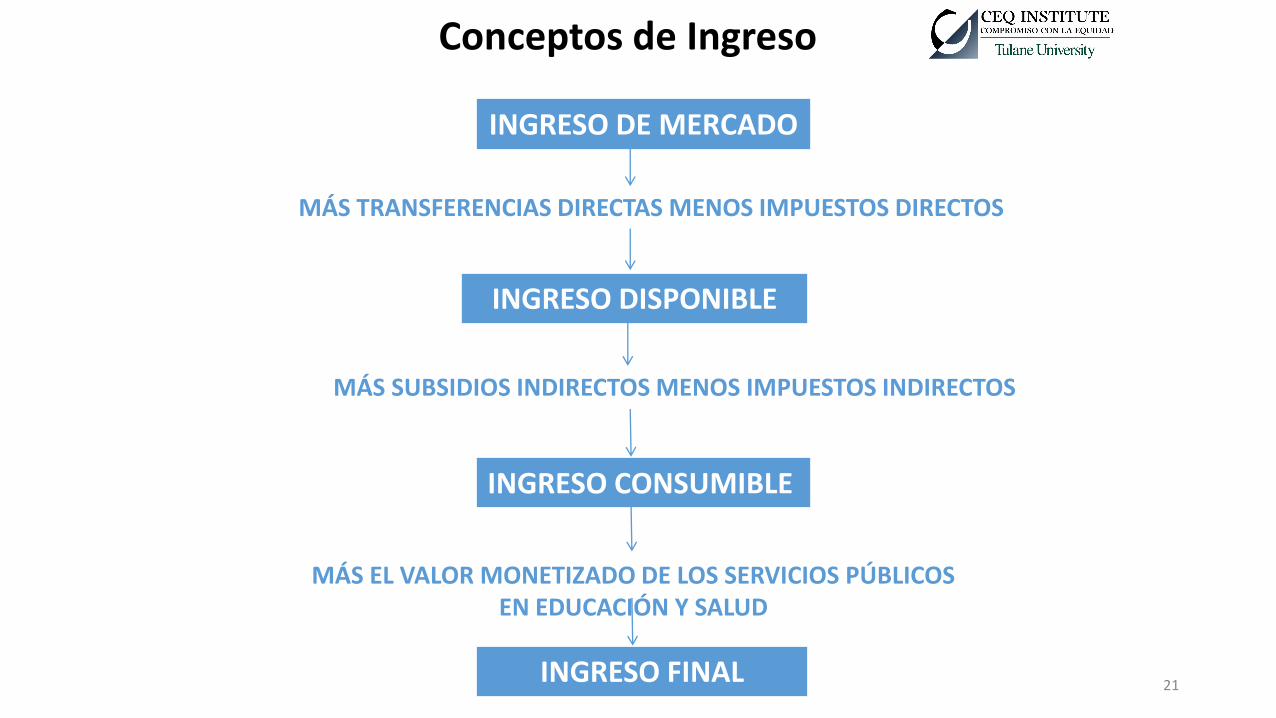
INGRESO DE MERCADO
INGRESO DISPONIBLE
MÁS TRANSFERENCIAS DIRECTAS MENOS IMPUESTOS DIRECTOS
MÁS SUBSIDIOS INDIRECTOS MENOS IMPUESTOS INDIRECTOS
INGRESO CONSUMIBLE
MÁS EL VALOR MONETIZADO DE LOS SERVICIOS PÚBLICOS EN EDUCACIÓN Y SALUD
INGRESO FINAL
Evaluaciones CEQ : Conceptos de Ingreso
11
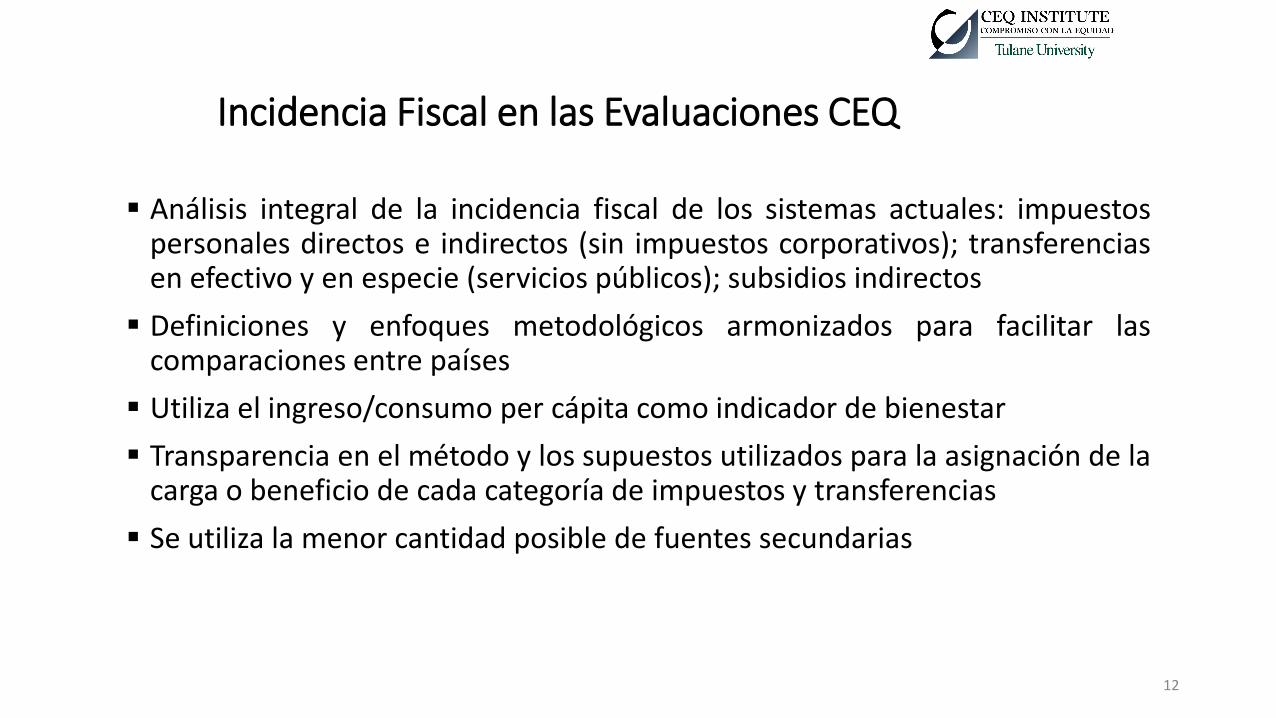
Incidencia Fiscal en las Evaluaciones CEQ
Análisis integral de la incidencia fiscal de los sistemas actuales: impuestos personales directos e indirectos (sin impuestos corporativos); transferencias en efectivo y en especie (servicios públicos); subsidios indirectos
Definiciones y enfoques metodológicos armonizados para facilitar las comparaciones entre países
Utiliza el ingreso/consumo per cápita como indicador de bienestar
Transparencia en el método y los supuestos utilizados para la asignación de la carga o beneficio de cada categoría de impuestos y transferencias
Se utiliza la menor cantidad posible de fuentes secundarias
12
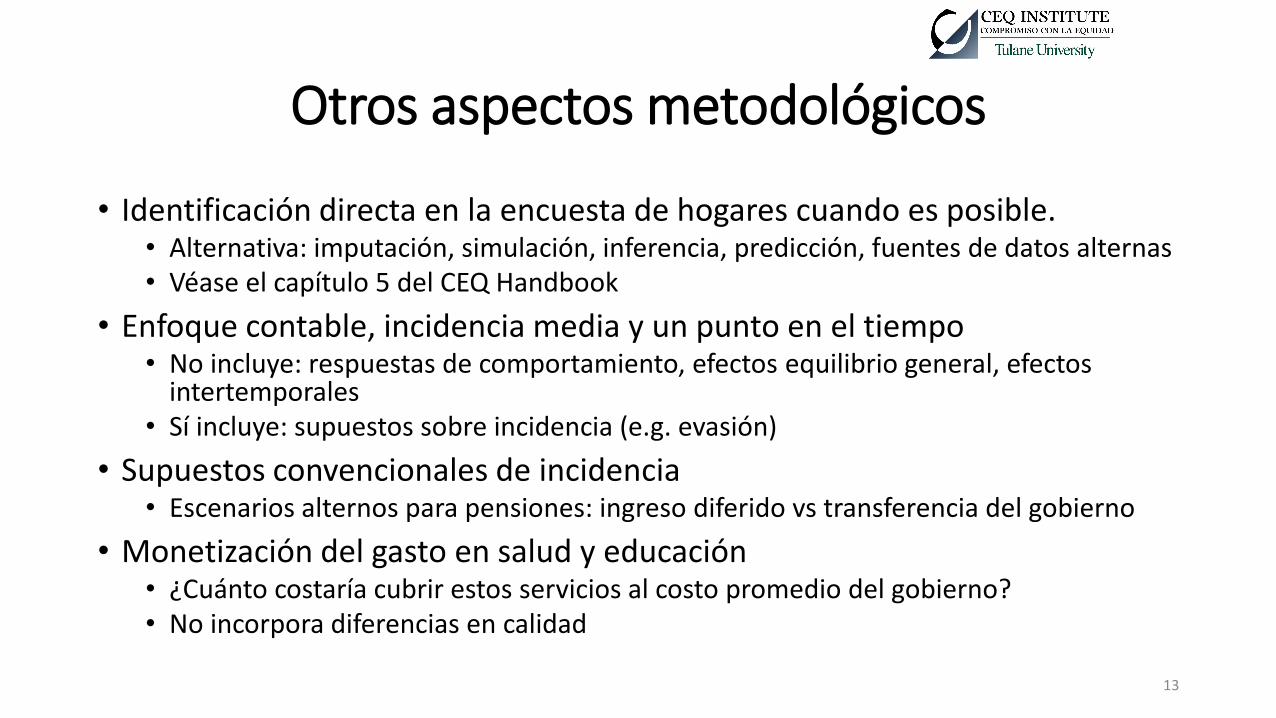
Otros aspectos metodológicos
• Identificación directa en la encuesta de hogares cuando es posible. • Alternativa: imputación, simulación, inferencia, predicción, fuentes de datos alternas • Véase el capítulo 5 del CEQ Handbook
• Enfoque contable, incidencia media y un punto en el tiempo • No incluye: respuestas de comportamiento, efectos equilibrio general, efectos
intertemporales • Sí incluye: supuestos sobre incidencia (e.g. evasión)
• Supuestos convencionales de incidencia • Escenarios alternos para pensiones: ingreso diferido vs transferencia del gobierno
• Monetización del gasto en salud y educación • ¿Cuánto costaría cubrir estos servicios al costo promedio del gobierno? • No incorpora diferencias en calidad
13
Redistribución fiscal: principales resultados para América Latina
3/24/2017 14
Basado en:
Nora Lustig. “El impacto del sistema tributario y el gasto social en la distribución del ingreso y la pobreza en América Latina: Argentina, Bolivia, Brasil, Chile, Colombia, Costa Rica, Ecuador, El Salvador, Guatemala, Honduras, México, Nicaragua, Perú, República Dominicana, Uruguay y Venezuela.” El Trimestre Economico. Number 335, July-September 2017 (por publicarse) CEQ Working Paper 62, Febrero 2017
15
Preguntas clave
• ¿Cuál es el efecto redistributivo y de reducción de la pobreza de la política fiscal?
• ¿Cuán igualadores y pro-pobres son los impuestos y el gasto público?
• ¿Qué importancia tiene el supuesto sobre las pensiones contributivas?
• ¿Se presenta la llamada “paradoja de Robin Hood”?
16
Tamaño y composición de los ingresos y gastos gubernamentales
17
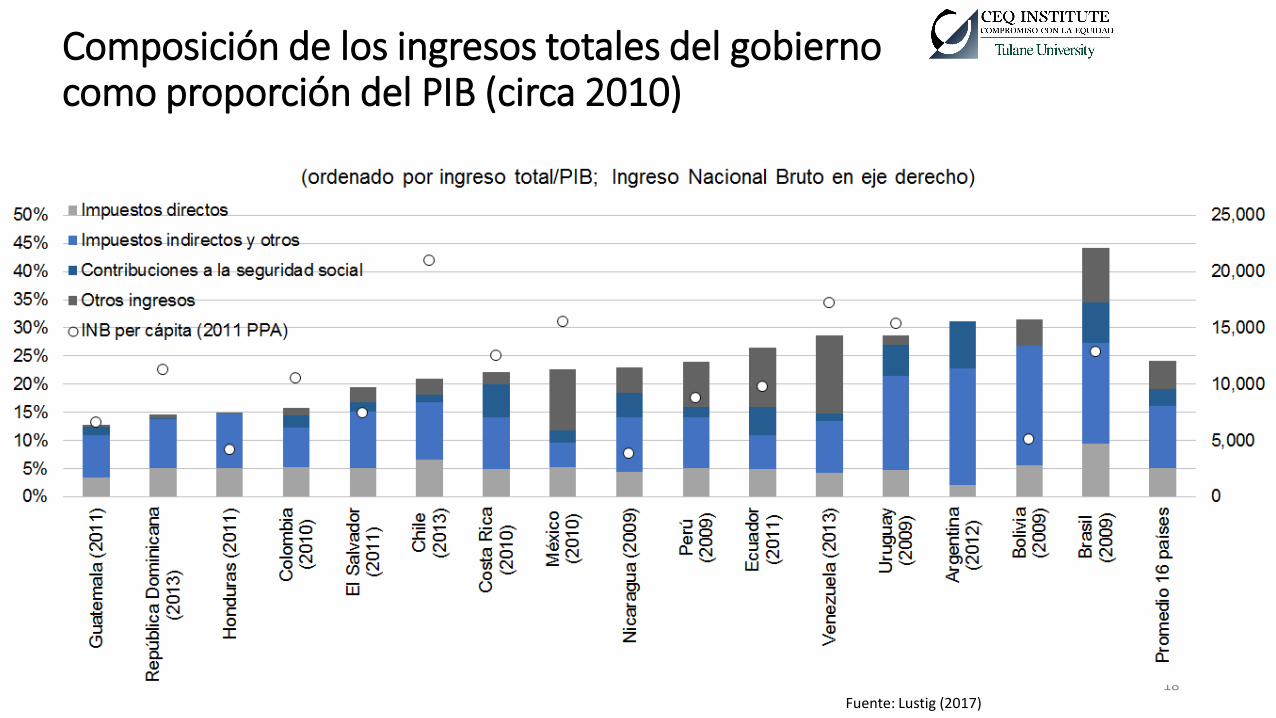
Composición de los ingresos totales del gobierno como proporción del PIB (circa 2010)
18 Fuente: Lustig (2017)
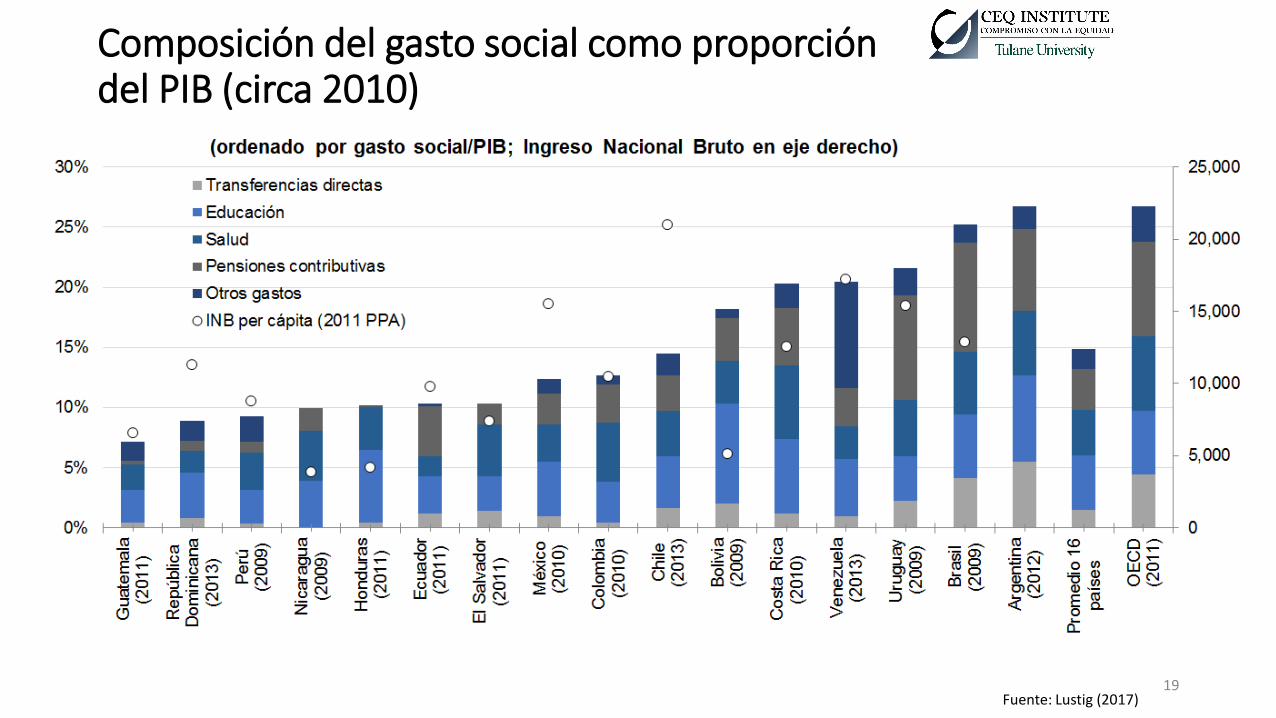
Composición del gasto social como proporción del PIB (circa 2010)
19 Fuente: Lustig (2017)
Desigualdad
INGRESO DE MERCADO
INGRESO DISPONIBLE
MÁS TRANSFERENCIAS DIRECTAS MENOS IMPUESTOS DIRECTOS
MÁS SUBSIDIOS INDIRECTOS MENOS IMPUESTOS INDIRECTOS
INGRESO CONSUMIBLE
MÁS EL VALOR MONETIZADO DE LOS SERVICIOS PÚBLICOS EN EDUCACIÓN Y SALUD
INGRESO FINAL
Conceptos de Ingreso
21
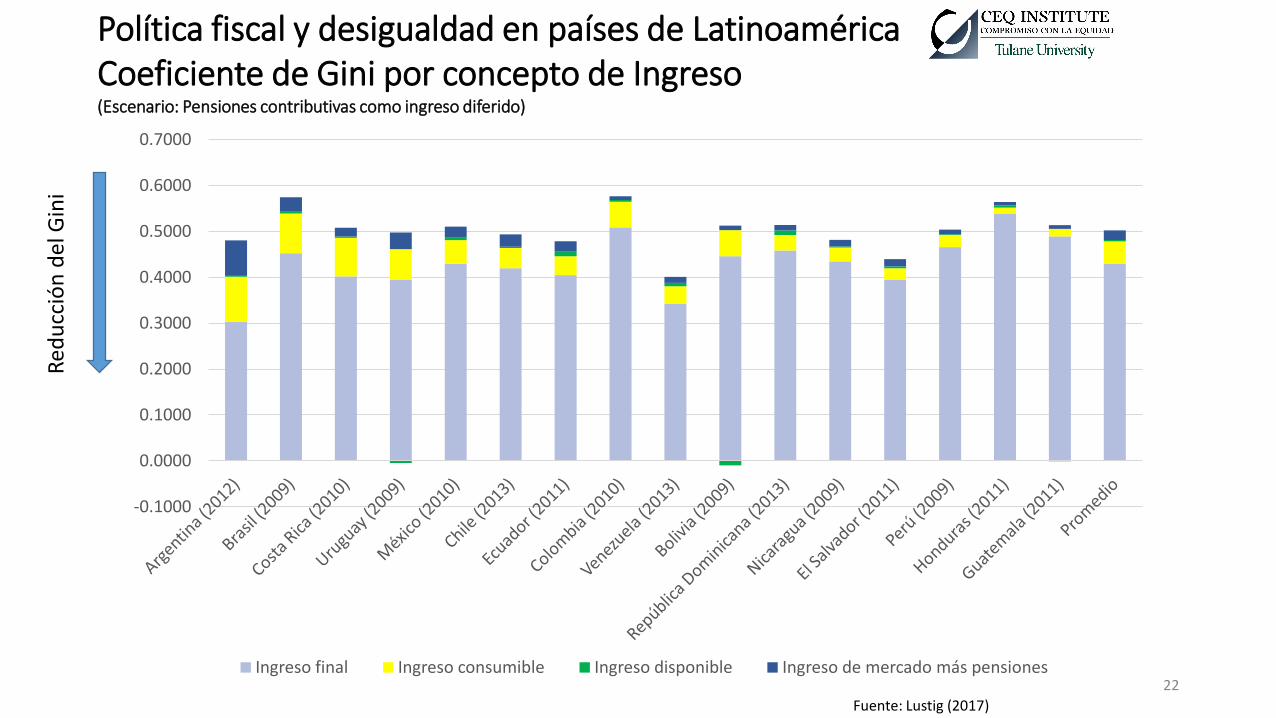
Política fiscal y desigualdad en países de Latinoamérica Coeficiente de Gini por concepto de Ingreso (Escenario: Pensiones contributivas como ingreso diferido)
Fuente: Lustig (2017)
22
-0.1000
0.0000
0.1000
0.2000
0.3000
0.4000
0.5000
0.6000
0.7000
Ingreso final Ingreso consumible Ingreso disponible Ingreso de mercado más pensiones
Red
ucc
ión
del
Gin
i
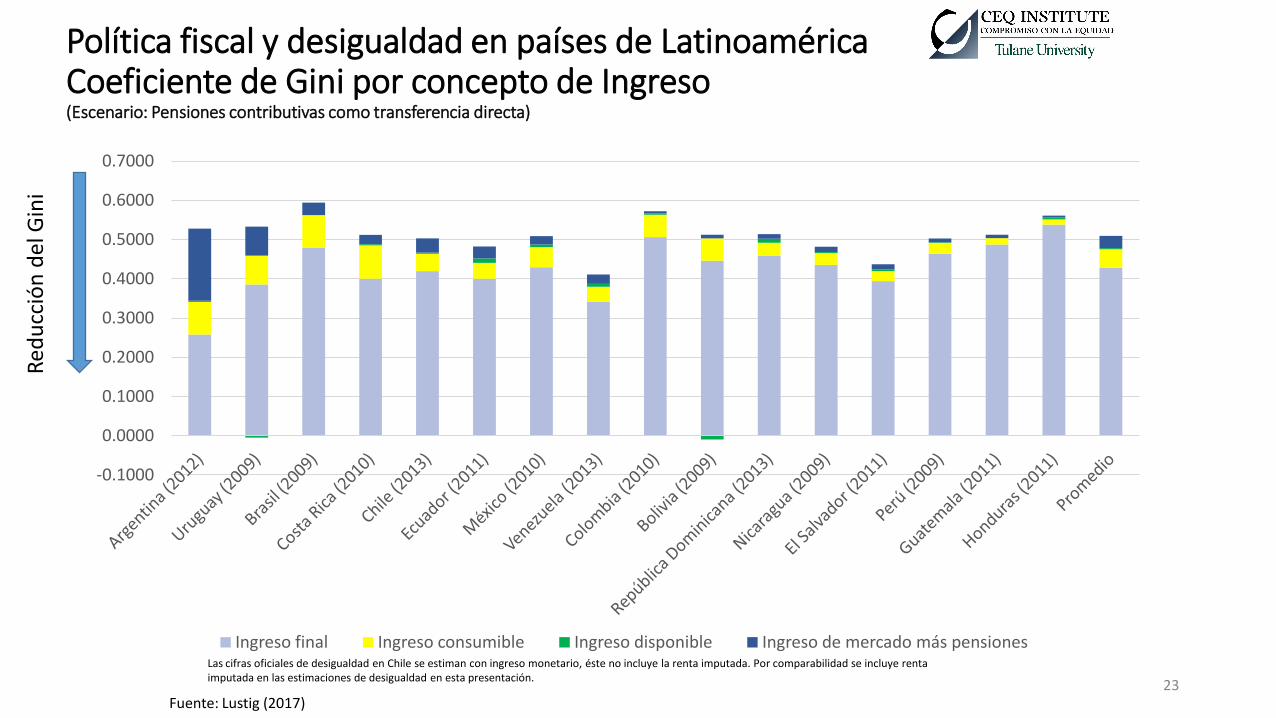
Política fiscal y desigualdad en países de Latinoamérica Coeficiente de Gini por concepto de Ingreso (Escenario: Pensiones contributivas como transferencia directa)
23
Las cifras oficiales de desigualdad en Chile se estiman con ingreso monetario, éste no incluye la renta imputada. Por comparabilidad se incluye renta imputada en las estimaciones de desigualdad en esta presentación.
Fuente: Lustig (2017)
-0.1000
0.0000
0.1000
0.2000
0.3000
0.4000
0.5000
0.6000
0.7000
Ingreso final Ingreso consumible Ingreso disponible Ingreso de mercado más pensiones
Red
ucc
ión
del
Gin
i
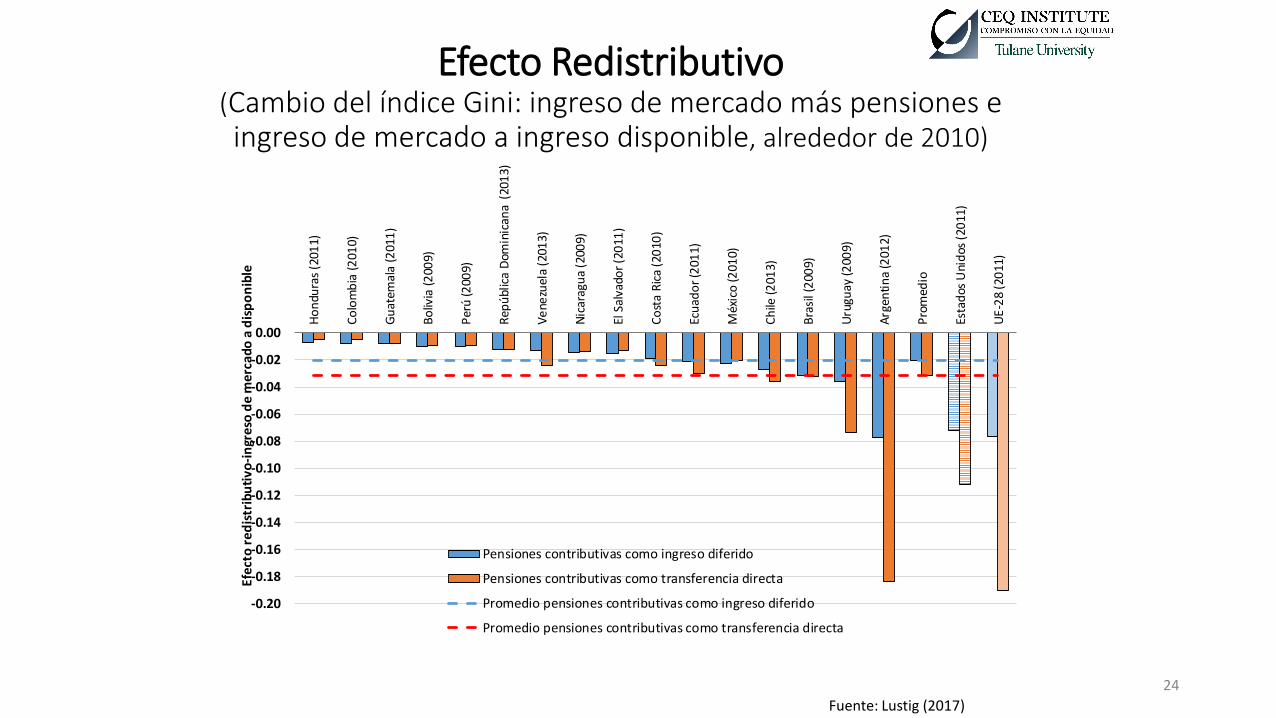
Efecto Redistributivo (Cambio del índice Gini: ingreso de mercado más pensiones e ingreso de mercado a ingreso disponible, alrededor de 2010)
24
Fuente: Lustig (2017)
-0.20
-0.18
-0.16
-0.14
-0.12
-0.10
-0.08
-0.06
-0.04
-0.02
0.00
Ho
ndu
ras
(201
1)
Co
lom
bia
(2
010)
Gu
atem
ala
(201
1)
Bo
livia
(2
009)
Per
ú (2
009)
Rep
úbl
ica
Dom
inic
ana
(20
13)
Ve
nezu
ela
(201
3)
Nic
arag
ua
(200
9)
El S
alva
dor
(20
11)
Co
sta
Ric
a (2
010
)
Ecu
ado
r (2
011)
Méx
ico
(201
0)
Ch
ile (2
013)
Bra
sil (
200
9)
Uru
guay
(200
9)
Arg
enti
na
(201
2)
Pro
med
io
Esta
dos
Uni
dos
(20
11)
UE
-28
(20
11)
Efec
to r
edis
trib
uti
vo-i
ngr
eso
de
mer
cado
a d
isp
on
ible
Pensiones contributivas como ingreso diferido
Pensiones contributivas como transferencia directa
Promedio pensiones contributivas como ingreso diferido
Promedio pensiones contributivas como transferencia directa
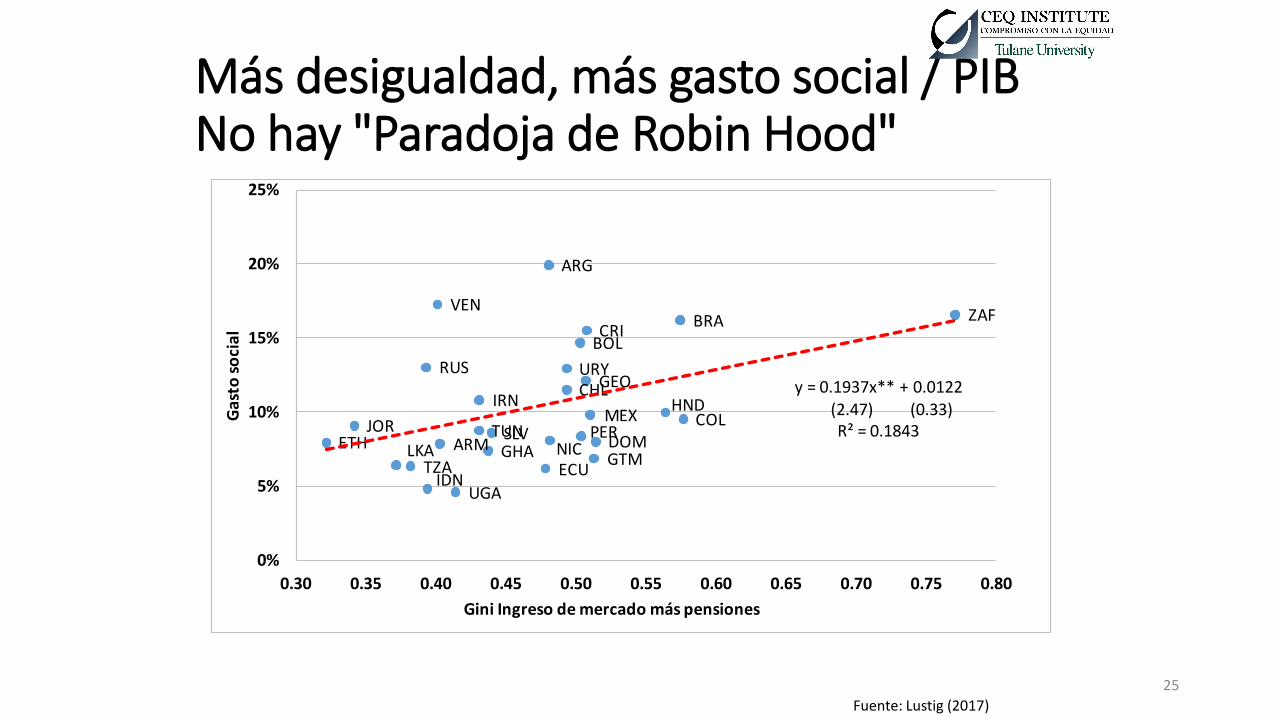
Más desigualdad, más gasto social / PIB No hay "Paradoja de Robin Hood"
25
Fuente: Lustig (2017)
ARG
ARM
BOLBRA
CHL
COL
CRI
ECU
SLVETH
GEO
GHA GTM
HND
IDN
IRN
JORMEX
NICPER
DOM
RUS
ZAF
LKATZA
TUN
UGA
URY
VEN
y = 0.1937x** + 0.0122(2.47) (0.33)R² = 0.1843
0%
5%
10%
15%
20%
25%
0.30 0.35 0.40 0.45 0.50 0.55 0.60 0.65 0.70 0.75 0.80
Ga
sto
so
cia
l
Gini Ingreso de mercado más pensiones
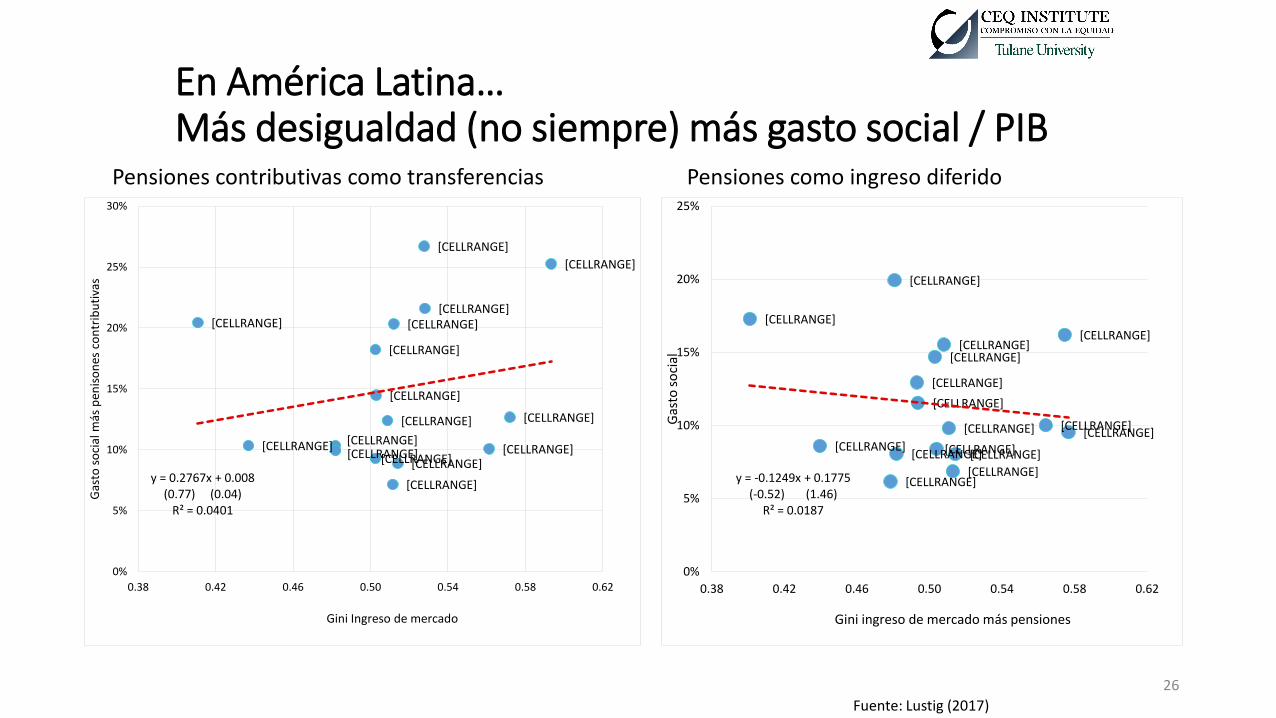
En América Latina… Más desigualdad (no siempre) más gasto social / PIB
26
Fuente: Lustig (2017)
[CELLRANGE]
[CELLRANGE]
[CELLRANGE]
[CELLRANGE]
[CELLRANGE]
[CELLRANGE]
[CELLRANGE] [CELLRANGE]
[CELLRANGE]
[CELLRANGE]
[CELLRANGE]
[CELLRANGE] [CELLRANGE] [CELLRANGE]
[CELLRANGE] [CELLRANGE]
y = 0.2767x + 0.008 (0.77) (0.04)
R² = 0.0401
0%
5%
10%
15%
20%
25%
30%
0.38 0.42 0.46 0.50 0.54 0.58 0.62
Gas
to s
oci
al m
ás p
enis
on
es c
on
trib
uti
vas
Gini Ingreso de mercado
[CELLRANGE]
[CELLRANGE]
[CELLRANGE]
[CELLRANGE]
[CELLRANGE]
[CELLRANGE]
[CELLRANGE]
[CELLRANGE]
[CELLRANGE]
[CELLRANGE] [CELLRANGE]
[CELLRANGE] [CELLRANGE] [CELLRANGE]
[CELLRANGE]
[CELLRANGE]
y = -0.1249x + 0.1775 (-0.52) (1.46)
R² = 0.0187
0%
5%
10%
15%
20%
25%
0.38 0.42 0.46 0.50 0.54 0.58 0.62
Gas
to s
oci
al
Gini ingreso de mercado más pensiones
Pensiones contributivas como transferencias Pensiones como ingreso diferido
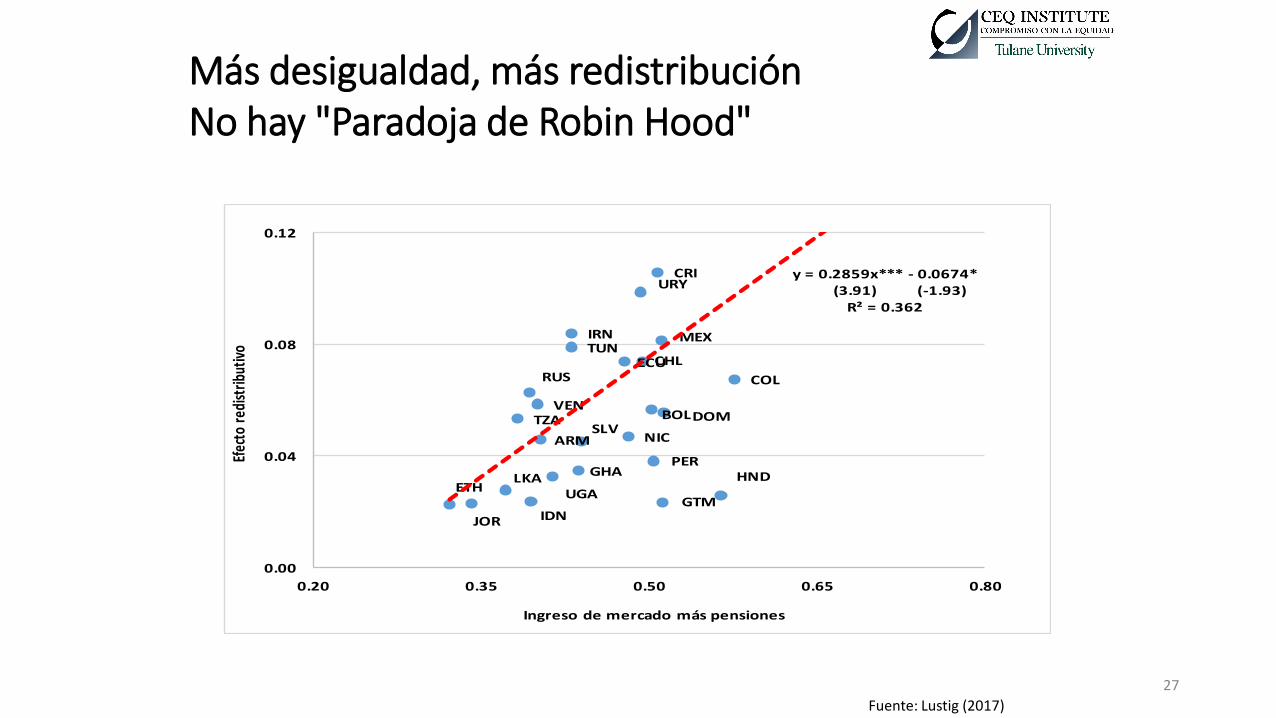
Más desigualdad, más redistribución No hay "Paradoja de Robin Hood"
Fuente: Lustig (2017)
ARM
BOL
CHL
COL
CRI
ECU
SLV
ETHGHA
GTM
HND
IDN
IRN
JOR
MEX
NIC
PER
DOM
RUS
LKA
TZA
TUN
UGA
VEN
URYy = 0.2859x*** - 0.0674*
(3.91) (-1.93)R² = 0.362
0.00
0.04
0.08
0.12
0.20 0.35 0.50 0.65 0.80
Efec
to r
edist
ribut
ivo
Ingreso de mercado más pensiones
27
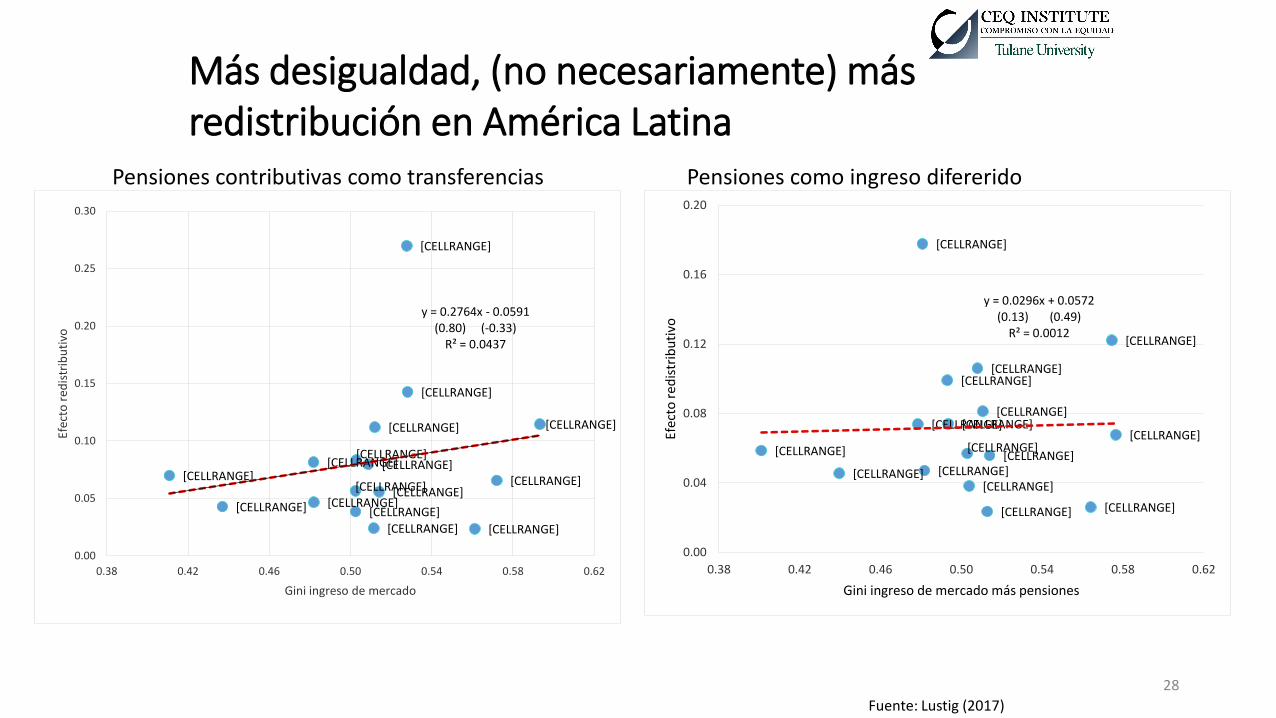
Más desigualdad, (no necesariamente) más redistribución en América Latina
Fuente: Lustig (2017)
28
[CELLRANGE]
[CELLRANGE]
[CELLRANGE]
[CELLRANGE] [CELLRANGE]
[CELLRANGE]
[CELLRANGE]
[CELLRANGE]
[CELLRANGE] [CELLRANGE]
[CELLRANGE]
[CELLRANGE] [CELLRANGE]
[CELLRANGE]
[CELLRANGE]
[CELLRANGE]
y = 0.0296x + 0.0572 (0.13) (0.49)
R² = 0.0012
0.00
0.04
0.08
0.12
0.16
0.20
0.38 0.42 0.46 0.50 0.54 0.58 0.62
Efec
to r
edis
trib
uti
vo
Gini ingreso de mercado más pensiones
[CELLRANGE]
[CELLRANGE]
[CELLRANGE]
[CELLRANGE]
[CELLRANGE]
[CELLRANGE]
[CELLRANGE]
[CELLRANGE]
[CELLRANGE] [CELLRANGE]
[CELLRANGE]
[CELLRANGE] [CELLRANGE]
[CELLRANGE]
[CELLRANGE]
[CELLRANGE]
y = 0.2764x - 0.0591 (0.80) (-0.33)
R² = 0.0437
0.00
0.05
0.10
0.15
0.20
0.25
0.30
0.38 0.42 0.46 0.50 0.54 0.58 0.62
Efec
to r
edis
trib
uti
vo
Gini ingreso de mercado
Pensiones contributivas como transferencias Pensiones como ingreso difererido
En resumen…
• La política fiscal es siempre igualadora
• Los supuestos sobre pensiones contributivas pueden marcar una gran diferencia en países con sistemas de seguridad social grandes y una alta proporción de jubilados o Las pensiones, sin embargo, pueden ser igualadoras o
desigualadoras
• Cuanto más desigual, más redistribución fiscal oNo hay paradoja de “Robin Hood” a diferencia de los
resultados de Lindert (2004) quien con datos históricos encontró que los países más desiguales destinaban menos recursos al gasto redistributivo
o ¿ “Robin-Hood” o “Hood-Robin” en América Latina?
29
Pobreza
• La política fiscal puede ser igualadora, pero aumenta la pobreza (en términos de la capacidad de los pobres para consumir bienes y servicios privados): línea 1.25/día: Guatemala, Nicaragua
línea 2.50/día: Bolivia, Guatemala, Honduras, Nicaragua
Línea 4 / día: todo los países anteriores más Argentina, Brasil, Costa Rica, El Salvador, Perú, República Dominicana, y Venezuela.
• Este inquietante resultado se debe principalmente a los impuestos al consumo
Nota: las líneas de pobreza están en poder de paridad de compra de 2005
31
Fuente: Lustig (2017)
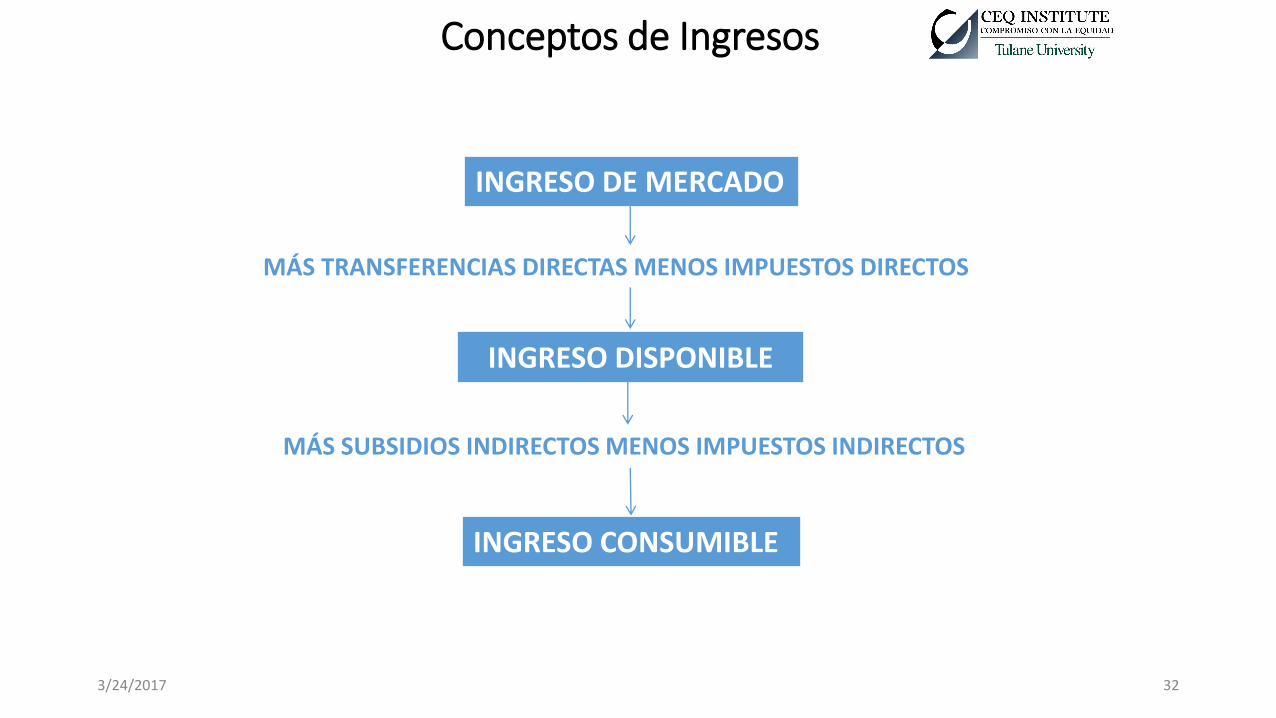
INGRESO DE MERCADO
INGRESO DISPONIBLE
MÁS TRANSFERENCIAS DIRECTAS MENOS IMPUESTOS DIRECTOS
MÁS SUBSIDIOS INDIRECTOS MENOS IMPUESTOS INDIRECTOS
INGRESO CONSUMIBLE
Conceptos de Ingresos
3/24/2017 32
Fuente: Lustig (2017)
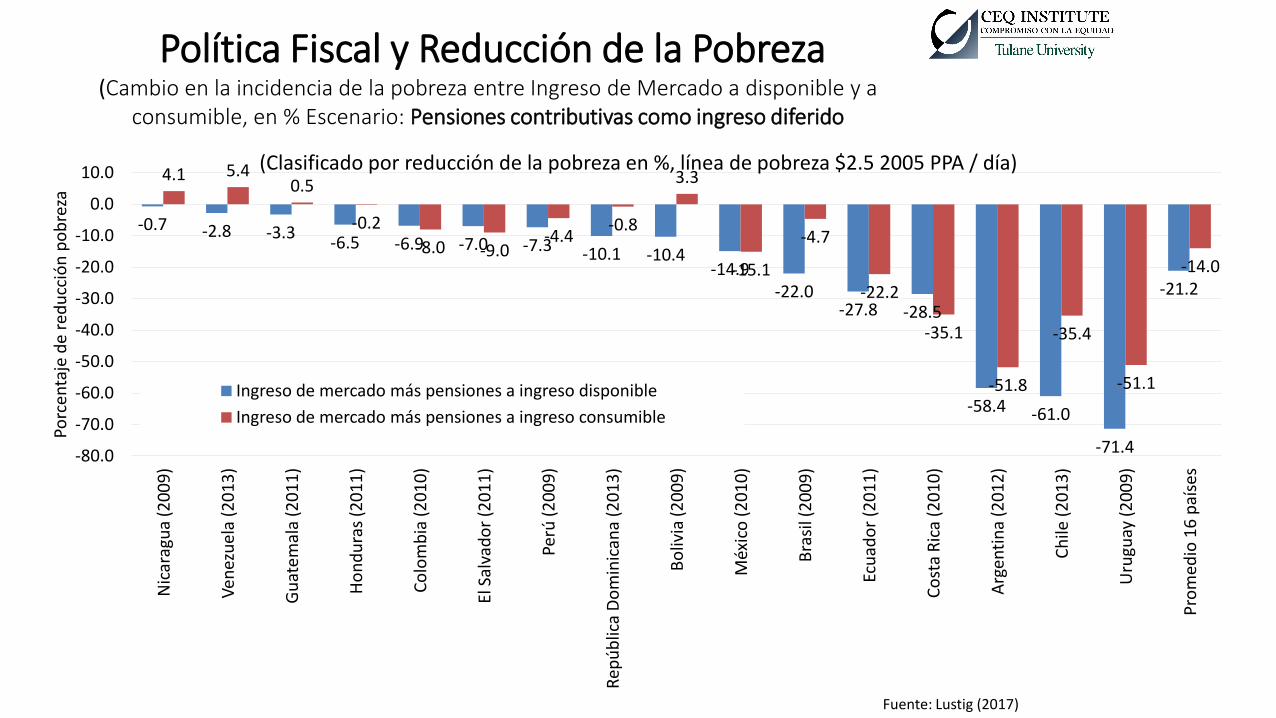
Política Fiscal y Reducción de la Pobreza (Cambio en la incidencia de la pobreza entre Ingreso de Mercado a disponible y a
consumible, en % Escenario: Pensiones contributivas como ingreso diferido
33
-0.7 -2.8 -3.3 -6.5 -6.9 -7.0 -7.3 -10.1 -10.4
-14.9 -22.0
-27.8 -28.5
-58.4 -61.0
-71.4
-21.2
4.1 5.4 0.5
-0.2
-8.0 -9.0 -4.4
-0.8
3.3
-15.1
-4.7
-22.2
-35.1
-51.8
-35.4
-51.1
-14.0
-80.0
-70.0
-60.0
-50.0
-40.0
-30.0
-20.0
-10.0
0.0
10.0 N
icar
agu
a (2
00
9)
Ven
ezu
ela
(20
13
)
Gu
atem
ala
(20
11
)
Ho
nd
ura
s (2
01
1)
Co
lom
bia
(2
01
0)
El S
alva
do
r (2
01
1)
Perú
(2
00
9)
Rep
úb
lica
Do
min
ican
a (2
01
3)
Bo
livia
(20
09
)
Méx
ico
(2
01
0)
Bra
sil (
20
09
)
Ecu
ado
r (2
01
1)
Co
sta
Ric
a (2
01
0)
Arg
enti
na
(20
12
)
Ch
ile (
20
13
)
Uru
guay
(2
00
9)
Pro
med
io 1
6 p
aíse
s
Porc
enta
je d
e re
du
cció
n p
ob
reza
(Clasificado por reducción de la pobreza en %, línea de pobreza $2.5 2005 PPA / día)
Ingreso de mercado más pensiones a ingreso disponible
Ingreso de mercado más pensiones a ingreso consumible
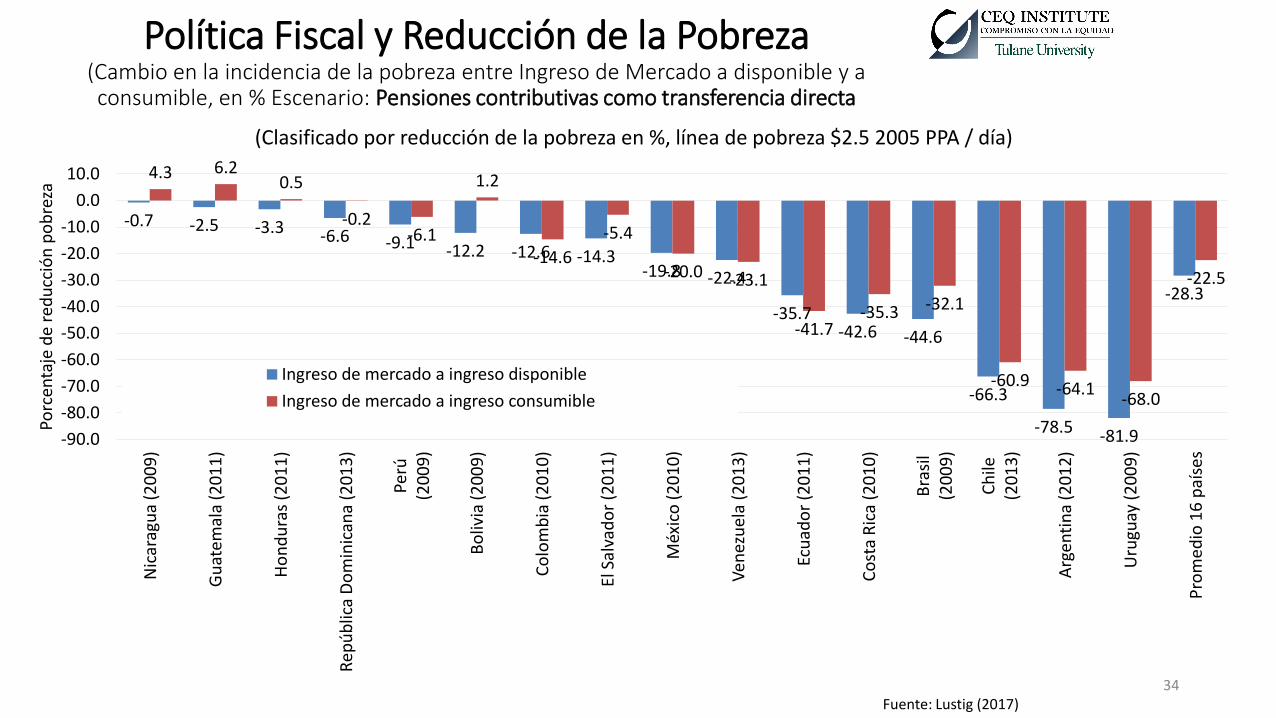
Política Fiscal y Reducción de la Pobreza (Cambio en la incidencia de la pobreza entre Ingreso de Mercado a disponible y a consumible, en % Escenario: Pensiones contributivas como transferencia directa
34
Fuente: Lustig (2017)
-0.7 -2.5 -3.3 -6.6 -9.1 -12.2 -12.6 -14.3 -19.8 -22.4
-35.7 -42.6 -44.6
-66.3
-78.5 -81.9
-28.3
4.3 6.2 0.5
-0.2 -6.1
1.2
-14.6
-5.4
-20.0 -23.1
-41.7 -35.3 -32.1
-60.9 -64.1 -68.0
-22.5
-90.0
-80.0
-70.0
-60.0
-50.0
-40.0
-30.0
-20.0
-10.0
0.0
10.0
Nic
arag
ua
(20
09
)
Gu
atem
ala
(20
11
)
Ho
nd
ura
s (2
01
1)
Rep
úb
lica
Do
min
ican
a (2
01
3)
Perú
(2
00
9)
Bo
livia
(20
09
)
Co
lom
bia
(2
01
0)
El S
alva
do
r (2
01
1)
Méx
ico
(2
01
0)
Ven
ezu
ela
(20
13
)
Ecu
ado
r (2
01
1)
Co
sta
Ric
a (2
01
0)
Bra
sil
(20
09
)
Ch
ile
(20
13
)
Arg
enti
na
(20
12
)
Uru
guay
(2
00
9)
Pro
med
io 1
6 p
aíse
s
Porc
enta
je d
e re
du
cció
n p
ob
reza
(Clasificado por reducción de la pobreza en %, línea de pobreza $2.5 2005 PPA / día)
Ingreso de mercado a ingreso disponible
Ingreso de mercado a ingreso consumible
Fuente: Lustig (2017)
Fuente: Lustig (2017)
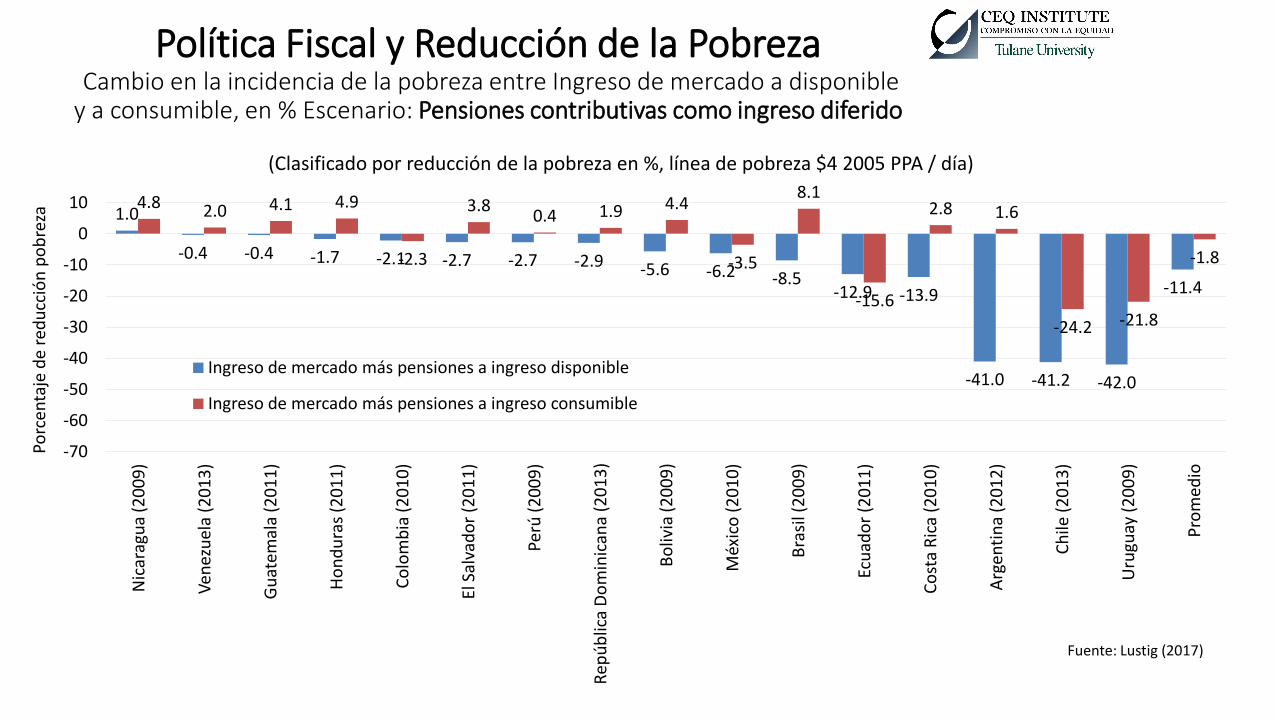
Política Fiscal y Reducción de la Pobreza Cambio en la incidencia de la pobreza entre Ingreso de mercado a disponible y a consumible, en % Escenario: Pensiones contributivas como ingreso diferido
3/24/2017 35
1.0
-0.4 -0.4 -1.7 -2.1 -2.7 -2.7 -2.9 -5.6 -6.2 -8.5 -12.9 -13.9
-41.0 -41.2 -42.0
-11.4
4.8 2.0 4.1 4.9
-2.3
3.8 0.4 1.9 4.4
-3.5
8.1
-15.6
2.8 1.6
-24.2 -21.8
-1.8
-70
-60
-50
-40
-30
-20
-10
0
10
Nic
arag
ua
(20
09
)
Ven
ezu
ela
(20
13
)
Gu
atem
ala
(20
11
)
Ho
nd
ura
s (2
01
1)
Co
lom
bia
(2
01
0)
El S
alva
do
r (2
01
1)
Perú
(2
00
9)
Rep
úb
lica
Do
min
ican
a (2
01
3)
Bo
livia
(2
00
9)
Méx
ico
(2
01
0)
Bra
sil (
20
09
)
Ecu
ado
r (2
01
1)
Co
sta
Ric
a (2
01
0)
Arg
enti
na
(20
12
)
Ch
ile (
20
13
)
Uru
guay
(2
00
9)
Pro
med
io
Porc
enta
je d
e re
du
cció
n p
ob
reza
(Clasificado por reducción de la pobreza en %, línea de pobreza $4 2005 PPA / día)
Ingreso de mercado más pensiones a ingreso disponible
Ingreso de mercado más pensiones a ingreso consumible
Fuente: Lustig (2017)
Fuente: Lustig (2017)
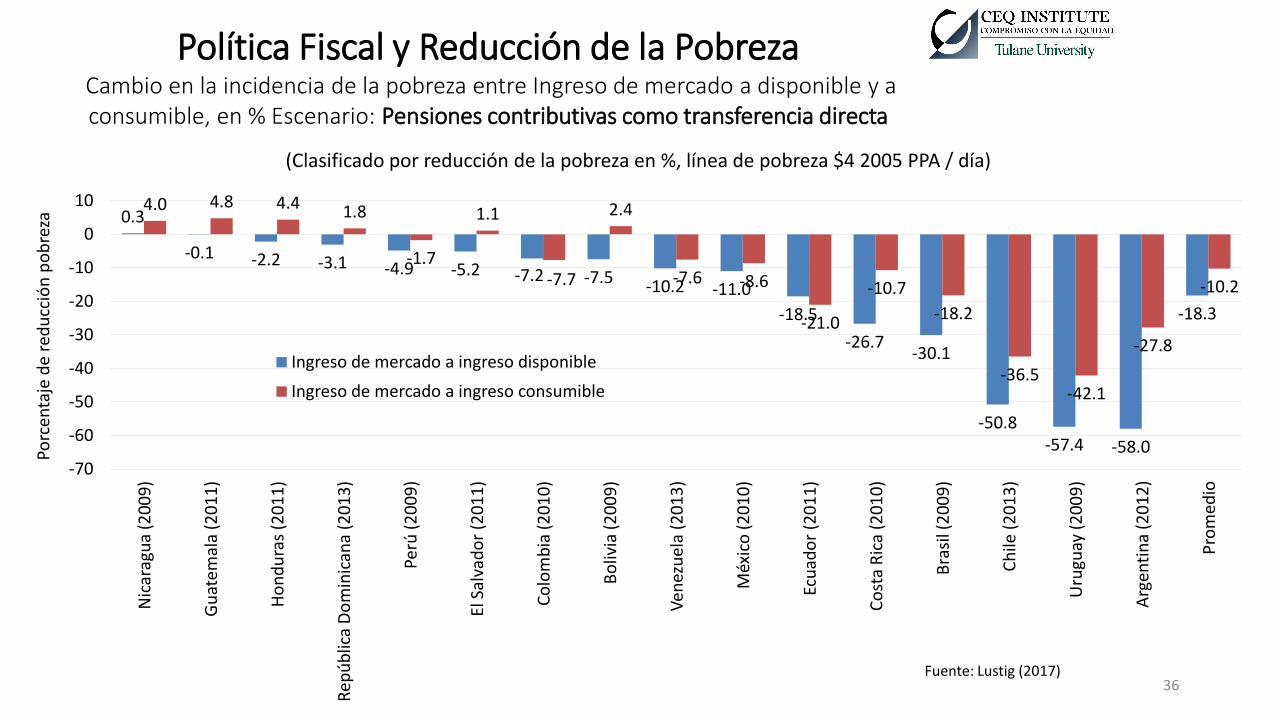
Política Fiscal y Reducción de la Pobreza Cambio en la incidencia de la pobreza entre Ingreso de mercado a disponible y a consumible, en % Escenario: Pensiones contributivas como transferencia directa
36
0.3
-0.1 -2.2 -3.1 -4.9 -5.2 -7.2 -7.5 -10.2 -11.0
-18.5
-26.7 -30.1
-50.8 -57.4 -58.0
-18.3
4.0 4.8 4.4 1.8
-1.7
1.1
-7.7
2.4
-7.6 -8.6
-21.0
-10.7
-18.2
-36.5 -42.1
-27.8
-10.2
-70
-60
-50
-40
-30
-20
-10
0
10
Nic
arag
ua
(20
09
)
Gu
atem
ala
(20
11
)
Ho
nd
ura
s (2
01
1)
Rep
úb
lica
Do
min
ican
a (2
01
3)
Perú
(2
00
9)
El S
alva
do
r (2
01
1)
Co
lom
bia
(2
01
0)
Bo
livia
(20
09
)
Ven
ezu
ela
(20
13
)
Méx
ico
(2
01
0)
Ecu
ado
r (2
01
1)
Co
sta
Ric
a (2
01
0)
Bra
sil (
20
09
)
Ch
ile (
20
13
)
Uru
guay
(2
00
9)
Arg
enti
na
(20
12
)
Pro
med
io
Porc
enta
je d
e re
du
cció
n p
ob
reza
(Clasificado por reducción de la pobreza en %, línea de pobreza $4 2005 PPA / día)
Ingreso de mercado a ingreso disponible
Ingreso de mercado a ingreso consumible
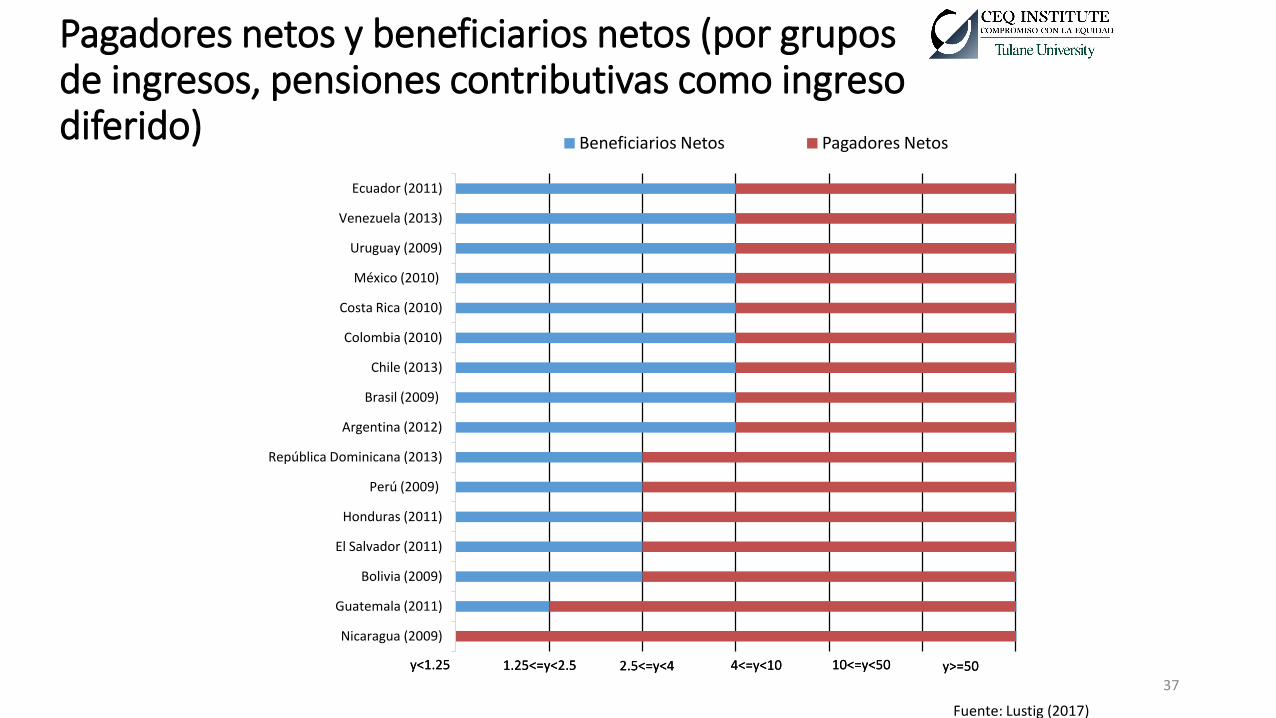
Pagadores netos y beneficiarios netos (por grupos de ingresos, pensiones contributivas como ingreso diferido)
37
Fuente: Lustig (2017)
Nicaragua (2009)
Guatemala (2011)
Bolivia (2009)
El Salvador (2011)
Honduras (2011)
Perú (2009)
República Dominicana (2013)
Argentina (2012)
Brasil (2009)
Chile (2013)
Colombia (2010)
Costa Rica (2010)
México (2010)
Uruguay (2009)
Venezuela (2013)
Ecuador (2011)
Beneficiarios Netos Pagadores Netos
y<1.25 1.25<=y<2.5 2.5<=y<4 4<=y<10 10<=y<50 y>=50 y<1.25 1.25<=y<2.5 2.5<=y<4 4<=y<10 10<=y<50 y>=50
¿Cómo beneficia a los pobres el gasto en educación y salud?
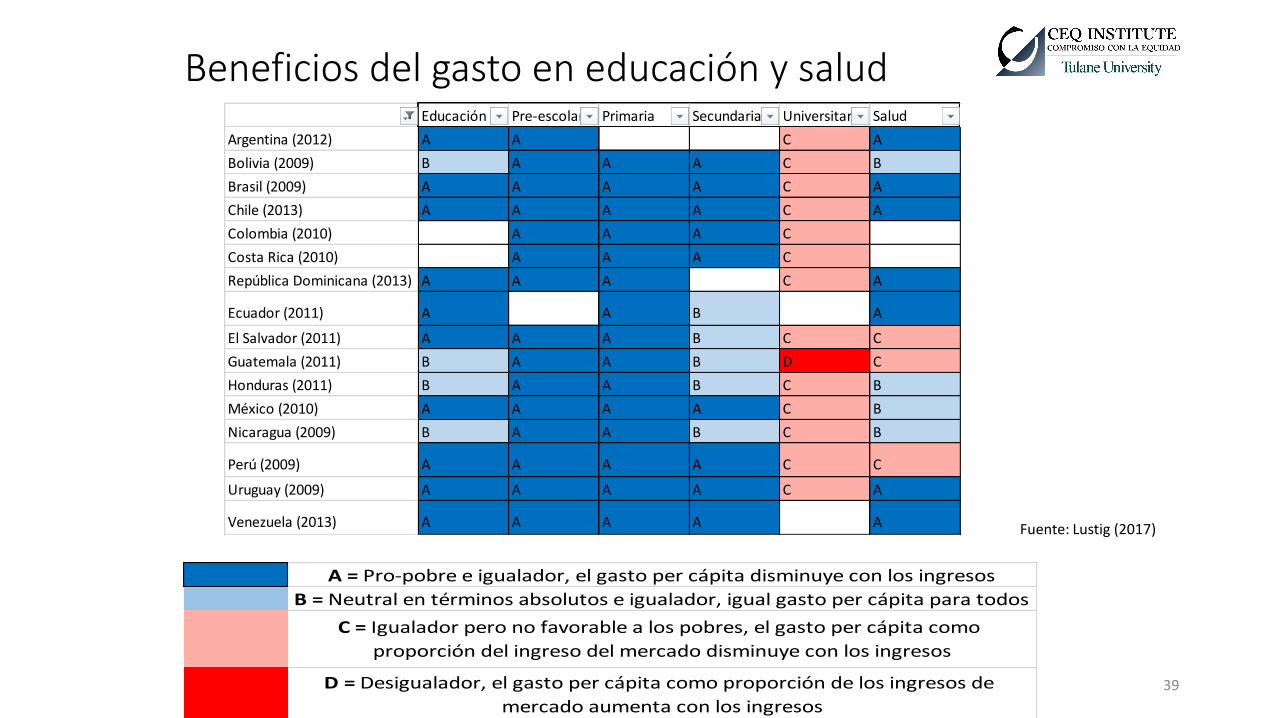
Beneficios del gasto en educación y salud Educación Pre-escolar Primaria Secundaria Universitaria Salud
Argentina (2012) A A C A
Bolivia (2009) B A A A C B
Brasil (2009) A A A A C A
Chile (2013) A A A A C A
Colombia (2010) A A A C
Costa Rica (2010) A A A C
República Dominicana (2013) A A A C A
Ecuador (2011) A A B A
El Salvador (2011) A A A B C C
Guatemala (2011) B A A B D C
Honduras (2011) B A A B C B
México (2010) A A A A C B
Nicaragua (2009) B A A B C B
Perú (2009) A A A A C C
Uruguay (2009) A A A A C A
Venezuela (2013) A A A A A
39
A = Pro-pobre e igualador, el gasto per cápita disminuye con los ingresos
B = Neutral en términos absolutos e igualador, igual gasto per cápita para todos
C = Igualador pero no favorable a los pobres, el gasto per cápita como
proporción del ingreso del mercado disminuye con los ingresos
D = Desigualador, el gasto per cápita como proporción de los ingresos de
mercado aumenta con los ingresos
Fuente: Lustig (2017)
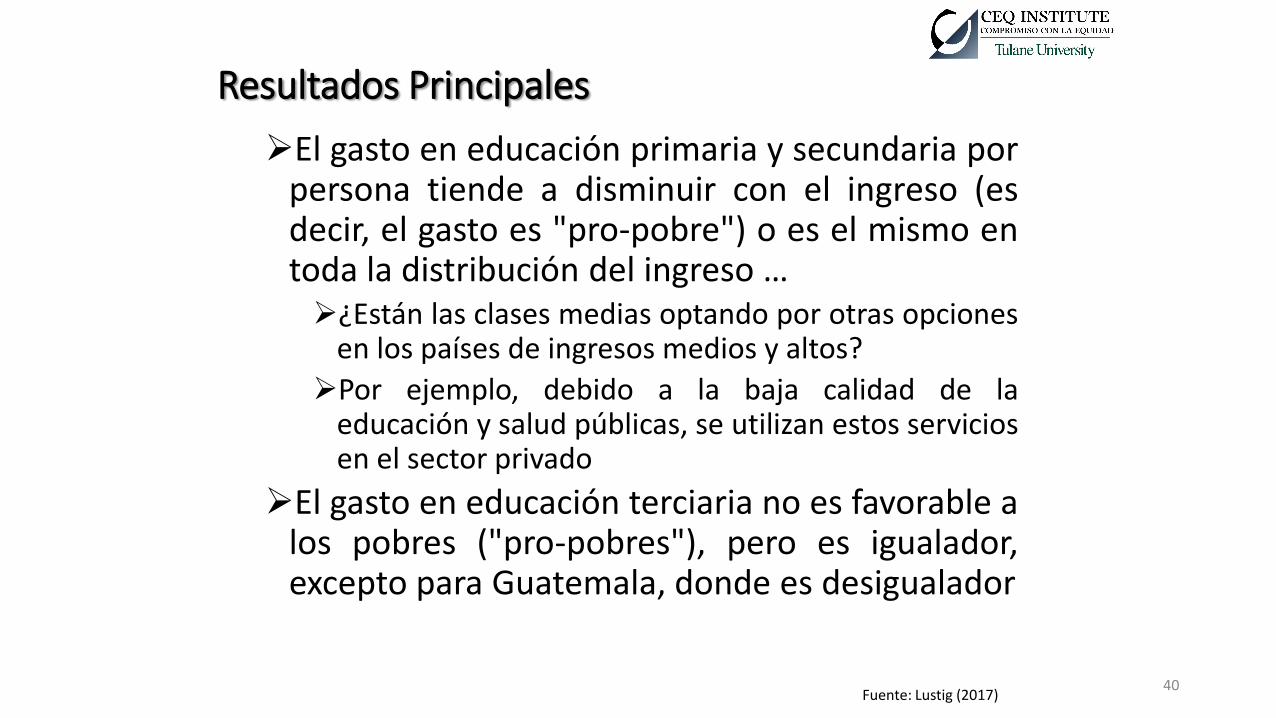
Resultados Principales
El gasto en educación primaria y secundaria por persona tiende a disminuir con el ingreso (es decir, el gasto es "pro-pobre") o es el mismo en toda la distribución del ingreso … ¿Están las clases medias optando por otras opciones
en los países de ingresos medios y altos?
Por ejemplo, debido a la baja calidad de la educación y salud públicas, se utilizan estos servicios en el sector privado
El gasto en educación terciaria no es favorable a los pobres ("pro-pobres"), pero es igualador, excepto para Guatemala, donde es desigualador
40 Fuente: Lustig (2017)
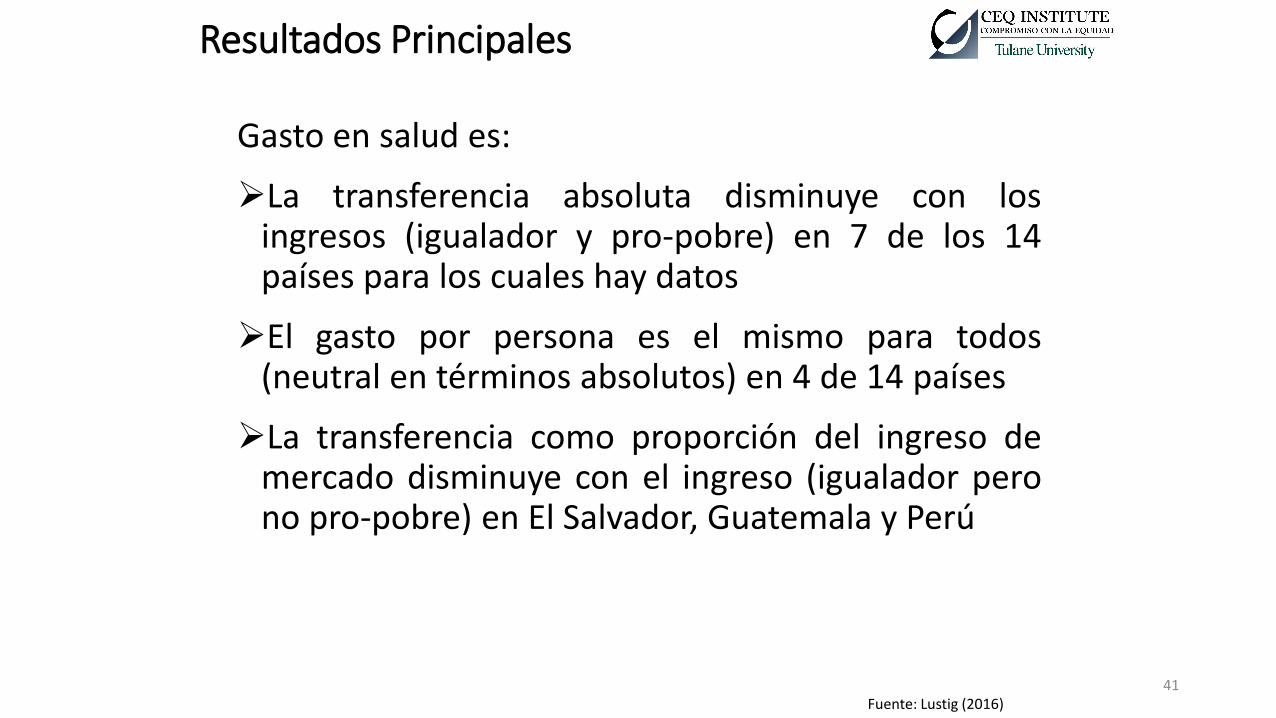
Resultados Principales
Gasto en salud es:
La transferencia absoluta disminuye con los ingresos (igualador y pro-pobre) en 7 de los 14 países para los cuales hay datos
El gasto por persona es el mismo para todos (neutral en términos absolutos) en 4 de 14 países
La transferencia como proporción del ingreso de mercado disminuye con el ingreso (igualador pero no pro-pobre) en El Salvador, Guatemala y Perú
41 Fuente: Lustig (2016)
Referencias: • Bucheli, Marisa, Nora Lustig, Maximo Rossi and Florencia Amabile. 2014. “Social Spending, Taxes and Income Redistribution in Uruguay,” in The
Redistributive Impact of Taxes and Social Spending in Latin America, edited by Nora Lustig, Carola Pessino and John Scott, special issue, Public Finance Review 42, no. 3, pp. 413-433.
• Enami, Ali, Nora Lustig and Rodrigo Aranda. Forthcoming. “Analytical Foundations: Measuring the Redistributive Impact of Taxes and Transfers,” Chapter 2 in Commitment to Equity Handbook. A Guide to Estimating the Impact of Fiscal Policy on Inequality and Poverty, edited by Nora Lustig (Brookings Institution Press and CEQ Institute, Tulane University). Online version October 31, 2016 is available by clicking here.
• Higgins, Sean and Nora Lustig. 2016. “Can a poverty-reducing and progressive tax and transfer system hurt the poor?” Journal of Development Economics 122, pp. 63-75.
• ___________. Forthcoming. “Allocating Taxes and Transfers, Constructing Income Concepts, and Completing Sections A, B, and C of CEQ Master Workbook,” Chapter 5 in Commitment to Equity Handbook. A Guide to Estimating the Impact of Fiscal Policy on Inequality and Poverty, edited by Nora Lustig (Brookings Institution Press and CEQ Institute, Tulane University). Online version October 31, 2016 is available by clicking here.
• Higgins, Sean, Nora Lustig, Whitney Ruble and Timothy Smeeding. 2016. “Comparing the Incidence of Taxes and Social Spending in Brazil and the United States.” Review of Income and Wealth 62, no. 1, pp. 22-46. Published Online May 24, 2015, DOI: 10.1111/roiw.12201.
• Lambert, Peter. 2001. The Distribution and Redistribution of Income, 3rd ed (Manchester University Press).
• Lindert, Peter H. 2004. Growing Public. Social Spending and Economic Growth since the Eighteenth Century. Volumes I and II. Cambridge, U.K.: Cambridge University Press.
• Lustig, Nora. Forthcoming. “Fiscal Policy, Income Redistribution and Poverty Reduction in Low and Middle Income Countries.” Chapter 9 in Commitment to Equity Handbook. A Guide to Estimating the Impact of Fiscal Policy on Inequality and Poverty, edited by Nora Lustig (Brookings Institution Press and CEQ Institute, Tulane University). Online version October 31, 2016 is available by clicking here.
• ___________. 2017. ¨El impacto del sistema tributario y el gasto social en la distribución del ingreso y la pobreza en América Latina: Argentina, Bolivia, Brasil, Chile, Colombia, Costa Rica, Ecuador, El Salvador, Guatemala, Honduras, México, Nicaragua, Perú, República Dominicana, Uruguay y Venezuela,¨ CEQ Working Paper 62, (CEQ Institute, Tulane University), Febrero. Disponible en www.commitmentoequity.org. Será publicado en El Trimestre Económico, Número 335, julio-septiembre 2017.
• _________. 2016. "Inequality and Fiscal Redistribution in Middle Income Countries: Brazil, Chile, Colombia, Indonesia, Mexico, Peru and South Africa." Journal of Globalization and Development 7, no. 1, pp. 17-60. DOI: 10.1515/jgd-2016-0015.
• ________. 2015. “The Redistributive Impact of Government Spending on Education and Health: Evidence from 13 Developing Countries in the Commitment to Equity Project,” Chapter 17 in Inequality and Fiscal Policy, edited by Sanjeev Gupta, Michael Keen, Benedict J. Clements and Ruud A. de Mooij (International Monetary Fund).
42
Equipos y referencias por país: (entre paréntesis: año de la encuesta; C=consumo & I=ingreso) 1. Argentina (2012-13; I): Rossignolo, Dario. 2016. “Taxes, Expenditures, Poverty and Income Distribution in Argentina,” CEQ
Working Paper 45 (CEQ Institute, Tulane University), November.
Rossignolo, Dario. 2016. “CEQ Master Workbook: Argentina. Version: February 29, 2016,” CEQ Data Center (CEQ Institute, Tulane University).
2. Armenia (2011; I): Younger, Stephen D. and Artsvi Khachatryan. Forthcoming. “Fiscal Incidence in Armenia,” in The Distributional Impact of Fiscal Policy: Experience from Developing Countries, edited by Gabriela Inchauste and Nora Lustig (World Bank).
Younger, Stephen D. and Artsvi Khachatryan. 2014. “CEQ Master Workbook: Armenia. Version: May 31, 2014,” CEQ Data Center (CEQ Institute, Tulane University and the World Bank).
3. Bolivia (2009; I): Paz Arauco, Veronica, George Gray-Molina, Wilson Jimenez and Ernesto Yañez. 2014. “Explaining Low Redistributive Impact in Bolivia.” in The Redistributive Impact of Taxes and Social Spending in Latin America, edited by Nora Lustig, Carola Pessino and John Scott, special issue, Public Finance Review 42, no. 3, pp. 326-345.
Paz Arauco, Veronica, George Gray-Molina, Wilson Jimenez and Ernesto Yañez. 2014. “CEQ Master Workbook: Bolivia. Version: September 22, 2014,” CEQ Data Center (CEQ Institute, Tulane University).
4. Brazil (2008-09; I): Higgins, Sean and Claudiney Pereira. 2014. “The Effects of Brazil’s Taxation and Social Spending on the Distribution of Household Income,” in The Redistributive Impact of Taxes and Social Spending in Latin America, edited by Nora Lustig, Carola Pessino and John Scott, Special Issue, Public Finance Review 42, no. 3, pp. 346–67.
Higgins, Sean and Claudiney Pereira. 2016. “CEQ Master Workbook: Brazil. Version: January 4, 2016,” CEQ Data Center (CEQ Institute, Tulane University).
5. Chile (2013, I): Martínez-Aguilar, Sandra, Alan Fuchs, Eduardo Ortiz-Juarez, Giselle Del Carmen. 2017. “The Impact of Fiscal Policy on Inequality and Poverty in Chile,” CEQ Working Paper 46 (CEQ Insitute, Tulane University and the World Bank), January.
Martínez-Aguilar, Sandra and Eduardo Ortiz-Juarez. 2016. “CEQ Master Workbook: Chile. Version: May 5, 2016,” CEQ Data Center (CEQ Institute, Tulane University and the World Bank).
6. Colombia (2010, I): Melendez, Marcela and Valentina Martinez. 2015. “CEQ Master Workbook: Colombia. Version: December 17, 2015,” CEQ Data Center (CEQ Institute, Tulane University and Inter-American Development Bank).
43
Equipos y referencias por país: (entre paréntesis: año de la encuesta; C=consumo & I=ingreso)
7. Costa Rica (2010; I): Sauma, Pablo and Juan Diego Trejos. 2014. “Social Public Spending, Taxes, Redistribution of Income, and Poverty in Costa,” CEQ Working Paper 18 (Center for Inter-American Policy and Research and Department of Economics, Tulane University and Inter-American Dialogue), March.
Sauma, Pablo and Juan D. Trejos. 2014. “CEQ Master Workbook: Costa Rica. Version: February 2014,” CEQ Data Center (CEQ Institute, Tulane University).
8. Dominican Republic (2006-07, I): Aristy-Escuder, Jaime, Maynor Cabrera, Blanca Moreno-Dodson & Miguel Sánchez-Martín. 2016. “Fiscal Policy and Redistribution in the Dominican Republic,” CEQ Working Paper 47 (CEQ Institute, Tulane University and the World Bank), June. Note: budgetary data was for 2013.
Aristy-Escuder, Jaime, Maynor Cabrera, Blanca Moreno-Dodson, and Miguel Sánchez-Martín. 2016. “CEQ Master Workbook: Dominican Republic. Version: August 4, 2016,” CEQ Data Center (CEQ Institute, Tulane University and the World Bank).
9. Ecuador (2011-12, I): Llerena Pinto, Freddy Paul, María Christina Llerena Pinto, Roberto Carlos Saá Daza, and María Andrea Llerena Pinto. 2015. “Social Spending, Taxes and Income Redistribution in Ecuador,” CEQ Working Paper 28 (Center for Inter-American Policy and Research and Department of Economics, Tulane University and Inter-American Dialogue), February.
Llerena Pinto, Freddy Paul, María Cristhina Llerena Pinto, Roberto Carlos Saá Daza and María Andrea Llerena Pinto. 2014. “CEQ Master Workbook: Ecuador. Version: November 7, 2014,” CEQ Data Center (CEQ Institute, Tulane University).
10. El Salvador (2011; I): Beneke, Margarita, Nora Lustig and José Andrés Oliva. 2014. “CEQ Master Workbook: El Salvador. Version: June 26, 2014,” CEQ Data Center (CEQ Institute, Tulane University and Inter-American Development Bank).
11. Ethiopia (2011; C): Hill, Ruth, Gabriela Inchauste, Nora Lustig, Eyasu Tsehaye and Tassew Woldehanna. Forthcoming. “A Fiscal Incidence Analysis for Ethiopia,” in The Distributional Impact of Fiscal Policy: Experience from Developing Countries, edited by Gabriela Inchauste and Nora Lustig (Washington: World Bank).
Hill, Ruth, Eyasu Tsehaye and Tassew Woldehanna. 2014. “CEQ Master Workbook: Ethiopia. Version: September 28, 2014,” CEQ Data Center (CEQ Institute, Tulane University and the World Bank).
44
Equipos y referencias por país: (entre paréntesis: año de la encuesta; C=consumo & I=ingreso)
12. European Union (2011, I) : EUROMOD statistics on Distribution and Decomposition of Disposable Income, accessed at http://www.iser.essex.ac.uk/euromod/statistics/ using EUROMOD version no. G2.0.
13. Georgia (2013; I): Cancho, Cesar and Elena Bondarenko. Forthcoming. “The Distributional Impact of Fiscal Policy in Georgia," in: The Distributional Impact of Fiscal Policy: Experience from Developing Countries, edited by Gabriela Inchauste and Nora Lustig (World Bank).
Cabrera, Maynor and Hilcías E. Morán. 2015. “CEQ Master Workbook: Georgia. Version: December 31, 2015,” CEQ Data Center (CEQ Institute, Tulane University and the World Bank).
14. Ghana (2012-13; C): Younger, Stephen, Eric Osei-Assibey, and Felix Oppong. 2015. “Fiscal Incidence in Ghana,” CEQ Working Paper 35 (CEQ Institute, Tulane University, and Ithaca College, University of Ghana and the World Bank), December.
Younger, Stephen, Eric Osei-Assibey, and Felix Oppong. 2016. “CEQ Master Workbook: Ghana, February 10, 2016,” CEQ Data Center (CEQ Institute, Tulane University).
15. Guatemala (2011; I): Cabrera, Maynor and Hilcías E. Morán. 2015. “CEQ Master Workbook: Guatemala. Version: May 6, 2015,” CEQ Data Center (CEQ Institute, Tulane University, Instituto Centroamericano de Estudios Fiscales (ICEFI) and International Fund for Agricultural Development (IFAD)).
16. Honduras (2011; I): Castaneda, Ricardo and Ilya Espino. 2015. “CEQ Master Workbook: Honduras. Version: August 18, 2015,” CEQ Data Center (CEQ Institute, Tulane University, Instituto Centroamericano de Estudios Fiscales and International Fund for Agricultural Development).
Castaneda, Ricardo and Ilya Espino. 2015. “CEQ Master Workbook: Honduras. Version: August 18, 2015,” CEQ Data Center (CEQ Institute, Tulane University, Instituto Centroamericano de Estudios Fiscales and International Fund for Agricultural Development).
17. Indonesia (2012; C): Afkar, Rythia, Jon Jellema and Matthew Wai-Poi. Forthcoming. “The Distributional Impact of Fiscal Policy in Indonesia,” in The Distributional Impact of Fiscal Policy: Experience from Developing Countries, edited by Gabriela Inchauste and Nora Lustig (World Bank).
Jellema, Jon, Matthew Wai Poi and Rythia Afkar. 2015. “CEQ Master Workbook: Indonesia. Version: February 26, 2015,” CEQ Data Center (CEQ Institute, Tulane University and the World Bank).
45
Equipos y referencias por país: (entre paréntesis: año de la encuesta; C=consumo & I=ingreso) 18. Iran (2011-2012; C & I): Enami, Ali, Nora Lustig, and Alireza Taqdiri. 2016. Fiscal Policy, Inequality and Poverty in Iran: Assessing the Impact and Effectiveness of Taxes and Transfers. Tulane University Economics Working Paper 1605, August 2016.
19. Jordan (2010-11; C): Alam, Shamma A., Gabriela Inchauste and Umar Serajuddin. Forthcoming. “The Distributional Impact of Fiscal Policy in Jordan,” in The Distributional Impact of Fiscal Policy: Experience from Developing Countries, edited by Gabriela Inchauste and Nora Lustig (World Bank).
Abdel-Halim, Morad, Shamma A. Alam, Yusuf Mansur, Umar Serajuddin and Paolo Verme. 2016. “CEQ Master Workbook: Jordan. Version: March 8, 2016,” CEQ Data Center (CEQ Institute, Tulane University and the World Bank).
20. Mexico (2010; C & I): Scott, John. 2014. “Redistributive Impact and Efficiency of Mexico’s Fiscal System,” in The Redistributive Impact of Taxes and Social Spending in Latin America, edited by Nora Lustig, Carola Pessino, John Scott, special issue, Public Finance Review 42, no. 3, pp. 368-390.
Scott, John. 2013. “CEQ Master Workbook: Mexico. Version: September 2, 2013,” CEQ Data Center (CEQ Institute, Tulane University).
21. Peru (2009; I): Jaramillo, Miguel. 2014. “The Incidence of Social Spending and Taxes in Peru,” in The Redistributive Impact of Taxes and Social Spending in Latin America, edited by Nora Lustig, Carola Pessino and John Scott, special issue, Public Finance Review 42, no. 3, pp. 391-412.
Jaramillo, Miguel. 2015. “CEQ Master Workbook: Peru. Version: August 7, 2015,” CEQ Data Center (CEQ Institute, Tulane University).
22. Russia (2010; I): Lopez-Calva, Luis Felipe, Nora Lustig, Mikhail Matytsin and Daria Popova. Forthcoming. “Who Benefits from Fiscal Redistribution in Russia?” in The Distributional Impact of Fiscal Policy: Experience from Developing Countries, edited by Gabriela Inchauste and Nora Lustig. (Washington: World Bank).
Malytsin, Mikhail and Daria Popova. 2016. “CEQ Master Workbook: Russia. Version: March 17, 2016,” CEQ Data Center (CEQ Institute, Tulane University and the World Bank).
23. South Africa (2010-11; I): Inchauste, Gabriela, Nora Lustig, Mashekwa Maboshe, Catriona Purfield, Ingrid Woolard and Precious Zikhali. Forthcoming. “The Distributional Impact of Fiscal Policy in South Africa,” in The Distributional Impact of Fiscal Policy: Experience from Developing Countries, edited by Gabriela Inchauste and Nora Lustig. (Washington: World Bank).
Inchauste, Gabriela, Nora Lustig, Mashekwa Maboshe, Catriona Purfield, Ingrid Woolard and Precious Zikhali. 2016. “CEQ Master Workbook: South Africa. Version: March 6, 2016,” CEQ Data Center (CEQ Institute, Tulane University and the World Bank).
46
Equipos y referencias por país: (entre paréntesis: año de la encuesta; C=consumo & I=ingreso) 24. Sri Lanka (2010; C):
Arunatilake, Nisha, Gabriela Inchauste and Nora Lustig. Forthcoming. “The Incidence of Taxes and Spending in Sri Lanka,” in The Distributional Impact of Fiscal Policy: Experience from Developing Countries, edited by Gabriela Inchauste and Nora Lustig (World Bank).
Arunatilake, Nisha, Camilo Gomez, Nipuni Perera and Kaushalya Attygalle. 2016. “CEQ Master Workbook: Sri Lanka. Version: March 10, 2016,” CEQ Data Center (CEQ Institute, Tulane University and the World Bank).
25. Tanzania (2011-12; C): Younger, Stephen, Flora Myamba, and Kenneth Mdadila. 2016. “Fiscal Incidence in Tanzania,” CEQ Working Paper 36 (CEQ Institute, Tulane University, and Ithaca College and REPOA), January.
Younger, Stephen, Flora Myamba, and Kenneth Mdadila. 2016. “CEQ Master Workbook: Tanzania. Version: June 1, 2016,” CEQ Data Center (CEQ Institute, Tulane University).
26. Tunisia (2010, C): Shimeles, Abebe, Ahmed Moummi, Nizar Jouini and Nora Lustig. 2016. “Fiscal Incidence and Poverty Reduction: Evidence from Tunisia,” CEQ Working Paper 38 (CEQ Institute, Tulane University), November.
Jouini, Nizar, Nora Lustig, Ahmed Moummi, and Abebe Shimeles. 2015. “CEQ Master Workbook: Tunisia. Version: October 1, 2015,” CEQ Data Center (CEQ Institute, Tulane University and African Development Bank).
27. Uganda (2012-2013, C & I): Jellema, Jon, Nora Lustig, Astrid Haas and Sebastian Wolf. 2016. “The Impact of Taxes, Transfers, and Subsidies on Inequality and Poverty in Uganda,” CEQ Working Paper 53 (CEQ Institute, Tulane University and International Growth Center), November.
28. United States (2011, I): Higgins, Sean, Nora Lustig, Whitney Ruble and Timothy Smeeding. 2016. “Comparing the Incidence of Taxes and Social Spending in Brazil and the United States.” Review of Income and Wealth 62, no. 1, pp. 22-46. Published Online May 24, 2015, DOI: 10.1111/roiw.12201
29. Uruguay (2009; I): Bucheli, Marisa, Nora Lustig, Maximo Rossi and Florencia Amabile. 2014. “Social Spending, Taxes and Income Redistribution in Uruguay,” in The Redistributive Impact of Taxes and Social Spending in Latin America, edited by Nora Lustig, Carola Pessino and John Scott, special issue, Public Finance Review 42, no. 3, pp. 413-433.
Bucheli, Marisa, Nora Lustig, Maximo Rossi and Florencia Amabile. 2014. “CEQ Master Workbook: Uruguay. Version: August 18, 2014,” CEQ Data Center (CEQ Institute, Tulane University).
30. Venezuela (2013; I): Molina, Emiro. 2016. “CEQ Master Workbook: Venezuela. Version: November 15, 2016,” CEQ Data Center (CEQ Institute, Tulane University).
47
Gracias
48
Top Related