


Idiomas
Páginas
Jurídico


Investor presentation
10th July 2015
RESULTS Q2 2015
1
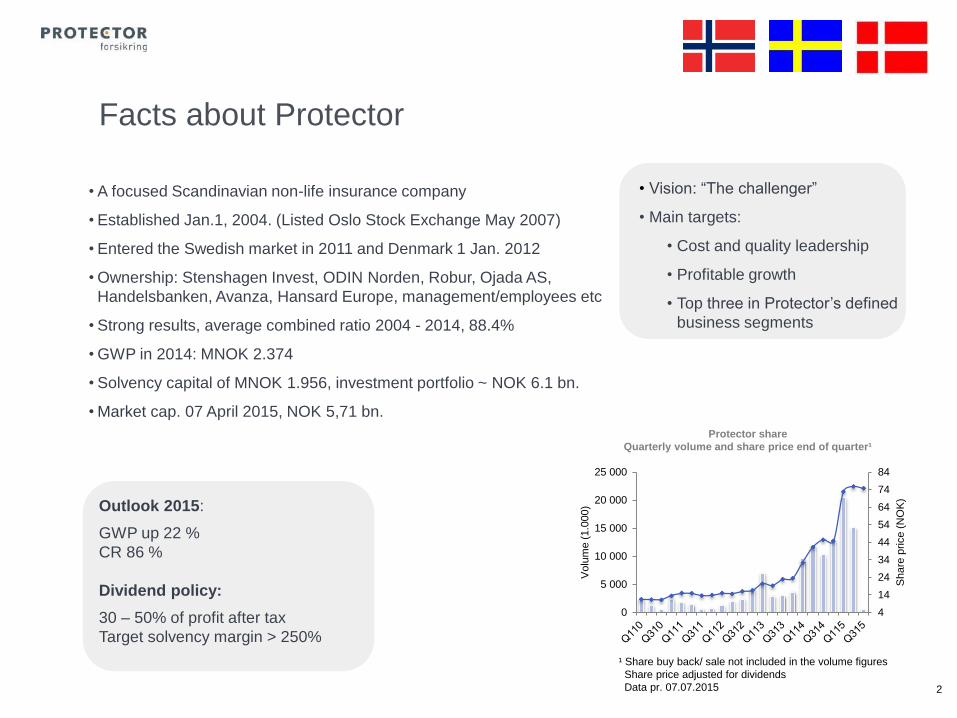
Outlook 2015:
GWP up 22 %
CR 86 %
Dividend policy:
30 – 50% of profit after tax
Target solvency margin > 250%
• Vision: “The challenger”
• Main targets:
• Cost and quality leadership
• Profitable growth
• Top three in Protector’s defined
business segments
2
Facts about Protector
• A focused Scandinavian non-life insurance company
• Established Jan.1, 2004. (Listed Oslo Stock Exchange May 2007)
• Entered the Swedish market in 2011 and Denmark 1 Jan. 2012
• Ownership: Stenshagen Invest, ODIN Norden, Robur, Ojada AS,
Handelsbanken, Avanza, Hansard Europe, management/employees etc
• Strong results, average combined ratio 2004 - 2014, 88.4%
• GWP in 2014: MNOK 2.374
• Solvency capital of MNOK 1.956, investment portfolio ~ NOK 6.1 bn.
• Market cap. 07 April 2015, NOK 5,71 bn.
Protector share
Quarterly volume and share price end of quarter¹
¹ Share buy back/ sale not included in the volume figures
Share price adjusted for dividends
Data pr. 07.07.2015
4
14
24
34
44
54
64
74
84
0
5 000
10 000
15 000
20 000
25 000
Share
price
(NO
K)
Volu
me (
1.0
00)
3
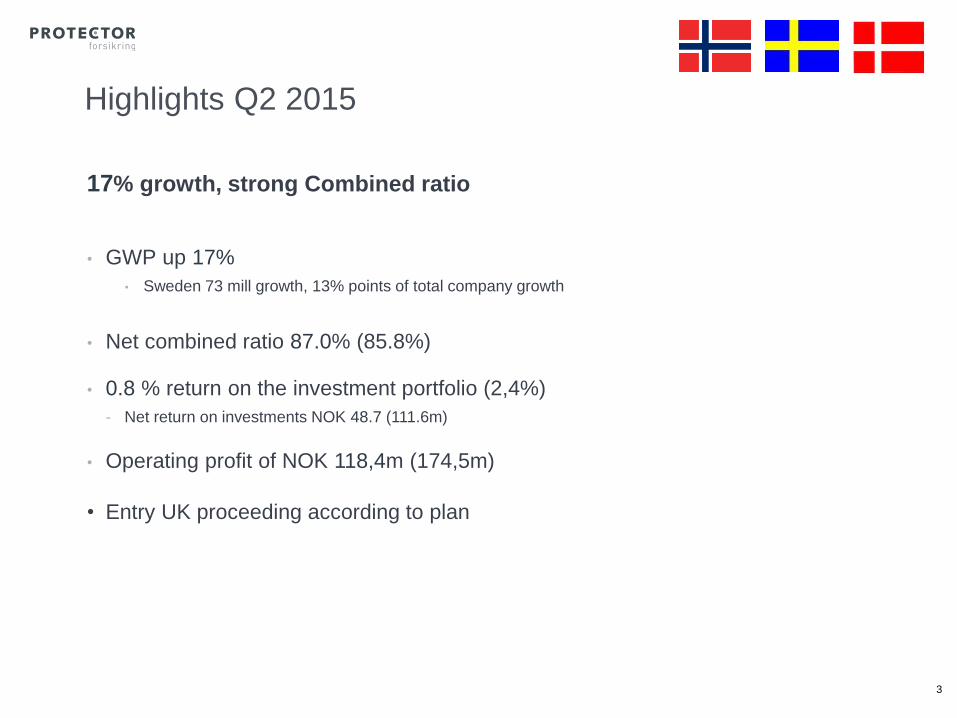
Highlights Q2 2015
17% growth, strong Combined ratio
• GWP up 17%
• Sweden 73 mill growth, 13% points of total company growth
• Net combined ratio 87.0% (85.8%)
• 0.8 % return on the investment portfolio (2,4%)
- Net return on investments NOK 48.7 (111.6m)
• Operating profit of NOK 118,4m (174,5m)
• Entry UK proceeding according to plan
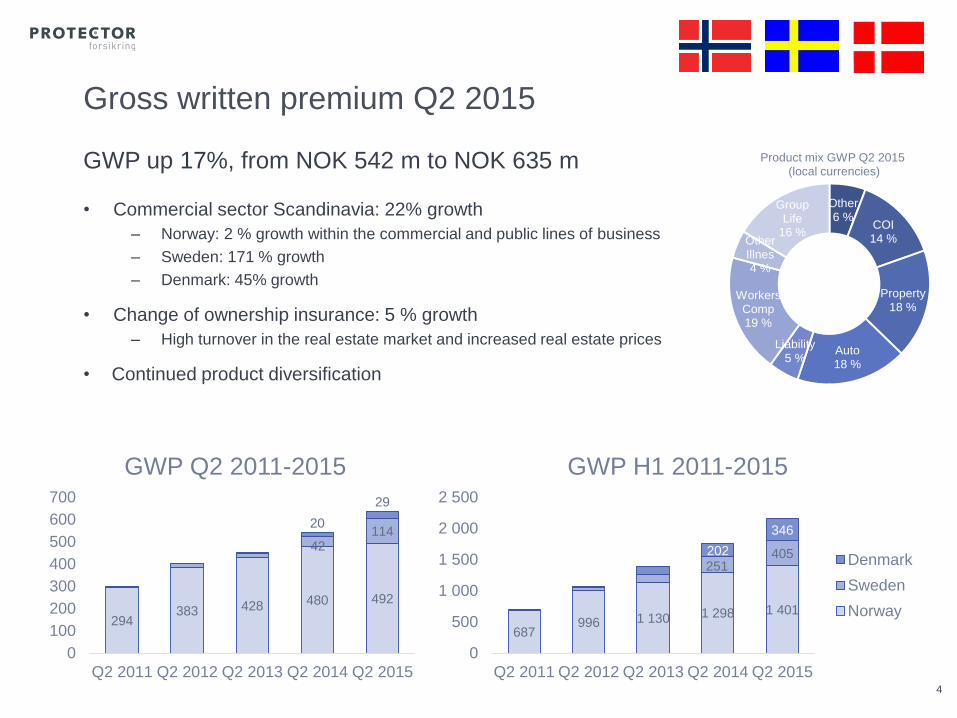
GWP up 17%, from NOK 542 m to NOK 635 m
• Commercial sector Scandinavia: 22% growth
– Norway: 2 % growth within the commercial and public lines of business
– Sweden: 171 % growth
– Denmark: 45% growth
• Change of ownership insurance: 5 % growth
– High turnover in the real estate market and increased real estate prices
• Continued product diversification
4
Gross written premium Q2 2015
Other6 %
COI14 %
Property18 %
Auto18 %
Liability5 %
Workers Comp19 %
Other Illnes4 %
Group Life
16 %
Product mix GWP Q2 2015(local currencies)
294383 428 480 492
42114
20
29
0
100
200
300
400
500
600
700
Q2 2011 Q2 2012 Q2 2013 Q2 2014 Q2 2015
GWP Q2 2011-2015
687996 1 130 1 298 1 401
251405202
346
0
500
1 000
1 500
2 000
2 500
Q2 2011 Q2 2012 Q2 2013 Q2 2014 Q2 2015
GWP H1 2011-2015
Denmark
Sweden
Norway
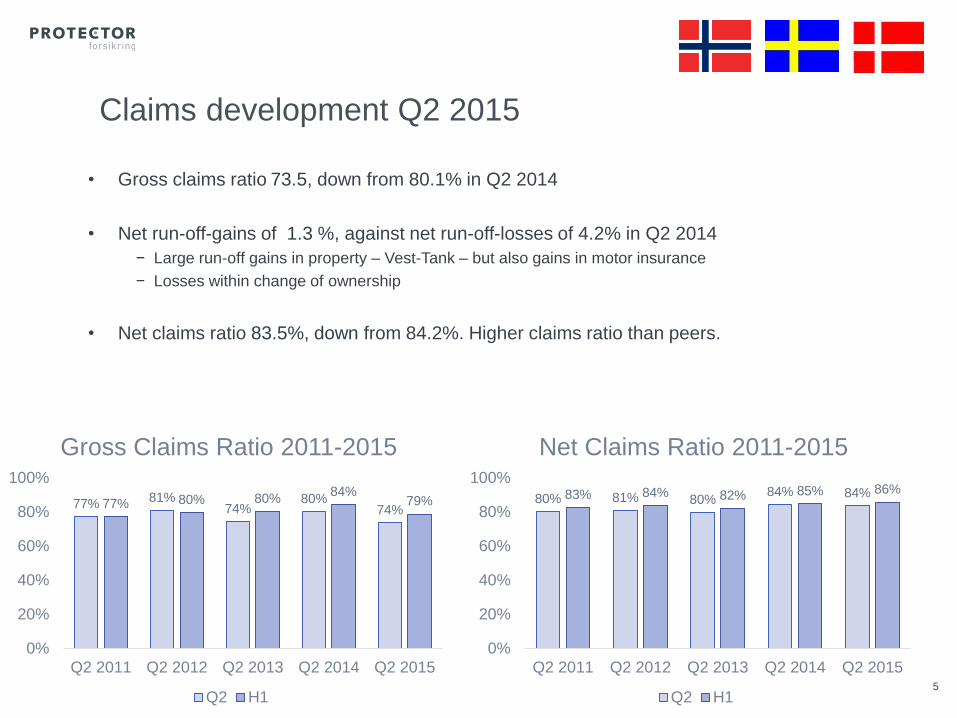
• Gross claims ratio 73.5, down from 80.1% in Q2 2014
• Net run-off-gains of 1.3 %, against net run-off-losses of 4.2% in Q2 2014
− Large run-off gains in property – Vest-Tank – but also gains in motor insurance
− Losses within change of ownership
• Net claims ratio 83.5%, down from 84.2%. Higher claims ratio than peers.
5
Claims development Q2 2015
77%81%
74%80%
74%77% 80% 80%
84%79%
0%
20%
40%
60%
80%
100%
Q2 2011 Q2 2012 Q2 2013 Q2 2014 Q2 2015
Gross Claims Ratio 2011-2015
Q2 H1
80% 81% 80%84% 84%83% 84% 82% 85% 86%
0%
20%
40%
60%
80%
100%
Q2 2011 Q2 2012 Q2 2013 Q2 2014 Q2 2015
Net Claims Ratio 2011-2015
Q2 H1
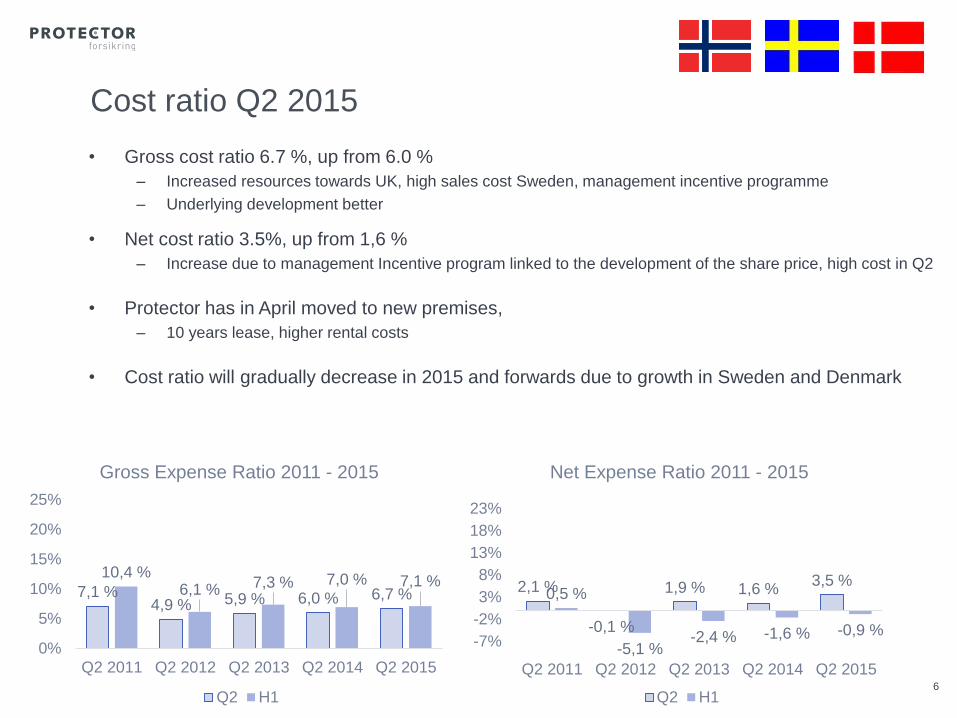
• Gross cost ratio 6.7 %, up from 6.0 %
– Increased resources towards UK, high sales cost Sweden, management incentive programme
– Underlying development better
• Net cost ratio 3.5%, up from 1,6 %
– Increase due to management Incentive program linked to the development of the share price, high cost in Q2
• Protector has in April moved to new premises,
– 10 years lease, higher rental costs
• Cost ratio will gradually decrease in 2015 and forwards due to growth in Sweden and Denmark
6
Cost ratio Q2 2015
7,1 %4,9 % 5,9 % 6,0 % 6,7 %
10,4 %6,1 % 7,3 % 7,0 % 7,1 %
0%
5%
10%
15%
20%
25%
Q2 2011 Q2 2012 Q2 2013 Q2 2014 Q2 2015
Gross Expense Ratio 2011 - 2015
Q2 H1
2,1 %
-0,1 %
1,9 % 1,6 %3,5 %
0,5 %
-5,1 %-2,4 % -1,6 % -0,9 %
-7%
-2%
3%
8%
13%
18%
23%
Q2 2011 Q2 2012 Q2 2013 Q2 2014 Q2 2015
Net Expense Ratio 2011 - 2015
Q2 H1
175 252 289 325 330497
776908
1 042 1 112
0
500
1 000
1 500
2011 2012 2013 2014 2015
GWP 2011-2015
Q2 H1
Very large, GWP > 10 mill, large GWP > 3 mill
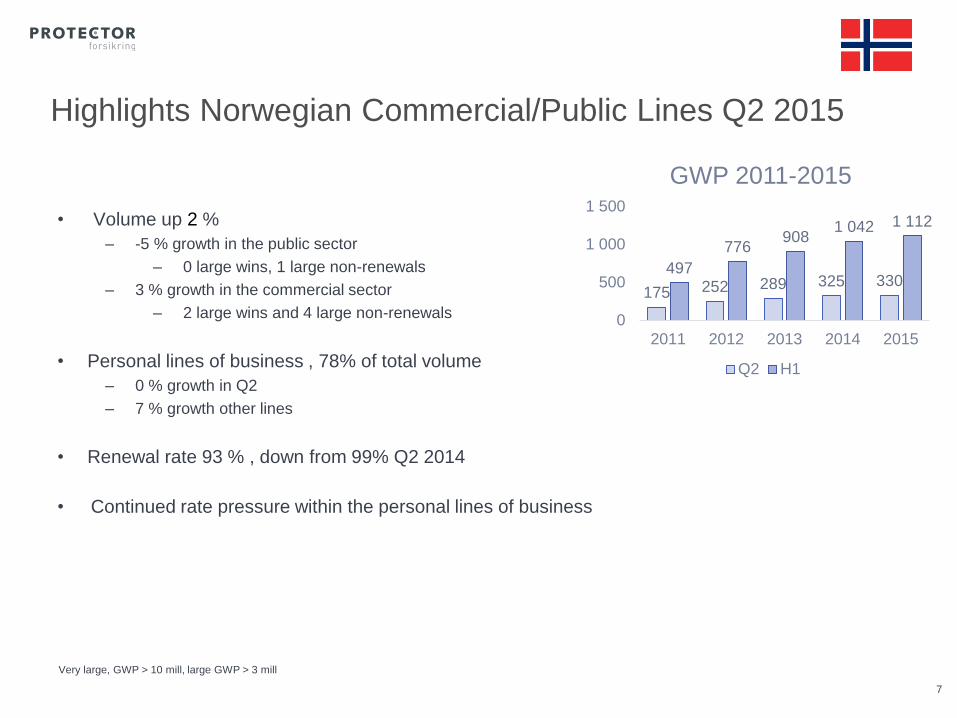
• Volume up 2 %
– -5 % growth in the public sector
– 0 large wins, 1 large non-renewals
– 3 % growth in the commercial sector
– 2 large wins and 4 large non-renewals
• Personal lines of business , 78% of total volume
– 0 % growth in Q2
– 7 % growth other lines
• Renewal rate 93 % , down from 99% Q2 2014
• Continued rate pressure within the personal lines of business
7
Highlights Norwegian Commercial/Public Lines Q2 2015

5 16 20 42115
553
124
251
405
0
100
200
300
400
500
2011 2012 2013 2014 2015
GWP 2011-2015
Q2 H1
• 171 % growth
– 2 very large, 4 large wins, one large non-renewal
– No. 2 in the municipality segment
– Renewal rate 88%
– Growth leads to higher Q2 costs (provisions)
• Net combined 109,2%, 92,9% 1H 2015
– Some medium large claims
– Some segment oriented profitability actions implemented with effect
from 2016 (as always)
• 33 employees/FTEs, strong organization
• Product mix: Auto: 56% - Prop: 25% - Liability 11% - Other 8%
• Strong volume start on Q3
8
Highlights Q2 2015 – Sweden
Very large, GWP > 10 mill, large GWP > 3 mill
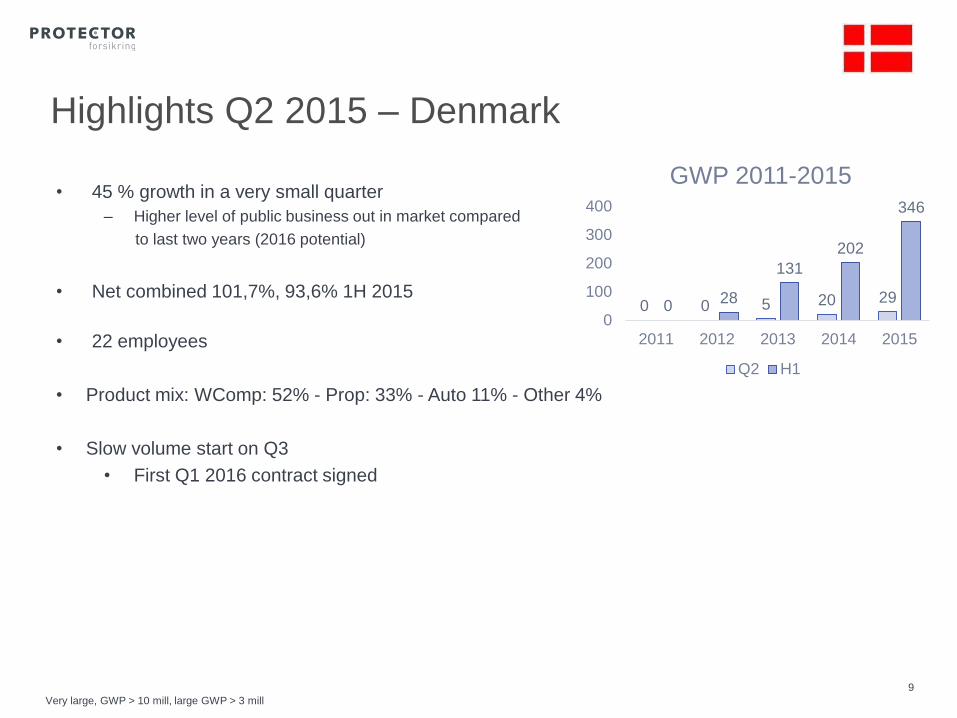
0 0 5 20 290
28
131
202
346
0
100
200
300
400
2011 2012 2013 2014 2015
GWP 2011-2015
Q2 H1
• 45 % growth in a very small quarter
– Higher level of public business out in market compared
to last two years (2016 potential)
• Net combined 101,7%, 93,6% 1H 2015
• 22 employees
• Product mix: WComp: 52% - Prop: 33% - Auto 11% - Other 4%
• Slow volume start on Q3
• First Q1 2016 contract signed
9
Highlights Q2 2015 – Denmark
Very large, GWP > 10 mill, large GWP > 3 mill
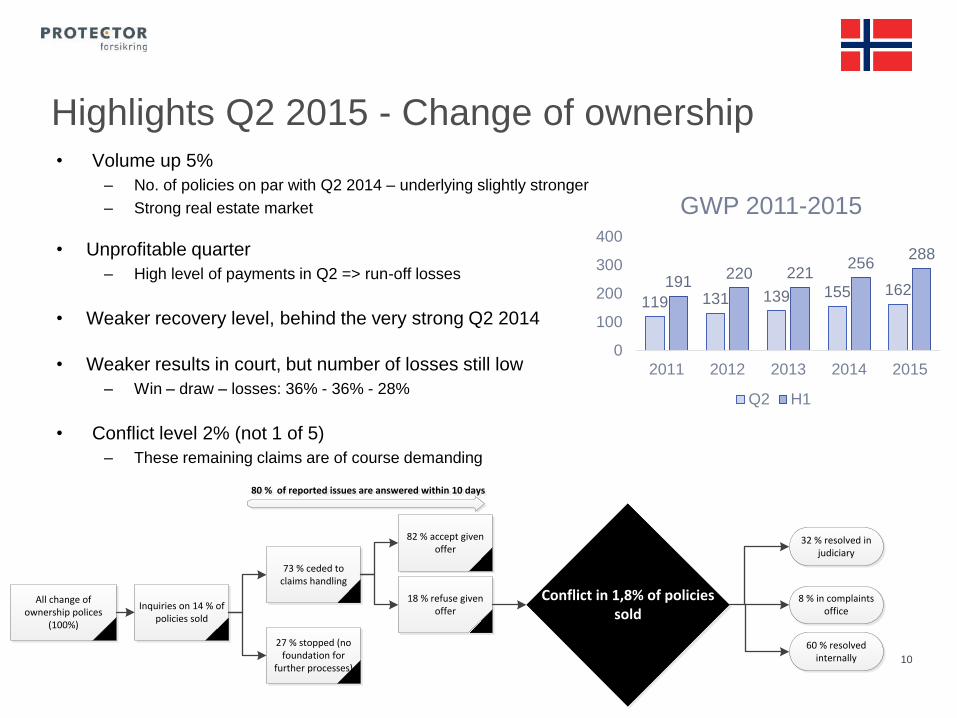
119 131 139 155 162191
220 221256
288
0
100
200
300
400
2011 2012 2013 2014 2015
GWP 2011-2015
Q2 H1
Highlights Q2 2015 - Change of ownership
10
• Volume up 5%
– No. of policies on par with Q2 2014 – underlying slightly stronger
– Strong real estate market
• Unprofitable quarter
– High level of payments in Q2 => run-off losses
• Weaker recovery level, behind the very strong Q2 2014
• Weaker results in court, but number of losses still low
– Win – draw – losses: 36% - 36% - 28%
• Conflict level 2% (not 1 of 5)
– These remaining claims are of course demanding
Inquiries on 14 % of policies sold
73 % ceded to claims handling
27 % stopped (no foundation for
further processes)
82 % accept given offer
18 % refuse given offer
80 % of reported issues are answered within 10 days80 % of reported issues are answered within 10 days
All change of ownership polices
(100%)
32 % resolved in judiciary
8 % in complaints office
60 % resolved internally
Conflict in 1,8% of policies sold
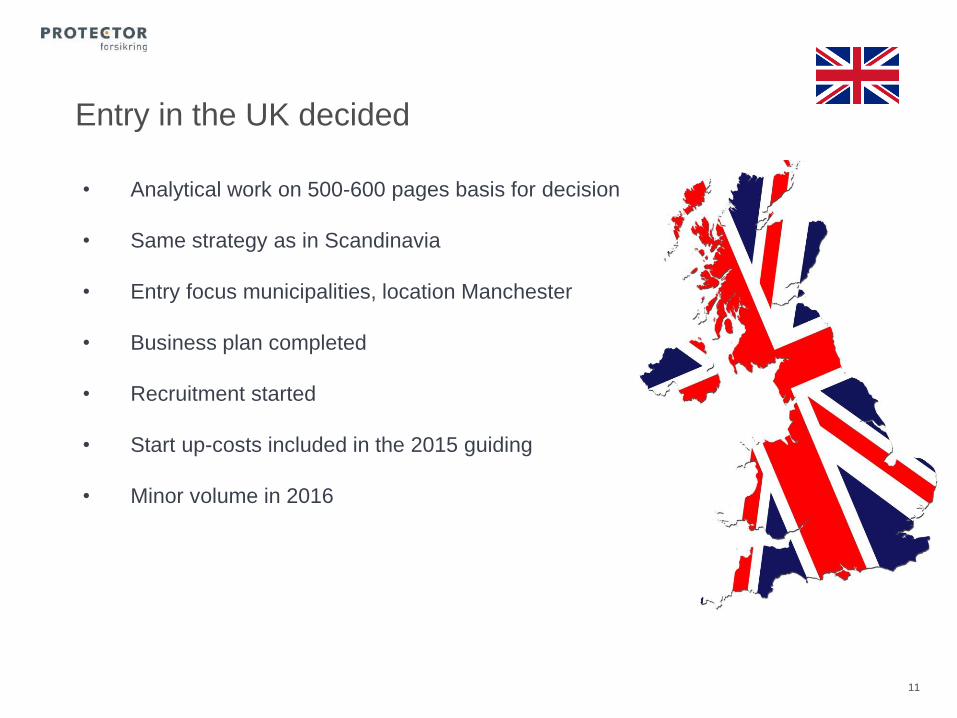
• Analytical work on 500-600 pages basis for decision
• Same strategy as in Scandinavia
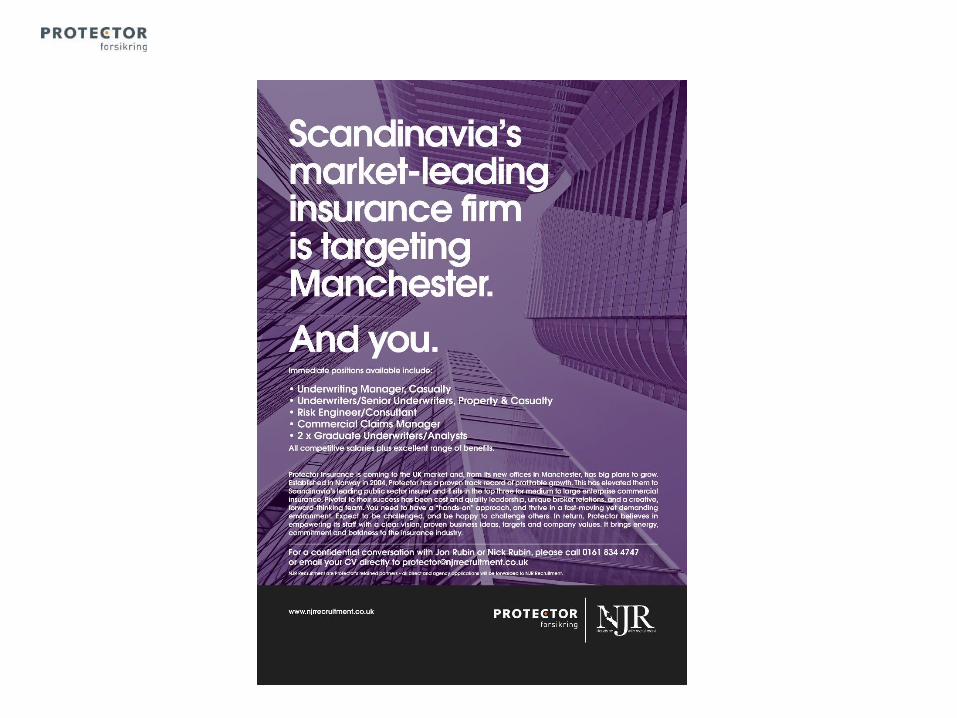
• Entry focus municipalities, location Manchester
• Business plan completed
• Recruitment started
• Start up-costs included in the 2015 guiding
• Minor volume in 2016
11
Entry in the UK decided
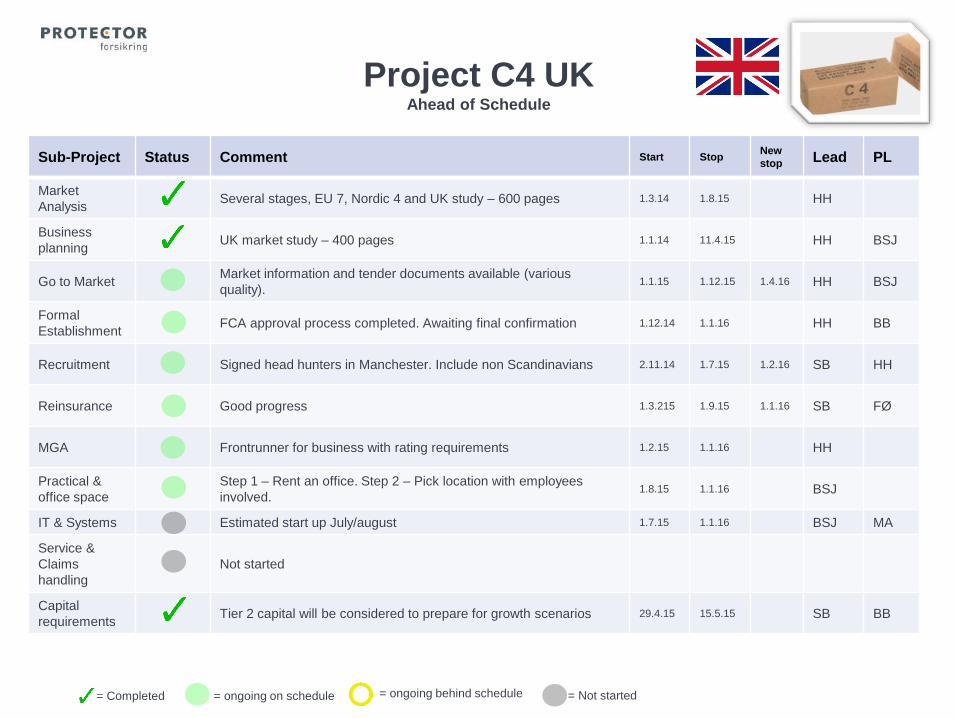
Project C4 UKAhead of Schedule
Sub-Project Status Comment Start StopNew
stop Lead PL
Market
AnalysisSeveral stages, EU 7, Nordic 4 and UK study – 600 pages 1.3.14 1.8.15 HH
Business
planningUK market study – 400 pages 1.1.14 11.4.15 HH BSJ
Go to MarketMarket information and tender documents available (various
quality). 1.1.15 1.12.15 1.4.16 HH BSJ
Formal
EstablishmentFCA approval process completed. Awaiting final confirmation 1.12.14 1.1.16 HH BB
Recruitment Signed head hunters in Manchester. Include non Scandinavians 2.11.14 1.7.15 1.2.16 SB HH
Reinsurance Good progress 1.3.215 1.9.15 1.1.16 SB FØ
MGA Frontrunner for business with rating requirements 1.2.15 1.1.16 HH
Practical &
office space
Step 1 – Rent an office. Step 2 – Pick location with employees
involved.1.8.15 1.1.16 BSJ
IT & Systems Estimated start up July/august 1.7.15 1.1.16 BSJ MA
Service &
Claims
handling
Not started
Capital
requirementsTier 2 capital will be considered to prepare for growth scenarios 29.4.15 15.5.15 SB BB
= Completed = ongoing on schedule = ongoing behind schedule = Not started
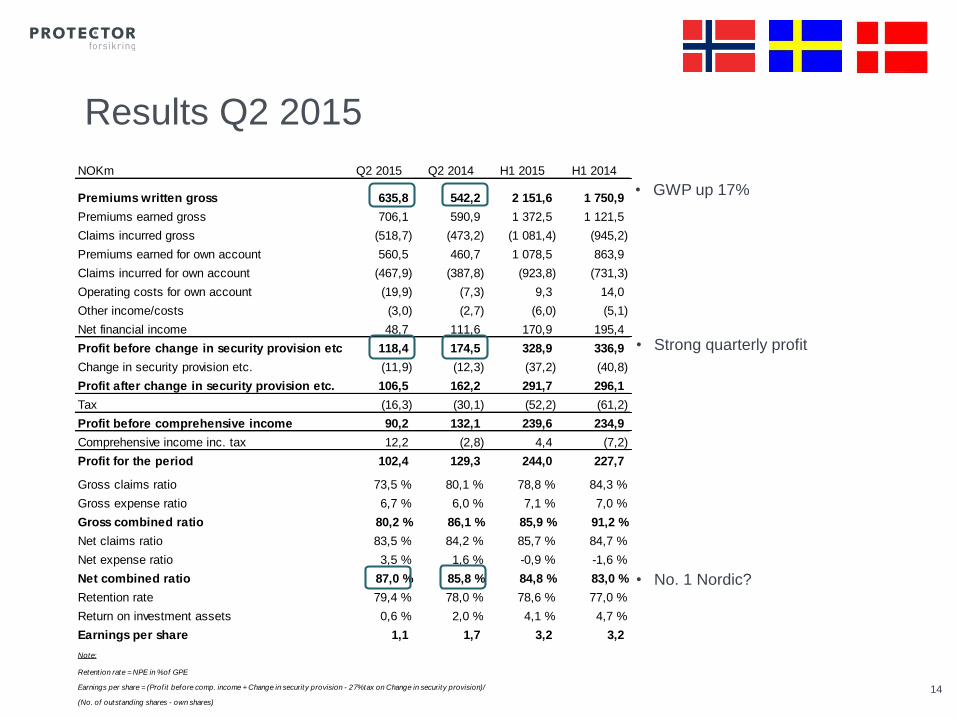
NOKm Q2 2015 Q2 2014 H1 2015 H1 2014
Premiums written gross 635,8 542,2 2 151,6 1 750,9
Premiums earned gross 706,1 590,9 1 372,5 1 121,5
Claims incurred gross (518,7) (473,2) (1 081,4) (945,2)
Premiums earned for own account 560,5 460,7 1 078,5 863,9
Claims incurred for own account (467,9) (387,8) (923,8) (731,3)
Operating costs for own account (19,9) (7,3) 9,3 14,0
Other income/costs (3,0) (2,7) (6,0) (5,1)
Net financial income 48,7 111,6 170,9 195,4
Profit before change in security provision etc. 118,4 174,5 328,9 336,9
Change in security provision etc. (11,9) (12,3) (37,2) (40,8)
Profit after change in security provision etc. 106,5 162,2 291,7 296,1
Tax (16,3) (30,1) (52,2) (61,2)
Profit before comprehensive income 90,2 132,1 239,6 234,9
Comprehensive income inc. tax 12,2 (2,8) 4,4 (7,2)
Profit for the period 102,4 129,3 244,0 227,7
Gross claims ratio 73,5 % 80,1 % 78,8 % 84,3 %
Gross expense ratio 6,7 % 6,0 % 7,1 % 7,0 %
Gross combined ratio 80,2 % 86,1 % 85,9 % 91,2 %
Net claims ratio 83,5 % 84,2 % 85,7 % 84,7 %
Net expense ratio 3,5 % 1,6 % -0,9 % -1,6 %
Net combined ratio 87,0 % 85,8 % 84,8 % 83,0 %
Retention rate 79,4 % 78,0 % 78,6 % 77,0 %
Return on investment assets 0,6 % 2,0 % 4,1 % 4,7 %
Earnings per share 1,1 1,7 3,2 3,2
Note:
Retent ion rate = NPE in % of GPE
Earnings per share = (Prof it before comp. income + Change in security provision - 27% tax on Change in security provision)/
(No. of outstanding shares - own shares)
14
Results Q2 2015
• GWP up 17%
• No. 1 Nordic?
• Strong quarterly profit
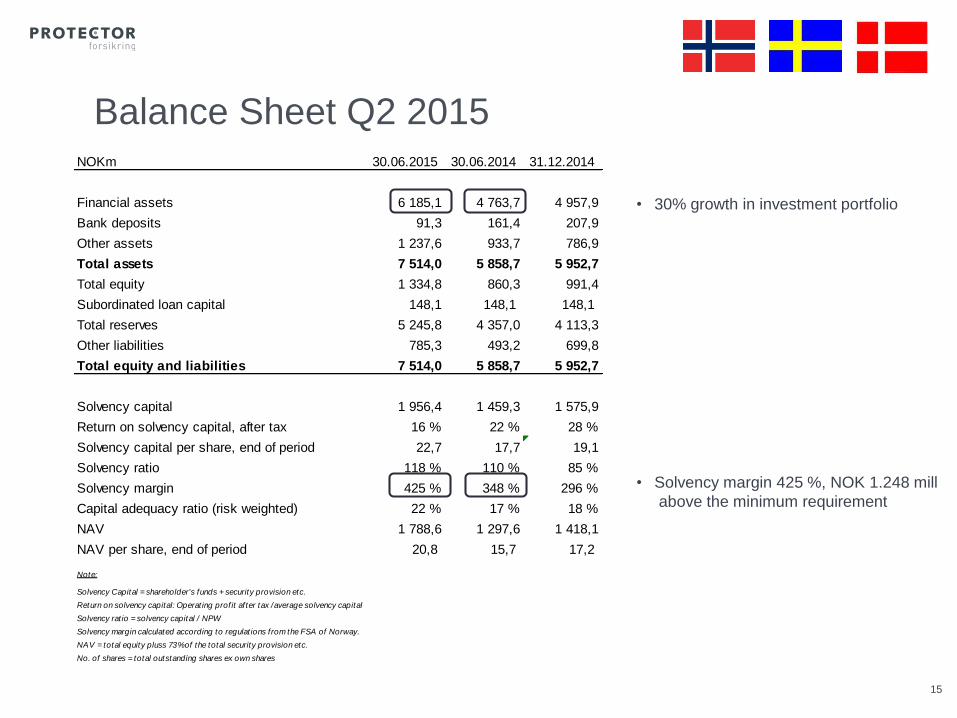
NOKm 30.06.2015 30.06.2014 31.12.2014
Financial assets 6 185,1 4 763,7 4 957,9
Bank deposits 91,3 161,4 207,9
Other assets 1 237,6 933,7 786,9
Total assets 7 514,0 5 858,7 5 952,7
Total equity 1 334,8 860,3 991,4
Subordinated loan capital 148,1 148,1 148,1
Total reserves 5 245,8 4 357,0 4 113,3
Other liabilities 785,3 493,2 699,8
Total equity and liabilities 7 514,0 5 858,7 5 952,7
Solvency capital 1 956,4 1 459,3 1 575,9
Return on solvency capital, after tax 16 % 22 % 28 %
Solvency capital per share, end of period 22,7 17,7 19,1
Solvency ratio 118 % 110 % 85 %
Solvency margin 425 % 348 % 296 %
Capital adequacy ratio (risk weighted) 22 % 17 % 18 %
NAV 1 788,6 1 297,6 1 418,1
NAV per share, end of period 20,8 15,7 17,2
Note:
Solvency Capital = shareholder's funds + security provision etc.
Return on solvency capital: Operat ing prof it af ter tax /average solvency capital
Solvency rat io = solvency capital / NPW
Solvency margin calculated according to regulat ions from the FSA of Norway.
NAV = total equity pluss 73% of the total security provision etc.
No. of shares = total outstanding shares ex own shares
15
• 30% growth in investment portfolio
Balance Sheet Q2 2015
• Solvency margin 425 %, NOK 1.248 mill
above the minimum requirement
SolvencyII, UK & future growth capital discussions
16
• Introduction of Solvency II makes other capital structures possible and attractive
• Protector has low level of debt compared with peers
• UK entry on track, up-side scenarios will be discussed
• The company will consider raising new subordinated loan capital
• Low cost of capital
• Prudent should growth be in excess of 10% the next 3-5 years
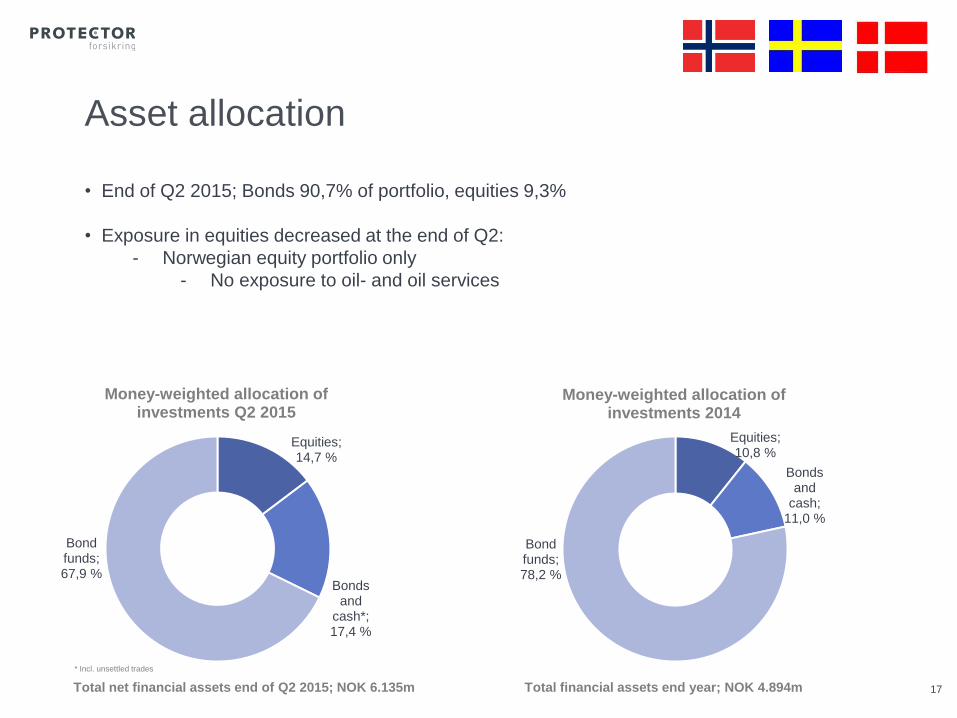
Asset allocation
17
• End of Q2 2015; Bonds 90,7% of portfolio, equities 9,3%
• Exposure in equities decreased at the end of Q2:
- Norwegian equity portfolio only
- No exposure to oil- and oil services
Total financial assets end year; NOK 4.894m Total net financial assets end of Q2 2015; NOK 6.135m
Equities; 14,7 %
Bonds and
cash*; 17,4 %
Bond funds; 67,9 %
Money-weighted allocation of investments Q2 2015
Equities; 10,8 %
Bonds and
cash; 11,0 %
Bond funds; 78,2 %
Money-weighted allocation of investments 2014
* Incl. unsettled trades
18
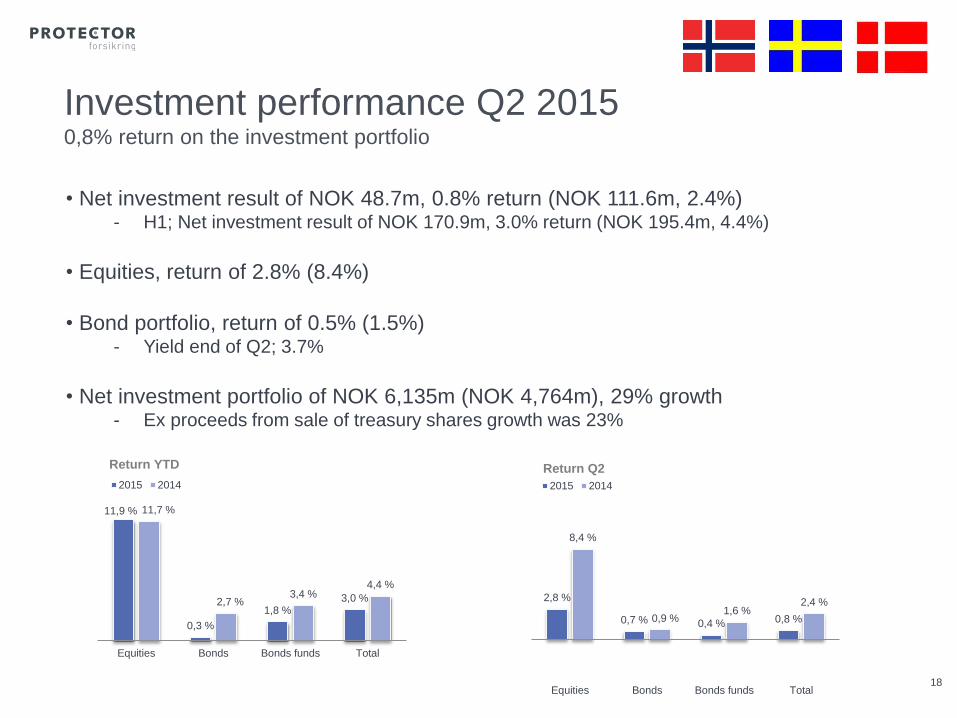
• Net investment result of NOK 48.7m, 0.8% return (NOK 111.6m, 2.4%)- H1; Net investment result of NOK 170.9m, 3.0% return (NOK 195.4m, 4.4%)
• Equities, return of 2.8% (8.4%)
• Bond portfolio, return of 0.5% (1.5%)- Yield end of Q2; 3.7%
• Net investment portfolio of NOK 6,135m (NOK 4,764m), 29% growth- Ex proceeds from sale of treasury shares growth was 23%
Investment performance Q2 20150,8% return on the investment portfolio
11,9 %
0,3 %
1,8 %3,0 %
11,7 %
2,7 %3,4 %
4,4 %
Equities Bonds Bonds funds Total
Return YTD
2015 2014
2,8 %
0,7 % 0,4 % 0,8 %
8,4 %
0,9 %1,6 %
2,4 %
Equities Bonds Bonds funds Total
Return Q2
2015 2014
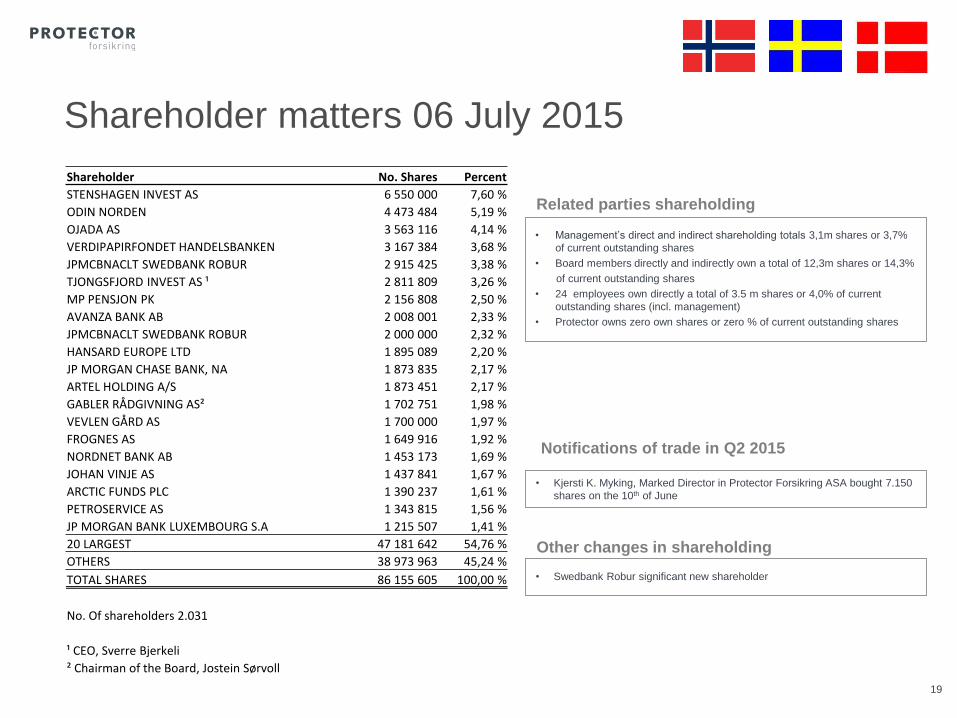
• Management’s direct and indirect shareholding totals 3,1m shares or 3,7%
of current outstanding shares
• Board members directly and indirectly own a total of 12,3m shares or 14,3%
of current outstanding shares
• 24 employees own directly a total of 3.5 m shares or 4,0% of current
outstanding shares (incl. management)
• Protector owns zero own shares or zero % of current outstanding shares
Related parties shareholding
Shareholder matters 06 July 2015
19
• Kjersti K. Myking, Marked Director in Protector Forsikring ASA bought 7.150
shares on the 10th of June
Notifications of trade in Q2 2015
Shareholder No. Shares Percent
STENSHAGEN INVEST AS 6 550 000 7,60 %
ODIN NORDEN 4 473 484 5,19 %
OJADA AS 3 563 116 4,14 %
VERDIPAPIRFONDET HANDELSBANKEN 3 167 384 3,68 %
JPMCBNACLT SWEDBANK ROBUR 2 915 425 3,38 %
TJONGSFJORD INVEST AS ¹ 2 811 809 3,26 %
MP PENSJON PK 2 156 808 2,50 %
AVANZA BANK AB 2 008 001 2,33 %
JPMCBNACLT SWEDBANK ROBUR 2 000 000 2,32 %
HANSARD EUROPE LTD 1 895 089 2,20 %
JP MORGAN CHASE BANK, NA 1 873 835 2,17 %
ARTEL HOLDING A/S 1 873 451 2,17 %
GABLER RÅDGIVNING AS² 1 702 751 1,98 %
VEVLEN GÅRD AS 1 700 000 1,97 %
FROGNES AS 1 649 916 1,92 %
NORDNET BANK AB 1 453 173 1,69 %
JOHAN VINJE AS 1 437 841 1,67 %
ARCTIC FUNDS PLC 1 390 237 1,61 %
PETROSERVICE AS 1 343 815 1,56 %
JP MORGAN BANK LUXEMBOURG S.A 1 215 507 1,41 %
20 LARGEST 47 181 642 54,76 %
OTHERS 38 973 963 45,24 %
TOTAL SHARES 86 155 605 100,00 %
No. Of shareholders 2.031
¹ CEO, Sverre Bjerkeli
² Chairman of the Board, Jostein Sørvoll
• Swedbank Robur significant new shareholder
Other changes in shareholding
20
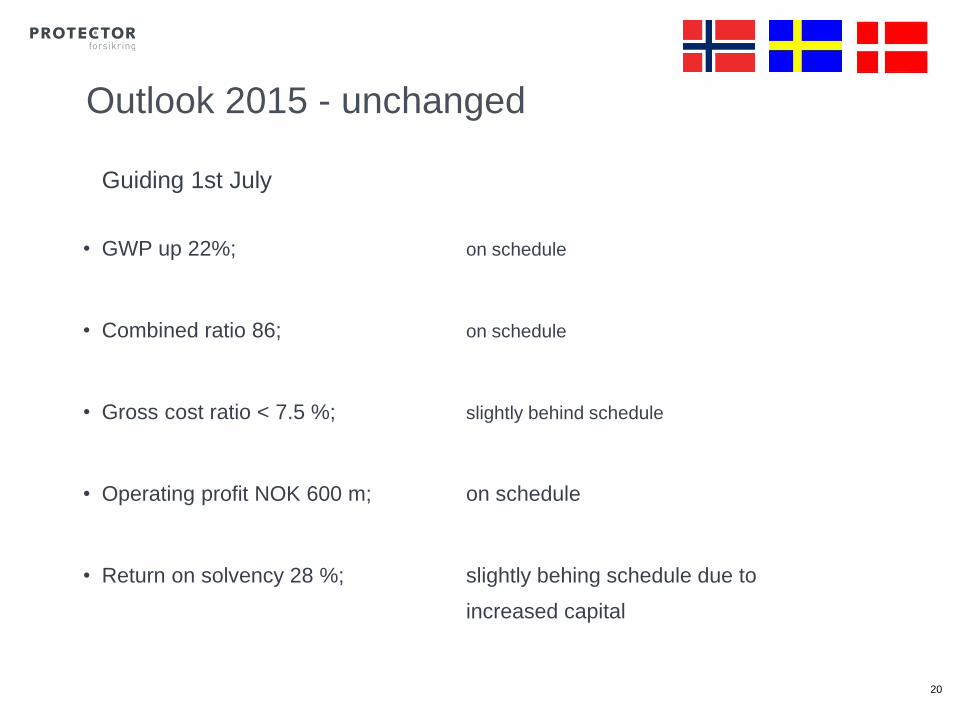
Outlook 2015 - unchanged
Guiding 1st July
• GWP up 22%; on schedule
• Combined ratio 86; on schedule
• Gross cost ratio < 7.5 %; slightly behind schedule
• Operating profit NOK 600 m; on schedule
• Return on solvency 28 %; slightly behing schedule due to
increased capital
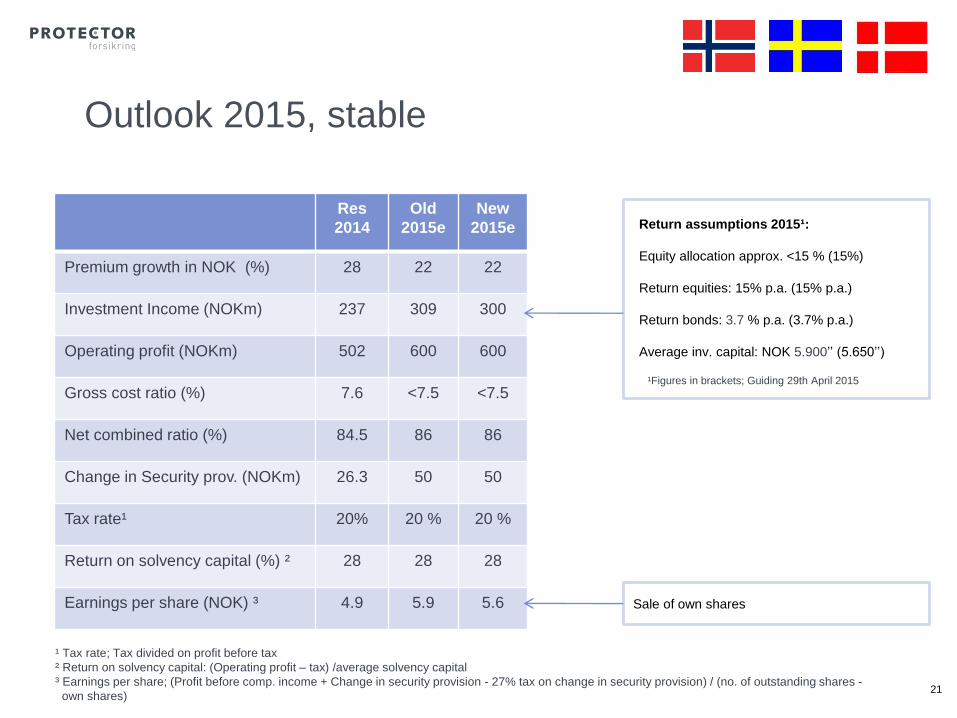
Outlook 2015, stable
Return assumptions 2015¹:
Equity allocation approx. <15 % (15%)
Return equities: 15% p.a. (15% p.a.)
Return bonds: 3.7 % p.a. (3.7% p.a.)
Average inv. capital: NOK 5.900’’ (5.650’’)
Res
2014
Old
2015e
New
2015e
Premium growth in NOK (%) 28 22 22
Investment Income (NOKm) 237 309 300
Operating profit (NOKm) 502 600 600
Gross cost ratio (%) 7.6 <7.5 <7.5
Net combined ratio (%) 84.5 86 86
Change in Security prov. (NOKm) 26.3 50 50
Tax rate¹ 20% 20 % 20 %
Return on solvency capital (%) ² 28 28 28
Earnings per share (NOK) ³ 4.9 5.9 5.6
21
¹Figures in brackets; Guiding 29th April 2015
¹ Tax rate; Tax divided on profit before tax
² Return on solvency capital: (Operating profit – tax) /average solvency capital
³ Earnings per share; (Profit before comp. income + Change in security provision - 27% tax on change in security provision) / (no. of outstanding shares -
own shares)
Sale of own shares
22
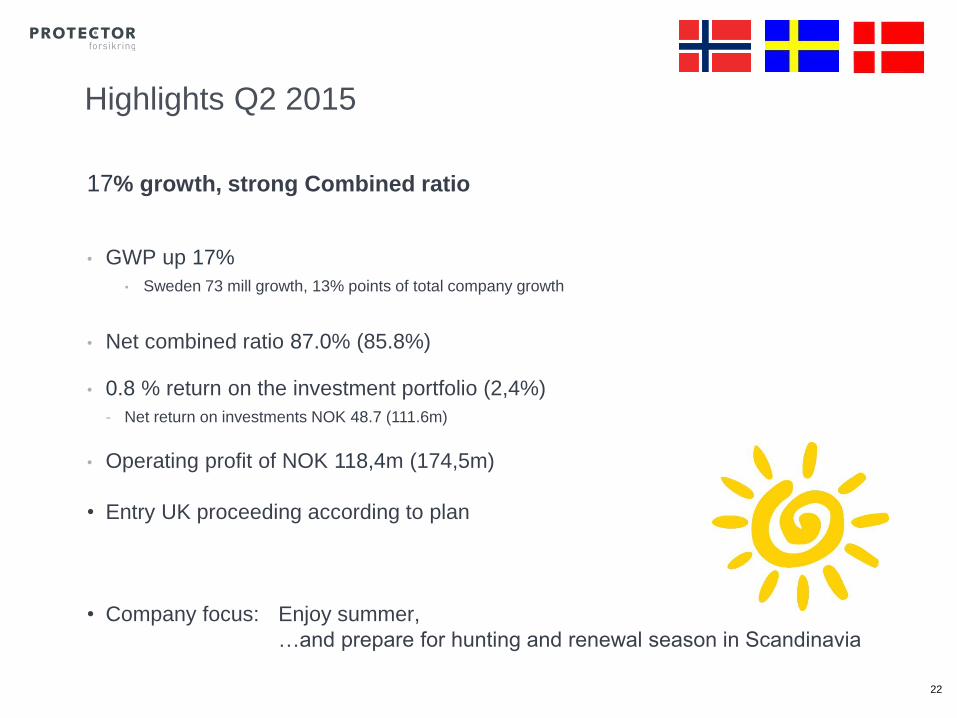
Highlights Q2 2015
17% growth, strong Combined ratio
• GWP up 17%
• Sweden 73 mill growth, 13% points of total company growth
• Net combined ratio 87.0% (85.8%)
• 0.8 % return on the investment portfolio (2,4%)
- Net return on investments NOK 48.7 (111.6m)
• Operating profit of NOK 118,4m (174,5m)
• Entry UK proceeding according to plan
• Company focus: Enjoy summer,
…and prepare for hunting and renewal season in Scandinavia