1Q09 Results Presentation
13
Presentation of 1Q09 Results May 18 ,2009
-
Upload
tegmari -
Category
Investor Relations
-
view
66 -
download
0
Transcript of 1Q09 Results Presentation
Presentation of 1Q09 Results
May 18 ,2009
Presentation of 1Q09 Results
2
The results for the 1Q09 were prepared pursuant to Law11.638/2007 and Provisional Measure 449/2008.
As authorized by Oficial Letter/CVM/SNC/SEP no 02/2009, information related to 1Q08 accompanying the information of 1Q09 was not adjusted for comparative purposes.
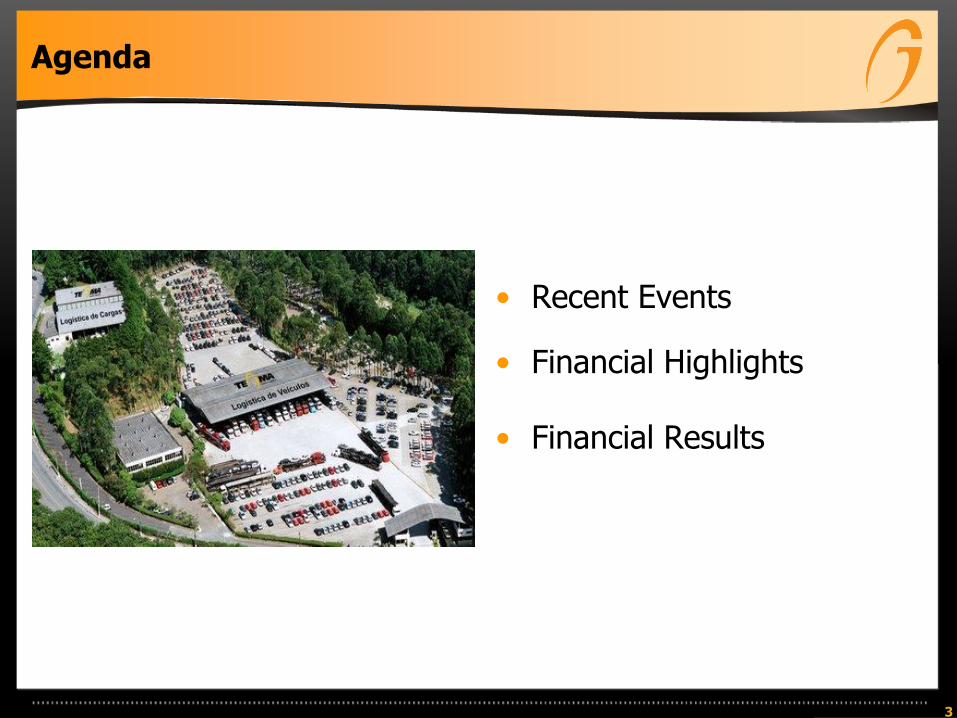
Agenda
• Recent Events
• Financial Highlights
• Financial Results
3
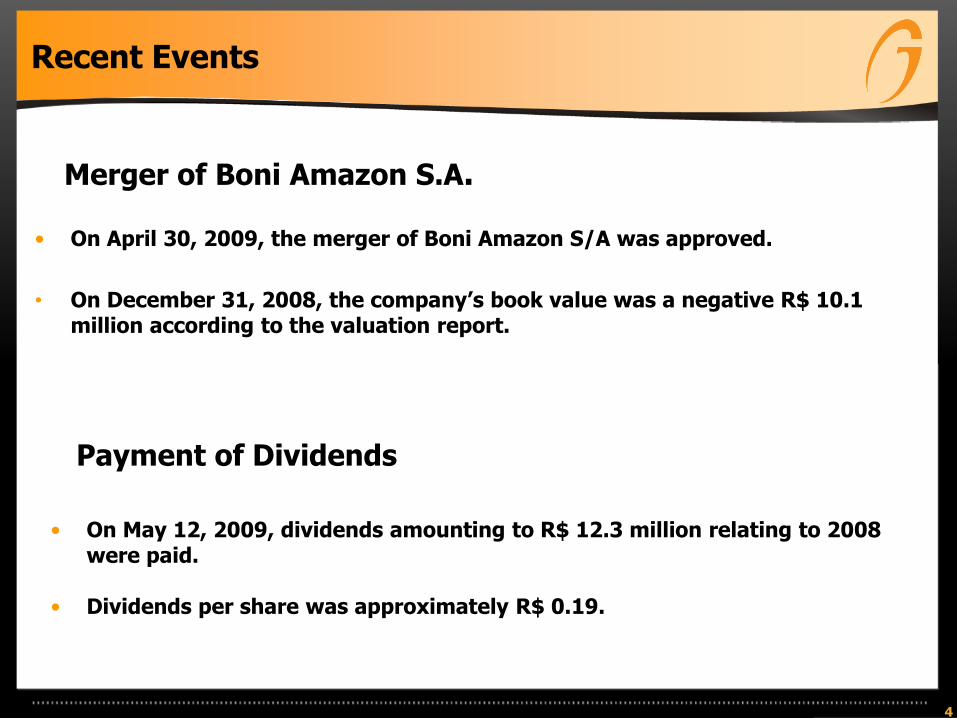
Recent Events
• On May 12, 2009, dividends amounting to R$ 12.3 million relating to 2008 were paid.
• Dividends per share was approximately R$ 0.19.
4
• On April 30, 2009, the merger of Boni Amazon S/A was approved.
• On December 31, 2008, the company’s book value was a negative R$ 10.1 million according to the valuation report.
Merger of Boni Amazon S.A.
Payment of Dividends
5
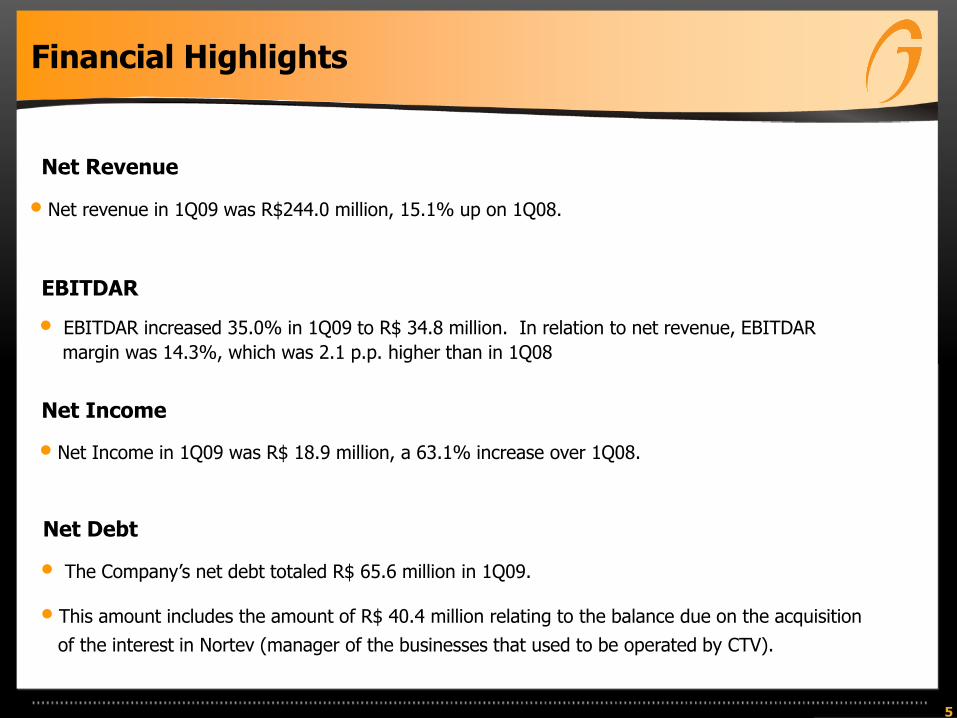
Financial Highlights
• Net revenue in 1Q09 was R$244.0 million, 15.1% up on 1Q08.
• EBITDAR increased 35.0% in 1Q09 to R$ 34.8 million. In relation to net revenue, EBITDAR
margin was 14.3%, which was 2.1 p.p. higher than in 1Q08
• Net Income in 1Q09 was R$ 18.9 million, a 63.1% increase over 1Q08.
Net Income
EBITDAR
Net Revenue
• The Company’s net debt totaled R$ 65.6 million in 1Q09.
• This amount includes the amount of R$ 40.4 million relating to the balance due on the acquisition
of the interest in Nortev (manager of the businesses that used to be operated by CTV).
Net Debt
20.827.2
EBITDAR - R$ Million
171.8
192.9
Net Revenue - R$ Million
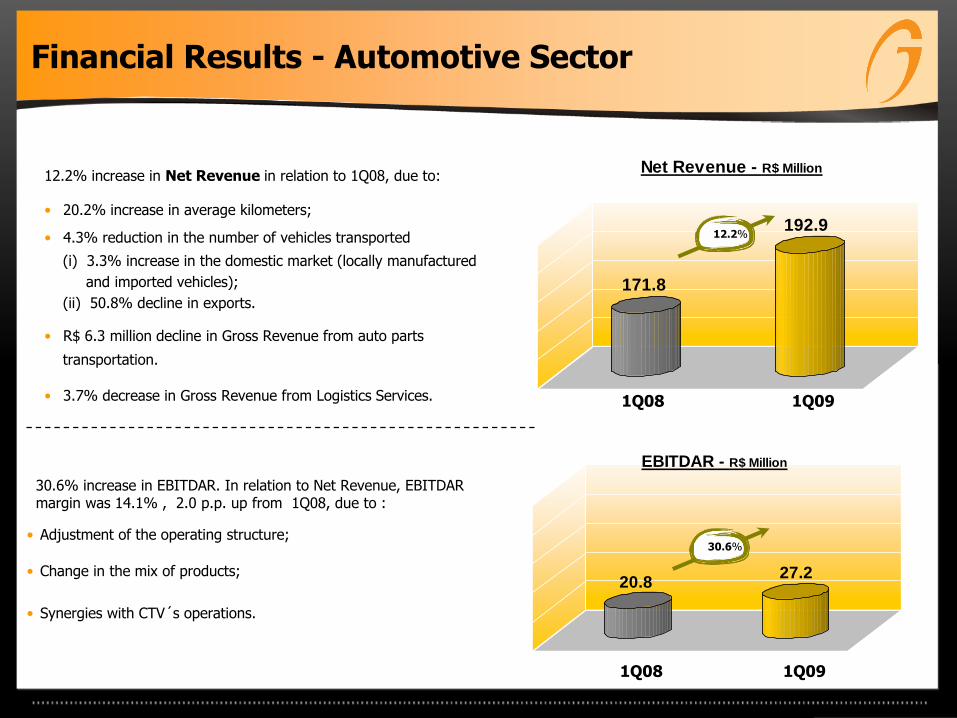
Financial Results - Automotive Sector
30.6% increase in EBITDAR. In relation to Net Revenue, EBITDARmargin was 14.1% , 2.0 p.p. up from 1Q08, due to :
• Adjustment of the operating structure;
• Change in the mix of products;
• Synergies with CTV´s operations.
12.2%
30.6%
12.2% increase in Net Revenue in relation to 1Q08, due to:
• 20.2% increase in average kilometers;
• 4.3% reduction in the number of vehicles transported
(i) 3.3% increase in the domestic market (locally manufactured
and imported vehicles);
(ii) 50.8% decline in exports.
• R$ 6.3 million decline in Gross Revenue from auto parts
transportation.
• 3.7% decrease in Gross Revenue from Logistics Services. 1Q08 1Q09
1Q08 1Q09
5.07.6
EBITDAR - R$ Million
40.1
51.1
Net Revenue - R$ Million
7
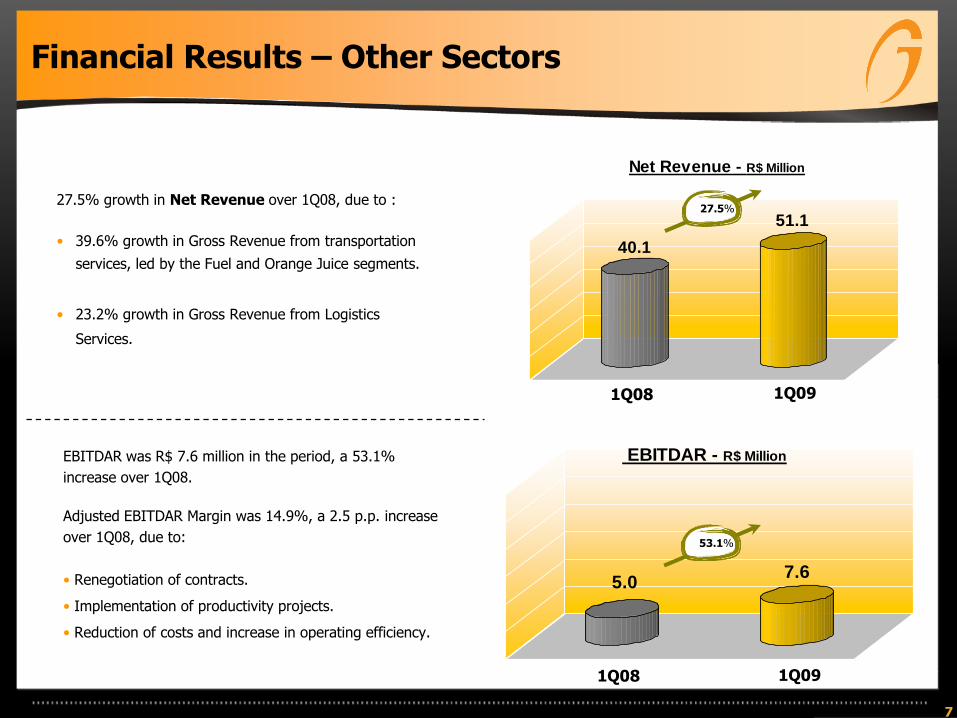
Financial Results – Other Sectors
27.5% growth in Net Revenue over 1Q08, due to :
• 39.6% growth in Gross Revenue from transportation
services, led by the Fuel and Orange Juice segments.
• 23.2% growth in Gross Revenue from Logistics
Services.
27.5%
53.1%
EBITDAR was R$ 7.6 million in the period, a 53.1%
increase over 1Q08.
Adjusted EBITDAR Margin was 14.9%, a 2.5 p.p. increase
over 1Q08, due to:
• Renegotiation of contracts.
• Implementation of productivity projects.
• Reduction of costs and increase in operating efficiency.
1Q08 1Q09
1Q08 1Q09
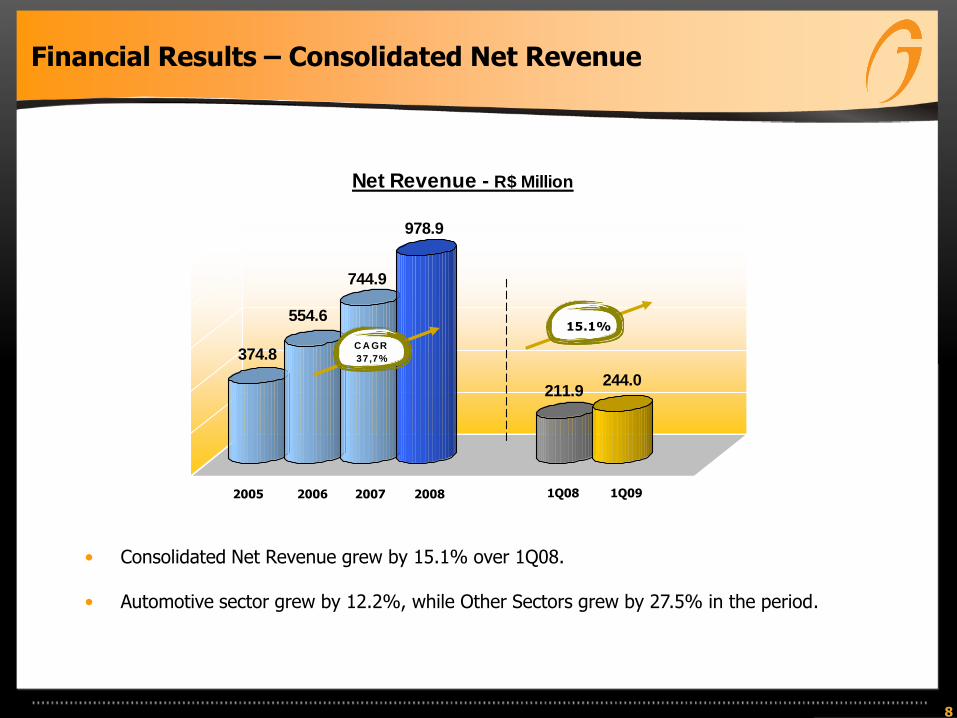
374.8
554.6
744.9
978.9
211.9244.0
Net Revenue - R$ Million
15.1%
C A GR
37,7%
8
Financial Results – Consolidated Net Revenue
• Consolidated Net Revenue grew by 15.1% over 1Q08.
• Automotive sector grew by 12.2%, while Other Sectors grew by 27.5% in the period.
2006 2007 2008 1Q08 1Q092005
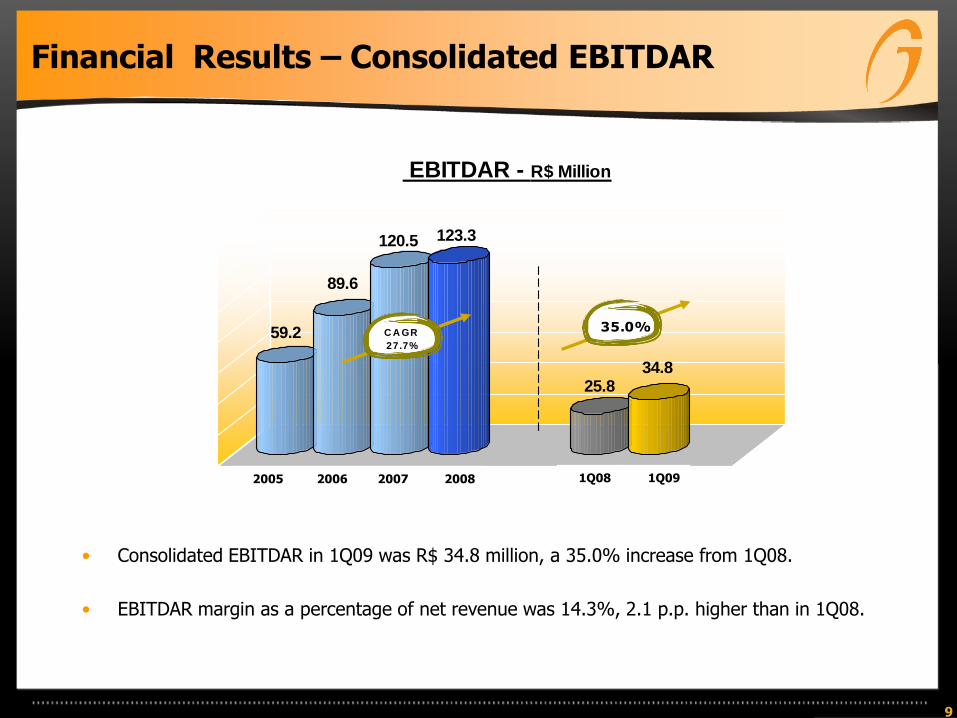
59.2
89.6
120.5 123.3
25.834.8
EBITDAR - R$ Million
35.0%C A GR
27.7%
9
Financial Results – Consolidated EBITDAR
• Consolidated EBITDAR in 1Q09 was R$ 34.8 million, a 35.0% increase from 1Q08.
• EBITDAR margin as a percentage of net revenue was 14.3%, 2.1 p.p. higher than in 1Q08.
2006 2007 2008 1Q08 1Q092005
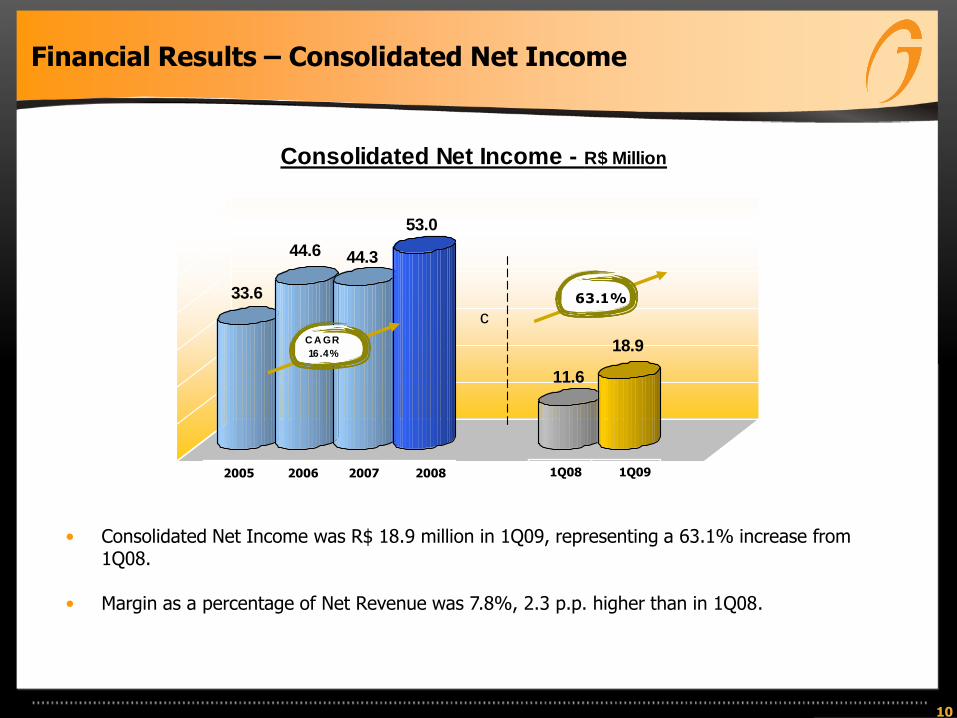
33.6
44.6 44.3
53.0
11.6
18.9
Consolidated Net Income - R$ Million
63.1%
C A GR
16.4%
c
10
Financial Results – Consolidated Net Income
• Consolidated Net Income was R$ 18.9 million in 1Q09, representing a 63.1% increase from 1Q08.
• Margin as a percentage of Net Revenue was 7.8%, 2.3 p.p. higher than in 1Q08.
2006 2007 2008 1Q08 1Q092005
76.9 87.6
134.0 141.6
126.9
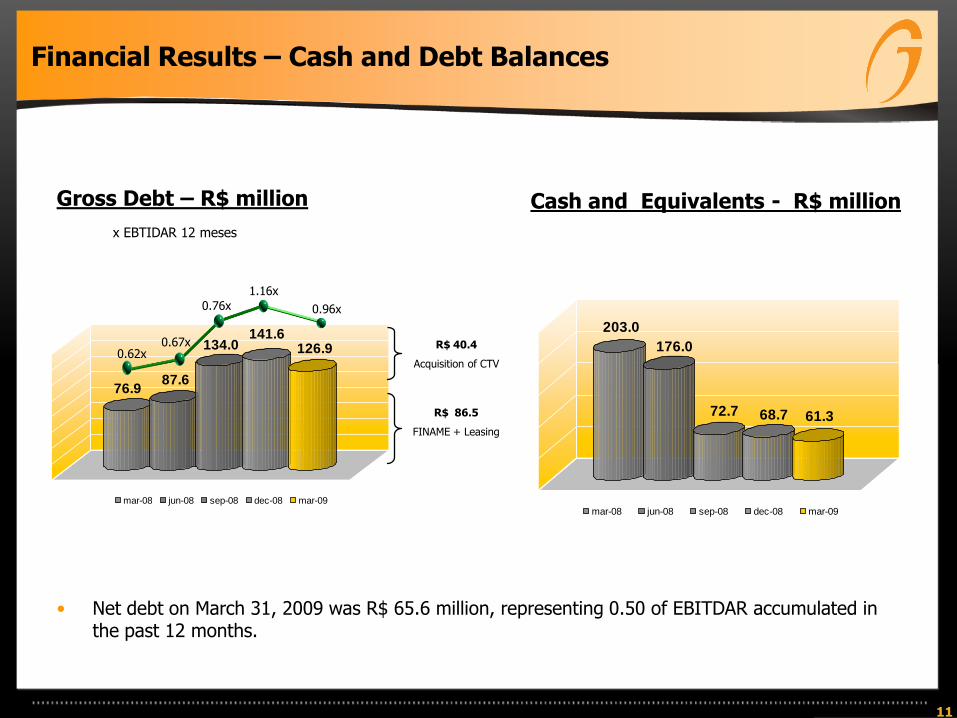
mar-08 jun-08 sep-08 dec-08 mar-09
Financial Results – Cash and Debt Balances
11
Cash and Equivalents - R$ millionGross Debt – R$ million
x EBTIDAR 12 meses
• Net debt on March 31, 2009 was R$ 65.6 million, representing 0.50 of EBITDAR accumulated in the past 12 months.
R$ 40.4
Acquisition of CTV
R$ 86.5
FINAME + Leasing
0.62x
0.76x 0.96x
1.16x
0.67x 203.0
176.0
72.7 68.7 61.3
mar-08 jun-08 sep-08 dec-08 mar-09
IR Contact
Alexandre Brandão
+55 (11) 4346-2532
Hugo Zierth
+55 (11) 4397-9370 [email protected]
12
www.tegma.com.br/ri
13
The forward-looking statements contained in this report are subject to risks and uncertainties,and are based on beliefs and assumptions of our management and information currentlyavailable to the Company. Such statements include information about our current intentions,beliefs or expectations, as well as those of our Board of Directors and Board of ExecutiveOfficers.
The reservations concerning forward-looking statements also apply to information on ourpossible or presumed operating results, as well as declarations preceded by, including orfollowed by such words as "believe", "may", "will", "continue", "expect", "foresee", "intend","plan", "estimate" and other similar expressions.
Forward-looking statements do not constitute a guarantee of performance. Since they refer tothe future, they depend on circumstances that may or may not occur and are therefore subjectto risks, uncertainties and assumptions. Future results and creation of shareholder value maydiffer substantially from those expressed or suggested by the forward-looking statements.These results and values depend on many factors beyond TEGMA’s control or expectations.