cridet suisse Presentation slides
32
First Quarter Results 2008 Zurich April 24, 2008
-
Upload
quarterlyearningsreports2 -
Category
Economy & Finance
-
view
319 -
download
0
Transcript of cridet suisse Presentation slides

First Quarter Results 2008
Zurich
April 24, 2008

Slide 2
Cautionary statement
Cautionary statement regarding forward-looking and non-GAAP information
This presentation contains forward-looking statements within the meaning of the Private Securities Litigation Reform Act of 1995.
Forward-looking statements involve inherent risks and uncertainties, and we might not be able to achieve the predictions, forecasts, projections and other outcomes we describe or imply in forward-looking statements.
A number of important factors could cause results to differ materially from the plans, objectives, expectations, estimates and intentions we express in these forward-looking statements, including those we identify in "Risk Factors" in our Annual Report on Form 20-F for the fiscal year ended December 31, 2007 filed with the US Securities and Exchange Commission, and in other public filings and press releases.
We do not intend to update these forward-looking statements except as may be required by applicable laws.
This presentation contains non-GAAP financial information. Information needed to reconcile suchnon-GAAP financial information to the most directly comparable measures under GAAP can be found in Credit Suisse Group's first quarter report 2008.

Slide 3
First quarter 2008 resultsRenato Fassbind, Chief Financial Officer
Risk management updateWilson Ervin, Chief Risk Officer
IntroductionBrady W. Dougan, Chief Executive Officer
SummaryBrady W. Dougan, Chief Executive Officer

Slide 4
First quarter 2008 resultsRenato Fassbind, Chief Financial Officer
Risk management updateWilson Ervin, Chief Risk Officer
IntroductionBrady W. Dougan, Chief Executive Officer
SummaryBrady W. Dougan, Chief Executive Officer

Slide 5
Private Banking continues to deliver good results demonstrating benefits of a diversified and integrated global business
Solid results across most Investment Banking businesses, masked by valuation reductionsof CHF 5.3 bn
Active management and aggressive reductionof risk exposures
Strong capital and conservative liquidity position
Well positioned to create long-term value andseize opportunities that arise from market dislocation
WM with asset inflows ofCHF 13.5 bn and CRB with strong pre-tax income
Very strong revenues inprime services, global rates and foreign exchange
CMBS and leveraged finance exposures down 25% and 41%, respectively
Tier 1 ratio of 9.8%

Slide 6
Results overview
Net revenues 3,019 (72)% (54)%
Compensation and benefits 3,245 (34)% (6)%
Other operating expenses 2,195 3% (19)%
Total operating expenses 5,440 (23)% (12)%
Pre-tax income / (loss) (2,572) − −
Net income / (loss) (2,148) − −
Diluted EPS in CHF (2.10) − −
vs. 4Q07vs. 1Q071Q08Change in % from
CHF m, except where indicated
Note: Based on Core Results, i.e. excluding results from minority interests without significant interest

Slide 7
1,4391,990
1,377 1,324
(468)
257
(849)
(247)
(3,460)
Divisional performance overview
1) Before losses from securities purchased from our money market funds
Asset Management
! Stable management and administrative fees
! Further valuation adjustments on our money market assets
Pre-tax income in CHF m
Investment Banking
! Most businesses performed well; some at record levels
! Significant writedowns in leveraged finance and structured products
Private Banking
! Stability of results in challenging environment
! Good asset inflows and hiring momentum for Relationship Managers
1Q07 4Q07 1Q08 1Q07 4Q07 1Q081Q07 4Q07 1Q08
1)5271)98

Slide 8
Wealth Management continues to deliver good results
! Client base remains strong, but market volatility leads to cautious client behavior
! Continued expansion of leading franchise
−Good net new asset inflows of CHF 13.5 bn, mainly from Switzerland and Americas
−Continued good momentum in hiring Relationship Managers
! Costs contained despite ongoing investments
Pre-tax incomeCHF m
1Q07 2Q07 3Q07
(13)%
(12)%
988
Pre-tax income margin in %41.5 42.0 38.4 39.4 37.2
4Q07 1Q08
1,001900
976860

Slide 9
Wealth Management with stable gross margin
Net revenues and gross margin on assets under managementCHF m and basis points (bp)
!CHF 102 m, or 6%, increase in recurring revenues vs. 1Q07
−Recurring margin up 7 bp to 85 bp vs. 1Q07
!Decrease in transaction-based revenues due to lower client activity
−Transaction-based margin down 8 bpto 32 bp YoY
! Recurring revenues 73% of total revenues;up from 66% in 1Q07
1,582 1,582 1,707 1,766 1,684 Recurring revenues797 802 637 710 629 Transaction-based
revenues
1Q07 2Q07 3Q07 4Q07 1Q08
2,379 2,384 2,344 2,476 2,313
118 bp 113 bp 112 bp117 bp 117 bp
(3)%
(7)%

Slide 10
Good net new asset growth in Wealth Management
Assets under management (AuM)CHF bn
End of 4Q07
End of 1Q08
Currency
Net newassets
838.6838.6
+13.5+13.5
(59.5)(59.5)
Net new assets (NNA)CHF bn
(43.2)(43.2)Market
movements
749.4749.41Q07 2Q07 3Q07
15.2
Rolling four-quarter NNA growth on AuM in %7.0 6.7 6.2 6.4 6.0
4Q07 1Q08
13.3
9.7
12.0
13.5
(11)%
2.1
2.5
3.6
5.3
EMEA
APAC
Americas
Switzerland

Slide 11
Corporate & Retail Banking achieves strong results
Pre-tax incomeCHF m
! Strong results reflect solid economic environment in Switzerland
! Includes fair value gains of CHF 64 m on a synthetic collateralized loan portfolio
! Net new assets of CHF 3.6 bn from pension funds and retail clients
1Q07 2Q07 3Q07
+3%
+16%
451
Pre-tax income margin in %45.7 39.2 39.7 40.0 44.5
4Q07 1Q08
380 389 401
464

Slide 12
Solid results across most Investment Banking businesses masked by valuation reductionsPre-tax income / (loss)CHF m
! Leveraged finance and structured products businesses with combined net valuations reductions of CHF 5.3 bn
! Good progress in reducing risk exposures
! Most other businesses performed well; some at record level
1Q07 2Q07 3Q07
1,990
Pre-tax income margin in %30.2 33.2 0.3 (31.0) n/m
4Q07 1Q08
2,502
6
(3,460)
(849)
n/m = not meaningful

Slide 13
Fixed income revenues outside most affected areasat same level as very strong 1Q07Fixed income trading and debt underwriting revenues
1) Total structured products and leveraged finance revenues excluding valuation adjustments of CHF 709 m reported in 'Other' revenues2) Excluding revenues from structured products and leveraged finance businesses and converted into Swiss francs applying the 1Q08 average exchange rate to adjust for foreign exchange rate impact
! Negative revenues in 1Q08 driven by valuation reductions in structured products and leveraged finance
! Very strong results inglobal rates and FX
! Strong results in emerging markets and proprietary trading
! 1Q08 further impacted by fair value reductions of CHF 0.5 bn on corporate loan book
(1,440)
4,325 1,2261,659 1,647
1Q08 revenues
Add back structured
products and leveraged finance
revenues 1)
Deduct 1Q08 fair
value gains on own debt
1Q08 adjusted revenues
1Q07 adjusted revenues
3,132
2)
CHF m

Slide 14
Equity trading with solid performance in light of market conditions Equity trading net revenuesCHF m
! Stable client-related businesses
! Good results in the global cash business driven by higher trading volumes, increased client flows and strong AES performance
! Prime Services achieved record revenues with strong growth in client balances and new client mandates
! Losses in equity proprietary trading compared to a strong 1Q07
1Q07 2Q07 3Q07
(36)%
(33)%
2,171
4Q07 1Q08
2,475
1,037
2,068
1,379
AES = Advanced Execution Services, our electronic trading platform

Slide 15
Disciplined cost management in Investment Banking
! Despite headcount growth, G&A expense trend reflects focus on cost reduction
! Flexibility of cost base positions us well in current markets and going forward
! Lower compensation expense reflecting negative results
! Decrease in front office headcount, driven primarily by reductions in certain fixed income businesses reflecting market conditions
Compensation expenses
General & administrative expenses
1Q07 2Q07 3Q07 4Q07 1Q08
827 803 864 941748
1Q07 2Q07 3Q07 4Q07 1Q08
3,3903,882
839
2,080 1,718
CHF m
CHF m

Slide 16
Asset Management results further impacted by losses from money market funds and lower private equity gainsPre-tax incomeCHF m
1) Before valuation reduction from securities purchased from our money market funds
! Stable asset management and administrative fees vs. 1Q07
! Lower revenues vs. 4Q07 due to lower private equity gains and decline in performance-related fees and assets under management
! Additional CHF 566 m losses on securities purchased from money market funds
1Q07 2Q07 3Q07
257
Pre-tax income margin in % 1)
33.1 35.1 25.8 46.7 15.6
4Q07 1Q08
299
45
(247)(468)
527
98 1)
1)
1911)
Slide 17
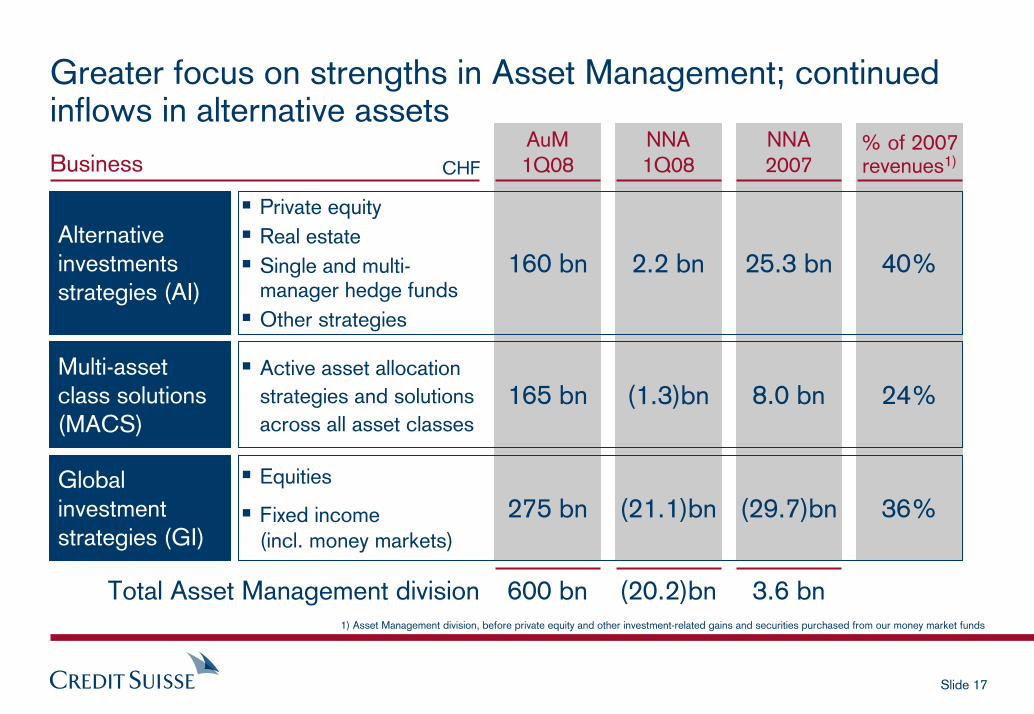
Greater focus on strengths in Asset Management; continued inflows in alternative assets
Alternativeinvestmentsstrategies (AI)
Multi-assetclass solutions(MACS)
Global investmentstrategies (GI)
! Equities
! Fixed income(incl. money markets)
! Active asset allocationstrategies and solutionsacross all asset classes
! Private equity! Real estate! Single and multi-
manager hedge funds! Other strategies
BusinessAuM1Q08
NNA1Q08 CHF
275 bn
165 bn
160 bn
(21.1)bn
(1.3)bn
2.2 bn
NNA2007
(29.7)bn
8.0 bn
25.3 bn
% of 2007 revenues1)
36%
24%
40%
1) Asset Management division, before private equity and other investment-related gains and securities purchased from our money market funds
600 bn (20.2)bn 3.6 bnTotal Asset Management division

Slide 18
Stable asset management fees but lower private equity gains and performance fees; gross margin of 40 basis pointsPrivate equity and other investment-related gainsCHF m
Asset management fees 1)
CHF m
1Q07 2Q07 3Q07 4Q07 1Q08
128189
59
305
(19)
! QoQ reduction in AI primarily due tosemi-annual performance fees recorded in 4Q07
! YoY reduction in GI and MACS in line with lower assets under management
! Reduced realizations and unrealized losses in China-related public company investments
1Q07 2Q07 3Q07 4Q07 1Q08
648 664 681823
648
212 247 266402
296
160 166 166 187155
276 251 249 234 197
AI
MACS
GI
37 36 37 47 40 Gross margin on AuM in bp 1) before private equity and other investment-related gains and securities
purchased from our money market funds
1)

Slide 19
Maintained strong capital position followingtransition to Basel II
4Q07
312
4Q07 1Q08
324301
(7)%
! Weakening of US dollar reduces both risk-weighted assets and capital position
! Issued CHF 1.5 bn of hybrid tier 1 capital
! Reduced share repurchase activity
! Strong capital base as competitive advantage
! Continue to prudently manage our balance sheet, exposures and capital
Basel IIBasel I
Risk-weighted assets and tier 1 ratioCHF bn and %
11.1%10.0% 9.8%

Slide 20
First quarter 2008 resultsRenato Fassbind, Chief Financial Officer
Risk management updateWilson Ervin, Chief Risk Officer
IntroductionBrady W. Dougan, Chief Executive Officer
SummaryBrady W. Dougan, Chief Executive Officer
Slide 21
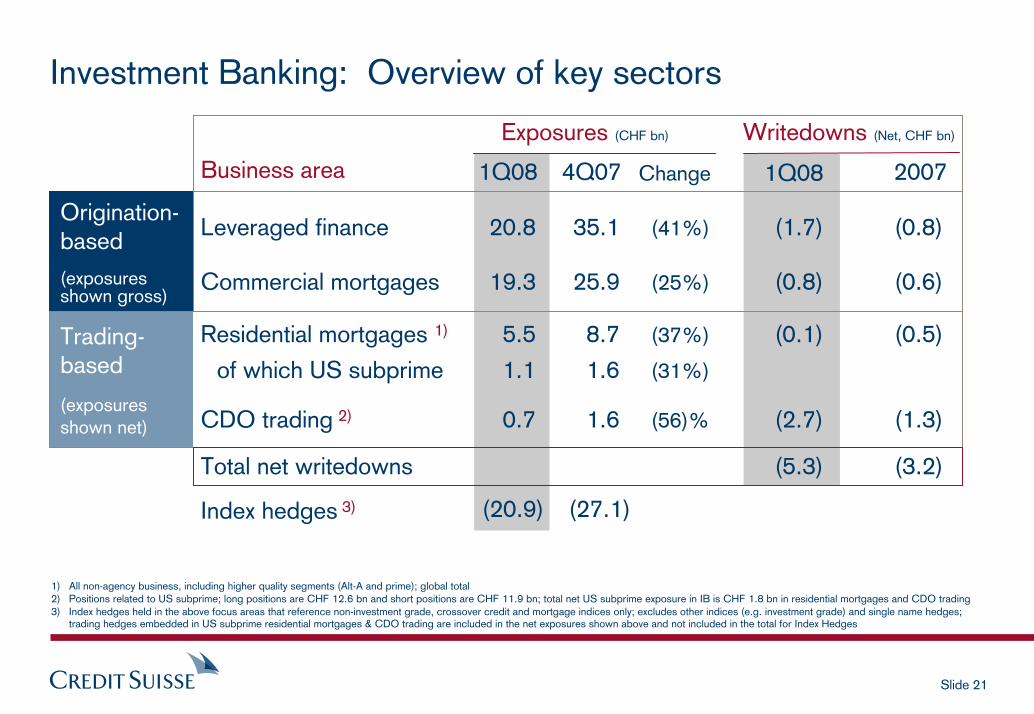
Leveraged finance 20.8 35.1 (41%) (1.7) (0.8)
Commercial mortgages 19.3 25.9 (25%) (0.8) (0.6)
Residential mortgages 1) 5.5 8.7 (37%) (0.1) (0.5)
of which US subprime 1.1 1.6 (31%)
CDO trading 2) 0.7 1.6 (56)% (2.7) (1.3)
Total net writedowns (5.3) (3.2)
Index hedges 3)
Investment Banking: Overview of key sectors
Business area Change
Exposures (CHF bn)
1) All non-agency business, including higher quality segments (Alt-A and prime); global total2) Positions related to US subprime; long positions are CHF 12.6 bn and short positions are CHF 11.9 bn; total net US subprime exposure in IB is CHF 1.8 bn in residential mortgages and CDO trading3) Index hedges held in the above focus areas that reference non-investment grade, crossover credit and mortgage indices only; excludes other indices (e.g. investment grade) and single name hedges;
trading hedges embedded in US subprime residential mortgages & CDO trading are included in the net exposures shown above and not included in the total for Index Hedges
1Q08 1Q08
Origination-based(exposures shown gross)
Trading-based
(exposures shown net)
20074Q07
Writedowns (Net, CHF bn)
(20.9) (27.1)

Slide 22
Leveraged finance exposures
Unfunded commitments 13.0 24.8
Funded positions 7.5 10.0
Equity bridges 0.3 0.3
Total gross exposure 2) 20.8 35.1
! Total exposure down 41% to CHF 20.8 bn, driven primarily by sales activity
! All positions fair valued based on market levels (no �accrual� book)
! Exposures at a weighted-average valueof 85% to par (vs. 94% at 4Q07)
! Portfolio distribution remains US focused with low exposure to cyclical industries
! Significant amount of hedges in place
Gross exposure 1) (CHF bn)
Net writedowns (1.7) (0.8)
Roll-forward (CHF bn)
1) Non-investment grade exposures, at fair value2) Figures exclude term financing to support certain sales transactions, which amounts
to CHF 2.2 bn in 1Q08 and CHF 1.3 bn in 4Q07
Exposures 4Q07 24.8 10.0New 1.9 �Fundings (6.8) 6.8Sales, terminations, writedowns & FX (6.9) (9.3)
Exposures 1Q08 13.0 7.5
1Q08 4Q07
Unfunded Funded
1Q08 2007(CHF bn)

Slide 23
Leveraged finance portfolio analysis
! Portfolio is largely with large-cap companies with stable cash flows, substantial assets and multi-billion dollar enterprise values
! US bias reflects market leadership with financial sponsors / LBO deals
! The largest 5 commitments represent 65% of the portfolio; remainder spread among 35 deals with an average size of CHF 205 m
! Underwriting procedures require both market approval and independent credit sign-off
!High proportion (73%) of exposure is senior secured lending
! Little exposure to highly cyclical industries; no exposure to home building, retail or auto sector
Total exposure by geography
Asia3%
Europe17%
US80%
Exposure by industry sector
Specialty chemicals 32%Electronics 9%
Entertainment & leisure 18%
Other 14%
Publishing& printing 8%
Services & leasing 11% Telecom 8%

Slide 24
Commercial mortgage (CMBS) exposures
! Gross exposure reduced by 25% toCHF 19.3 bn during 1Q08
! All positions carried at fair value, taking into consideration prices for cash trading and relevant indices (e.g. CMBX), as well as specific asset fundamentals
! Gross writedowns of CHF 1.3 bn in 1Q08
! Portfolio breakdown remains similar to 4Q07 with good LTV protection, sector selection, and geographic diversification
! Significant amount of mortgage-related credit hedges in place
Warehouse exposure 1) 19.3 25.9
(CHF bn) 1Q08 4Q07
Roll-forward of exposure (CHF bn)
Exposure 4Q07 25.9
New loan originations 0.8
Sales, terminations,writedowns and FX (7.4)
Exposure 1Q08 19.3
Net writedowns (0.8) (0.6)
1Q08 2007
1) Includes both loans in the warehouse as well as securities still in syndication
(CHF bn)

Slide 25
Commercial mortgage (CMBS) portfolio analysis
Total exposure by geography
Asia15%
Continental Europe52%
US31%
Exposure by loan type
Office44%
Retail 16%
Multifamily 12%
Other 7%
Healthcare 6%
Hotel 13%
Industrial 2%
Weighted average loan-to-value (LTV) ratio
EuropeUS Asia Total
7260
71 68
%
!Majority of our portfolio is secured by high quality, income-producing real estate
!Development loans are less than 5% of our portfolio and have an average LTV of 46%
! Portfolio is well-diversified with solid LTV ratios
! Reduced exposure to US positions due to sales in that region
UK2%
Slide 26
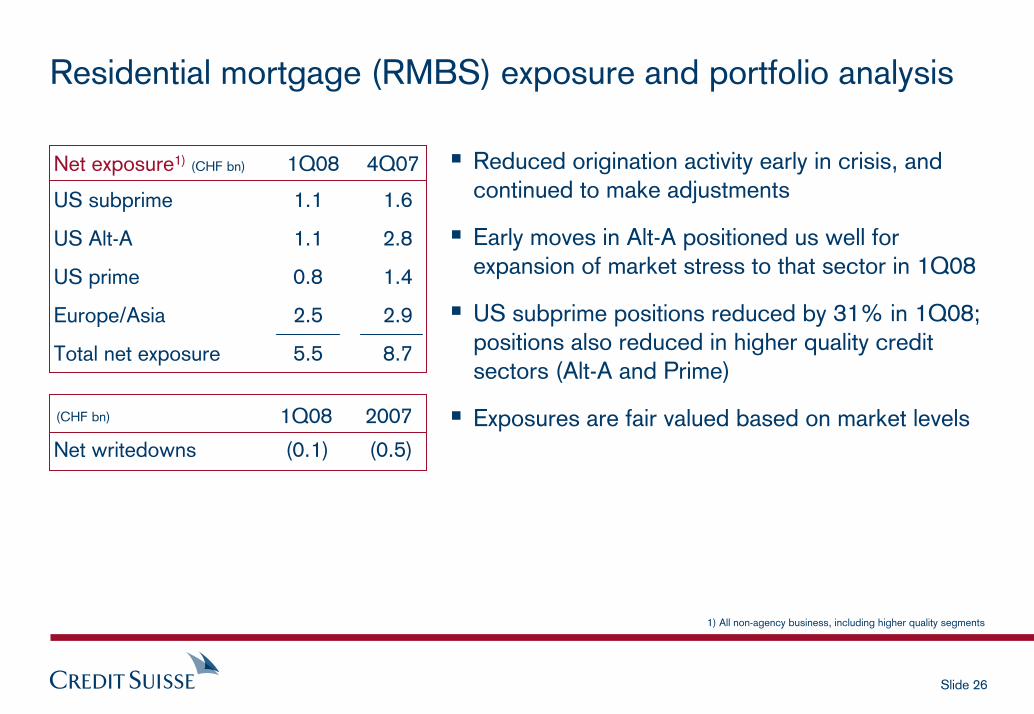
Residential mortgage (RMBS) exposure and portfolio analysis
! Reduced origination activity early in crisis, and continued to make adjustments
! Early moves in Alt-A positioned us well for expansion of market stress to that sector in 1Q08
! US subprime positions reduced by 31% in 1Q08; positions also reduced in higher quality credit sectors (Alt-A and Prime)
! Exposures are fair valued based on market levelsNet writedowns (0.1) (0.5)
1Q08 2007
US subprime 1.1 1.6
US Alt-A 1.1 2.8
US prime 0.8 1.4
Europe/Asia 2.5 2.9
Total net exposure 5.5 8.7
Net exposure (CHF bn) 1Q08 4Q07
1) All non-agency business, including higher quality segments
1)
(CHF bn)

Slide 27
CDO trading exposures and portfolio analysis
1) Positions related to US subprime; portion of exposure increase in early 1Q08(Dec to Feb) was due to updated sensitivity estimates for certain CDO positions
2) Cash CDO trading includes hedge positions
4Q07 13.6 (12.0) 1.6
1Q08 12.6 (11.9) 0.7
! Significant writedowns during the quarter
! P&L remained negative in March, as trading conditions deteriorated further
! Largest driver was continued stress on �basis risks� as the hedging relationships between long and short positions widened significantly due to market stress(e.g. funded long positions vs. CDS hedges)
! Some initial progress made in cutting exposures in March
2)
Net writedowns (2.7) (1.3)
Exposure (CHF bn)1) Long Short Net
ABS & Indices 0.8 3.2
Synthetic ABS CDOs (0.2) (1.2)
Cash CDOs 0.1 (0.4)
Total net exposure 0.7 1.6
1Q08 4Q07Net exposures by type (CHF bn)
1Q08 2007(CHF bn)

Slide 28
Asset Management: money market �liftout� portfolio
Structured Inv. Vehicles (SIVs) 1.5 2.5
Asset Backed Securities (ABS) 0.5 1.0
Corporates 0.2 0.4
Total 2.2 3.9of which subprime-related 0.2 0.4
Gross exposure (CHF bn) 1Q08
Securities transferred to bank balance sheet
Exposure 4Q07 3.9New 0.2Sales, maturities,writedowns and FX (1.9)
Exposure 1Q08 2.2
Roll-forward of exposure (CHF bn)
4Q07
Net writedowns (0.6) (0.9)
1Q08 2007
! Money market funds operating normally
− No material exposure to SIVs, CDOs or US subprime remain in the funds
! Portfolio experienced further losses as market stress worsened in 1Q08
! Positions marked down further to reflect current market conditions
! Positions now carried at a weighted average value of approx. 65% to par
! Portfolio reduced by 43% in 1Q08 largely due to sales and maturities, and we continue to focus on reducing positions while maximizing value(CHF bn)

Slide 29
78
11095
176 194
0
100
200
Q1 07 Q2 07 Q3 07 Q4 07 Q1 08
12.311.6
13.212.0
11.1
0
10,000
Q1 07 Q2 07 Q3 07 Q4 07 Q1 08
Overall Risk Trends
! ERC: A broad measure of CS exposure, covering credit, market & investment risks
! Trend chart at right shows reductions in overall CS risk in recent quarters.
! ERC is down 17% vs. pre-crisis peak in 3Q07 (esp. in Leveraged Finance, CMBS)
! VaR: Nominal figures remain high due to volatile data from recent market conditions
! Size of trading positions remains consistent with previous sizing when data effect is adjusted (see chart)
! P&L volatility in 1Q08 continued to be high, and produced a number of back-testing exceptions in the period
! Not used for crisis management
ERC Trend Broader risk measures
VaR Trend (IB trading only) Daily average; CHF m
Quarter end; CHF bn
Positioning
Dataset / Methodology effect
Slide 30
Summary
! Market conditions deteriorated in 1Q08, including significant dislocations in hedging relationships
! Significant valuation reductions in 1Q08 across key exposure areas;Credit Suisse maintained full mark to market disciplines
! Credit performance remains strong
! Significant hedge portfolio
! Good reduction in key exposure areas continued in 1Q08
! Risk levels being rebalanced to level appropriate for current market conditions
Slide 31
First quarter 2008 resultsRenato Fassbind, Chief Financial Officer
Risk management updateWilson Ervin, Chief Risk Officer
IntroductionBrady W. Dougan, Chief Executive Officer
SummaryBrady W. Dougan, Chief Executive Officer

Slide 32