Fibre genetics on Alpaca -...
45
64 th EAAP Annual meeting, 25-30 August, 2013, Nantes, France Symposium on South American Camelids and other Fibre Animals 1 Session 43 Theatre 1 Fibre genetics on Alpaca Juan Pablo Gutiérrez Departamento de Producción Animal, Universidad Complutense de Madrid. Avda. Puerta de Hierro s/n. E-28040-Madrid, Spain [email protected] Asbtract Pacomarca S.A. runs a genetic improvement program for alpaca fibre. Mating is carried out individually and breeding values are used for selection and embryo transfer. It wills extend its advances to the small rural communities. The aim of these studies was analysing the genetics of the fibre. Traits such as fibre diameter (FD), coefficient of variation of FD (CV), greasy fleece weight (GFW), staple length (SL), shearing interval (SI) and textile value index (TV) were analysed to estimate genetic parameters. Results allowed concluding that expected selection response for TV was higher when FD was considered as selection goal instead of TV itself. FD at different ages was after considered as different traits and analysed by a multitrait animal model. Shearing at two years of age was shown to be the best showing the genetic value of the animal. Genetic parameters were after estimated for the traits in the selection criteria, (FD; CV, comfort factor (CF); and standard deviation (SD) of FD) jointly with type traits (fleece density, crimp, lock structure, head, coverage, and balance). Heritabilities for fibre traits were moderate to high and fibre and type traits were, in general, genetically poorly correlated. Afterwards, the optimal weighting of those traits was analysed under a selection index to conclude that the weight applied to CF should be surprisingly negative, and that morphological traits might be penalized if all the weight of the objective was on the fibre traits. Trying to model the relationship between FD and its variability, FD was studied under two innovative procedures. The results suggested that a genetic selection program is plausible to modify the evolution of the fibre diameter along time together with a favourable correlated decrease in the fibre diameter. A final study focused on the search of major genes in fibre traits. Significant segregating major genes were found associated with decreased FD, SD, CV values and increased CF values. The major gene variance was larger than the polygenic variance for all traits. Resumen La granja experimental Pacomarca SA está llevando a cabo uno de los más importantes programas de mejora genética de fibra de alpaca, llevando a cabo apareamientos controlados de forma individual, y utilizando valores genéticos para realizar selección artificial y escoger las donantes de transferencia de embriones. Este programa de mejora genética tiene a su vez como objetivo la trasferencia de los avances obtenidos a las pequeñas comunidades rurales alpaqueras. El objetivo de los trabajos presentados aquí fue analizar la genética de la fibra. En primer lugar se estimaron parámetros genéticos para caracteres tales como diámetro de la fibra (FD), coeficiente de variación de la FD (CV), peso del vellón sucio (GFW), longitud de fibra (SL), intervalo entre esquilas (SI) y el índice de valor textil (TV) que agrega los pesos de las distintas calidades del vellón obtenido ponderados por su valor monetario comercial. Los resultados permitieron concluir que la respuesta esperada a la selección para TV sería fue mayor cuando FD se utilizaba como criterio de selección en lugar del propio carácter TV. También se estudió el carácter FD considerándolo como caracteres diferentes a distintas edades y se concluyó que el rendimiento a los dos años de edad sería el más representativo del valor genético del animal. Por otro lado, se estimaron parámetros genéticos de caracteres
Transcript of Fibre genetics on Alpaca -...
64 th EAAP Annual meeting, 25-30 August, 2013, Nantes, France
Symposium on South American Camelids and other Fibre Animals
1
Session 43 Theatre 1
Fibre genetics on Alpaca
Juan Pablo Gutiérrez
Departamento de Producción Animal, Universidad Complutense de Madrid. Avda. Puerta de Hierro s/n. E-28040-Madrid, Spain [email protected] Asbtract Pacomarca S.A. runs a genetic improvement program for alpaca fibre. Mating is carried out individually and breeding values are used for selection and embryo transfer. It wills extend its advances to the small rural communities. The aim of these studies was analysing the genetics of the fibre. Traits such as fibre diameter (FD), coefficient of variation of FD (CV), greasy fleece weight (GFW), staple length (SL), shearing interval (SI) and textile value index (TV) were analysed to estimate genetic parameters. Results allowed concluding that expected selection response for TV was higher when FD was considered as selection goal instead of TV itself. FD at different ages was after considered as different traits and analysed by a multitrait animal model. Shearing at two years of age was shown to be the best showing the genetic value of the animal. Genetic parameters were after estimated for the traits in the selection criteria, (FD; CV, comfort factor (CF); and standard deviation (SD) of FD) jointly with type traits (fleece density, crimp, lock structure, head, coverage, and balance). Heritabilities for fibre traits were moderate to high and fibre and type traits were, in general, genetically poorly correlated. Afterwards, the optimal weighting of those traits was analysed under a selection index to conclude that the weight applied to CF should be surprisingly negative, and that morphological traits might be penalized if all the weight of the objective was on the fibre traits. Trying to model the relationship between FD and its variability, FD was studied under two innovative procedures. The results suggested that a genetic selection program is plausible to modify the evolution of the fibre diameter along time together with a favourable correlated decrease in the fibre diameter. A final study focused on the search of major genes in fibre traits. Significant segregating major genes were found associated with decreased FD, SD, CV values and increased CF values. The major gene variance was larger than the polygenic variance for all traits. Resumen La granja experimental Pacomarca SA está llevando a cabo uno de los más importantes programas de mejora genética de fibra de alpaca, llevando a cabo apareamientos controlados de forma individual, y utilizando valores genéticos para realizar selección artificial y escoger las donantes de transferencia de embriones. Este programa de mejora genética tiene a su vez como objetivo la trasferencia de los avances obtenidos a las pequeñas comunidades rurales alpaqueras. El objetivo de los trabajos presentados aquí fue analizar la genética de la fibra. En primer lugar se estimaron parámetros genéticos para caracteres tales como diámetro de la fibra (FD), coeficiente de variación de la FD (CV), peso del vellón sucio (GFW), longitud de fibra (SL), intervalo entre esquilas (SI) y el índice de valor textil (TV) que agrega los pesos de las distintas calidades del vellón obtenido ponderados por su valor monetario comercial. Los resultados permitieron concluir que la respuesta esperada a la selección para TV sería fue mayor cuando FD se utilizaba como criterio de selección en lugar del propio carácter TV. También se estudió el carácter FD considerándolo como caracteres diferentes a distintas edades y se concluyó que el rendimiento a los dos años de edad sería el más representativo del valor genético del animal. Por otro lado, se estimaron parámetros genéticos de caracteres
64 th EAAP Annual meeting, 25-30 August, 2013, Nantes, France
Symposium on South American Camelids and other Fibre Animals
2
Session 43 Theatre 1
relacionados con calidad de fibra (FD; CV, factor de la comodidad (CF) y desviación estándar (DE) de FD), conjuntamente con caracteres morfológicos subjetivos (densidad de lana, rizado u ondulado de la fibra según que fuera el ecotipo Huacayo o Suri, cabeza, cobertura, y aspecto general). Las heredabilidades fueron entre moderadas y altas para caracteres de fibra, y en general débilmente correlacionados genéticamente con caracteres morfológicos. En otro trabajo, se estudió la ponderación óptima de este conjunto de caracteres en un índice de selección concluyéndose que el peso aplicado a CF debería ser sorprendentemente negativo, y que los caracteres morfológicos podrían ser penalizados si todo el peso del objetivo de selección fuera aplicado sobre caracteres de fibra. Un trabajo adicional pretendía estudiar la relación entre FD y su variabilidad aplicando modelos innovadores. Los resultados sugieren que es factible un programa de selección genética que disminuya el diámetro de la fibra a lo largo de tiempo junto con una disminución correlativa favorable en el diámetro de la fibra. Un último estudio se centró en la búsqueda de los genes mayores para caracteres de fibra. Se apreció la existencia de genes mayores segregando en esta población concluyendo que estos genes son responsables de una mayor proporción de la varianza genética aditiva que la varianza poligénica restante. Keywords: alpaca; fibre traits; genetic parameters; segregation analysis; microsatellite markers Introduction The alpaca is the most important fibre producer of the South American camelidae species playing a major role in the maintenance of rural communities in the Andean area (Gutiérrez et al., 2009). Exploitation of alpacas is carried out with the basis of two different ecotypes, known as Huacaya and Suri that only differ in the type of fleece (Wuliji et al. 2000). Nowadays, the alpaca fibre is the most demanded product by the textile industry (Morante et al., 2009), and therefore, there is an increasing international interest in the study and production of fine alpaca fibre (Frank et al., 2006; Lupton et al., 2006; McGregor, 2006; Wuliji et al., 2000). There is also increasing information about the sources of variation in alpaca fibre yield and quality including diameter attributes (Wuliji et al. 2000; McGregor and Butler 2004; Lupton et al. 2006). The study performed by Allain and Renieri (2010), have finally indicated that there are many factors controlling the fibre quantity and quality in alpacas as well as in some studies that have been carried out for the identification of genes associated with the color of fleece (Cransberg and Munyard, 2011). One of the main goals in the alpaca breeding is the selection for the fibre diameter (thinner fibre), although other important traits are also being investigated. Information on genetic parameters affecting alpaca fibre production is scarce (Ponzoni et al. 1999; Wuliji et al. 2000; Frank et al. 2006; Gutiérrez et al., 2009; Cervantes et al., 2010). Particularly, even though estimates of genetic parameters are required to design effective genetic improvement programs, no genetic relationship between fibre diameter and other traits was available. Furthermore, the consideration of applying selection indexes has been absent in this specie. When performance recording is not established, a first step could be the implementation of a performance record based on subjective scoring of type traits assessing the animal’s accordance with an “ideal” alpaca as a producer of top quality fibre. On the other hand, type traits can be used as selection criteria themselves when the farmers search for the profit in the sale of animals. In any case, subjective scoring might also be conditioned by the
64 th EAAP Annual meeting, 25-30 August, 2013, Nantes, France
Symposium on South American Camelids and other Fibre Animals
3
Session 43 Theatre 1
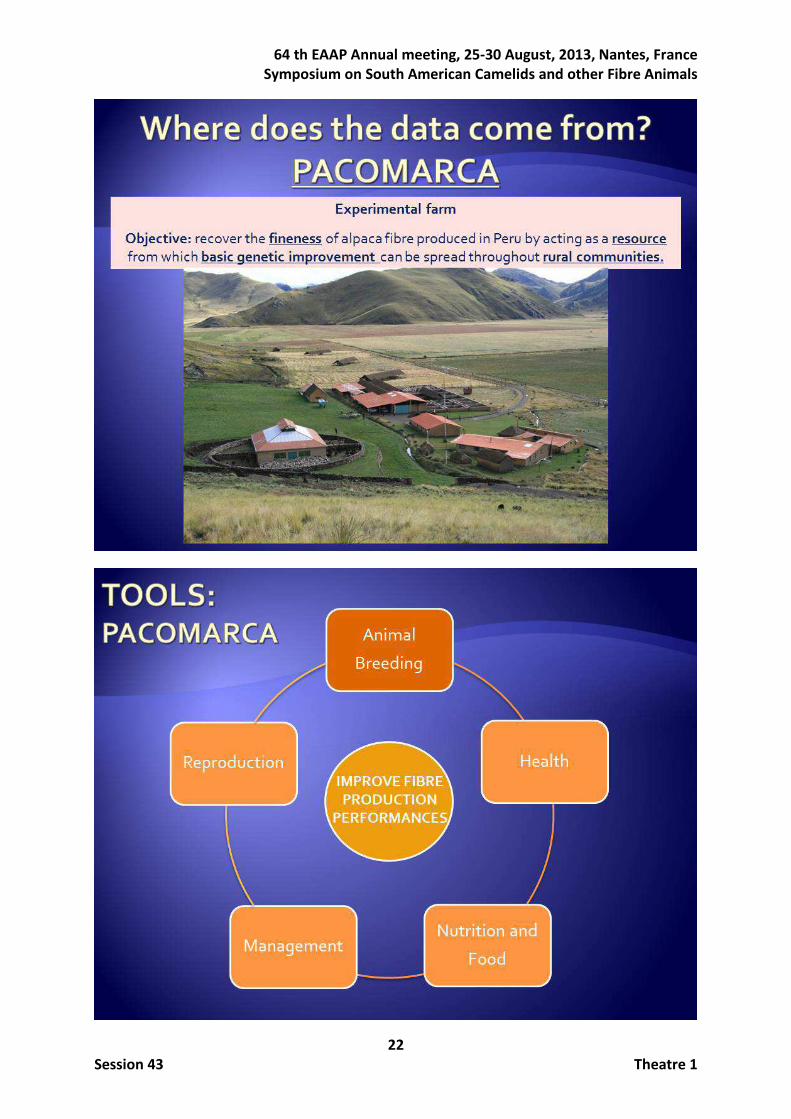
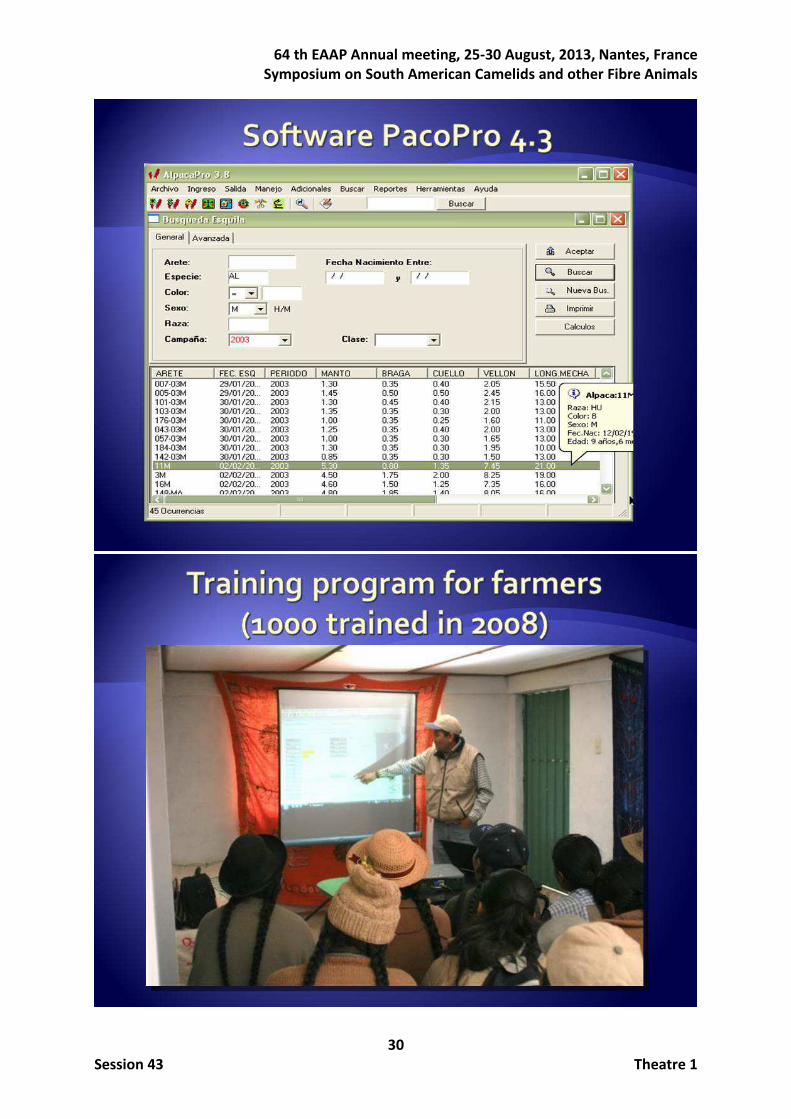
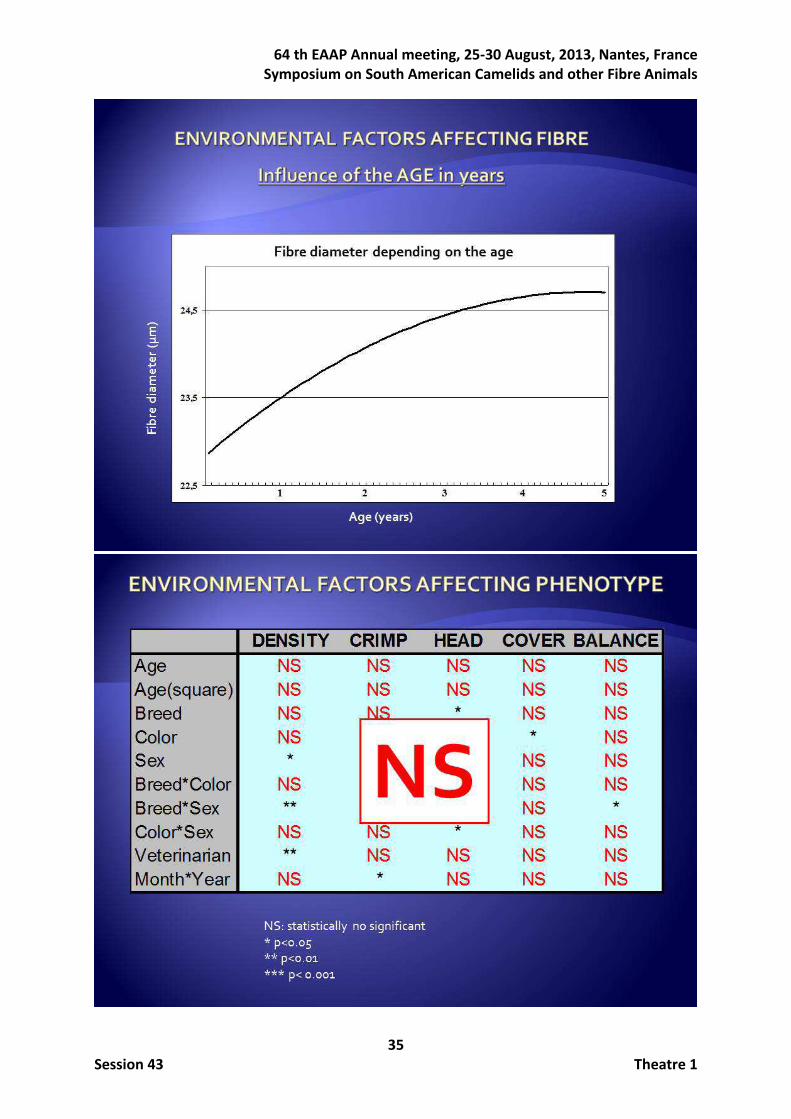
ecotype given that fibre appearance is quite different in Huacayo (HU) and Suri (SU) ecotypes (Renieri et al., 2009; Frank et al., 2006; Wuliji et al., 2000). In addition to the fibre diameter as selection objective, another important concern refers to the relationship between FD and its variability, being desirable reducing both. However, fibre diameter increases with the age, and it would be preferable to select those animals with thinnest fibre that also maintain it along their life. Then, there is a double variability interesting to be reduced: the one within the fleece and the variability between different shearing periods. The first one is easily measured by the standard deviation or the coefficient of variation of the fibre diameter. But the variability between different shearings had not still been faced. Moreover, although estimates of genetic parameters are required to design effective genetic improvement programs, no genetic relationship between fibre diameter and its variability had been ascertained in alpacas (Gutiérrez et al., 2009). A possible way to analyze the evolution of FD with the age of an animal is considering the different shearings of each animal as different traits. Heterogeneity has been also analyzed based on the hypothesis of the existence of a pool of genes controlling the mean of performance and another one which controls the homogeneity of performance when environment is modified (Schneiner and Lyman, 1991). SanCristobal-Gaudy et al. (1998) developed a model to deal with genetics of variability which has been widely used (Yang, 2010). The evolution of fibre diameter can also be studied as a longitudinal trait by the Bayesian procedure for the analysis of production functions described by Varona et al. (1997), allowing the modelization of each performance as a time function. Genetic improvement can also be faced by finding and monitoring genes of important effect. Studies such as Renieri et al. (2009) and Sponenberg (2010) reported that HU and SU inheritance can be described by a single dominant gene. The identification of major genes in alpaca is of great interest because monitoring of animals carrying alleles with important positive effect for economic traits would allow a quick genetic improvement given the almost general lacking of recording organizations. After determining the possible influence of major genes, a molecular approach should be indicated. The microsatellite markers are a useful tool in this sense (Aranguren and Jordana, 2001). Previous studies focused on sheep crossbreed and outbreed populations found evidence of QTL associated to wool traits. QTL related to the staple strength, staple length, fibre diameter and coefficient of variation of the fibre diameter were detected on sheep (Rogers et al., 1994; Allain et al., 2006; Bidinost et al., 2008; Itenge-Mweza et al., 2007; Parsons et al., 1994; Ponz et al., 2001). The most recognised genetic improvement program in Peru is that run by Pacomarca that has implemented a performance recording organisation, including the development of specific software and an experimental ranch applying state-of-the-art technology (Gutiérrez et al., 2009). In this paper the conducted research carried out in Pacomarca farm has been summarized. They can be grouped according to three different objectives:
- Genetic parameters were firstly estimated for traits candidate to be included in a global selection objective such as fibre diameter (FD), coefficient of variation of FD (CV), greasy fleece weight (GFW), staple length (SL), shearing interval (SI) and textile value index (TV) (Gutiérrez et al., 2009). In a second step genetic parameters were estimated for type traits and their genetic relationships with objective fibre traits (Cervantes et al., 2010). Recently the best weights of a selection index from genetic
64 th EAAP Annual meeting, 25-30 August, 2013, Nantes, France
Symposium on South American Camelids and other Fibre Animals
4
Session 43 Theatre 1
parameters combining all these traits were discussed (Gutiérrez et al., 2013, submitted).
- Several approaches were explored to deal with the relationship between FD and its variability. Firstly, defining the shearing at different ages as different traits were analysed (Pun et al., 2011). Then, the genetic parameters of the variability of different performances of the mean fibre diameter were estimated using two models, one based on the heterogeneity of the environmental variability, and the second describing the growth of the fibre (Gutiérrez et al., 2011).
- An approach focused in the use of major genes was also explored. Initially a segregation analysis was established to check the hypothesis of the existence of major genes (Pérez-Cabal et al., 2011). Based on conclusions from this study, currently, the association between some microsatellites and fibre traits is being addressed (Paredes et al., 2013, submitted)
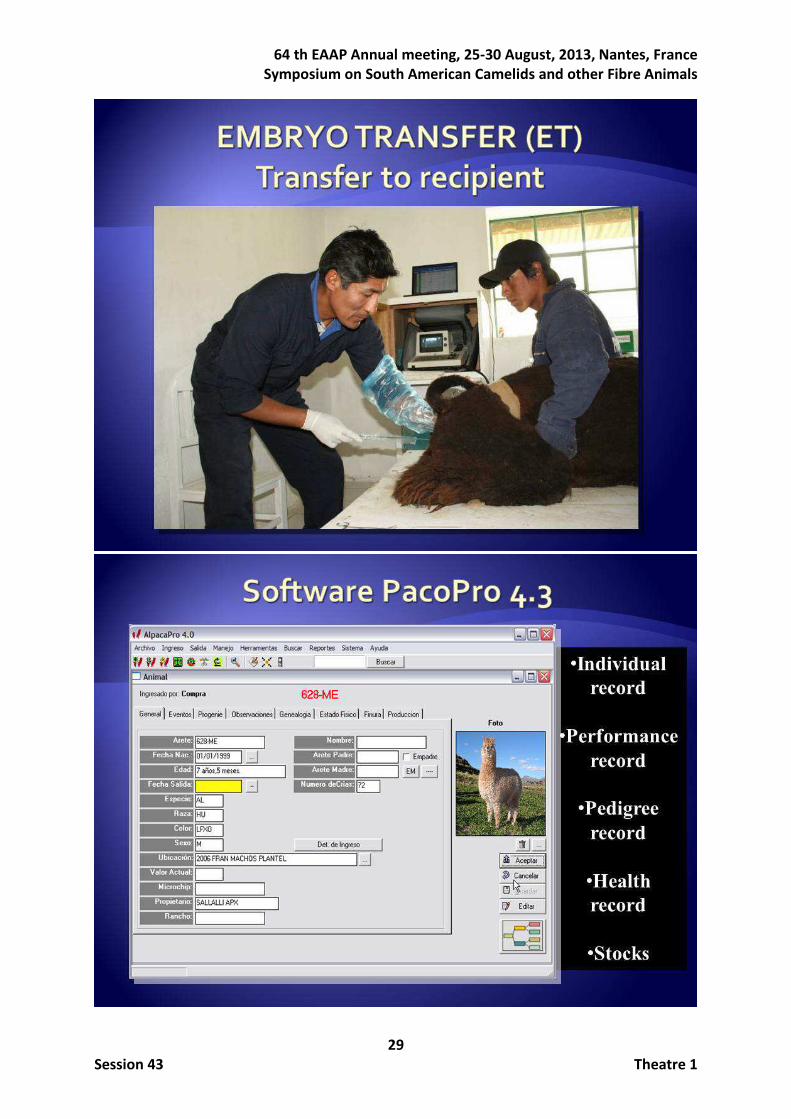
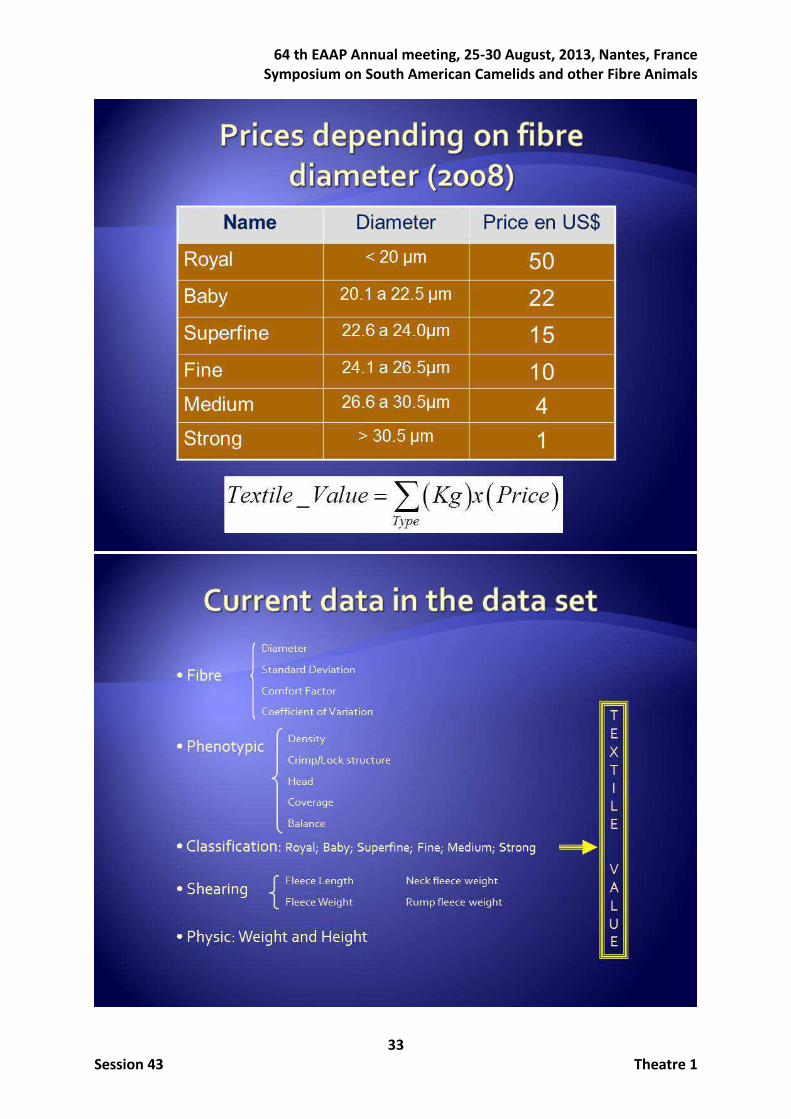
Materials Production data and pedigree information were obtained from the experimental PACOMARCA ranch as registered in the performance recording software PACO PRO (http://www.pacomarca.com/pacomarca/paco_pro_en.htm). In the first study the analysed traits were FD, CV, GFW, SL, SI and TV. FD was computed from washed samples after minicored and 2mm snippets using an Optical Fibre Diameter Analyser (IWTO-47-95). SL was assessed on a single staple per individual. The individual SI’s were computed as the time, in days, between two subsequent shearings. TV was calculated as a linear combination of the profit of the different qualities of fibre of an individual fleece. The weight in kg of the different classes of fibre (Royal, < 20.0 µm; Baby, 20.1 - 22.5 µm; SuperFine, 22.6 - 24.0 µm; Fine, 24.10 - 26.50 µm; Medium, 26.60 - 30.50 µm and Strong > 30.5 µm) was weighted by its monetary value and corrected by the performance obtained after processing the fleece. The economic weights given to each of the qualities of fibre were, in US Dollars: 50 (Royal), 22 (Baby), 15 (SuperFine), 10 (Fine), 4 (Medium) and 1 (Strong). A total of 2,531, 1,821 and 1,402 animals with records were used for respectively fibre related traits, fleece traits and TV, with a total of 6,449, 3,283 and 1,802 records respectively for the same groups of traits. Up to 77% of the individuals belonged to the HU ecotype whilst the others were SU. Animals were classified according to coat colour in three classes: white (65%), cream (20%) and other coat colour (15%). For the analysis combining fibre and type traits, SU and HU, which are managed together except that breeding is only allowed within ecotype, both ecotypes were independently analyzed. The analysed traits can be grouped in two subsets: a) those involving mean and variability of fibre diameter; and b) subjectively scored type traits. The first group of traits were FD, CV, comfort factor (CF) and standard deviation of FD (SD). The second group of traits included: Density (DE), scoring the amount of follicles per square millimetre, and is performed by pressing manually on shoulder, midpoint and rump and evaluating the amount of fleece the hand can grab at once; Crimp (CR), scoring, only in HU alpacas, the number of fibre waves per centimetre and their amplitude or height; Lock structure (LS), scoring, only in SU alpacas, the integration of individual fibre into groups or locks that should well defined, independent from each other, dense and heavy; Head (HE) is determined by the size and shape of the head in accordance with the “ideal” alpaca head including correct ears and snout;
64 th EAAP Annual meeting, 25-30 August, 2013, Nantes, France
Symposium on South American Camelids and other Fibre Animals
5
Session 43 Theatre 1
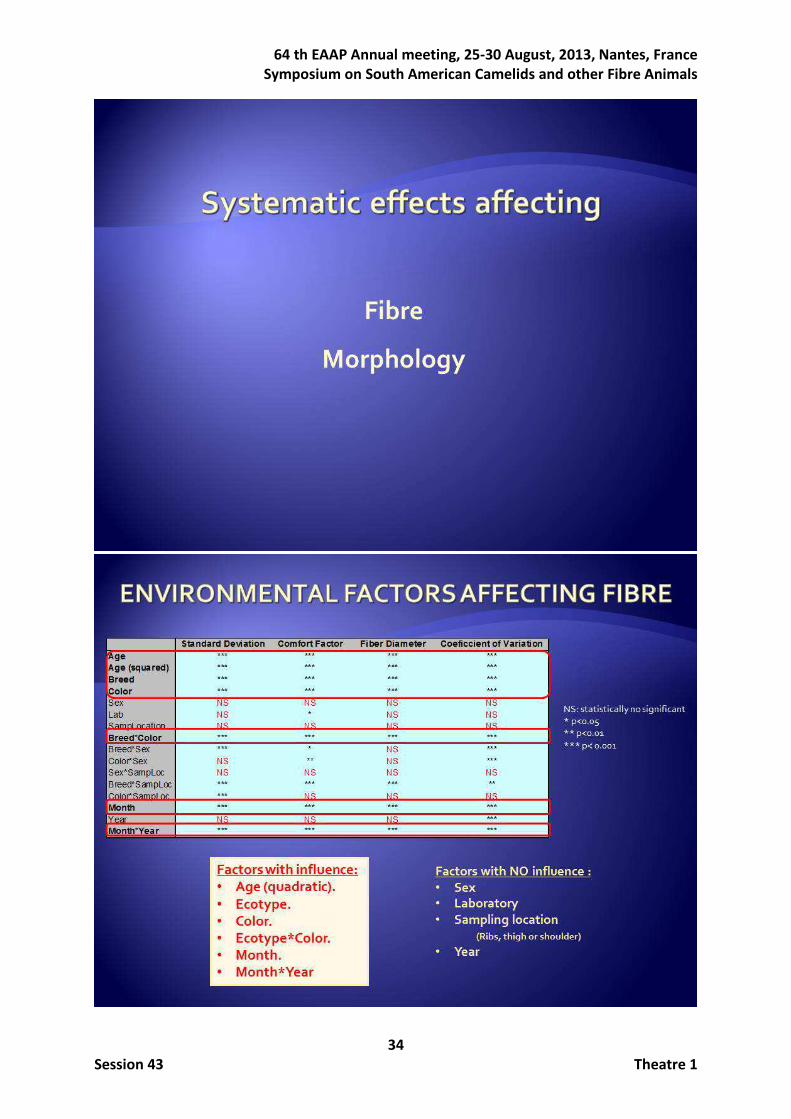
Coverage (CO), scoring the presence or absence of fibre in the alpaca extremities and head; and Balance (BA), scoring the animal’s general appearance with particular attention on how proportional is the animal in relation to body, neck, limps and head. Traits were scored numerically by the same classifier, as a distance from the ‘optimum’ for each trait, on a desirability scale from poor (1) to excellent (5): DE, from 1 (very low fleece density) to 5 (very dense fleece); CR, from 1 (very low frequency and no amplitude in crimp) to 5 (high frequency and medium amplitude); LS, from 1 (very independent, defined and uniformly distributed locks) to 5 (poorly independent and not uniformly distributed locks); HE, from 1 (long snout and ears resembling Llama-like head) to 5 (small rounded head with short snout and proportional ears); CO, from 1 (open face and very little fibre on the legs) to 5 (fibre covering toes and even producing wool blindness); and BA, from 1 (disproportional body, legs and/or neck) to 5 (correct proportion among all body parts). For the analyses concerning variability across life, only FD records from HU ecotype were accounted for, and for the segregation analyses only traits regarding fibre were used for both ecotypes from the same source of data. Pedigree was traced back until foundation. Other details on edition and number of records can be consulted in the reference papers. Prior to DNA analyses the segregation study was carried out. Traits analyzed were FD, SD, CV, and CF. After edition requirements 1,906 records were available for SU ecotype and 6,592 records for HU ecotype. Pedigree files included 1,119 and 3,468 animals for SU and HU ecotypes respectively. Concerning DNA analyses, the phenotypic data and genetic data used in this work belonged to these previous studies that showed the segregation of two major genes affecting fibre traits. The sampled animals for this study were selected following a selective genotyping strategy taking into account the animals exhibiting the highest and the lowest probability of being homozygotes for a hypothetical beneficial allele reducing the fibre diameter, according to the results obtained by Pérez-Cabal et al. (2010). A total of 140 animals were used (animals with high and low probability of being homozygous for a major gene affecting the fibre diameter), from the ecotypes Huacaya (N=74) and Suri (N=66) corresponding to 46 and 49 animals homozygous carrying the favorable and unfavorable allele respectively. A total of 69 microsatellite markers previously reported in South American camelids (Lang et al., 1996; Obreque et al., 1998, 1999; Penedo et al., 1998a,b; Penedo et al., 1999; Bustamante et al., 2003; McPartlan et al., 1998; Sarno et al., 2000) and Camelus dromedarious (Mariasegaram et al., 2002) were used in this study. Methodology Genetic parameters were estimated via a multitrait REML procedure applied to mixed linear models. The models fitted for genetic analyses included the following fixed effects: month-year of recording as contemporary group, ecotype-colour (combinations between the two HU and SU ecotypes, and the three coat classes, white, cream and others) or only colour when the ecotypes were independently analyzed, sex (male or female) and the age at shearing in days as a linear and quadratic covariant. When a level of the contemporary group included less than five records, they were included in the closest temporal level.
The linear animal model fitted was y = Xb + Zu + Wp + e for the fibre traits and y = Xb + Zu + e for the type traits (and also for FD when each shearing was considering as a different trait),
64 th EAAP Annual meeting, 25-30 August, 2013, Nantes, France
Symposium on South American Camelids and other Fibre Animals
6
Session 43 Theatre 1
with: ,N
≈
u 0 G 0 0
p 0 0 P 0
e 0 0 0 R
G = A ⊗ G0, P = Ip ⊗ P0, R = Ie ⊗ R0, y the vector of
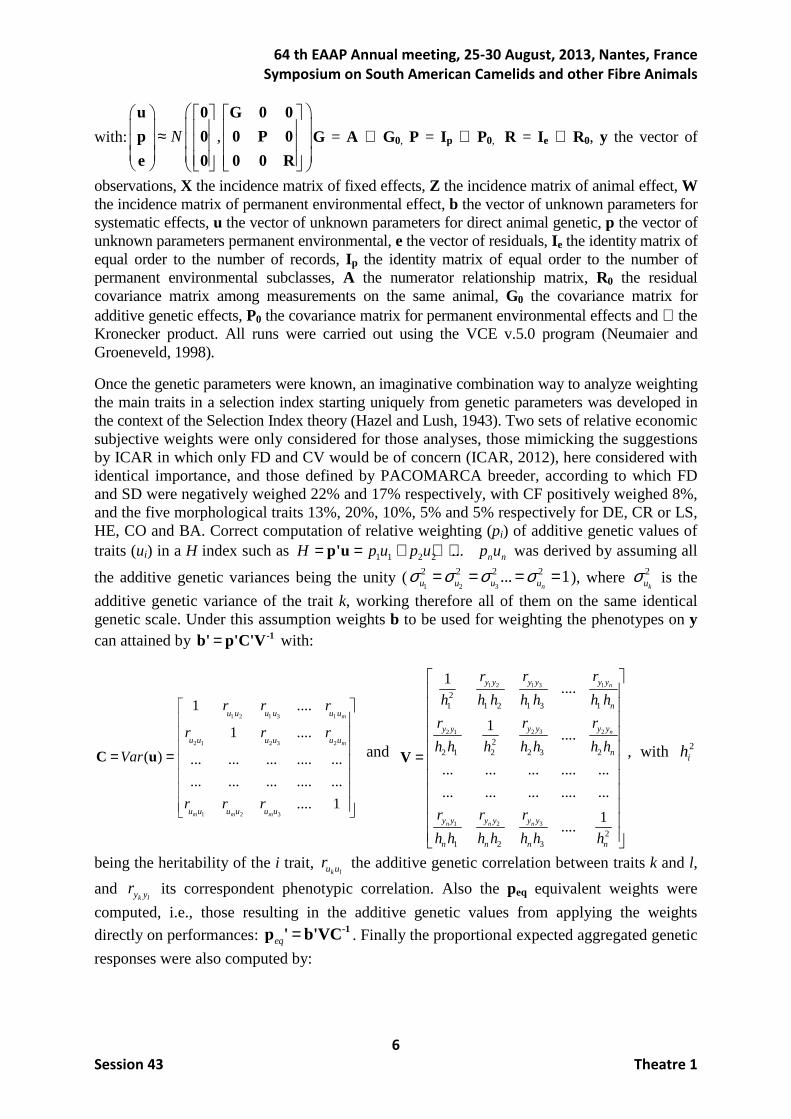
observations, X the incidence matrix of fixed effects, Z the incidence matrix of animal effect, W the incidence matrix of permanent environmental effect, b the vector of unknown parameters for systematic effects, u the vector of unknown parameters for direct animal genetic, p the vector of unknown parameters permanent environmental, e the vector of residuals, Ie the identity matrix of equal order to the number of records, Ip the identity matrix of equal order to the number of permanent environmental subclasses, A the numerator relationship matrix, R0 the residual covariance matrix among measurements on the same animal, G0 the covariance matrix for additive genetic effects, P0 the covariance matrix for permanent environmental effects and ⊗ the Kronecker product. All runs were carried out using the VCE v.5.0 program (Neumaier and Groeneveld, 1998).
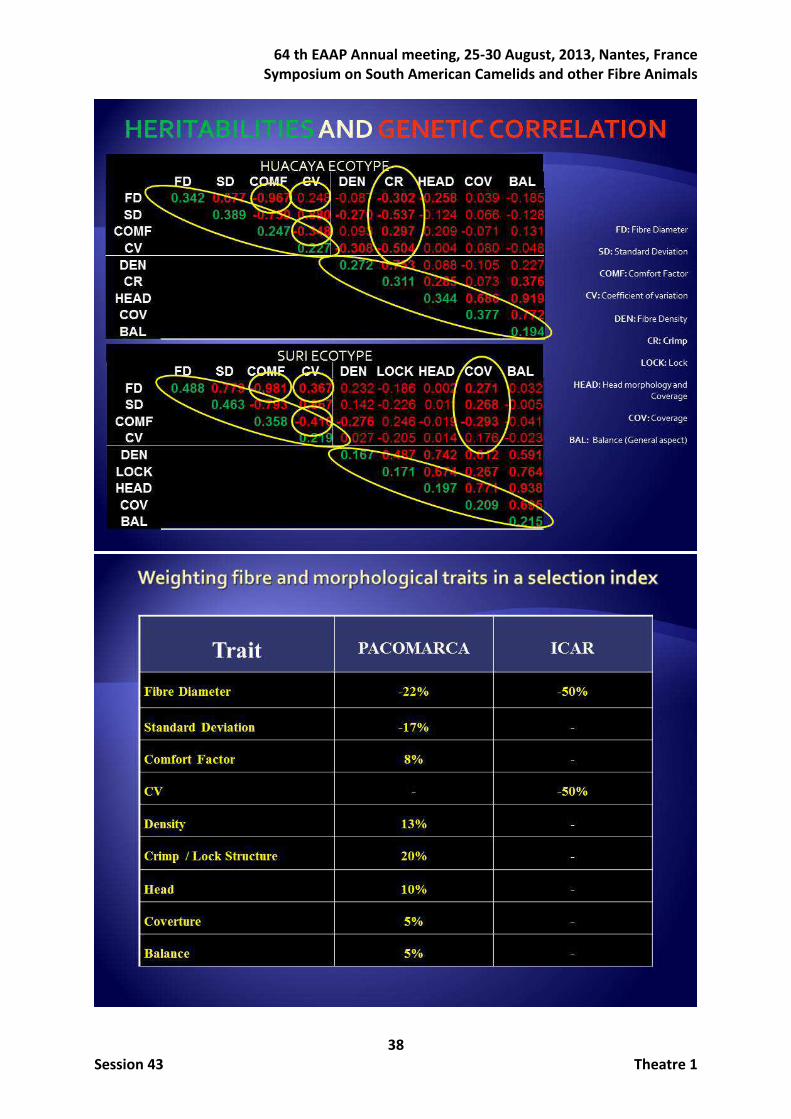
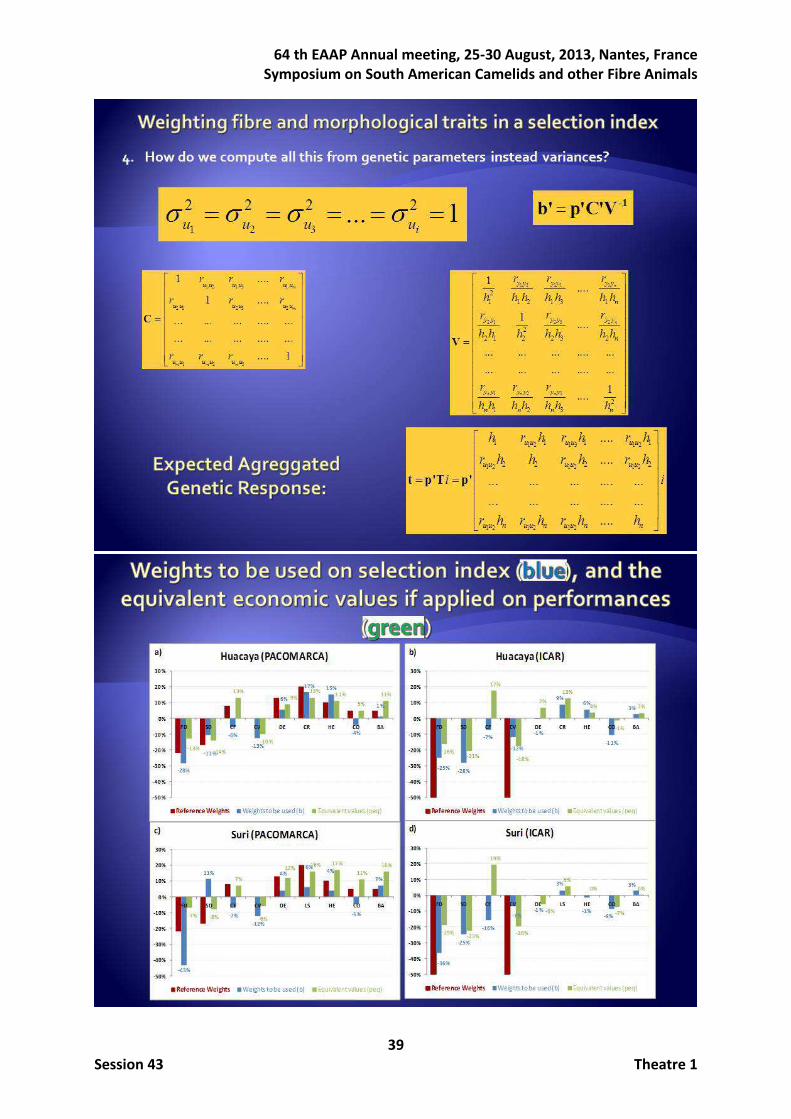
Once the genetic parameters were known, an imaginative combination way to analyze weighting the main traits in a selection index starting uniquely from genetic parameters was developed in the context of the Selection Index theory (Hazel and Lush, 1943). Two sets of relative economic subjective weights were only considered for those analyses, those mimicking the suggestions by ICAR in which only FD and CV would be of concern (ICAR, 2012), here considered with identical importance, and those defined by PACOMARCA breeder, according to which FD and SD were negatively weighed 22% and 17% respectively, with CF positively weighed 8%, and the five morphological traits 13%, 20%, 10%, 5% and 5% respectively for DE, CR or LS, HE, CO and BA. Correct computation of relative weighting (pi) of additive genetic values of traits (ui) in a H index such as 1 1 2 2 ...= = + + + n nH p u p u p up'u was derived by assuming all
the additive genetic variances being the unity (1 2 3
2 2 2 2... 1= = = =nu u u uσ σ σ σ ), where 2
kuσ is the
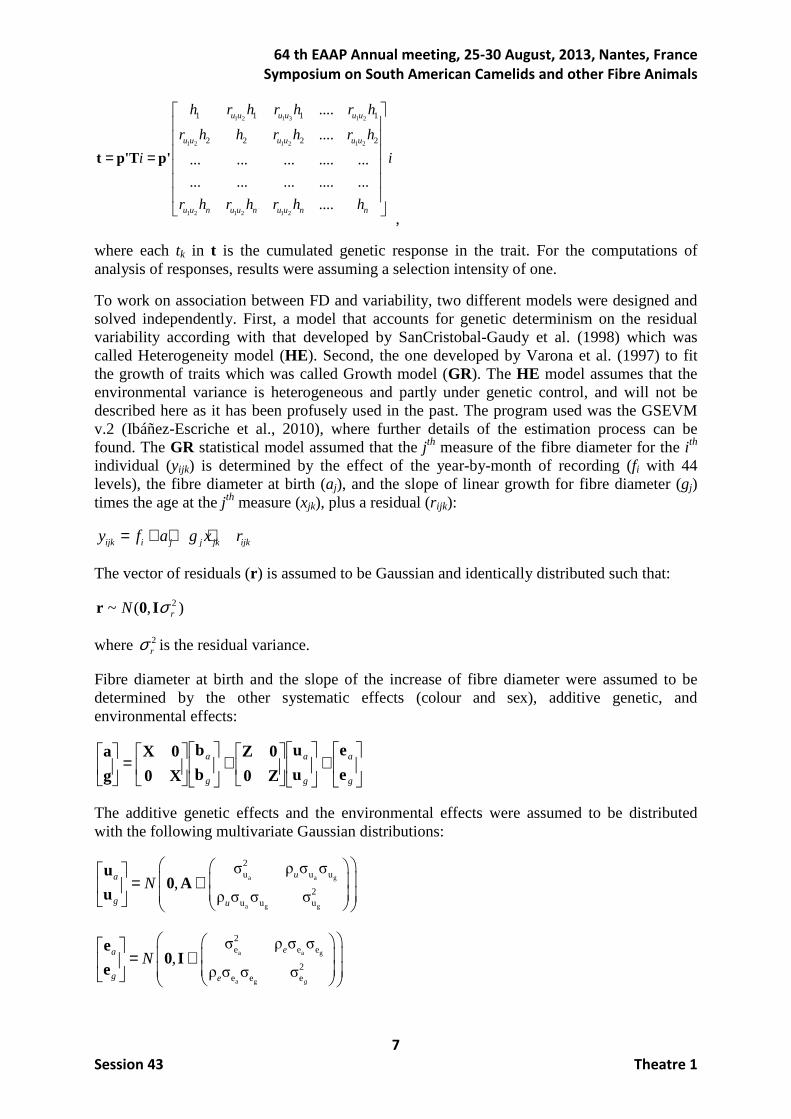
additive genetic variance of the trait k, working therefore all of them on the same identical genetic scale. Under this assumption weights b to be used for weighting the phenotypes on y can attained by = -1b' p'C'V with:
1 2 1 3 1
2 1 2 3 2
1 2 3
1 ....
1 ....
( ) ... ... ... .... ...
... ... ... .... ...
.... 1
m
m
m m m
u u u u u u
u u u u u u
u u u u u u
r r r
r r r
Var
r r r
= =
C u and
1 3 11 2
2 3 22 1
1 2 3
21 1 2 1 3 1
22 1 2 2 3 2
21 2 3
1....
1....
... ... ... .... ...
... ... ... .... ...
1....
n
n
n n n
y y y yy y
n
y y y yy y
n
y y y y y y
n n n n
r rr
h h h h h h h
r rr
h h h h h h h
r r r
h h h h h h h
=
V , with 2ih
being the heritability of the i trait, k lu ur the additive genetic correlation between traits k and l,
and k ly yr its correspondent phenotypic correlation. Also the peq equivalent weights were
computed, i.e., those resulting in the additive genetic values from applying the weights
directly on performances: eq = -1p ' b'VC . Finally the proportional expected aggregated genetic
responses were also computed by:
64 th EAAP Annual meeting, 25-30 August, 2013, Nantes, France
Symposium on South American Camelids and other Fibre Animals
7
Session 43 Theatre 1
1 2 1 3 1 2
1 2 1 2 1 2
1 2 1 2 1 2
1 1 1 1
2 2 2 2
....
....
... ... ... .... ...
... ... ... .... ...
....
= =
u u u u u u
u u u u u u
u u n u u n u u n n
h r h r h r h
r h h r h r h
i i
r h r h r h h
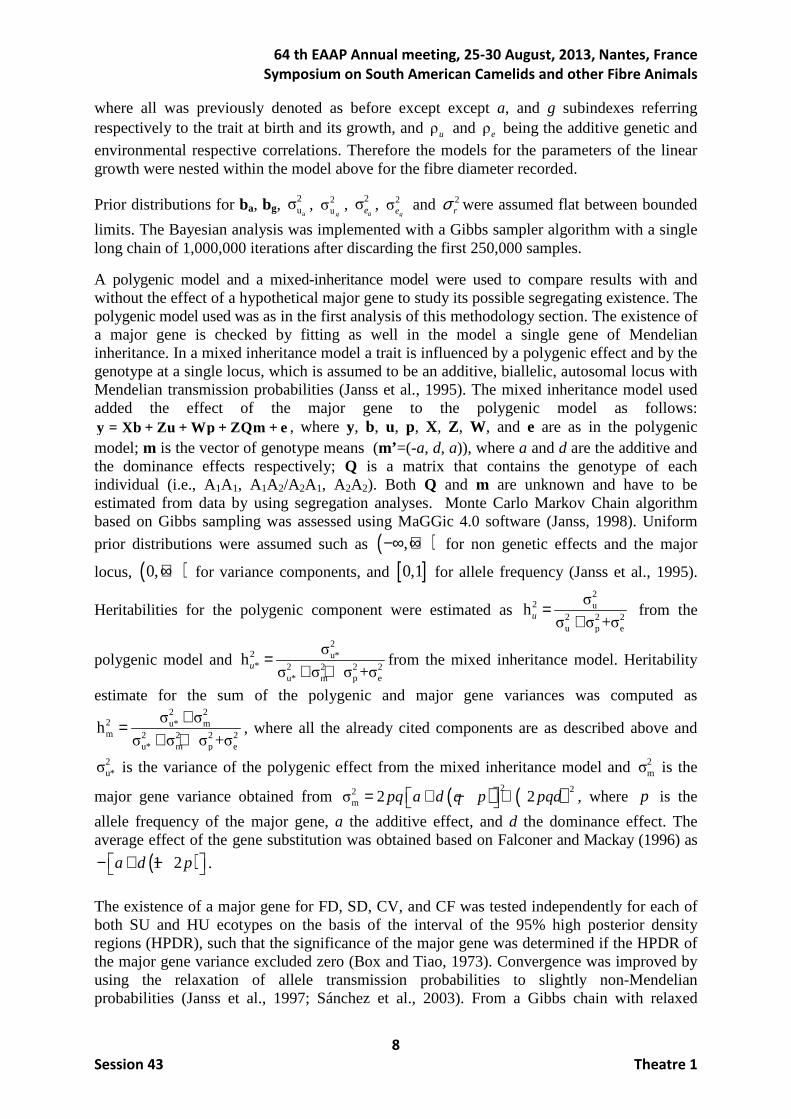
t p'T p'
,
where each tk in t is the cumulated genetic response in the trait. For the computations of analysis of responses, results were assuming a selection intensity of one.
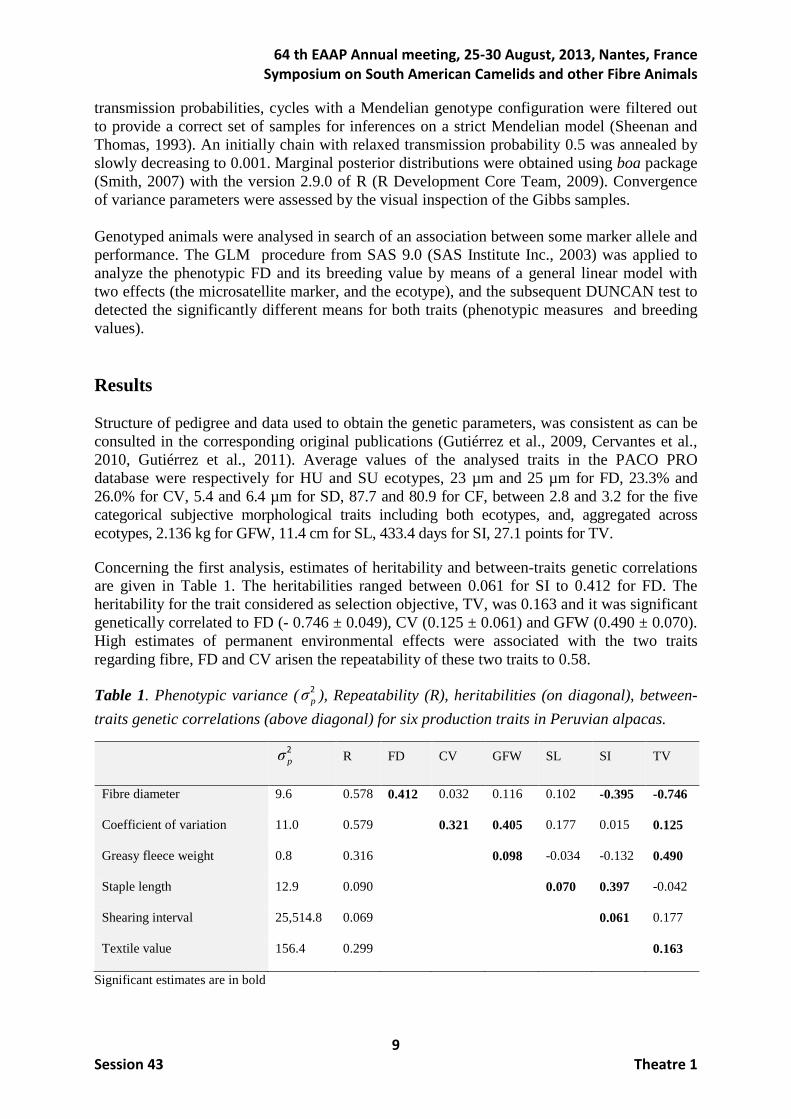
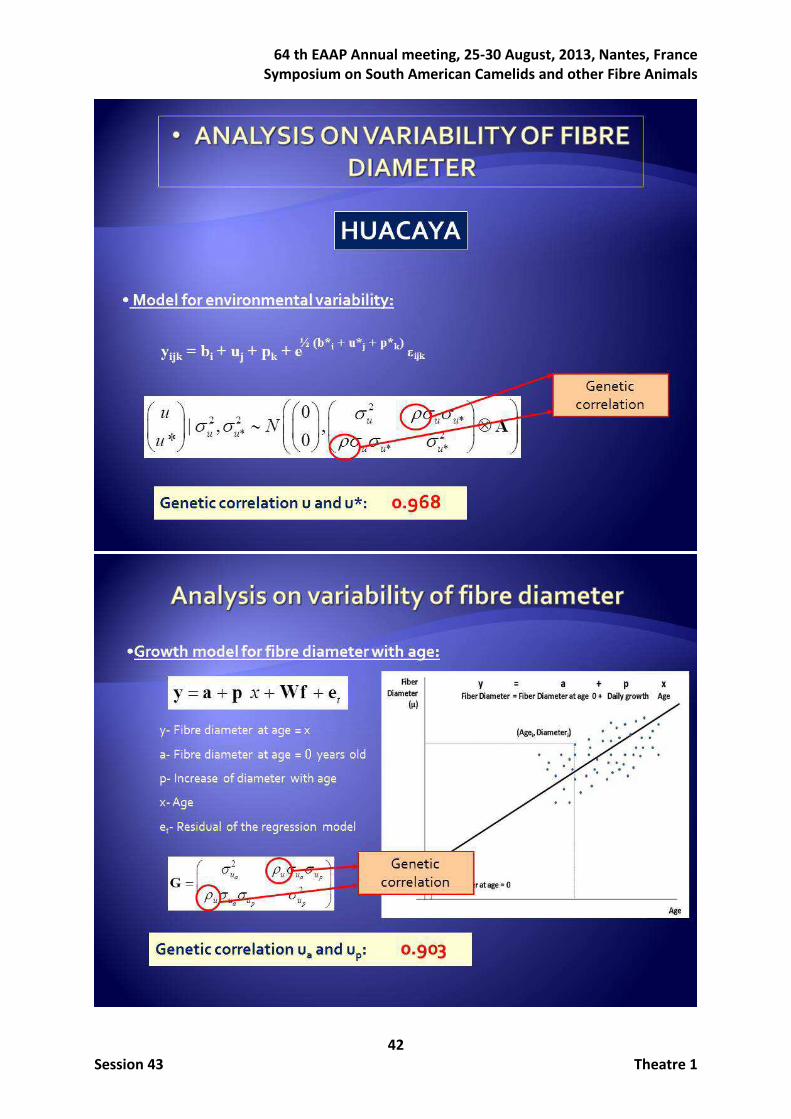
To work on association between FD and variability, two different models were designed and solved independently. First, a model that accounts for genetic determinism on the residual variability according with that developed by SanCristobal-Gaudy et al. (1998) which was called Heterogeneity model (HE). Second, the one developed by Varona et al. (1997) to fit the growth of traits which was called Growth model (GR). The HE model assumes that the environmental variance is heterogeneous and partly under genetic control, and will not be described here as it has been profusely used in the past. The program used was the GSEVM v.2 (Ibáñez-Escriche et al., 2010), where further details of the estimation process can be found. The GR statistical model assumed that the j th measure of the fibre diameter for the i th individual (yijk) is determined by the effect of the year-by-month of recording (fi with 44 levels), the fibre diameter at birth (aj), and the slope of linear growth for fibre diameter (gj) times the age at the j th measure (xjk), plus a residual (r ijk):
ijk i j j jk ijky f a g x r= + + +
The vector of residuals (r ) is assumed to be Gaussian and identically distributed such that:
),(~ 2rN σI0r
where 2rσ is the residual variance.
Fibre diameter at birth and the slope of the increase of fibre diameter were assumed to be determined by the other systematic effects (colour and sex), additive genetic, and environmental effects:
+
+
=
g
a
g
a
g
a
e
e
u
u
Z0
0Zb
b
X0
0X
g
a
The additive genetic effects and the environmental effects were assumed to be distributed with the following multivariate Gaussian distributions:
a a g
a g g
2u u u
2u u u
σ ρ σ σ,
ρ σ σ σ
ua
g u
N = ⊗
u0 A
u
a a g
a g
2e e e
2e e e
σ ρ σ σ,
ρ σ σ σg
ea
g e
N = ⊗
e0 I
e
64 th EAAP Annual meeting, 25-30 August, 2013, Nantes, France
Symposium on South American Camelids and other Fibre Animals
8
Session 43 Theatre 1
where all was previously denoted as before except except a, and g subindexes referring respectively to the trait at birth and its growth, and ρu and ρe being the additive genetic and
environmental respective correlations. Therefore the models for the parameters of the linear growth were nested within the model above for the fibre diameter recorded.
Prior distributions for ba, bg, a
2uσ , 2
uσ g, 2σ
ae, 2σ
ge and 2rσ were assumed flat between bounded
limits. The Bayesian analysis was implemented with a Gibbs sampler algorithm with a single long chain of 1,000,000 iterations after discarding the first 250,000 samples.
A polygenic model and a mixed-inheritance model were used to compare results with and without the effect of a hypothetical major gene to study its possible segregating existence. The polygenic model used was as in the first analysis of this methodology section. The existence of a major gene is checked by fitting as well in the model a single gene of Mendelian inheritance. In a mixed inheritance model a trait is influenced by a polygenic effect and by the genotype at a single locus, which is assumed to be an additive, biallelic, autosomal locus with Mendelian transmission probabilities (Janss et al., 1995). The mixed inheritance model used added the effect of the major gene to the polygenic model as follows: y = Xb + Zu + Wp + ZQm + e , where y, b, u, p, X, Z, W, and e are as in the polygenic model; m is the vector of genotype means (m’=(-a, d, a)), where a and d are the additive and the dominance effects respectively; Q is a matrix that contains the genotype of each individual (i.e., A1A1, A1A2/A2A1, A2A2). Both Q and m are unknown and have to be estimated from data by using segregation analyses. Monte Carlo Markov Chain algorithm based on Gibbs sampling was assessed using MaGGic 4.0 software (Janss, 1998). Uniform
prior distributions were assumed such as ( ),−∞ +∞ for non genetic effects and the major
locus, ( )0,+∞ for variance components, and [ ]0,1 for allele frequency (Janss et al., 1995).
Heritabilities for the polygenic component were estimated as 2
2 u2 2 2u p e
σh
σ σ +σu =+
from the
polygenic model and 2
2 u** 2 2 2 2
u* m p e
σh
σ σ σ +σu =+ +
from the mixed inheritance model. Heritability
estimate for the sum of the polygenic and major gene variances was computed as 2 2
2 u* mm 2 2 2 2
u* m p e
σ σh
σ σ σ +σ
+=+ +
, where all the already cited components are as described above and
2u*σ is the variance of the polygenic effect from the mixed inheritance model and 2mσ is the
major gene variance obtained from ( ) ( )2 22mσ 2 2pq a d q p pqd= + − + , where p is the
allele frequency of the major gene, a the additive effect, and d the dominance effect. The average effect of the gene substitution was obtained based on Falconer and Mackay (1996) as
( )1 2a d p− + − .
The existence of a major gene for FD, SD, CV, and CF was tested independently for each of both SU and HU ecotypes on the basis of the interval of the 95% high posterior density regions (HPDR), such that the significance of the major gene was determined if the HPDR of the major gene variance excluded zero (Box and Tiao, 1973). Convergence was improved by using the relaxation of allele transmission probabilities to slightly non-Mendelian probabilities (Janss et al., 1997; Sánchez et al., 2003). From a Gibbs chain with relaxed
64 th EAAP Annual meeting, 25-30 August, 2013, Nantes, France
Symposium on South American Camelids and other Fibre Animals
9
Session 43 Theatre 1
transmission probabilities, cycles with a Mendelian genotype configuration were filtered out to provide a correct set of samples for inferences on a strict Mendelian model (Sheenan and Thomas, 1993). An initially chain with relaxed transmission probability 0.5 was annealed by slowly decreasing to 0.001. Marginal posterior distributions were obtained using boa package (Smith, 2007) with the version 2.9.0 of R (R Development Core Team, 2009). Convergence of variance parameters were assessed by the visual inspection of the Gibbs samples. Genotyped animals were analysed in search of an association between some marker allele and performance. The GLM procedure from SAS 9.0 (SAS Institute Inc., 2003) was applied to analyze the phenotypic FD and its breeding value by means of a general linear model with two effects (the microsatellite marker, and the ecotype), and the subsequent DUNCAN test to detected the significantly different means for both traits (phenotypic measures and breeding values). Results Structure of pedigree and data used to obtain the genetic parameters, was consistent as can be consulted in the corresponding original publications (Gutiérrez et al., 2009, Cervantes et al., 2010, Gutiérrez et al., 2011). Average values of the analysed traits in the PACO PRO database were respectively for HU and SU ecotypes, 23 µm and 25 µm for FD, 23.3% and 26.0% for CV, 5.4 and 6.4 µm for SD, 87.7 and 80.9 for CF, between 2.8 and 3.2 for the five categorical subjective morphological traits including both ecotypes, and, aggregated across ecotypes, 2.136 kg for GFW, 11.4 cm for SL, 433.4 days for SI, 27.1 points for TV.
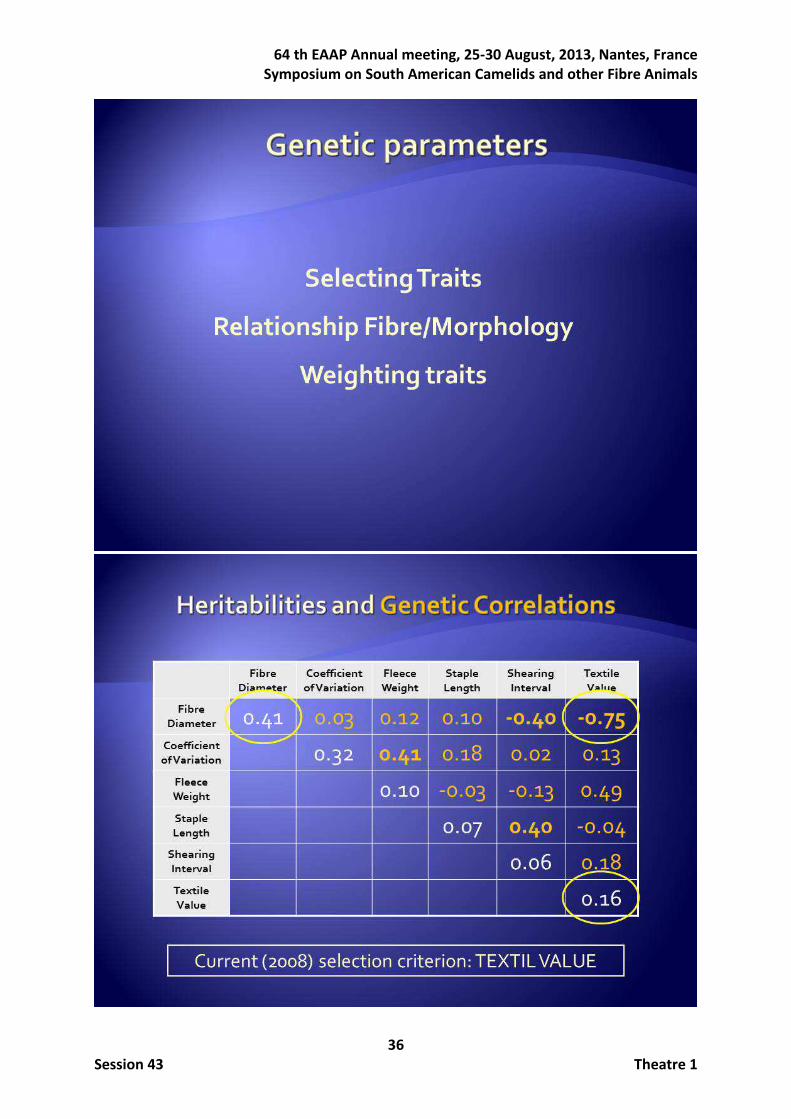
Concerning the first analysis, estimates of heritability and between-traits genetic correlations are given in Table 1. The heritabilities ranged between 0.061 for SI to 0.412 for FD. The heritability for the trait considered as selection objective, TV, was 0.163 and it was significant genetically correlated to FD (- 0.746 ± 0.049), CV (0.125 ± 0.061) and GFW (0.490 ± 0.070). High estimates of permanent environmental effects were associated with the two traits regarding fibre, FD and CV arisen the repeatability of these two traits to 0.58.
Table 1. Phenotypic variance (2pσ ), Repeatability (R), heritabilities (on diagonal), between-
traits genetic correlations (above diagonal) for six production traits in Peruvian alpacas.
2
pσ R FD CV GFW SL SI TV
Fibre diameter 9.6 0.578 0.412 0.032 0.116 0.102 -0.395 -0.746
Coefficient of variation 11.0 0.579 0.321 0.405 0.177 0.015 0.125
Greasy fleece weight 0.8 0.316 0.098 -0.034 -0.132 0.490
Staple length 12.9 0.090 0.070 0.397 -0.042
Shearing interval 25,514.8 0.069 0.061 0.177
Textile value 156.4 0.299 0.163
Significant estimates are in bold
64 th EAAP Annual meeting, 25-30 August, 2013, Nantes, France
Symposium on South American Camelids and other Fibre Animals
10
Session 43 Theatre 1
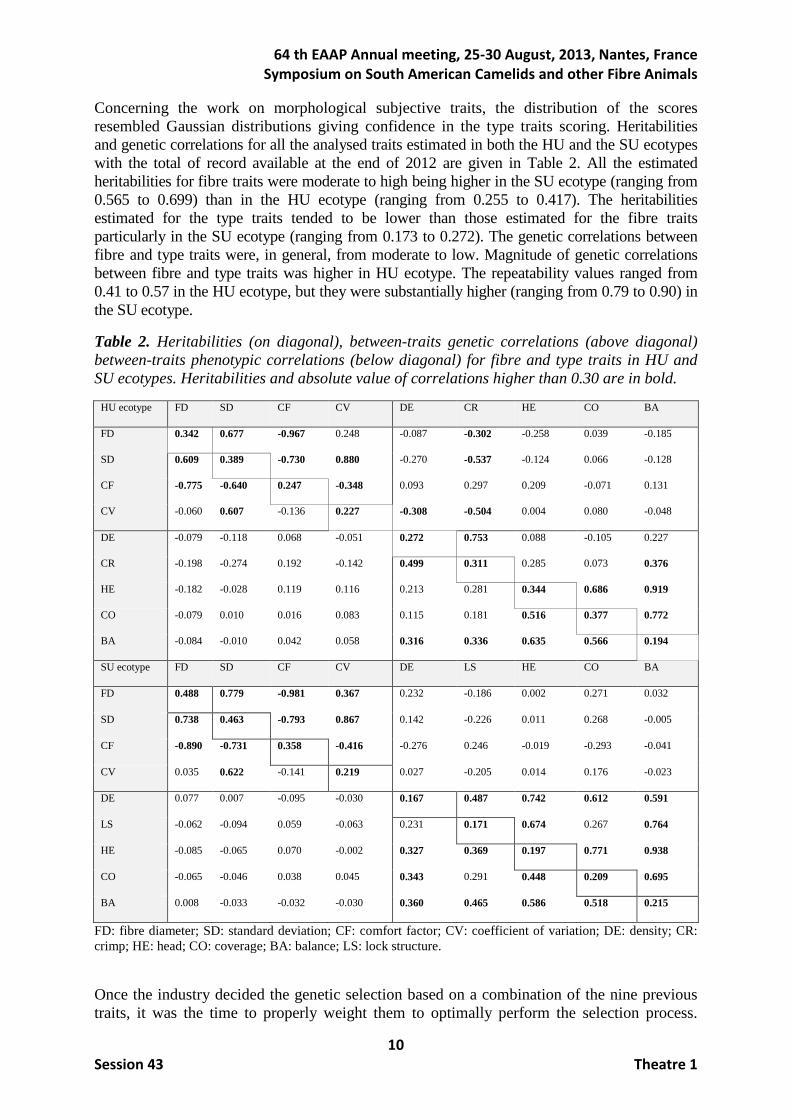
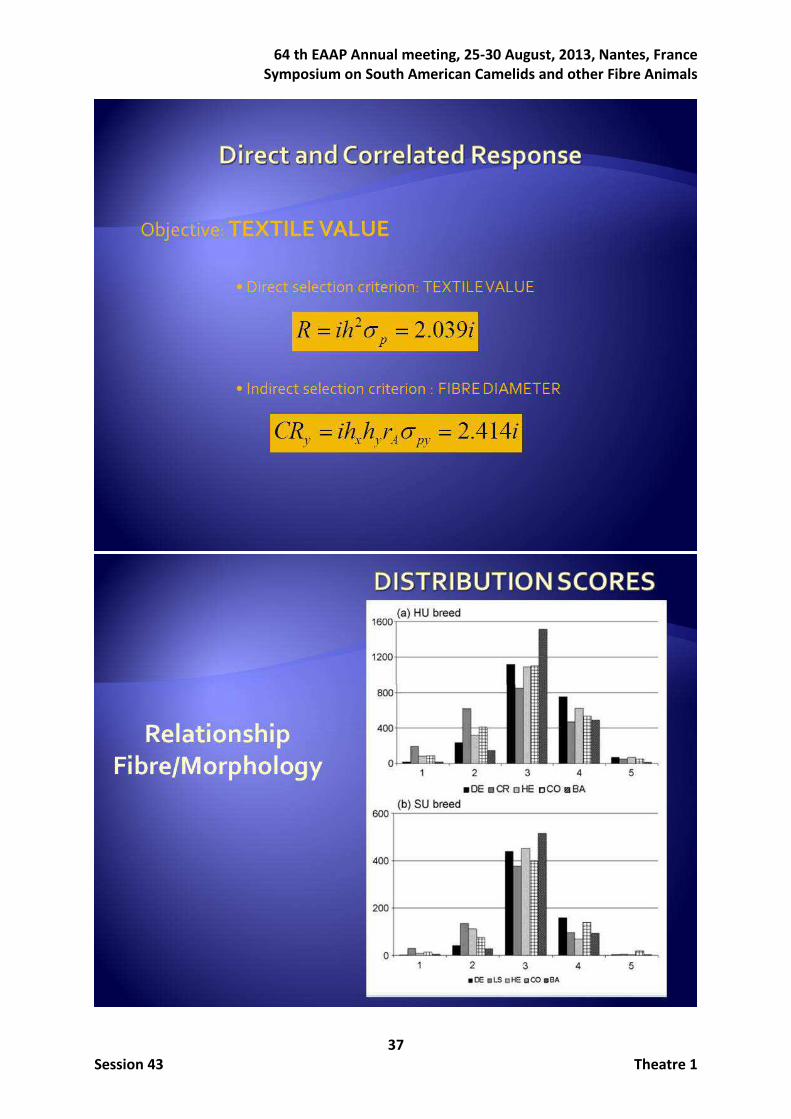
Concerning the work on morphological subjective traits, the distribution of the scores resembled Gaussian distributions giving confidence in the type traits scoring. Heritabilities and genetic correlations for all the analysed traits estimated in both the HU and the SU ecotypes with the total of record available at the end of 2012 are given in Table 2. All the estimated heritabilities for fibre traits were moderate to high being higher in the SU ecotype (ranging from 0.565 to 0.699) than in the HU ecotype (ranging from 0.255 to 0.417). The heritabilities estimated for the type traits tended to be lower than those estimated for the fibre traits particularly in the SU ecotype (ranging from 0.173 to 0.272). The genetic correlations between fibre and type traits were, in general, from moderate to low. Magnitude of genetic correlations between fibre and type traits was higher in HU ecotype. The repeatability values ranged from 0.41 to 0.57 in the HU ecotype, but they were substantially higher (ranging from 0.79 to 0.90) in the SU ecotype.
Table 2. Heritabilities (on diagonal), between-traits genetic correlations (above diagonal) between-traits phenotypic correlations (below diagonal) for fibre and type traits in HU and SU ecotypes. Heritabilities and absolute value of correlations higher than 0.30 are in bold.
HU ecotype FD SD CF CV DE CR HE CO BA
FD 0.342 0.677 -0.967 0.248 -0.087 -0.302 -0.258 0.039 -0.185
SD 0.609 0.389 -0.730 0.880 -0.270 -0.537 -0.124 0.066 -0.128
CF -0.775 -0.640 0.247 -0.348 0.093 0.297 0.209 -0.071 0.131
CV -0.060 0.607 -0.136 0.227 -0.308 -0.504 0.004 0.080 -0.048
DE -0.079 -0.118 0.068 -0.051 0.272 0.753 0.088 -0.105 0.227
CR -0.198 -0.274 0.192 -0.142 0.499 0.311 0.285 0.073 0.376
HE -0.182 -0.028 0.119 0.116 0.213 0.281 0.344 0.686 0.919
CO -0.079 0.010 0.016 0.083 0.115 0.181 0.516 0.377 0.772
BA -0.084 -0.010 0.042 0.058 0.316 0.336 0.635 0.566 0.194
SU ecotype FD SD CF CV DE LS HE CO BA
FD 0.488 0.779 -0.981 0.367 0.232 -0.186 0.002 0.271 0.032
SD 0.738 0.463 -0.793 0.867 0.142 -0.226 0.011 0.268 -0.005
CF -0.890 -0.731 0.358 -0.416 -0.276 0.246 -0.019 -0.293 -0.041
CV 0.035 0.622 -0.141 0.219 0.027 -0.205 0.014 0.176 -0.023
DE 0.077 0.007 -0.095 -0.030 0.167 0.487 0.742 0.612 0.591
LS -0.062 -0.094 0.059 -0.063 0.231 0.171 0.674 0.267 0.764
HE -0.085 -0.065 0.070 -0.002 0.327 0.369 0.197 0.771 0.938
CO -0.065 -0.046 0.038 0.045 0.343 0.291 0.448 0.209 0.695
BA 0.008 -0.033 -0.032 -0.030 0.360 0.465 0.586 0.518 0.215
FD: fibre diameter; SD: standard deviation; CF: comfort factor; CV: coefficient of variation; DE: density; CR: crimp; HE: head; CO: coverage; BA: balance; LS: lock structure.
Once the industry decided the genetic selection based on a combination of the nine previous traits, it was the time to properly weight them to optimally perform the selection process.
64 th EAAP Annual meeting, 25-30 August, 2013, Nantes, France
Symposium on South American Camelids and other Fibre Animals
11
Session 43 Theatre 1
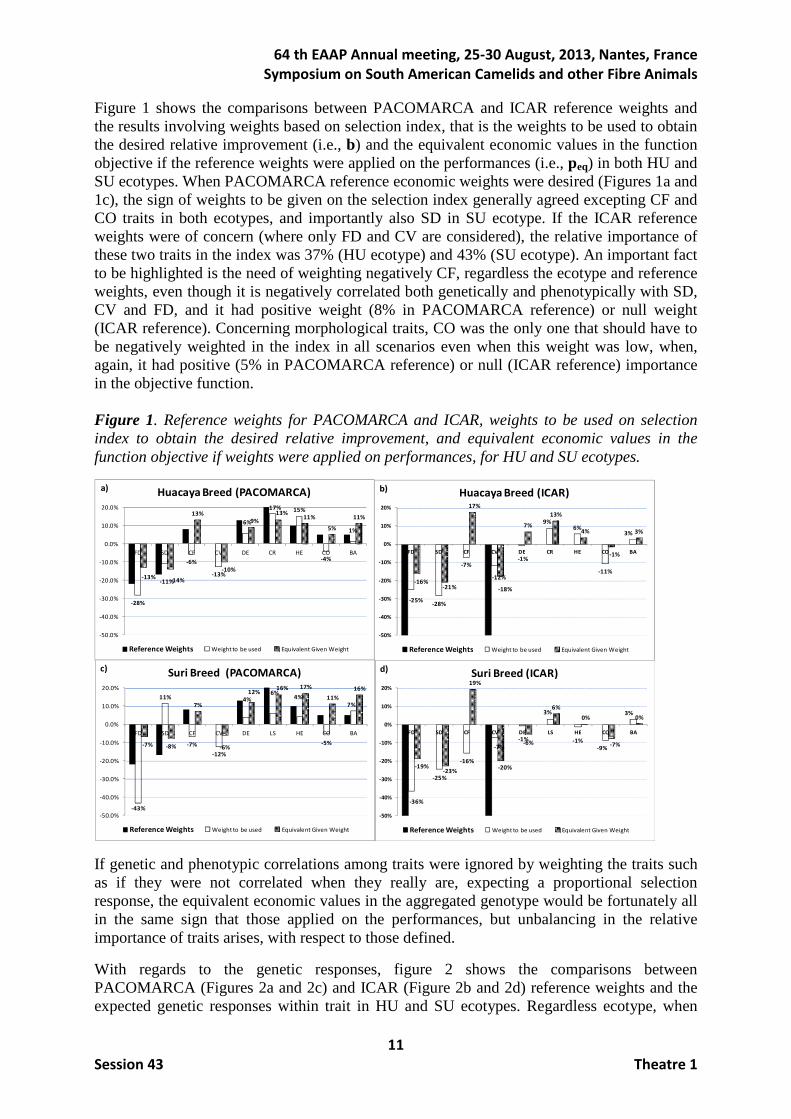
Figure 1 shows the comparisons between PACOMARCA and ICAR reference weights and the results involving weights based on selection index, that is the weights to be used to obtain the desired relative improvement (i.e., b) and the equivalent economic values in the function objective if the reference weights were applied on the performances (i.e., peq) in both HU and SU ecotypes. When PACOMARCA reference economic weights were desired (Figures 1a and 1c), the sign of weights to be given on the selection index generally agreed excepting CF and CO traits in both ecotypes, and importantly also SD in SU ecotype. If the ICAR reference weights were of concern (where only FD and CV are considered), the relative importance of these two traits in the index was 37% (HU ecotype) and 43% (SU ecotype). An important fact to be highlighted is the need of weighting negatively CF, regardless the ecotype and reference weights, even though it is negatively correlated both genetically and phenotypically with SD, CV and FD, and it had positive weight (8% in PACOMARCA reference) or null weight (ICAR reference). Concerning morphological traits, CO was the only one that should have to be negatively weighted in the index in all scenarios even when this weight was low, when, again, it had positive (5% in PACOMARCA reference) or null (ICAR reference) importance in the objective function. Figure 1. Reference weights for PACOMARCA and ICAR, weights to be used on selection index to obtain the desired relative improvement, and equivalent economic values in the function objective if weights were applied on performances, for HU and SU ecotypes.
If genetic and phenotypic correlations among traits were ignored by weighting the traits such as if they were not correlated when they really are, expecting a proportional selection response, the equivalent economic values in the aggregated genotype would be fortunately all in the same sign that those applied on the performances, but unbalancing in the relative importance of traits arises, with respect to those defined.
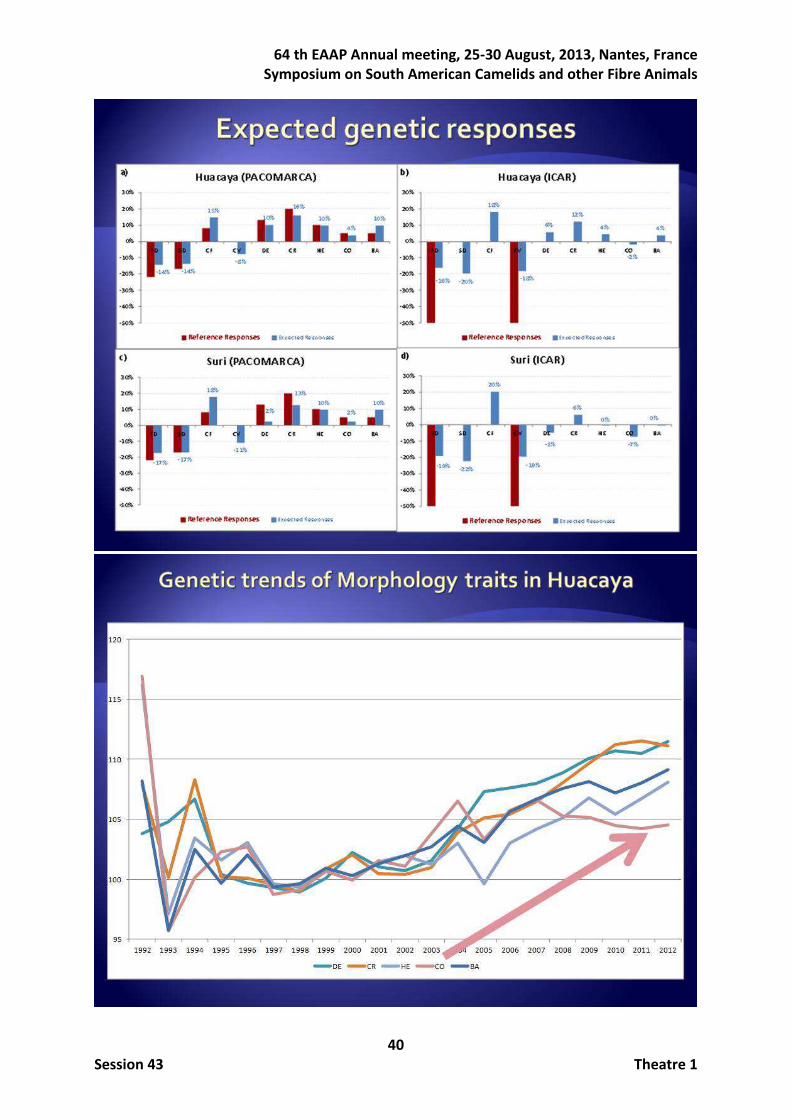
With regards to the genetic responses, figure 2 shows the comparisons between PACOMARCA (Figures 2a and 2c) and ICAR (Figure 2b and 2d) reference weights and the expected genetic responses within trait in HU and SU ecotypes. Regardless ecotype, when
-28%
-11%
-6%
-13%
6%
17% 15%
-4%
1%
-13%-14%
13%
-10%
9%
13%11%
5%
11%
-50.0%
-40.0%
-30.0%
-20.0%
-10.0%
0.0%
10.0%
20.0%
FD SD CF CV DE CR HE CO BA
Huacaya Breed (PACOMARCA)
Reference Weights Weight to be used Equivalent Given Weight
a)
-43%
11%
-7%
-12%
4%6%
4%
-5%
7%
-7% -8%
7%
-6%
12%16% 17%
11%
16%
-50.0%
-40.0%
-30.0%
-20.0%
-10.0%
0.0%
10.0%
20.0%
FD SD CF CV DE LS HE CO BA
Suri Breed (PACOMARCA)
Reference Weights Weight to be used Equivalent Given Weight
c)
-25%-28%
-7%
-12%
-1%
9%6%
-11%
3%
-16%-21%
17%
-18%
7%
13%
4%
-1%
3%
-50%
-40%
-30%
-20%
-10%
0%
10%
20%
FD SD CF CV DE CR HE CO BA
Huacaya Breed (ICAR)
Reference Weights Weight to be used Equivalent Given Weight
b)
-36%
-25%
-16%
-7%
-1%
3%
-1%
-9%
3%
-19%-23%
19%
-20%
-6%
6%
0%
-7%
0%
-50%
-40%
-30%
-20%
-10%
0%
10%
20%
FD SD CF CV DE LS HE CO BA
Suri Breed (ICAR)
Reference Weights Weight to be used Equivalent Given Weight
d)
64 th EAAP Annual meeting, 25-30 August, 2013, Nantes, France
Symposium on South American Camelids and other Fibre Animals
12
Session 43 Theatre 1
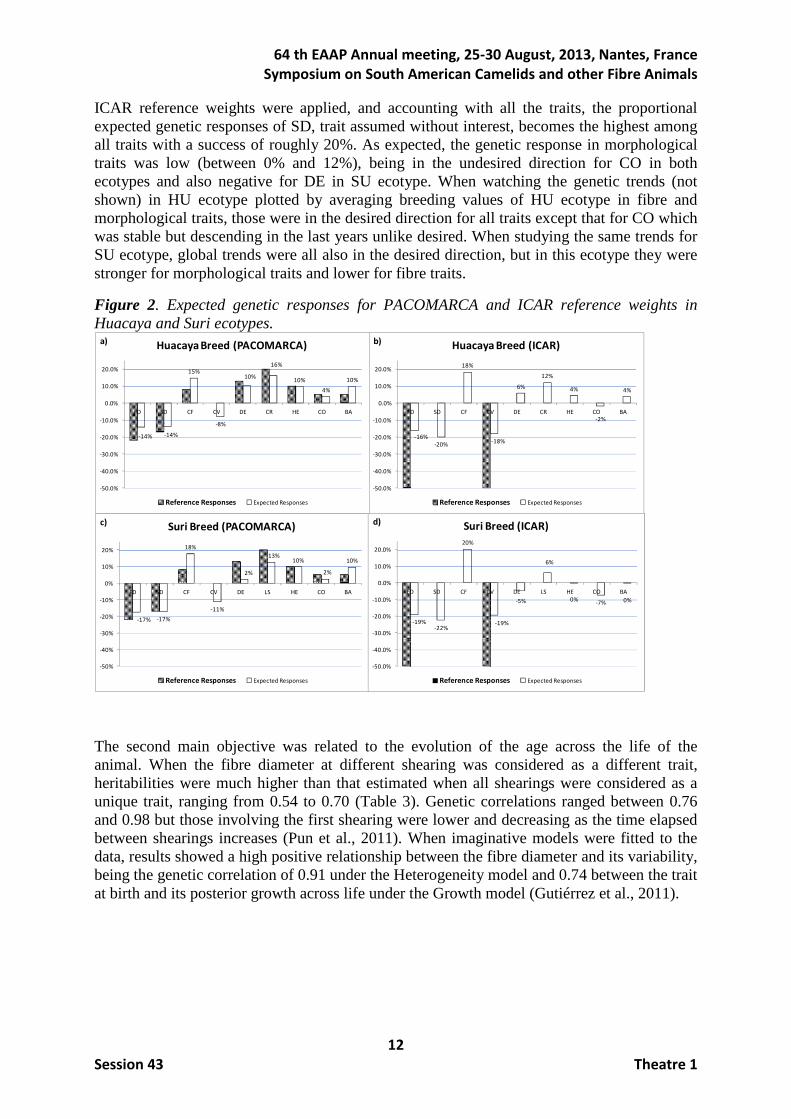
ICAR reference weights were applied, and accounting with all the traits, the proportional expected genetic responses of SD, trait assumed without interest, becomes the highest among all traits with a success of roughly 20%. As expected, the genetic response in morphological traits was low (between 0% and 12%), being in the undesired direction for CO in both ecotypes and also negative for DE in SU ecotype. When watching the genetic trends (not shown) in HU ecotype plotted by averaging breeding values of HU ecotype in fibre and morphological traits, those were in the desired direction for all traits except that for CO which was stable but descending in the last years unlike desired. When studying the same trends for SU ecotype, global trends were all also in the desired direction, but in this ecotype they were stronger for morphological traits and lower for fibre traits.
Figure 2. Expected genetic responses for PACOMARCA and ICAR reference weights in Huacaya and Suri ecotypes.
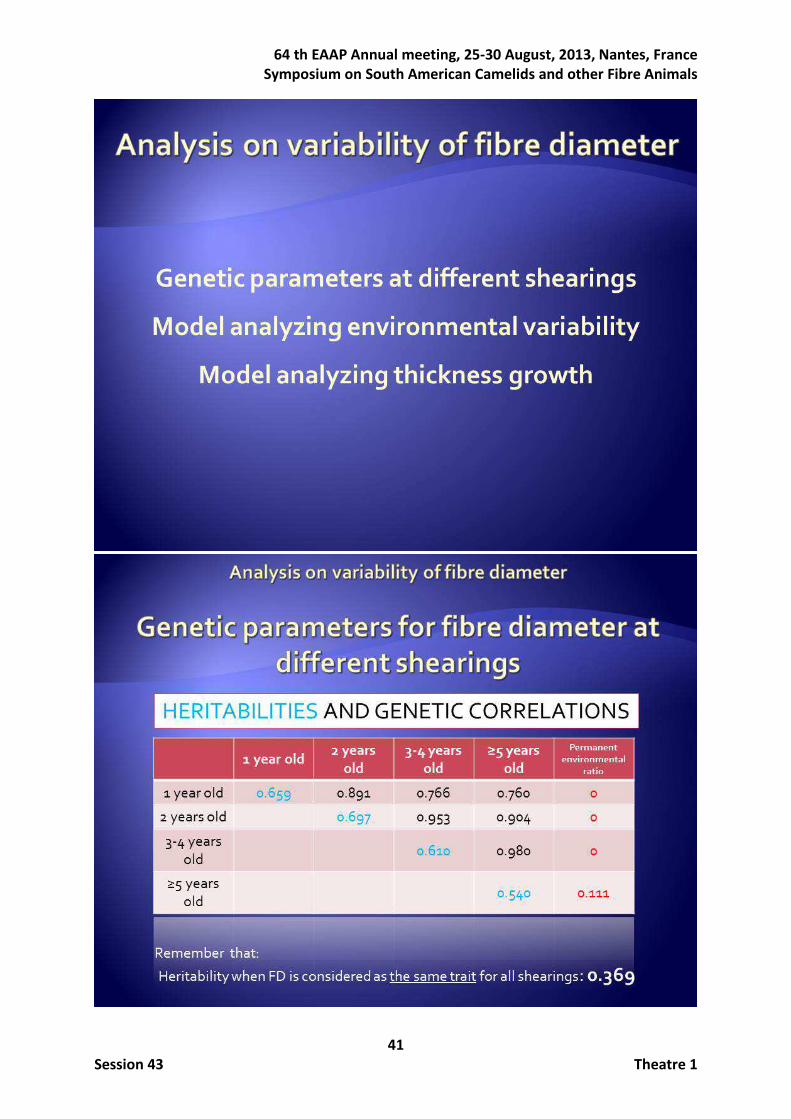
The second main objective was related to the evolution of the age across the life of the animal. When the fibre diameter at different shearing was considered as a different trait, heritabilities were much higher than that estimated when all shearings were considered as a unique trait, ranging from 0.54 to 0.70 (Table 3). Genetic correlations ranged between 0.76 and 0.98 but those involving the first shearing were lower and decreasing as the time elapsed between shearings increases (Pun et al., 2011). When imaginative models were fitted to the data, results showed a high positive relationship between the fibre diameter and its variability, being the genetic correlation of 0.91 under the Heterogeneity model and 0.74 between the trait at birth and its posterior growth across life under the Growth model (Gutiérrez et al., 2011).
-16%
-20%
18%
-18%
6%
12%
4%
-2%
4%
-50.0%
-40.0%
-30.0%
-20.0%
-10.0%
0.0%
10.0%
20.0%
FD SD CF CV DE CR HE CO BA
Huacaya Breed (ICAR)
Reference Responses Expected Responses
b)
-14% -14%
15%
-8%
10%
16%
10%
4%
10%
-50.0%
-40.0%
-30.0%
-20.0%
-10.0%
0.0%
10.0%
20.0%
FD SD CF CV DE CR HE CO BA
Huacaya Breed (PACOMARCA)
Reference Responses Expected Responses
a)
-17% -17%
18%
-11%
2%
13%10%
2%
10%
-50%
-40%
-30%
-20%
-10%
0%
10%
20%
FD SD CF CV DE LS HE CO BA
Suri Breed (PACOMARCA)
Reference Responses Expected Responses
c)
-19%-22%
20%
-19%
-5%
6%
0%-7% 0%
-50.0%
-40.0%
-30.0%
-20.0%
-10.0%
0.0%
10.0%
20.0%
FD SD CF CV DE LS HE CO BA
Suri Breed (ICAR)
Reference Responses Expected Responses
d)
64 th EAAP Annual meeting, 25-30 August, 2013, Nantes, France
Symposium on South American Camelids and other Fibre Animals
13
Session 43 Theatre 1
Table 3. Heritabilities (on diagonal), between-traits genetic (above diagonal) and permanent environmental ratio for fibre diameter considered at different shearings in HU ecotype.
Age in years
1 year old
2 years old
3-4 years old
≥5 years old
Permanent environmental ratio
1 year 0.659 0.891 0.766 0.760 0
2 years
0.697 0.953 0.904 0
3-4 years
0.610 0.980 0
≥5 years
0.540 0.111
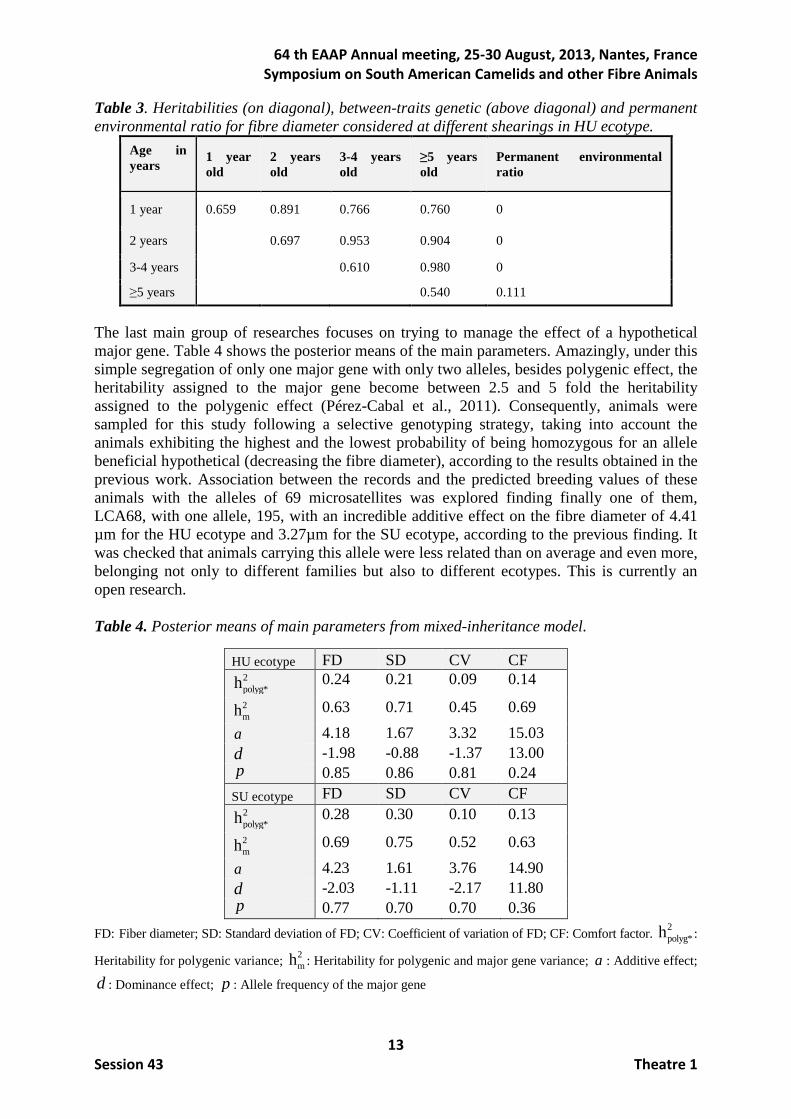
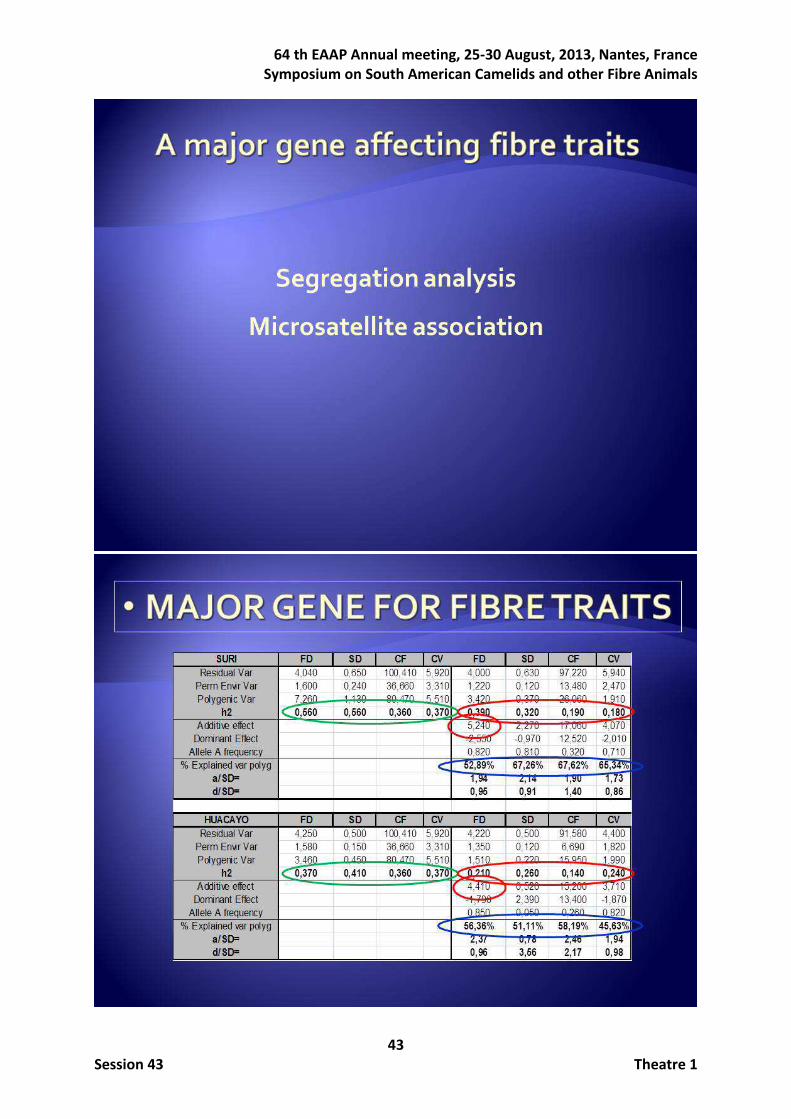
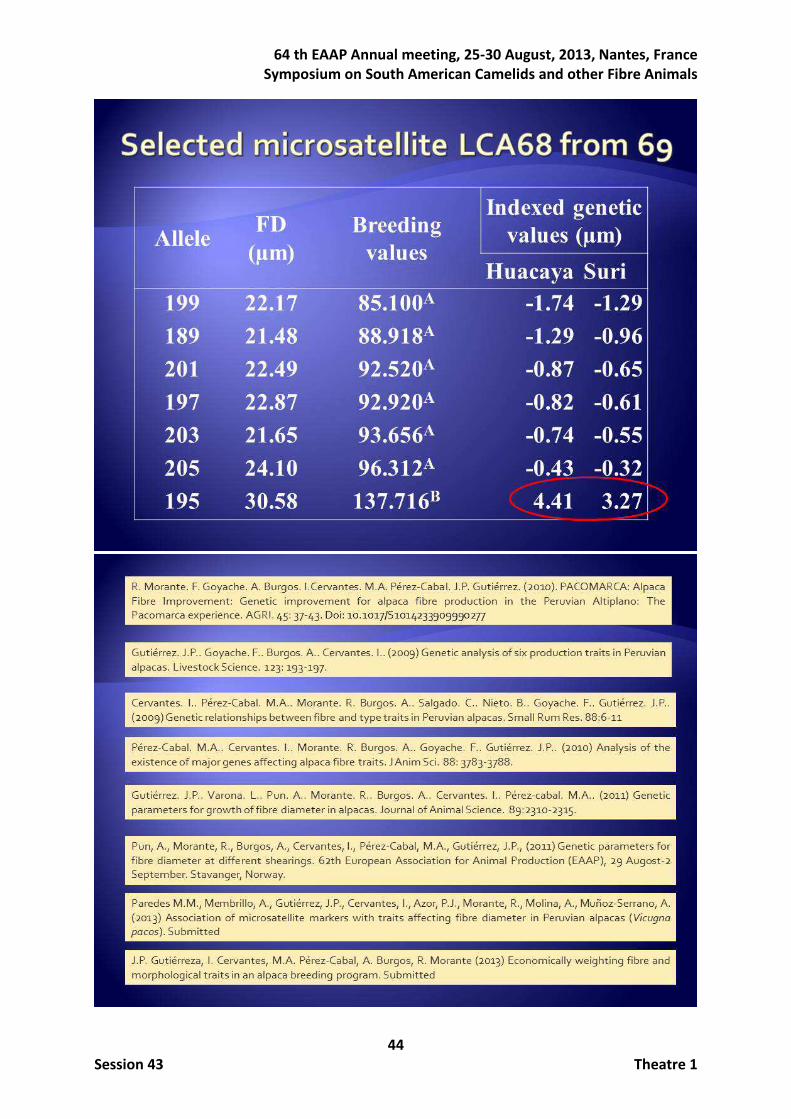
The last main group of researches focuses on trying to manage the effect of a hypothetical major gene. Table 4 shows the posterior means of the main parameters. Amazingly, under this simple segregation of only one major gene with only two alleles, besides polygenic effect, the heritability assigned to the major gene become between 2.5 and 5 fold the heritability assigned to the polygenic effect (Pérez-Cabal et al., 2011). Consequently, animals were sampled for this study following a selective genotyping strategy, taking into account the animals exhibiting the highest and the lowest probability of being homozygous for an allele beneficial hypothetical (decreasing the fibre diameter), according to the results obtained in the previous work. Association between the records and the predicted breeding values of these animals with the alleles of 69 microsatellites was explored finding finally one of them, LCA68, with one allele, 195, with an incredible additive effect on the fibre diameter of 4.41 µm for the HU ecotype and 3.27µm for the SU ecotype, according to the previous finding. It was checked that animals carrying this allele were less related than on average and even more, belonging not only to different families but also to different ecotypes. This is currently an open research. Table 4. Posterior means of main parameters from mixed-inheritance model.
HU ecotype FD SD CV CF 2polyg*h 0.24 0.21 0.09 0.14
2mh 0.63 0.71 0.45 0.69
a 4.18 1.67 3.32 15.03 d -1.98 -0.88 -1.37 13.00 p 0.85 0.86 0.81 0.24
SU ecotype FD SD CV CF 2polyg*h 0.28 0.30 0.10 0.13
2mh 0.69 0.75 0.52 0.63
a 4.23 1.61 3.76 14.90 d -2.03 -1.11 -2.17 11.80 p 0.77 0.70 0.70 0.36
FD: Fiber diameter; SD: Standard deviation of FD; CV: Coefficient of variation of FD; CF: Comfort factor. 2polyg*h :
Heritability for polygenic variance; 2mh : Heritability for polygenic and major gene variance; a : Additive effect;
d : Dominance effect; p : Allele frequency of the major gene
64 th EAAP Annual meeting, 25-30 August, 2013, Nantes, France
Symposium on South American Camelids and other Fibre Animals
14
Session 43 Theatre 1
Discussion The main researches carried out on the Pacomarca experimental fund have been briefly summarized here. These works have been grouped according to related objectives, and have been dealt in an appropriate order concerning feasibility and urgency of action. Therefore, first, defining the selection objective and the way of applying the relative importance of traits has been addressed. Then, disentangling the genetic relationship between the fibre diameter and its variability, a key point in the textile industry, has been faced. Finally, studies aiming to finally monitor the segregation of a major gene for fibre diameter have also been carried out. Regarding genetic parameters of traits as potential selection objectives, there were no available references for estimates of genetic correlations between production traits in alpacas but also the number of estimates of heritability for these traits was scarce. The database analysed had a correct structure thus making us confident on the results reported here. Final heritabilities were in concordance with expected, and highlighted that successful response will be expected if selecting to jointly decrease fibre diameter and coefficient of variation, the two mandatory traits to be recorded according with ICAR recommendations (ICAR 2012). Other traits such as fleece weight, staple length and shearing interval were discarded given their relative low importance and their final low heritability estimates. Particularly, resemblance among fleece weights from different shearings of the same animal was not attributed to its genetic background but to environmental permanent influence. Even though fibre diameter has traditionally been one of the most important economic selection objectives in specialised wool/fibre producing species, PACOMARCA pay a great deal of attention to the improvement of the textile value as the main selection criterion. The estimated parameters provided here make it possible to use FD rather than the TV index as selection criterion. The
response to direct selection is 2pR ih σ= (Falconer and McKay, 1996), where pσ is the
phenotypic standard deviation and i the selection intensity, while the correlated response on a trait Y when using a different trait X as selection criterion is Y X Y A pYCR ih h rσ= , rA being the
additive genetic correlation between traits. With the parameters obtained in this study the response to direct selection for TV would be R = 2.039 i while the correlated response TV would be 2.414 i when the selection criterion is FD. Therefore, it should then be more efficient to use FD instead of TV as a selection criterion to increase textile value in Peruvian alpacas. The heritabilities and between-traits patterns of genetic assessed on the analysed traits suggest the need that FD and CV should be the main selection goals in improvement programs focused on increasing the profits of alpaca fibre producers. As the experimental ranch is also interested in selling animals, subjective morphological traits were also studied. All traits except one were the same in both ecotypes and maybe the parameters could provide different estimates as both populations are independent. Moreover, crimp in HU and lock structure in SU could be similar or different traits too. Therefore later analyses were carried out independently for the two ecotypes. This was the first time in which genetic parameters were estimated separately in the HU and SU ecotypes for fibre traits (see Frank et al., 2006 and Gutiérrez et al., 2009, for reviews), and the first report on genetic analysis of type traits in alpaca. The novelty was finding high estimated heritabilities in the SU ecotype for fibre traits (around 0.5). From our results, we can argue of the existence of major genes influencing fibre traits segregating in different alpaca populations. In our case, these putative major genes would segregate, at least, in the SU breed. This was the reason leading us to carry out later segregation analyses. Concerning fibre traits, the genetic correlations between fibre related traits were extremely similar in both
64 th EAAP Annual meeting, 25-30 August, 2013, Nantes, France
Symposium on South American Camelids and other Fibre Animals
15
Session 43 Theatre 1
ecotypes (Table 2). FD and CF appeared genetically as the same trait. Genetic correlations for FD-CV were substantially lower than those estimated for FD-SD thus suggesting that the main relationship between the trait (FD) and its variability was due to a scale effect. Concerning type traits, heritabilities estimated were, in general, moderate to high in the HU ecotype and moderate to low in the SU ecotype. In contrast with fibre traits genetic correlations between type traits showed different patterns in each ecotype. This suggests that the classifier assesses different aspects for each trait depending on the ecotype. Type traits were, in general, poorly correlated with fibre traits except for CR in the HU breed, which had favourable correlations, from moderate to high, with fibre traits. This is of special importance due to the predominance of the HU ecotype in the South American camelid fibre production (Lupton et al., 2006). Scoring of CR could be routinely obtained in the HU population in Peru, but its genetic correlations with fibre traits would not justify using the CR scoring to replace the performance recording based on objective fibre assessments, but in areas in which such ‘modern’ performance recording could not be implemented, CR scoring could be an alternative. The complexity of genetic and phenotypic correlations among all considered traits, which in addition are most of them of interest to the industry, does not facilitate building a selection index to choose animals to reproduce. A methodology based on the selection index theory by Hazel and Lush (1943) was developed for the first time to standardize economic weights and to study relative genetic responses starting from genetic parameters, and has been applied to the previous commented parameters. Inverse transformations were also developed to better planning the use of relative weights showing the consequences of applying relative weights on the performances instead of breeding values. Two approaches were used. In the first one, the relative importance of the traits in the aggregate genotype was taken into account to derive the appropriate weights of the traits in the selection index. These weights inform about how much a trait should be proportionally selected related to each other in order to obtain the desired relative economic. Conversely, the equivalent economic values were computed assuming that individuals were being selected using those weights directly applied on the performances. The equivalent economic values reflect how the genetic components of traits are actually being weighted unlike desired as a consequence of applying the weighting on the criteria (performances) instead the objectives (genetic values). When the desired reference weights were those called here as ICAR recommendations (ICAR, 2012), if all the traits were recorded, selection index theory reports that the trait to be highest weighted in HU ecotype should be SD (-28%), in which the breeder is not theoretically interested, being CO negatively weighted (-11%) and almost in the same extent that one of the target traits, CV (-12%). Another interesting point is the so different weighing of the two target traits in the index, but equally important in the objective. According to the index, FD should have to be weighted more than twice in HU ecotype (-25% vs -12%), and five fold in SU ecotype (-36% vs -7%). And to cite a final inconsistency, CF, which was of highly importance for the textile industry, would have a negative weight in both ecotypes (-7% in HU ecotype and -16% in SU ecotype). Conversely, applying directly the weights on the performances instead of on the genetic value, the equivalent proportional value remains as expected. However, the other two fibre traits, highly correlated with FD and CV, had a similar or even higher economic importance in the real objective. Concerning the second approach, that studying the proportional expected genetic response, when compared with the proportional desired responses addressed by the economic weights, the drawn conclusions were almost identical to those coming from the inverse approach above. Therefore, some ignored traits in the set of economic weights, such as SD and CF, were strongly modified by indirect genetic selection, and also morphological traits were roughly unmodified being CO the most negatively committed trait.
64 th EAAP Annual meeting, 25-30 August, 2013, Nantes, France
Symposium on South American Camelids and other Fibre Animals
16
Session 43 Theatre 1
When the desired reference weights were those called here as Pacomarca reference weights, the scenario was much more complex to notice. First, there are more involved traits, and second, mates are designed roughly searching animals according to their defined economic weight. One additional point of uncertainty is that, although reference economic weights were defined for both ecotypes, they were not exactly bred with the same objectives. For example, CV was ignored in the profit function but it becomes one of the most important, and accordingly its genetic trend was negative. The negative effect of a misuse of weighting warned about the possible negative impact on CO, and so the genetic trend has been in both ecotypes. Note that this result could have been advanced if these computations had been carried out before. The genetic trends (not shown) of morphological and fibre traits similarly evolved for HU ecotype. However morphological trend was stronger than fibre traits in SU type. It probably could have been predicted if the genetic parameters were known given that the equivalent economic weights summed up to 45% fiber and 55% morphology in HU ecotype but 24% fiber and 76% morphology in SU ecotype when the hypothetical weights in both ecotypes were 47% fiber and 53% morphological. As an interesting claim of the industry was to reduce the variability, assuming they have reached a desired fineness, a group of works were conducted to try to understand the relationship between fibre diameter, variability and age. The study assigning the different shearings to different traits allowed seeing that the highest heritability was that estimated for two years old animals, indicating that shearing at two years of age was the best showing the genetic value of the animal. Even though first shearing is usually the thinnest, it appeared as the lowest representing the genetics of the fiber diameter of the animal along its life. Therefore, precocious selection performed following a dazzling first record, would be misleading (Pun et al., 2011). If the first shearing was the lowest genetically correlated with the others, the question that remained unresolved was if there were animals maintaining a low fibre diameter along their life against others that would not do. Two different models were essayed, GR model decomposing the trait in an intercept understood as the fibre diameter at birth and the fibre diameter growth, and HE model fitting together the mean trait and its variability (SanCristobal et al., 1998). Both models provided similar results and conducted to the same conclusions. When the HE model was fitted, a high positive genetic correlation (0.91) was found between the trait and its environmental variability, which would encourage carrying out a genetic selection towards the direction of decreasing the trait mean since it would lead to a correlated decrease in its variability. Results from the GR model suggested that there was substantial genetic variation on fibre diameter at birth and also on the linear growth of fibre diameter. The estimate of the additive genetic correlation between fibre diameter at birth and its linear growth was 0.74. Again, selection to increase the growth of the fibre diameter without a substantial reduction of the fibre diameter at birth seems not possible. Fortunately, fibre diameter is preferred to be decreased even when it would be preferable to select those animals with thinnest fibre that also maintain it along their life due to their economic value. As a global result, high genetic correlations have been found, on one hand, between the trait and its variability and, on the other hand, between the trait at birth and its growth with age. The last aim of the researches in Pacomarca was trying to point out if a major gene exists segregating for fibre diameter and giving steps towards the ideal use of it by monitoring the correct allele transfer from parents to offspring. The results of segregation analyses for the HU and SU ecotypes showed that, overall, a major gene effect was associated with the 4 studied traits. Additive effects were high, and dominance effects were also estimated in the desired direction of the traits, a decrease in FD,
64 th EAAP Annual meeting, 25-30 August, 2013, Nantes, France
Symposium on South American Camelids and other Fibre Animals
17
Session 43 Theatre 1
SD and CV, and an increase in CF. The additive effect on fiber diameter were such as the differences between homozygous individuals were 8.36 µm and 8.46 µm, for HU and SU ecotypes, respectively. Estimated frequencies of the major gene allele, that worsening the trait, were 0.85 for the HU breed and 0.77 for the SU ecotype. In addition, in all traits, the ratio between polygenic variances from the polygenic model and from the mixed inheritance model was lower than 50%, and the major gene variance was greater than polygenic variance. Similar amazing results were found in the other traits and confirmed our hypothesis that segregating major genes were affecting fiber traits in both HU and SU alpaca ecotypes. Given the genetic correlations reported by Cervantes et al. (2010) maybe two major genes would be involved. One major gene could be affecting the fiber diameter (FD and CF) since the antagonistic and strong genetic correlation (-0.97 and -0.98 for HU and SU, respectively) between them showed that the prickliness was associated to finer fibers. Diameter variability (SD and CV) might depend on a second major gene because of the high genetic correlation between them in addition to the low correlation between FD and CV (around 0.3 for both ecotypes). The next step was using a molecular approach to roughly manage the selection of animals carrying the favorable allele of the hypothetical gene. Once faced this study, the more significant finding of this work was the associations of four microsatellite loci (LCA68, VOLP59, LCA90 and GLM6) with breeding values for fiber diameter wherein one major gene proposed by Perez-Cabal et al. (2010) on a previous study would be involved indicating a possible relationship with these loci . According to these results, and accounting their significance, the critical one from the viewpoint of selection to improve (decrease) the fiber diameter in these alpaca populations would be the 195 unfavorable allele (additive effect of 4.41 µm in HU and 3.27 µm in SU) in the LCA68 locus. Further studies are needed to confirm the associations found in this study also to be validated in other alpaca populations. Conclusion Some main conclusions have been arisen in this set of researches:
- First the selection criteria should involve preferably FD and CV traits. Fibre and type traits have been shown to be highly heritable and great success should be expected if well done artificial selection process were face.
- A methodology has been proposed and shown to be an effective tool to select for a combination of traits.
- Selection against FD favors selection against variability across shearings. - A major gene in fibre traits seems to exist in alpacas.
And the main conclusion refers to the usefulness of a well designed dataset and of a serious registering work. Acknowledgements The author is extremely grateful to Pacomarca for providing the information and all facilities, and to all those contributing in the researches: Isabel Cervantes, Renzo Morante, Alonso Burgos, Félix Goyache, Conchita Salgado, Blanca Nieto, María Ángeles Pérez-Cabal, Luis Varona and Andrés Pun.
64 th EAAP Annual meeting, 25-30 August, 2013, Nantes, France
Symposium on South American Camelids and other Fibre Animals
18
Session 43 Theatre 1
References
Allain, D., Renieri, C., 2010. Genetic of fibre production and fleece characteristic in small ruminants, Angora rabbit and South American camelids. Animal 4, 1472-1481.
Allain, D., Schibler, L., Mura, L., Barillet, F., Sechi, T., Rupp, R., Casu, S., Cribiu, E., Carta, A., 2006. QTL detection with DNA markers for wool traits in a sheep backcross Sarda x Lacaune resource population In: Proceeding of the 8th World Congress Genet. Appl. Livest. Prod. Belo-Horizonte, Brazil; CD-ROM communication 05-07.
Aranguren, J., Jordana, J., 2001. Utilización de marcadores de ADN (microsatélite) en poblaciones de animales domésticos en peligro de extinción. In: Memorias Asociación Venezolana de Producción Animal (AVPA), Venezuela.
Bidinost, F., Roldan, D.L., Rodero, A.M., Cano, E.M., Taddeo, H.R., Mueller, J.P., Poli, M.A., 2008. Wool quantitative trait loci in Merino sheep. Small Rumin. Res. 74, 113-118.
Box, G.E.P, and G. Tiao. 1973. Bayesian inference in statistical analysis. Addison-Wesley, Reading, MA.
Bustamante, A.V., Maté, M.L., Zambelli, A., Vidal, L., 2003. Isolation and characterization of 10 polymorphic dinucleotide microsatellite markers for llama and guanaco. Mol. Ecol. Notes 3, 68-69.
Cervantes, I., Pérez-Cabal, M.A., Morante, R., Burgos, A., Salgado, C., Nieto, B., Goyache, F., Gutiérrez, J.P., 2010. Genetic parameters and relationships between fiber and type traits in two breeds of Peruvian alpacas. Small Ruminant Research, 88:6-11.
Cransberg, R., Munyard, K.A., 2011. Polymorphisms detected in the tyrosinase and matp (slc45a2) genes did not explain coat colour dilution in a sample of alpaca (Vicugna pacos). Short communication. Small Rumin. Res. 95, 92-96.
Falconer, D.S., and T.F.C. Mackay. 1996. Introduction to quantitative genetics. 4th ed. Longman.
Frank EN, Hick MVH, Gauna CD, Lamas HE, Renieri C, Antonini M, 2006. Phenotypic and genetic description of fibre traits in South American domestic camelids (llamas and alpacas). Small Ruminant Research 61, 113-129
Gutiérrez, J.P., Goyache, F., Burgos, A., Cervantes, I., 2009. Genetic analysis of six production traits in Peruvian alpacas. Livestock Science, 123 : 193-197.
Gutiérrez, J.P., Varona, L., Pun, A., Morante, R., Burgos, A., Cervantes, I., Pérez-Cabal, M.A., 2011. Genetic parameters for growth of fiber diameter in alpacas. Journal of Animal Science, 89: 2310–2315.
Hazel, L.N., Lush, J.L., 1943. The efficiency of three methods of selection. Journal of Heredity, 33: 393-399.
Ibáñez-Escriche, N., M. Garcia, and D. Sorensen. 2010. GSEVM v.2: MCMC software to analyze genetically structured environmental variance models. J. Anim. Breed. Genet. 127: 249-251.
ICAR, 2012. ICAR rules, standards and guidelines on methods of alpaca identification. In: International Agreement of Recording Practices (Section 14.1.). International Commitee in Animal Recording. Guidelines approved by the General Assembly held in Cork, Ireland on June 2012.
Itenge-Mweza, T.O., Forrest, R.H.J., McKenzie, G.W., Hogan, A., Abbott, J., Amoafo, O., Hickford, J.G.H., 2007. Polymorphism of the KAP1.1, KAP1.3 and K33 genes in Merino sheep. Mol. Cell. Probes 21, 338-342.
Janss, L.L.G. 1998. Maggic: A package of subroutines for genetic analyses with Gibbs sampling. Proc. 6th World Congr. Appl. Livest. Prod. 27: 459-460.
Janss, L.L.G., R. Thompson, and van J.A.M. Arendonk. 1995. Applications of Gibbs sampling for inference in a mixed major-gene polygenic inheritance model in animal populations. Theor. Appl. Genet. 91: 1137-1147.
Janss, L.L., J.A. Van Arendonk, and E.W. Brascamp. 1997. Segregation analyses for presence of major genes affecting growth, backfat, and litter size in Duth Meishan crossbreds. J. Anim. Sci. 75: 2864-2876.
Lang, K.D.M., Wang, Y., Plante, Y., 1996. Fifteen polymorphic dinucleotide microsatellites in llamas and alpacas. Anim. Genet. 27, 285-294.
Lupton CJ, McColl A, Stobart RH, 2006. Fiber characteristics of the Huacaya Alpaca. Small Ruminant Research 64, 211–224
64 th EAAP Annual meeting, 25-30 August, 2013, Nantes, France
Symposium on South American Camelids and other Fibre Animals
19
Session 43 Theatre 1
Mariasegaram, M., Pullenayegum, S., Jahabar Ali, M., Shah, R.S., Penedo, M.C.T., Wernery, U., Sasse, J., 2002. Isolation and characterization of eight microsatellite markers in Camelus dromedarius and cross-species amplification in C. bactrianus and Lama pacos. Anim. Genet. 33, 377-405.
McGregor BA 2002 Comparative productivity and grazing behaviour of Huacaya Alpacas and Peppin Merino sheep grazed on annual pastures. Small Ruminant Research 44, 219–232.
McPartlan, H.C., Matthews, M.E., Robinson, N.A., 1998. Alpaca microsatellite at the VIAS A1 and VIAS A2 loci. Anim. Genet. 29, 150-160.
Morante, R., Goyache, F., Burgos, A., Cervantes, I., Pérez-Cabal, M.A., Gutiérrez, J.P., 2009. Genetic improvement for alpaca fibre production in the Peruvian Altiplano: The Pacomarca experience. AGRI, 45 : 37-43.
Neumaier A, Groeneveld E 1998. Restricted maximum likelihood estimation of covariances in sparse linear models, Genetics, Selection Evolution, 30: 3–26.
Obreque, V., Coogle, L., Henney, P.J., Bailey, E., Mancilla, R., García-Hiudobro, J., Hinrichsen, P., Cothran, E. G., 1998. Characterization of 10 polymorphic alpaca dinucleotide microsatellites. Anim. Genet. 29, 460-477.
Obreque, V., Mancilla, R., García, J., Cothran, E. G., Hinrichsen, P., 1999. Thirteen new dinucleotide microsatellites in alpaca. Anim. Genet. 30, 382-405.
Parsons, Y.M., Cooper, D.W., Piper, L.R., 1994. Evidence of linkage between high-glycine-tyrosine keratin gene loci and wool fiber diameter in a merino halft-sib family. Anim. Genet. 25, 108-108.
Penedo, M.C.T., Caetano, A. R., Cordova, K.I., 1998a. Microsatellite markers for South American camelids. Anim. Genet. 29, 398-413.
Penedo, M.C.T., Caetano, A. R., Cordova, K., 1998b. Eight microsatellite markers for South American camelids. Anim. Genet. 30, 161-168.
Penedo, M.C.T., Caetano, A.R., Cordova, K.I., 1999. Six microsatellite markers for South American camelids. Anim. Genet. 30, 382-405.
Pérez-Cabal, M.A., Cervantes, I., Morante, R., Burgos, A., Goyache, F., Gutierrez, J.P., 2010. Analysis of the existence of major genes affecting alpaca fiber traits. J. Anim. Sci. 88, 3783-3788.
Ponz, R., Moreno, C., Allain D., Elsen, J.M., Lantier, F., Lantier, I., Brunel, J.C., Pérez-Enciso, M., 2001. Assessment of genetic variation explained by markers for wool traits in sheep via a segment mapping approach. Mamm. Genome 12, 569-572.
Ponzoni RW, Grimson RJ, Hill JA, Hubbard DJ, McGregor BA, Howse A, Carmichael I, Judson GJ 1999. The inheritance of and associations among some production traits in young Austalian Alpacas. Procceedings of the Australian Association Advancement of Animal Breeding and Genetics 13, 468–471.
Pun, A., Morante, R., Burgos, A., Cervantes, I., Pérez-Cabal, M.A., Gutiérrez, J.P., 2011. Genetic parameters for fiber diameter at different shearings. 62th European Association for Animal Production (EAAP), 29 Augost-2 September. Stavanger, Norway.
Renieri, C., A. Valbonesi, V. La Manna, M. Antonini, and M. Asparrin. 2009. Inheritance of Suri and Huacaya type of fleece in Alpaca. Ital. J. Anim. Sci. 8: 83-91.
Rogers, G.R., Hickford, J.G.H., Bickerstaffe, R., 1994. Polymorphism in two genes for B2 sulfur proteins of wool. Anim. Genet. 25, 407-415.
Sánchez, M.P., J.P. Bidanel, S. Zhang, J. Naveau, T. Burlot, and P. Le Roy. 2003. Likelihood and Bayesian analyses reveal major genes affecting body composition, carcass, meta quality and the number of false teats in Chinese European pig line. Genet. Sel. Evol. 35: 385-402.
SanCristobal-Gaudy, M., J.M. Elsen, L. Bodin, and C. Chevalet. 1998. Prediction of the response to a selection for canalisation of a continuous trait in animal breeding. Genet. Sel. Evol. 30: 423- 451.
Sarno, R., David, V., Franklin, W., O’Brien, S., Johnson, W., 2000. Development of microsatellite markers in the guanaco, Lama guanicoe: utility for South American camelids. Mol. Ecol. 9, 1919-1952.
SAS Institute Inc., 2003. The Analyst Application, 2nd ed. SAS Institute Inc., Cary, Nc.
Schneiner, S.M. and R.F. Lyman. 1991.The genetics of phenotypic plasticity. II. Response to selection. J. Evol. Biol. 4: 23-50.
64 th EAAP Annual meeting, 25-30 August, 2013, Nantes, France
Symposium on South American Camelids and other Fibre Animals
20
Session 43 Theatre 1
Sheenan, N., and A. Thomas. 1993. On the irreductibility of a Markov chain defined on a space of genotype configurations by sampling scheme. Biometrics 49: 163-175.
Smith, B.J. 2007. Boa: An R package for MCMC output convergence assessment and posterior inference. J. Stat. Softw. 21(11): 1-37.
Sponenberg, D.P. 2010. Suri and Huacaya alpaca breeding results in North America. Small Ruminant Research doi:10.1016/j.smallrumres.2010.05.004.
Varona, L., C. Moreno, L.A. García-Cortés, and J. Altarriba. 1997. Multiple trait genetic analysis of underlying biological variables of production functions. Livest. Prod. Sci. 47: 201-209.
Wuliji T, Davis GH, Dodds KG, Turner PR, Andrews RN, Bruce GD 2000. Production performance, repeatability and heritability estimates for live weight, fleece weight and fiber characteristics of Alpacas in New Zealand. Small Ruminant Research 37, 189–201.
Yang, Y. 2010. The genetic of environmental variance. Doctoral Thesis. Aarhus University. Denmark.
64 th EAAP Annual meeting, 25-30 August, 2013, Nantes, France
Symposium on South American Camelids and other Fibre Animals
21
Session 43 Theatre 1
64 th EAAP Annual meeting, 25-30 August, 2013, Nantes, France
Symposium on South American Camelids and other Fibre Animals
22
Session 43 Theatre 1
64 th EAAP Annual meeting, 25-30 August, 2013, Nantes, France
Symposium on South American Camelids and other Fibre Animals
23
Session 43 Theatre 1
64 th EAAP Annual meeting, 25-30 August, 2013, Nantes, France
Symposium on South American Camelids and other Fibre Animals
24
Session 43 Theatre 1
64 th EAAP Annual meeting, 25-30 August, 2013, Nantes, France
Symposium on South American Camelids and other Fibre Animals
25
Session 43 Theatre 1
64 th EAAP Annual meeting, 25-30 August, 2013, Nantes, France
Symposium on South American Camelids and other Fibre Animals
26
Session 43 Theatre 1
64 th EAAP Annual meeting, 25-30 August, 2013, Nantes, France
Symposium on South American Camelids and other Fibre Animals
27
Session 43 Theatre 1
64 th EAAP Annual meeting, 25-30 August, 2013, Nantes, France
Symposium on South American Camelids and other Fibre Animals
28
Session 43 Theatre 1
64 th EAAP Annual meeting, 25-30 August, 2013, Nantes, France
Symposium on South American Camelids and other Fibre Animals
29
Session 43 Theatre 1
64 th EAAP Annual meeting, 25-30 August, 2013, Nantes, France
Symposium on South American Camelids and other Fibre Animals
30
Session 43 Theatre 1
64 th EAAP Annual meeting, 25-30 August, 2013, Nantes, France
Symposium on South American Camelids and other Fibre Animals
31
Session 43 Theatre 1
64 th EAAP Annual meeting, 25-30 August, 2013, Nantes, France
Symposium on South American Camelids and other Fibre Animals
32
Session 43 Theatre 1
64 th EAAP Annual meeting, 25-30 August, 2013, Nantes, France
Symposium on South American Camelids and other Fibre Animals
33
Session 43 Theatre 1
64 th EAAP Annual meeting, 25-30 August, 2013, Nantes, France
Symposium on South American Camelids and other Fibre Animals
34
Session 43 Theatre 1
64 th EAAP Annual meeting, 25-30 August, 2013, Nantes, France
Symposium on South American Camelids and other Fibre Animals
35
Session 43 Theatre 1
64 th EAAP Annual meeting, 25-30 August, 2013, Nantes, France
Symposium on South American Camelids and other Fibre Animals
36
Session 43 Theatre 1
64 th EAAP Annual meeting, 25-30 August, 2013, Nantes, France
Symposium on South American Camelids and other Fibre Animals
37
Session 43 Theatre 1
64 th EAAP Annual meeting, 25-30 August, 2013, Nantes, France
Symposium on South American Camelids and other Fibre Animals
38
Session 43 Theatre 1
64 th EAAP Annual meeting, 25-30 August, 2013, Nantes, France
Symposium on South American Camelids and other Fibre Animals
39
Session 43 Theatre 1
64 th EAAP Annual meeting, 25-30 August, 2013, Nantes, France
Symposium on South American Camelids and other Fibre Animals
40
Session 43 Theatre 1
64 th EAAP Annual meeting, 25-30 August, 2013, Nantes, France
Symposium on South American Camelids and other Fibre Animals
41
Session 43 Theatre 1
64 th EAAP Annual meeting, 25-30 August, 2013, Nantes, France
Symposium on South American Camelids and other Fibre Animals
42
Session 43 Theatre 1
64 th EAAP Annual meeting, 25-30 August, 2013, Nantes, France
Symposium on South American Camelids and other Fibre Animals
43
Session 43 Theatre 1
64 th EAAP Annual meeting, 25-30 August, 2013, Nantes, France
Symposium on South American Camelids and other Fibre Animals
44
Session 43 Theatre 1
64 th EAAP Annual meeting, 25-30 August, 2013, Nantes, France
Symposium on South American Camelids and other Fibre Animals
45
Session 43 Theatre 1