Quantitative Rietveld analysis of CAC clinker phases using ...
12
Quantitative Rietveld analysis of CAC clinker phases using synchrotron radiation F. Guirado a, ⁎ , S. Galí b a Servei de Recursos Científics i Tècnics, Univ. Rovira i Virgili, Campus Sescelades, Tarragona, Catalonia 43005, Spain b Dep. Cristal·lografia, Univ. Barcelona, Martí i Franquès sn, Barcelona, Catalonia 08028, Spain Received 3 May 2005; accepted 29 May 2006 Abstract The quantitative Rietveld analyses of twenty samples of CAC from four different manufacturers over the world, one synthetic mixture and a NIST standard were performed using synchrotron radiation. As compared with conventional XRD, synchrotron powder diffraction permitted to find new minor phases, improve the characterization of solid solutions of iron rich CAC phases and reduce preferential orientation and microabsorption effects. Diffraction data were complemented with XRF and TG/DT analyses. Synchrotron results were used as a reference test to improve the performance of conventional powder diffraction, by an accurate selection of refinable profile and structural parameters, and permitted to extract several recommendations for conventional quantitative Rietveld procedures. It is shown that with these recommendations in mind, conventional XRD based Rietveld analyses are comparable to those obtained from synchrotron data. In summary, quantitative XRD Rietveld analysis is confirmed as an excellent tool for the CAC cement industry. © 2006 Elsevier Ltd. All rights reserved. Keywords: Synchrotron diffraction; X-ray diffraction; Quantitative Rietveld analysis; Calcium aluminate cement 1. Introduction Standardless Rietveld quantitative analysis of clinker phases is becoming a straightforward reliable tool for quality control in cement industry. In recent years several important papers on Rietveld analysis of both, Portland [1,2] and calcium aluminate (CAC) cements [3,4] have been published, drawing the attention on the potential advantages of the method, as compared with other traditional quantitative methods of the cement industry. The quantitative Rietveld method is based on two premises: one is the accurate knowledge of the crystal structures of the phases present, and the other regards all the instrumental factors involved in the obtention of the diffraction profile. The knowl- edge of the structural variations expected in clinker phases al- lows a wise selection of the crystallographic parameters that can be introduced in the fitting model. On the other hand, the ac- curate calibration of the diffractometer permits to minimize the instrument dependent parameters used, avoiding misleading correlations between structural and instrumental parameters, that may introduce bias in the quantification of phases. Since the cement is produced from natural or recycled raw materials with variable composition, the clinker produced results in a complex variable multiphase–multicomponent system. The full characterization of this system from a single powder diffrac- tion profile requires the previous solution of several important problems. For CAC, a non-exhaustive list of these problems include: a) identification of minor phases (less than 2 wt.%) [5–7] b) identification of hydrated phases, c) characterization of the extent of solid solutions in major phases [8–10], d) knowledge of the influence of different absorption coefficients on quantitative results, e) deviations due to preferential orientation etc. In the normal practice in industry or research, a conventional Bragg–Brentano X-ray powder diffractometer is likely to be used for routine identification and quantification work. These instru- ments, even if they are improving their performances, have in- herent limitations due mainly to their source emission profile and limited intensity [11]. As a consequence, for multiphase samples, severe overlapping of diffracting peaks may introduce strong correlations between crystal to crystal and crystal to instrument Cement and Concrete Research 36 (2006) 2021 – 2032 ⁎ Corresponding author. Tel.: +34 977 55 97 83; fax: +34 977 55 82 61. E-mail address: [email protected] (F. Guirado). 0008-8846/$ - see front matter © 2006 Elsevier Ltd. All rights reserved. doi:10.1016/j.cemconres.2006.05.019
Transcript of Quantitative Rietveld analysis of CAC clinker phases using ...
6 (2006) 2021–2032
Cement and Concrete Research 3Quantitative Rietveld analysis of CAC clinker phasesusing synchrotron radiation
F. Guirado a,⁎, S. Galí b
a Servei de Recursos Científics i Tècnics, Univ. Rovira i Virgili, Campus Sescelades, Tarragona, Catalonia 43005, Spainb Dep. Cristal·lografia, Univ. Barcelona, Martí i Franquès sn, Barcelona, Catalonia 08028, Spain
Received 3 May 2005; accepted 29 May 2006
Abstract
The quantitative Rietveld analyses of twenty samples of CAC from four different manufacturers over the world, one synthetic mixture and aNIST standard were performed using synchrotron radiation. As compared with conventional XRD, synchrotron powder diffraction permitted tofind new minor phases, improve the characterization of solid solutions of iron rich CAC phases and reduce preferential orientation andmicroabsorption effects. Diffraction data were complemented with XRF and TG/DT analyses. Synchrotron results were used as a reference test toimprove the performance of conventional powder diffraction, by an accurate selection of refinable profile and structural parameters, and permittedto extract several recommendations for conventional quantitative Rietveld procedures. It is shown that with these recommendations in mind,conventional XRD based Rietveld analyses are comparable to those obtained from synchrotron data. In summary, quantitative XRD Rietveldanalysis is confirmed as an excellent tool for the CAC cement industry.© 2006 Elsevier Ltd. All rights reserved.
Keywords: Synchrotron diffraction; X-ray diffraction; Quantitative Rietveld analysis; Calcium aluminate cement
1. Introduction
Standardless Rietveld quantitative analysis of clinker phasesis becoming a straightforward reliable tool for quality control incement industry. In recent years several important papers onRietveld analysis of both, Portland [1,2] and calcium aluminate(CAC) cements [3,4] have been published, drawing the attentionon the potential advantages of the method, as compared withother traditional quantitative methods of the cement industry.
The quantitative Rietveld method is based on two premises:one is the accurate knowledge of the crystal structures of thephases present, and the other regards all the instrumental factorsinvolved in the obtention of the diffraction profile. The knowl-edge of the structural variations expected in clinker phases al-lows a wise selection of the crystallographic parameters that canbe introduced in the fitting model. On the other hand, the ac-curate calibration of the diffractometer permits to minimize theinstrument dependent parameters used, avoiding misleading
⁎ Corresponding author. Tel.: +34 977 55 97 83; fax: +34 977 55 82 61.E-mail address: [email protected] (F. Guirado).
0008-8846/$ - see front matter © 2006 Elsevier Ltd. All rights reserved.doi:10.1016/j.cemconres.2006.05.019
correlations between structural and instrumental parameters, thatmay introduce bias in the quantification of phases.
Since the cement is produced from natural or recycled rawmaterials with variable composition, the clinker produced resultsin a complex variable multiphase–multicomponent system. Thefull characterization of this system from a single powder diffrac-tion profile requires the previous solution of several importantproblems. For CAC, a non-exhaustive list of these problemsinclude: a) identification of minor phases (less than 2 wt.%) [5–7]b) identification of hydrated phases, c) characterization of theextent of solid solutions in major phases [8–10], d) knowledge ofthe influence of different absorption coefficients on quantitativeresults, e) deviations due to preferential orientation etc.
In the normal practice in industry or research, a conventionalBragg–Brentano X-ray powder diffractometer is likely to be usedfor routine identification and quantification work. These instru-ments, even if they are improving their performances, have in-herent limitations due mainly to their source emission profile andlimited intensity [11]. As a consequence, for multiphase samples,severe overlapping of diffracting peaks may introduce strongcorrelations between crystal to crystal and crystal to instrument
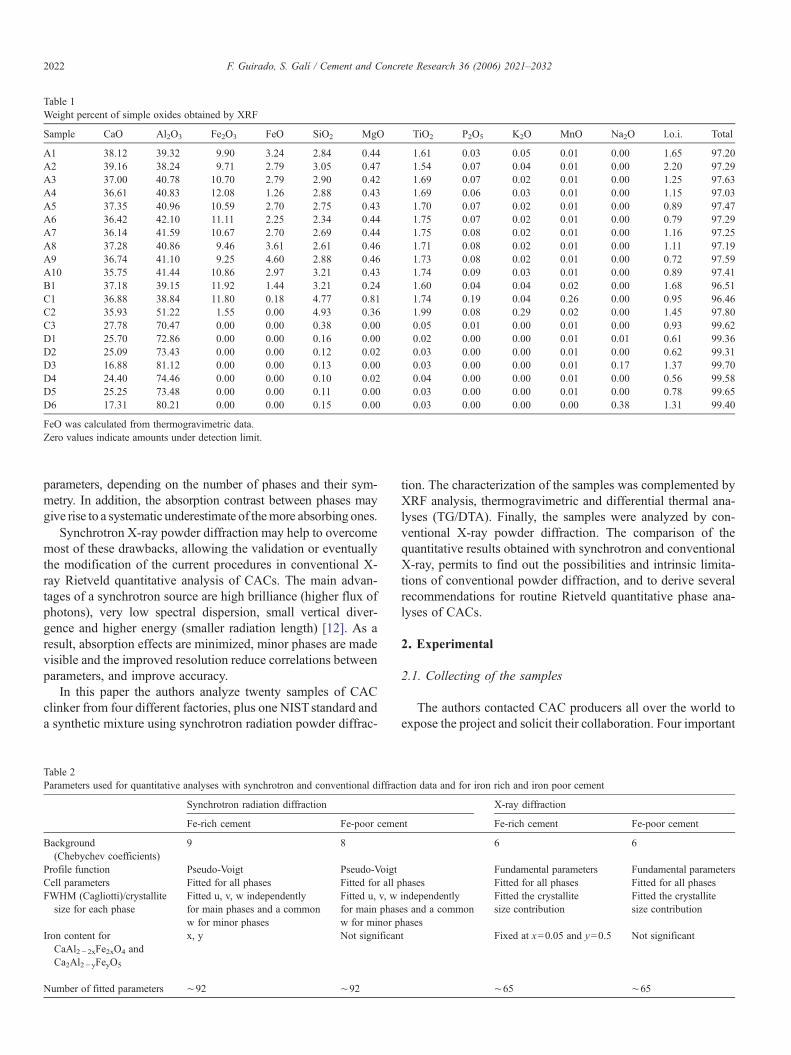
Table 1Weight percent of simple oxides obtained by XRF
Sample CaO Al2O3 Fe2O3 FeO SiO2 MgO TiO2 P2O5 K2O MnO Na2O l.o.i. Total
A1 38.12 39.32 9.90 3.24 2.84 0.44 1.61 0.03 0.05 0.01 0.00 1.65 97.20A2 39.16 38.24 9.71 2.79 3.05 0.47 1.54 0.07 0.04 0.01 0.00 2.20 97.29A3 37.00 40.78 10.70 2.79 2.90 0.42 1.69 0.07 0.02 0.01 0.00 1.25 97.63A4 36.61 40.83 12.08 1.26 2.88 0.43 1.69 0.06 0.03 0.01 0.00 1.15 97.03A5 37.35 40.96 10.59 2.70 2.75 0.43 1.70 0.07 0.02 0.01 0.00 0.89 97.47A6 36.42 42.10 11.11 2.25 2.34 0.44 1.75 0.07 0.02 0.01 0.00 0.79 97.29A7 36.14 41.59 10.67 2.70 2.69 0.44 1.75 0.08 0.02 0.01 0.00 1.16 97.25A8 37.28 40.86 9.46 3.61 2.61 0.46 1.71 0.08 0.02 0.01 0.00 1.11 97.19A9 36.74 41.10 9.25 4.60 2.88 0.46 1.73 0.08 0.02 0.01 0.00 0.72 97.59A10 35.75 41.44 10.86 2.97 3.21 0.43 1.74 0.09 0.03 0.01 0.00 0.89 97.41B1 37.18 39.15 11.92 1.44 3.21 0.24 1.60 0.04 0.04 0.02 0.00 1.68 96.51C1 36.88 38.84 11.80 0.18 4.77 0.81 1.74 0.19 0.04 0.26 0.00 0.95 96.46C2 35.93 51.22 1.55 0.00 4.93 0.36 1.99 0.08 0.29 0.02 0.00 1.45 97.80C3 27.78 70.47 0.00 0.00 0.38 0.00 0.05 0.01 0.00 0.01 0.00 0.93 99.62D1 25.70 72.86 0.00 0.00 0.16 0.00 0.02 0.00 0.00 0.01 0.01 0.61 99.36D2 25.09 73.43 0.00 0.00 0.12 0.02 0.03 0.00 0.00 0.01 0.00 0.62 99.31D3 16.88 81.12 0.00 0.00 0.13 0.00 0.03 0.00 0.00 0.01 0.17 1.37 99.70D4 24.40 74.46 0.00 0.00 0.10 0.02 0.04 0.00 0.00 0.01 0.00 0.56 99.58D5 25.25 73.48 0.00 0.00 0.11 0.00 0.03 0.00 0.00 0.01 0.00 0.78 99.65D6 17.31 80.21 0.00 0.00 0.15 0.00 0.03 0.00 0.00 0.00 0.38 1.31 99.40
FeO was calculated from thermogravimetric data.Zero values indicate amounts under detection limit.
2022 F. Guirado, S. Galí / Cement and Concrete Research 36 (2006) 2021–2032
parameters, depending on the number of phases and their sym-metry. In addition, the absorption contrast between phases maygive rise to a systematic underestimate of themore absorbing ones.
Synchrotron X-ray powder diffraction may help to overcomemost of these drawbacks, allowing the validation or eventuallythe modification of the current procedures in conventional X-ray Rietveld quantitative analysis of CACs. The main advan-tages of a synchrotron source are high brilliance (higher flux ofphotons), very low spectral dispersion, small vertical diver-gence and higher energy (smaller radiation length) [12]. As aresult, absorption effects are minimized, minor phases are madevisible and the improved resolution reduce correlations betweenparameters, and improve accuracy.
In this paper the authors analyze twenty samples of CACclinker from four different factories, plus one NIST standard anda synthetic mixture using synchrotron radiation powder diffrac-
Table 2Parameters used for quantitative analyses with synchrotron and conventional diffrac
Synchrotron radiation diffraction
Fe-rich cement Fe-poor ceme
Background(Chebychev coefficients)
9 8
Profile function Pseudo-Voigt Pseudo-VoigtCell parameters Fitted for all phases Fitted for all pFWHM (Cagliotti)/crystallitesize for each phase
Fitted u, v, w independentlyfor main phases and a commonw for minor phases
Fitted u, v, wfor main phasw for minor p
Iron content forCaAl2− 2xFe2xO4 andCa2Al2− yFeyO5
x, y Not significan
Number of fitted parameters ∼92 ∼92
tion. The characterization of the samples was complemented byXRF analysis, thermogravimetric and differential thermal ana-lyses (TG/DTA). Finally, the samples were analyzed by con-ventional X-ray powder diffraction. The comparison of thequantitative results obtained with synchrotron and conventionalX-ray, permits to find out the possibilities and intrinsic limita-tions of conventional powder diffraction, and to derive severalrecommendations for routine Rietveld quantitative phase ana-lyses of CACs.
2. Experimental
2.1. Collecting of the samples
The authors contacted CAC producers all over the world toexpose the project and solicit their collaboration. Four important
tion data and for iron rich and iron poor cement
X-ray diffraction
nt Fe-rich cement Fe-poor cement
6 6
Fundamental parameters Fundamental parametershases Fitted for all phases Fitted for all phasesindependentlyes and a commonhases
Fitted the crystallitesize contribution
Fitted the crystallitesize contribution
t Fixed at x=0.05 and y=0.5 Not significant
∼65 ∼65
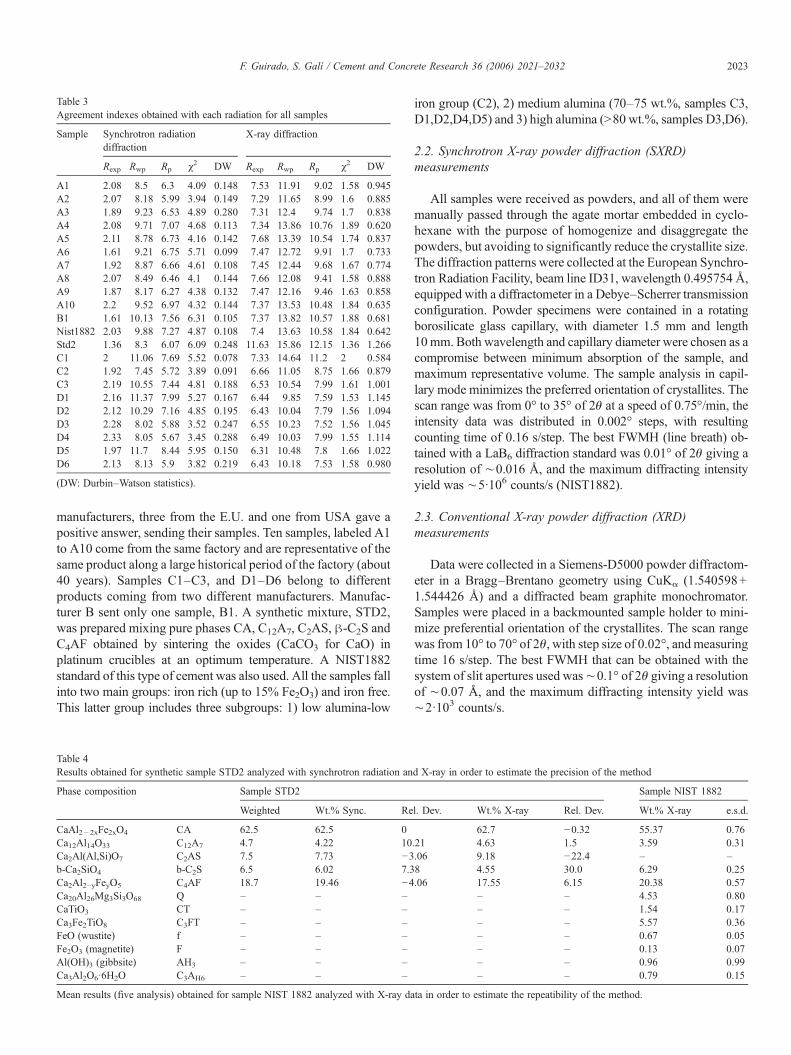
Table 3Agreement indexes obtained with each radiation for all samples
Sample Synchrotron radiationdiffraction
X-ray diffraction
Rexp Rwp Rp χ2 DW Rexp Rwp Rp χ2 DW
A1 2.08 8.5 6.3 4.09 0.148 7.53 11.91 9.02 1.58 0.945A2 2.07 8.18 5.99 3.94 0.149 7.29 11.65 8.99 1.6 0.885A3 1.89 9.23 6.53 4.89 0.280 7.31 12.4 9.74 1.7 0.838A4 2.08 9.71 7.07 4.68 0.113 7.34 13.86 10.76 1.89 0.620A5 2.11 8.78 6.73 4.16 0.142 7.68 13.39 10.54 1.74 0.837A6 1.61 9.21 6.75 5.71 0.099 7.47 12.72 9.91 1.7 0.733A7 1.92 8.87 6.66 4.61 0.108 7.45 12.44 9.68 1.67 0.774A8 2.07 8.49 6.46 4.1 0.144 7.66 12.08 9.41 1.58 0.888A9 1.87 8.17 6.27 4.38 0.132 7.47 12.16 9.46 1.63 0.858A10 2.2 9.52 6.97 4.32 0.144 7.37 13.53 10.48 1.84 0.635B1 1.61 10.13 7.56 6.31 0.105 7.37 13.82 10.57 1.88 0.681Nist1882 2.03 9.88 7.27 4.87 0.108 7.4 13.63 10.58 1.84 0.642Std2 1.36 8.3 6.07 6.09 0.248 11.63 15.86 12.15 1.36 1.266C1 2 11.06 7.69 5.52 0.078 7.33 14.64 11.2 2 0.584C2 1.92 7.45 5.72 3.89 0.091 6.66 11.05 8.75 1.66 0.879C3 2.19 10.55 7.44 4.81 0.188 6.53 10.54 7.99 1.61 1.001D1 2.16 11.37 7.99 5.27 0.167 6.44 9.85 7.59 1.53 1.145D2 2.12 10.29 7.16 4.85 0.195 6.43 10.04 7.79 1.56 1.094D3 2.28 8.02 5.88 3.52 0.247 6.55 10.23 7.52 1.56 1.045D4 2.33 8.05 5.67 3.45 0.288 6.49 10.03 7.99 1.55 1.114D5 1.97 11.7 8.44 5.95 0.150 6.31 10.48 7.8 1.66 1.022D6 2.13 8.13 5.9 3.82 0.219 6.43 10.18 7.53 1.58 0.980
(DW: Durbin–Watson statistics).
2023F. Guirado, S. Galí / Cement and Concrete Research 36 (2006) 2021–2032
manufacturers, three from the E.U. and one from USA gave apositive answer, sending their samples. Ten samples, labeled A1to A10 come from the same factory and are representative of thesame product along a large historical period of the factory (about40 years). Samples C1–C3, and D1–D6 belong to differentproducts coming from two different manufacturers. Manufac-turer B sent only one sample, B1. A synthetic mixture, STD2,was prepared mixing pure phases CA, C12A7, C2AS, β-C2S andC4AF obtained by sintering the oxides (CaCO3 for CaO) inplatinum crucibles at an optimum temperature. A NIST1882standard of this type of cement was also used. All the samples fallinto two main groups: iron rich (up to 15% Fe2O3) and iron free.This latter group includes three subgroups: 1) low alumina-low
Table 4Results obtained for synthetic sample STD2 analyzed with synchrotron radiation an
Phase composition Sample STD2
Weighted Wt.% Sync. Re
CaAl2− 2xFe2xO4 CA 62.5 62.5 0Ca12Al14O33 C12A7 4.7 4.22 10Ca2Al(Al,Si)O7 C2AS 7.5 7.73 −3b-Ca2SiO4 b-C2S 6.5 6.02 7.3Ca2Al2−yFeyO5 C4AF 18.7 19.46 −4Ca20Al26Mg3Si3O68 Q – – –CaTiO3 CT – – –Ca3Fe2TiO8 C3FT – – –FeO (wustite) f – – –Fe2O3 (magnetite) F – – –Al(OH)3 (gibbsite) AH3 – – –Ca3Al2O6·6H2O C3AH6 – – –
Mean results (five analysis) obtained for sample NIST 1882 analyzed with X-ray da
iron group (C2), 2) medium alumina (70–75 wt.%, samples C3,D1,D2,D4,D5) and 3) high alumina (>80 wt.%, samples D3,D6).
2.2. Synchrotron X-ray powder diffraction (SXRD)measurements
All samples were received as powders, and all of them weremanually passed through the agate mortar embedded in cyclo-hexane with the purpose of homogenize and disaggregate thepowders, but avoiding to significantly reduce the crystallite size.The diffraction patterns were collected at the European Synchro-tron Radiation Facility, beam line ID31, wavelength 0.495754 Å,equipped with a diffractometer in a Debye–Scherrer transmissionconfiguration. Powder specimens were contained in a rotatingborosilicate glass capillary, with diameter 1.5 mm and length10mm. Both wavelength and capillary diameter were chosen as acompromise between minimum absorption of the sample, andmaximum representative volume. The sample analysis in capil-lary mode minimizes the preferred orientation of crystallites. Thescan range was from 0° to 35° of 2θ at a speed of 0.75°/min, theintensity data was distributed in 0.002° steps, with resultingcounting time of 0.16 s/step. The best FWMH (line breath) ob-tained with a LaB6 diffraction standard was 0.01° of 2θ giving aresolution of ∼0.016 Å, and the maximum diffracting intensityyield was ∼5·106 counts/s (NIST1882).
2.3. Conventional X-ray powder diffraction (XRD)measurements
Data were collected in a Siemens-D5000 powder diffractom-eter in a Bragg–Brentano geometry using CuKα (1.540598+1.544426 Å) and a diffracted beam graphite monochromator.Samples were placed in a backmounted sample holder to mini-mize preferential orientation of the crystallites. The scan rangewas from 10° to 70° of 2θ, with step size of 0.02°, andmeasuringtime 16 s/step. The best FWMH that can be obtained with thesystem of slit apertures used was∼0.1° of 2θ giving a resolutionof ∼0.07 Å, and the maximum diffracting intensity yield was∼2·103 counts/s.
d X-ray in order to estimate the precision of the method
Sample NIST 1882
l. Dev. Wt.% X-ray Rel. Dev. Wt.% X-ray e.s.d.
62.7 −0.32 55.37 0.76.21 4.63 1.5 3.59 0.31.06 9.18 −22.4 – –8 4.55 30.0 6.29 0.25.06 17.55 6.15 20.38 0.57
– – 4.53 0.80– – 1.54 0.17– – 5.57 0.36– – 0.67 0.05– – 0.13 0.07– – 0.96 0.99– – 0.79 0.15
ta in order to estimate the repeatibility of the method.
2024 F. Guirado, S. Galí / Cement and Concrete Research 36 (2006) 2021–2032
2.4. TG/DTA and chemical analyses
All the samples, except for the synthetic standard andNIST1882, were analyzed by X ray fluorescence (XRF). A0.3 g portion of each sample was weighted and mixed with 5.7 gof Li2B4O7 to obtain a 1/20 dilution. The homogenized mixturewas transferred to a Pt crucible and melted to 1100 °C in a highfrequency induction furnace. This method oxidizes all Fe toFe2O3. Analyses were performed in a Philips 2400 X-ray spec-
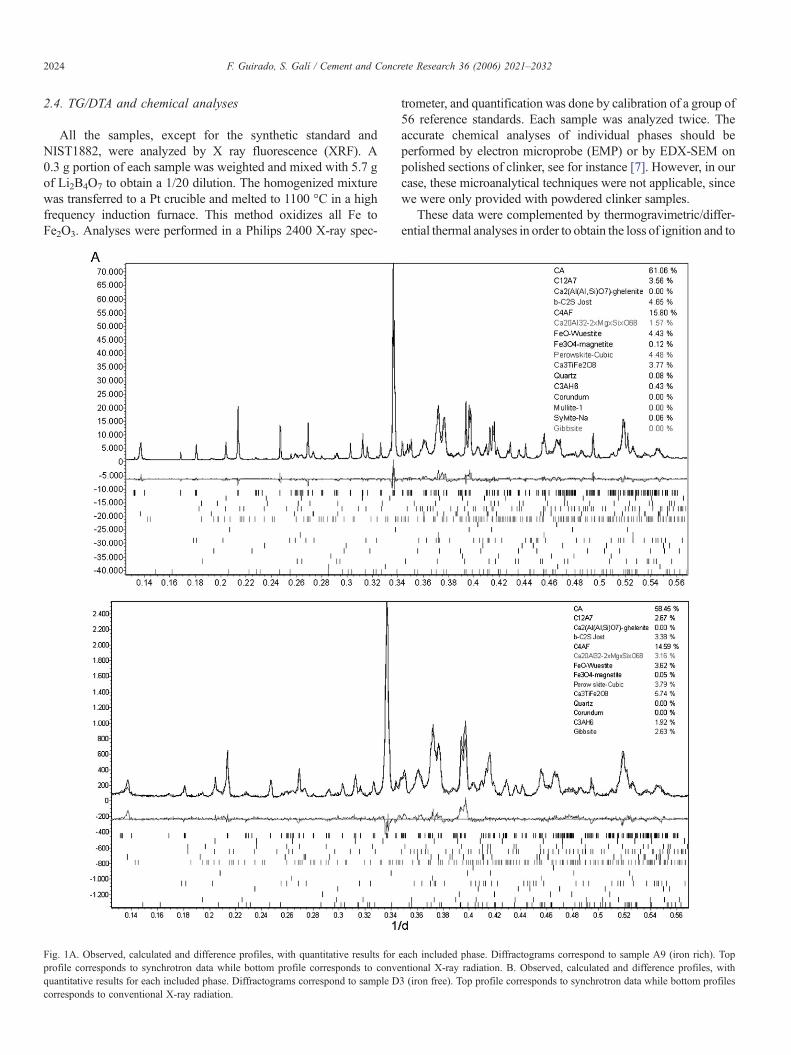
Fig. 1A. Observed, calculated and difference profiles, with quantitative results forprofile corresponds to synchrotron data while bottom profile corresponds to convequantitative results for each included phase. Diffractograms correspond to sample Dcorresponds to conventional X-ray radiation.
trometer, and quantification was done by calibration of a group of56 reference standards. Each sample was analyzed twice. Theaccurate chemical analyses of individual phases should beperformed by electron microprobe (EMP) or by EDX-SEM onpolished sections of clinker, see for instance [7]. However, in ourcase, these microanalytical techniques were not applicable, sincewe were only provided with powdered clinker samples.
These data were complemented by thermogravimetric/differ-ential thermal analyses in order to obtain the loss of ignition and to
each included phase. Diffractograms correspond to sample A9 (iron rich). Topntional X-ray radiation. B. Observed, calculated and difference profiles, with3 (iron free). Top profile corresponds to synchrotron data while bottom profiles
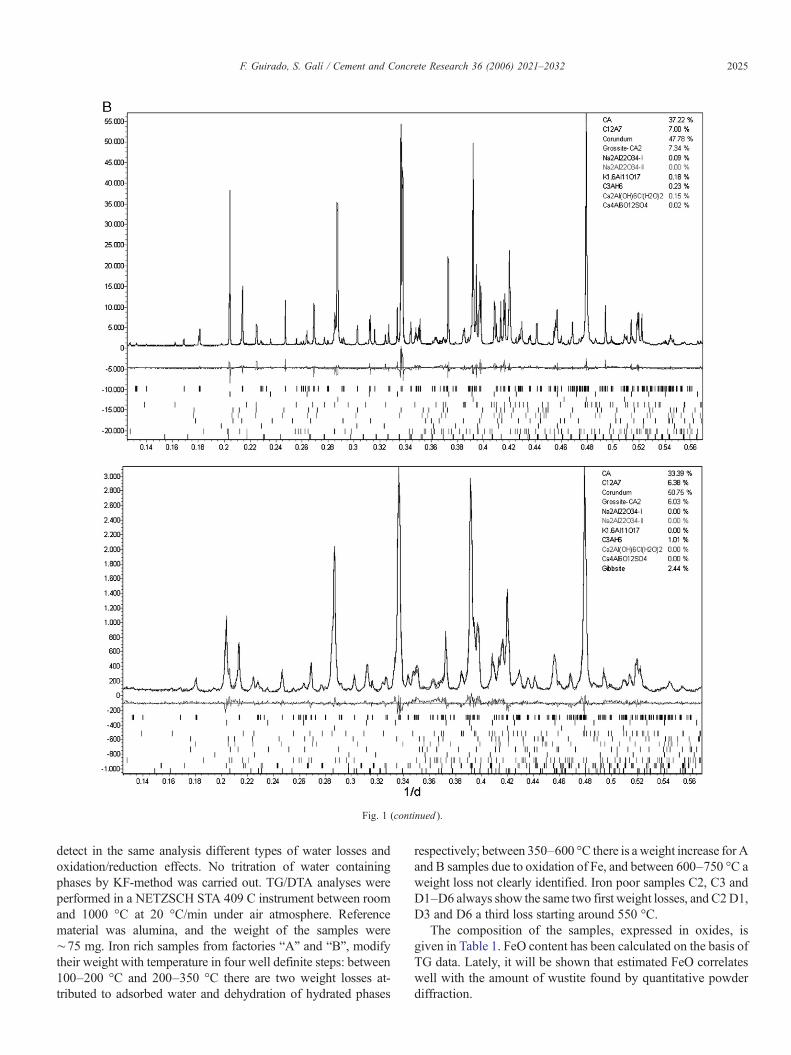
Fig. 1 (continued ).
2025F. Guirado, S. Galí / Cement and Concrete Research 36 (2006) 2021–2032
detect in the same analysis different types of water losses andoxidation/reduction effects. No tritration of water containingphases by KF-method was carried out. TG/DTA analyses wereperformed in a NETZSCH STA 409 C instrument between roomand 1000 °C at 20 °C/min under air atmosphere. Referencematerial was alumina, and the weight of the samples were∼75 mg. Iron rich samples from factories “A” and “B”, modifytheir weight with temperature in four well definite steps: between100–200 °C and 200–350 °C there are two weight losses at-tributed to adsorbed water and dehydration of hydrated phases
respectively; between 350–600 °C there is a weight increase for Aand B samples due to oxidation of Fe, and between 600–750 °C aweight loss not clearly identified. Iron poor samples C2, C3 andD1–D6 always show the same two first weight losses, and C2D1,D3 and D6 a third loss starting around 550 °C.
The composition of the samples, expressed in oxides, isgiven in Table 1. FeO content has been calculated on the basis ofTG data. Lately, it will be shown that estimated FeO correlateswell with the amount of wustite found by quantitative powderdiffraction.
2026 F. Guirado, S. Galí / Cement and Concrete Research 36 (2006) 2021–2032
3. Results
3.1. Outline of the refinement procedure
Both synchrotron and conventional X-ray profiles were fittedusing the computer program TOPAS 2.1 [13]. This programimplements a wide variety of instrumental, profile and structuralparameters and a robust convergence procedure, allowing aquick fit of complex multiphase crystalline systems. In spite ofthese advantages, there is some risk of fitting well (i.e. goodagreement indexes) the experimental profile with a selection ofunreliable parameters. The risk is higher for minor phases (lessthan ∼3%), when high correlations between different para-meters may occur. To save this drawback, the user is obliged toan accurate selection of the significant refined parameters, toavoid spurious correlations between parameters that can lead tobiased quantitative results.
With X-ray data the so-called “fundamental parametersapproach” [14] was used, with the obvious advantage of eli-minating correlations between instrumental and sample pluscrystallographic parameters. This approach takes the geomet-rical description of the diffractometer to calculate the instru-mental contribution to diffracted profile. Consequently, only thesample contribution to profile is taken into account and refined(crystallite size and strain for each phase). Nevertheless, to fitthe synchrotron data a classical pseudo-Voigt profile functionand the FWHM description of Cagliotti [15] was used, because
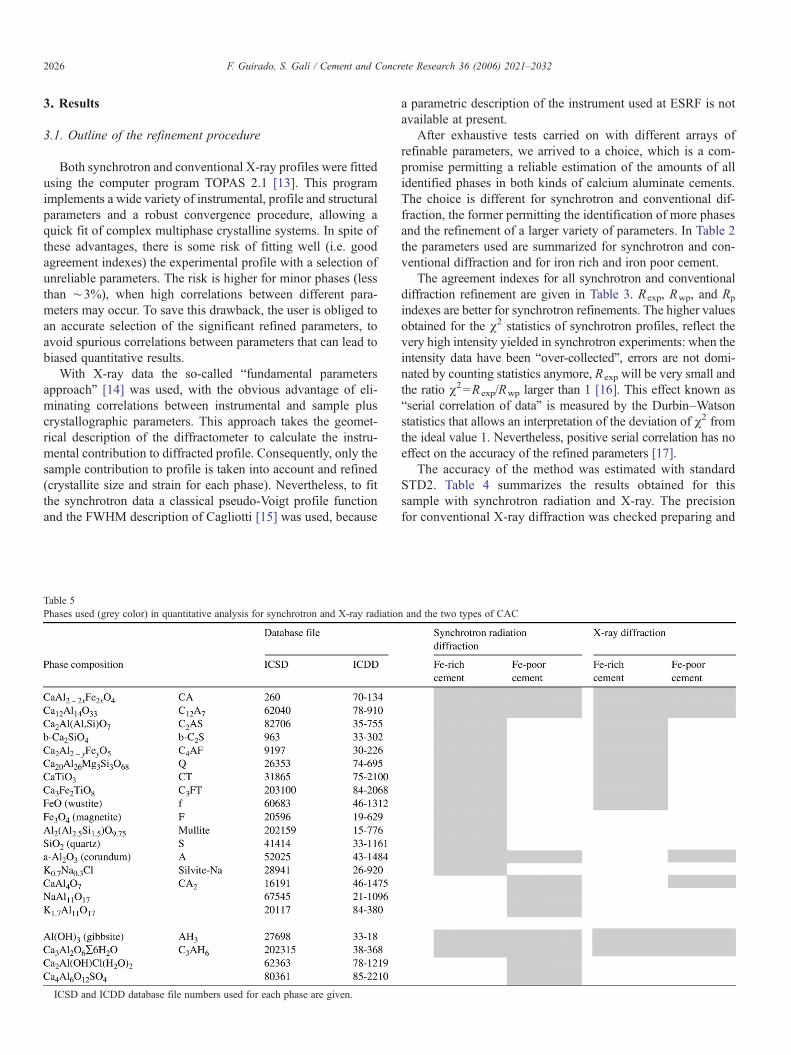
Table 5Phases used (grey color) in quantitative analysis for synchrotron and X-ray radiatio
ICSD and ICDD database file numbers used for each phase are given.
a parametric description of the instrument used at ESRF is notavailable at present.
After exhaustive tests carried on with different arrays ofrefinable parameters, we arrived to a choice, which is a com-promise permitting a reliable estimation of the amounts of allidentified phases in both kinds of calcium aluminate cements.The choice is different for synchrotron and conventional dif-fraction, the former permitting the identification of more phasesand the refinement of a larger variety of parameters. In Table 2the parameters used are summarized for synchrotron and con-ventional diffraction and for iron rich and iron poor cement.
The agreement indexes for all synchrotron and conventionaldiffraction refinement are given in Table 3. Rexp, Rwp, and Rp
indexes are better for synchrotron refinements. The higher valuesobtained for the χ2 statistics of synchrotron profiles, reflect thevery high intensity yielded in synchrotron experiments: when theintensity data have been “over-collected”, errors are not domi-nated by counting statistics anymore, Rexp will be very small andthe ratio χ2=Rexp/Rwp larger than 1 [16]. This effect known as“serial correlation of data” is measured by the Durbin–Watsonstatistics that allows an interpretation of the deviation of χ2 fromthe ideal value 1. Nevertheless, positive serial correlation has noeffect on the accuracy of the refined parameters [17].
The accuracy of the method was estimated with standardSTD2. Table 4 summarizes the results obtained for thissample with synchrotron radiation and X-ray. The precisionfor conventional X-ray diffraction was checked preparing and
n and the two types of CAC
2027F. Guirado, S. Galí / Cement and Concrete Research 36 (2006) 2021–2032
analyzing five times the standard NIST 1882 (Table 4). InFig. 1A and B selected examples of Rietveld refinementplots of synchrotron and conventional diffraction profiles aredepicted.
3.2. Identification of “new” phases
The higher resolution and intensity of synchrotron data makesvisible several phases that are not seen by conventional diffrac-tion.Minor phaseswere identified by isolated peaks that appearedin synchroton data. Both diffraction peaks and mineralogicalcompatibility were the basis for accepting the occurrence of suchminor phases. These discovered phases are only apparent by oneor two small diffracting maxima, but introducing them in therefinement procedure improves the final agreement indexes.Suspected minor phases that were not represented by isolatednon-overlapped peaks were not included in the refinement.
New phases may include minor oxides like magnetite, α-alumina, quartz, sodium or potassium chlorides coming fromthe production process itself and cement hydrated phasesformed by contact of the clinker with the atmospheric moisture.
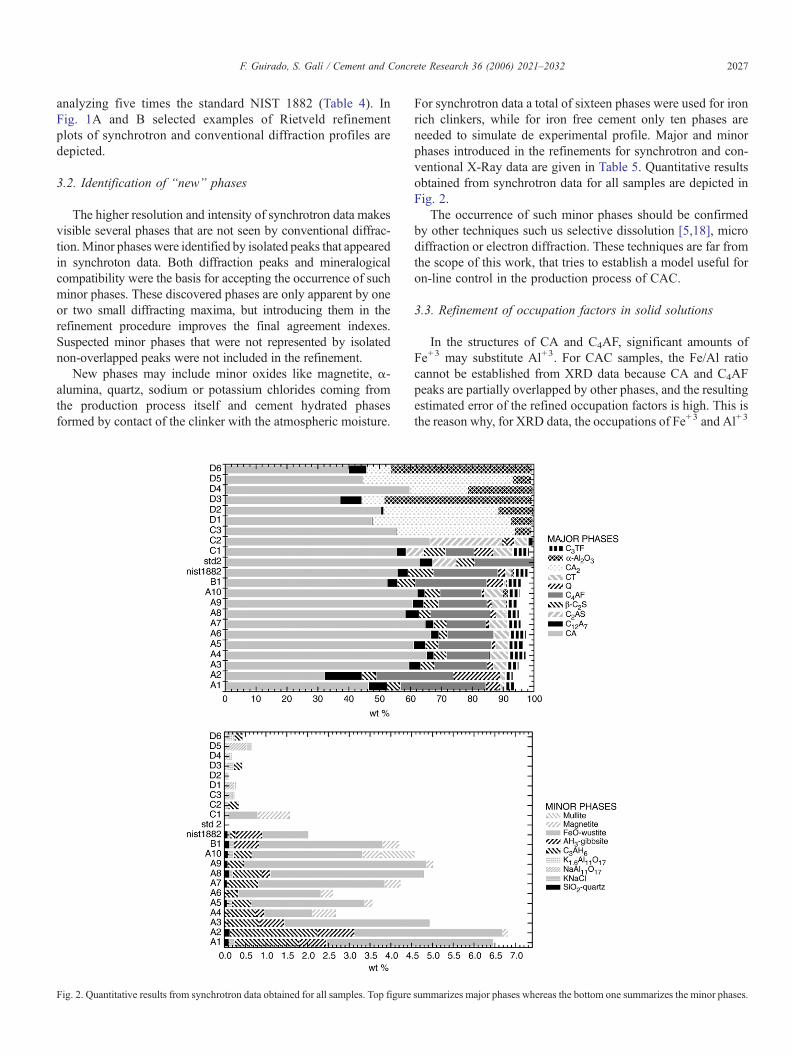
Fig. 2. Quantitative results from synchrotron data obtained for all samples. Top figure
For synchrotron data a total of sixteen phases were used for ironrich clinkers, while for iron free cement only ten phases areneeded to simulate de experimental profile. Major and minorphases introduced in the refinements for synchrotron and con-ventional X-Ray data are given in Table 5. Quantitative resultsobtained from synchrotron data for all samples are depicted inFig. 2.
The occurrence of such minor phases should be confirmedby other techniques such us selective dissolution [5,18], microdiffraction or electron diffraction. These techniques are far fromthe scope of this work, that tries to establish a model useful foron-line control in the production process of CAC.
3.3. Refinement of occupation factors in solid solutions
In the structures of CA and C4AF, significant amounts ofFe+3 may substitute Al+3. For CAC samples, the Fe/Al ratiocannot be established from XRD data because CA and C4AFpeaks are partially overlapped by other phases, and the resultingestimated error of the refined occupation factors is high. This isthe reason why, for XRD data, the occupations of Fe+3 and Al+3
summarizes major phases whereas the bottom one summarizes the minor phases.
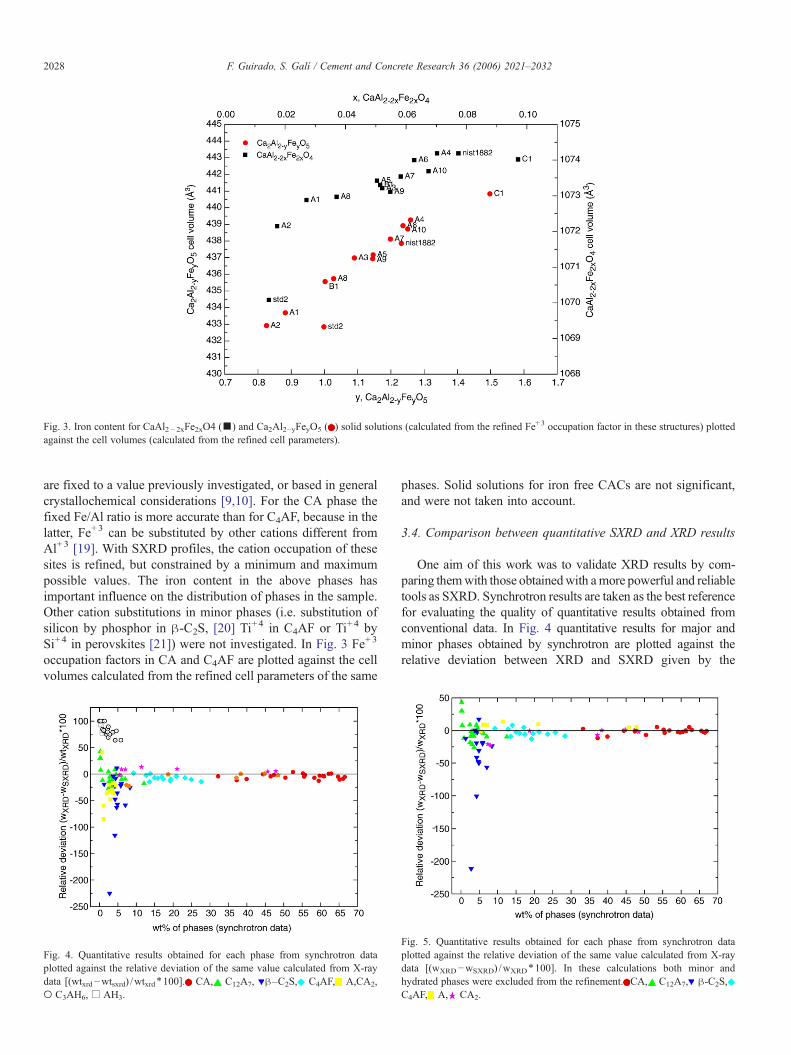
Fig. 3. Iron content for CaAl2− 2xFe2xO4 (▪) and Ca2Al2−yFeyO5 ( ) solid solutions (calculated from the refined Fe+3 occupation factor in these structures) plottedagainst the cell volumes (calculated from the refined cell parameters).
2028 F. Guirado, S. Galí / Cement and Concrete Research 36 (2006) 2021–2032
are fixed to a value previously investigated, or based in generalcrystallochemical considerations [9,10]. For the CA phase thefixed Fe/Al ratio is more accurate than for C4AF, because in thelatter, Fe+3 can be substituted by other cations different fromAl+3 [19]. With SXRD profiles, the cation occupation of thesesites is refined, but constrained by a minimum and maximumpossible values. The iron content in the above phases hasimportant influence on the distribution of phases in the sample.Other cation substitutions in minor phases (i.e. substitution ofsilicon by phosphor in β-C2S, [20] Ti
+4 in C4AF or Ti+4 bySi+4 in perovskites [21]) were not investigated. In Fig. 3 Fe+3
occupation factors in CA and C4AF are plotted against the cellvolumes calculated from the refined cell parameters of the same
Fig. 4. Quantitative results obtained for each phase from synchrotron dataplotted against the relative deviation of the same value calculated from X-raydata [(wtxrd−wtsxrd) /wtxrd⁎100]. CA, C12A7, β–C2S, C4AF, A,CA2,○ C3AH6, □ AH3.
phases. Solid solutions for iron free CACs are not significant,and were not taken into account.
3.4. Comparison between quantitative SXRD and XRD results
One aim of this work was to validate XRD results by com-paring themwith those obtainedwith amore powerful and reliabletools as SXRD. Synchrotron results are taken as the best referencefor evaluating the quality of quantitative results obtained fromconventional data. In Fig. 4 quantitative results for major andminor phases obtained by synchrotron are plotted against therelative deviation between XRD and SXRD given by the
Fig. 5. Quantitative results obtained for each phase from synchrotron dataplotted against the relative deviation of the same value calculated from X-raydata [(wXRD−wSXRD) /wXRD
⁎100]. In these calculations both minor andhydrated phases were excluded from the refinement. CA, C12A7, β-C2S,C4AF, A, CA2.
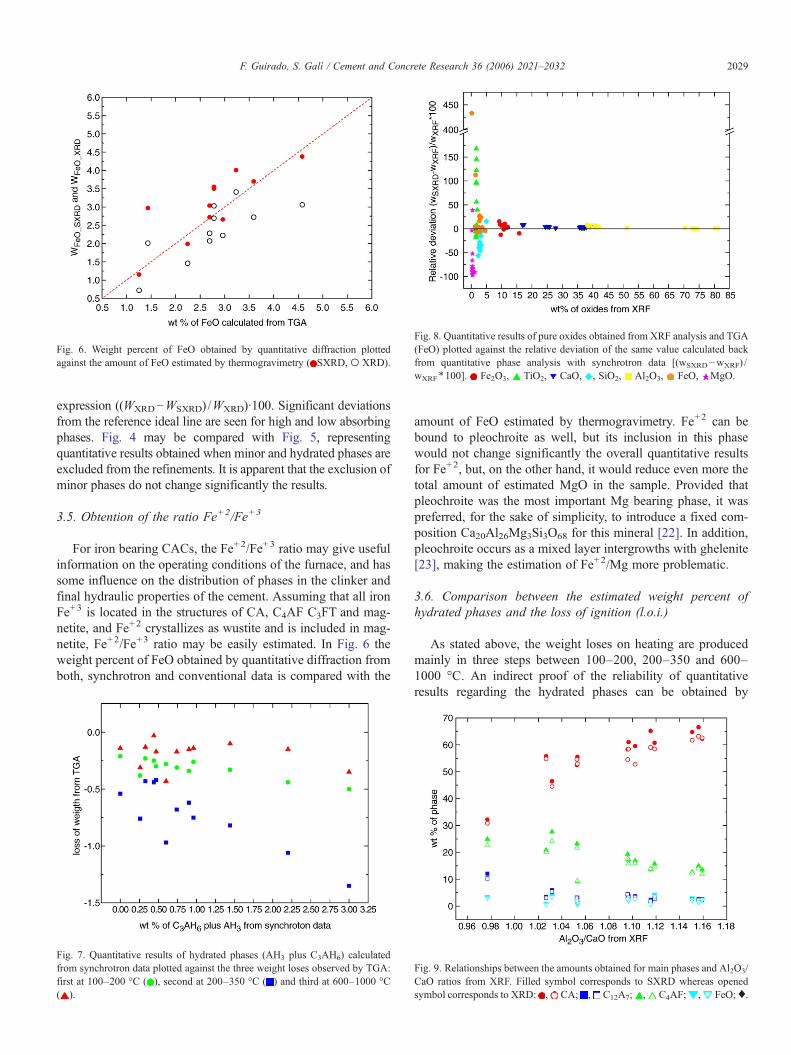
Fig. 6. Weight percent of FeO obtained by quantitative diffraction plottedagainst the amount of FeO estimated by thermogravimetry ( SXRD, ○ XRD).
Fig. 8. Quantitative results of pure oxides obtained from XRF analysis and TGA(FeO) plotted against the relative deviation of the same value calculated backfrom quantitative phase analysis with synchrotron data [(wSXRD−wXRF) /wXRF
⁎100]. Fe2O3, TiO2, CaO, , SiO2, Al2O3, FeO, MgO.
2029F. Guirado, S. Galí / Cement and Concrete Research 36 (2006) 2021–2032
expression ((WXRD−WSXRD) /WXRD)·100. Significant deviationsfrom the reference ideal line are seen for high and low absorbingphases. Fig. 4 may be compared with Fig. 5, representingquantitative results obtained when minor and hydrated phases areexcluded from the refinements. It is apparent that the exclusion ofminor phases do not change significantly the results.
3.5. Obtention of the ratio Fe+2/Fe+3
For iron bearing CACs, the Fe+2/Fe+3 ratio may give usefulinformation on the operating conditions of the furnace, and hassome influence on the distribution of phases in the clinker andfinal hydraulic properties of the cement. Assuming that all ironFe+3 is located in the structures of CA, C4AF C3FT and mag-netite, and Fe+2 crystallizes as wustite and is included in mag-netite, Fe+2/Fe+3 ratio may be easily estimated. In Fig. 6 theweight percent of FeO obtained by quantitative diffraction fromboth, synchrotron and conventional data is compared with the
Fig. 7. Quantitative results of hydrated phases (AH3 plus C3AH6) calculatedfrom synchrotron data plotted against the three weight loses observed by TGA:first at 100–200 °C ( ), second at 200–350 °C ( ) and third at 600–1000 °C( ).
amount of FeO estimated by thermogravimetry. Fe+2 can bebound to pleochroite as well, but its inclusion in this phasewould not change significantly the overall quantitative resultsfor Fe+2, but, on the other hand, it would reduce even more thetotal amount of estimated MgO in the sample. Provided thatpleochroite was the most important Mg bearing phase, it waspreferred, for the sake of simplicity, to introduce a fixed com-position Ca20Al26Mg3Si3O68 for this mineral [22]. In addition,pleochroite occurs as a mixed layer intergrowths with ghelenite[23], making the estimation of Fe+2/Mg more problematic.
3.6. Comparison between the estimated weight percent ofhydrated phases and the loss of ignition (l.o.i.)
As stated above, the weight loses on heating are producedmainly in three steps between 100–200, 200–350 and 600–1000 °C. An indirect proof of the reliability of quantitativeresults regarding the hydrated phases can be obtained by
Fig. 9. Relationships between the amounts obtained for main phases and Al2O3/CaO ratios from XRF. Filled symbol corresponds to SXRD whereas openedsymbol corresponds to XRD: , CA; , C12A7; , C4AF; , FeO; ♦.
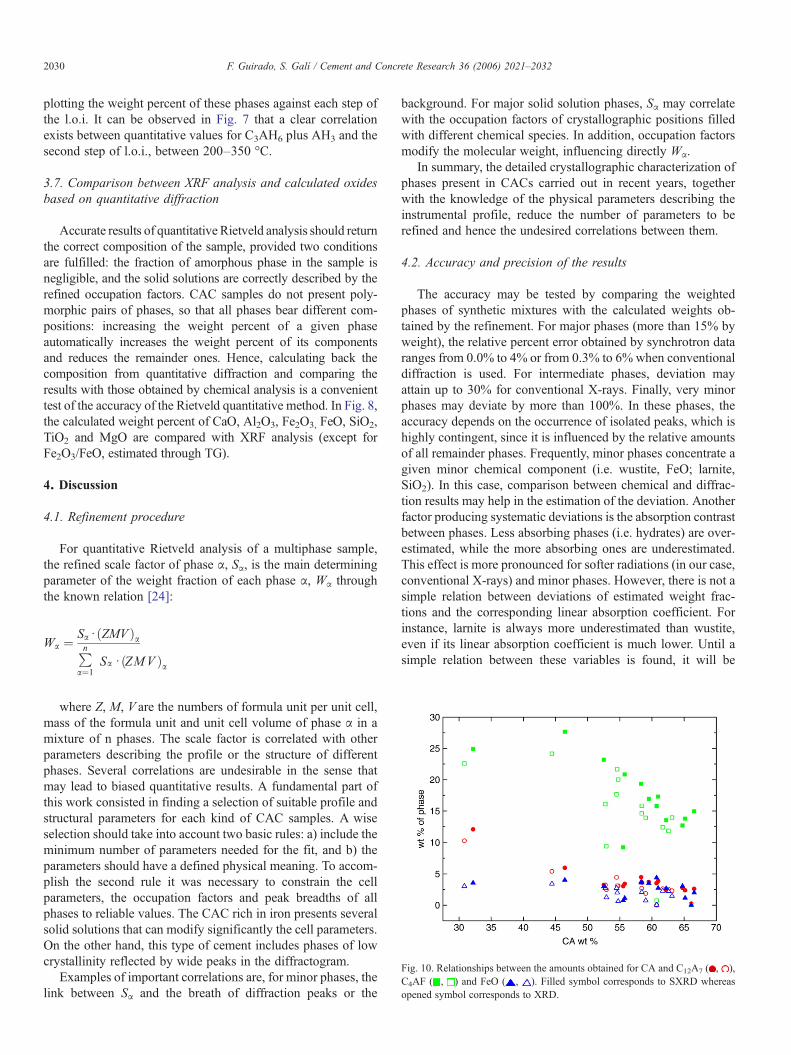
Fig. 10. Relationships between the amounts obtained for CA and C12A7 ( , ),C4AF ( , ) and FeO ( , ). Filled symbol corresponds to SXRD whereasopened symbol corresponds to XRD.
2030 F. Guirado, S. Galí / Cement and Concrete Research 36 (2006) 2021–2032
plotting the weight percent of these phases against each step ofthe l.o.i. It can be observed in Fig. 7 that a clear correlationexists between quantitative values for C3AH6 plus AH3 and thesecond step of l.o.i., between 200–350 °C.
3.7. Comparison between XRF analysis and calculated oxidesbased on quantitative diffraction
Accurate results of quantitative Rietveld analysis should returnthe correct composition of the sample, provided two conditionsare fulfilled: the fraction of amorphous phase in the sample isnegligible, and the solid solutions are correctly described by therefined occupation factors. CAC samples do not present poly-morphic pairs of phases, so that all phases bear different com-positions: increasing the weight percent of a given phaseautomatically increases the weight percent of its componentsand reduces the remainder ones. Hence, calculating back thecomposition from quantitative diffraction and comparing theresults with those obtained by chemical analysis is a convenienttest of the accuracy of the Rietveld quantitative method. In Fig. 8,the calculated weight percent of CaO, Al2O3, Fe2O3, FeO, SiO2,TiO2 and MgO are compared with XRF analysis (except forFe2O3/FeO, estimated through TG).
4. Discussion
4.1. Refinement procedure
For quantitative Rietveld analysis of a multiphase sample,the refined scale factor of phase α, Sα, is the main determiningparameter of the weight fraction of each phase α, Wα throughthe known relation [24]:
Wa ¼ Sad ðZMV ÞaPn
a¼1Sa d ðZMV Þa
where Z, M, V are the numbers of formula unit per unit cell,mass of the formula unit and unit cell volume of phase α in amixture of n phases. The scale factor is correlated with otherparameters describing the profile or the structure of differentphases. Several correlations are undesirable in the sense thatmay lead to biased quantitative results. A fundamental part ofthis work consisted in finding a selection of suitable profile andstructural parameters for each kind of CAC samples. A wiseselection should take into account two basic rules: a) include theminimum number of parameters needed for the fit, and b) theparameters should have a defined physical meaning. To accom-plish the second rule it was necessary to constrain the cellparameters, the occupation factors and peak breadths of allphases to reliable values. The CAC rich in iron presents severalsolid solutions that can modify significantly the cell parameters.On the other hand, this type of cement includes phases of lowcrystallinity reflected by wide peaks in the diffractogram.
Examples of important correlations are, for minor phases, thelink between Sα and the breath of diffraction peaks or the
background. For major solid solution phases, Sα may correlatewith the occupation factors of crystallographic positions filledwith different chemical species. In addition, occupation factorsmodify the molecular weight, influencing directly Wα.
In summary, the detailed crystallographic characterization ofphases present in CACs carried out in recent years, togetherwith the knowledge of the physical parameters describing theinstrumental profile, reduce the number of parameters to berefined and hence the undesired correlations between them.
4.2. Accuracy and precision of the results
The accuracy may be tested by comparing the weightedphases of synthetic mixtures with the calculated weights ob-tained by the refinement. For major phases (more than 15% byweight), the relative percent error obtained by synchrotron dataranges from 0.0% to 4% or from 0.3% to 6% when conventionaldiffraction is used. For intermediate phases, deviation mayattain up to 30% for conventional X-rays. Finally, very minorphases may deviate by more than 100%. In these phases, theaccuracy depends on the occurrence of isolated peaks, which ishighly contingent, since it is influenced by the relative amountsof all remainder phases. Frequently, minor phases concentrate agiven minor chemical component (i.e. wustite, FeO; larnite,SiO2). In this case, comparison between chemical and diffrac-tion results may help in the estimation of the deviation. Anotherfactor producing systematic deviations is the absorption contrastbetween phases. Less absorbing phases (i.e. hydrates) are over-estimated, while the more absorbing ones are underestimated.This effect is more pronounced for softer radiations (in our case,conventional X-rays) and minor phases. However, there is not asimple relation between deviations of estimated weight frac-tions and the corresponding linear absorption coefficient. Forinstance, larnite is always more underestimated than wustite,even if its linear absorption coefficient is much lower. Until asimple relation between these variables is found, it will be
2031F. Guirado, S. Galí / Cement and Concrete Research 36 (2006) 2021–2032
necessary to apply empirical factors, such those that can beeasily deduced from Fig. 4.
The presence of an amorphous phase in the clinker is anintrinsic limitation of the standardless Rietveld quantitativeanalyses. Diffraction maxima are only given by crystallinephases. Amorphous or non-crystalline phases are characterizedby a smooth maximum emerging from the background. Forsimple diffractograms, it is possible in principle to identify thepresence of an amorphous phase, but for complex samples, theamorphous hill is usually immersed by the multiple over-lapping of the tails of neighbouring peaks. When refining thebackground, the amorphous phase is systematically excluded.Another limitation of the method are the minor crystallinephases not included in the refinement (for synchrotron, lessthan ∼0.5–1%). Since the weights of the phases included areconstrained to 100%, these weights are always overestimatedby an imprecise amount. Altogether, amorphous plus non-included minor phases may represent up to a 5% by weight inconventional diffraction [4]. A point to bear in mind is that theamorphous phase may concentrate a high percent of the silicaof the sample.
Powder diffraction experiments with clinker are highlyreproducible if all steps are fulfilled according to an exactroutine (Table 4). The most variable step is the specimenpreparation, in special when flat specimens are prepared byhand. Whenever comparative results are needed, for instance,performing routine quality control in a factory, it is advisableto find an automatic procedure for mounting the specimenpowders in the holder. Measurements of 5 independent samplepreparation led to determination of the values for accuracy andprecision for X-ray data. Our measurements agree well withprevious results [18,25].
4.3. Chemical composition calculated from quantitativediffraction
For iron free CACs, the agreement between calculated andanalysed oxides can be considered excellent, for both sinchro-tron and X-ray cases. This can be corroborated by comparingFig. 8 (see contents of Al2O3 and CaO greater than 50% andlesser than 35% respectively), with Table 1. For these simplecompositions we may conclude that estimated weight fractionsof clinker phases are highly accurate.
Iron bearing CACs have a more complex composition andthey include more phases. In particular, these CACs usuallycontain an amorphous phase that can not be quantified withoutthe addition of a standard. The exclusion of non-refinablephases will result in an overestimation of the major componentsof major phases, i.e. Al2O3 and CaO (see Fig. 8).
Minor oxides as SiO2, TiO2, etc. are concentrated in minorphases. SiO2 is always underestimated : first of all, larnite, themost important silica bearing phase is underestimated by quan-titative diffraction as stated above, and secondly, the amorphousphase is suggested to be richer in silica. For TiO2, one source ofpositive deviation is the systematic overestimation of C3TF, anda secondary source of error could be the substitution of Ti+4 bySi+4 in perovskite CT [21].
4.4. Useful correlations
Several comparative tests were performed with the aim ofascertaining that conventional Rietveld method is fully reliable forthe quantification of major and intermediate phases. For iron richCACs there are several relationships between phases themselves,and between phases and composition, that have important mean-ings with regards the conditions of the manufacturing process,crystallization of minerals and finally the setting and strengthproperties of the material. These are relationships between theamounts of phases and Al2O3/CaO ratios [26], (Fig. 9), andrelationships betweenC4AF, C12A7 andwustite and theCAphases(Fig. 10). It can be observed that the trends obtained by sinchrotronand conventional XRD are similar and foreseeable, indicating thatconventional XRD results are as reliable as those obtained fromsynchrotron radiation whenever major phases are examined.
5. Conclusions
Compared with conventional powder diffraction, SXRDgreatly improves the intensity and resolution of powder diffrac-tion profiles, permitting the identification of new minor phasesnot observed before by DRX.
The solid solutions present in iron rich CACs are bettercharacterized by SXRD.
The SXRD minimizes the effects of preferred orientation ofcrystallites and reduces the microabsorbtion of X-rays by thesample.
As a result, SXRD improves the accuracy of the quantifi-cation of phases in CACs, and hence it can be used as areference test for assessing the accuracy of quantitative resultsobtained by conventional XRD.
The comparison between SXRD and XRD Rietveld refine-ments, permits to find the best selection of profile and structuralparameters to be refined in conventional XRD. In particular, the“fundamental parameters approach” has been demonstrated tominimize the undesirable correlations between profile andstructure parameters, and is highly advisable whenever a greatnumber of phases are to be quantified.
For major and intermediate phases, the quantitative resultsobtained from conventional powder diffraction are comparable tothose obtained by SXRD, when a wise selection of refined pa-rameters are implemented. Therefore, conventional XRDRietveldquantitative analysis is confirmed as a reliable, straightforwardtool in CACs cement industry.
A minor common drawback to both SXRD and XRD is thesystematic underestimation of larnite. This is reflected in thecalculated composition of iron rich CACs by a depletion of theSiO2 component, which is influenced as well by the exclusionof the glass phase from quantitative diffraction analyses.
Acknowledgements
We thank the anonymous providers of the CACs samples thatpermitted us to carry out this work, Bruker AXS for facilitating afree access to the TOPAS software, and ESRF for the provisionof synchrotron facilities (Invitation for Experiment number CH-
2032 F. Guirado, S. Galí / Cement and Concrete Research 36 (2006) 2021–2032
1507). We also thank Dr. M.A. García Aranda for his assistancein the SXRD experiments. This study received financial supportfrom the Spanish Government, project MAT2001-3345.
References
[1] J.C. Taylor, I. Hinczak, C.E. Matulis, Rietveld full-profile quantification ofPortland cement clinker: the importance of including a full crystallographyof the major phase polymorphs, Powder Diffr. 15 (1) (March 2000) 7–18.
[2] A.G. de la Torre, A. Cabeza, A. Calvente, S. Bruque, M.A.G. Aranda, Fullphase analysis of Portland clinker by penetrating synchrotron powderdiffraction, Anal. Chem. 73 (2001) 151–156.
[3] T. Füllmann, G.Walenta, T. Bier, B. Espinosa, K.L. Scrivener, QuantitativeRietveld phase analysis of calcium aluminate cements, World Cem. Res.(June 1999) 91–96.
[4] F. Guirado, S. Galí, S. Chinchón, Quantitative Rietveld analysis ofaluminous cement clinker phases, Cem. Concr. Res. 30 (2000) 1023–1029.
[5] H. Motzet, H. Poellman, Quantitative phase analysis of high aluminacements, ICMA, Guadalajara, Mexico, 1998, pp. 187–206.
[6] H. Pöllmann, Mineralogy and crystal chemistry of calcium aluminatecement, Proceedings of Int. Conf. On Calcium Aluminate Cements,Edimburg, 2001, pp. 79–119.
[7] B. Touzo, A. Gloter, K.L. Scrivener, Mineralogical composition of Fondurevisited, Proceedings of Int. Conf. On Calcium Aluminate Cements,Edimburg, 2001, pp. 129–138.
[8] F.P. Sorrentino, F.P. Glasser, Crystallization of CaO–Fe2O3–Al2O3–SiO2,Trans. Br. Ceram. Soc. 74 (1975) 253–265.
[9] F. Guirado, S. Galí, J.S. Chinchón, The crystallography of CA1− xFx usingX-ray powder diffraction techniques, Cem. Concr. Res. 24 (5) (1994)923–930.
[10] F. Guirado, S. Galí, J.S. Chinchón, X-ray profile analysis of Ca2Fe2−xAlxO5,World Cem. 27 (12) (1996) 73–76.
[11] H.P. Klug, L.E. Alexander, X-ray diffraction procedures, John Wiley andSons, New York, 1962.
[12] L.W. Finger, Synchrotron powder diffraction, inModern Powder Diffraction,in: D.L. Bish, J.E. Post (Eds.), Mineralogical Society of America, 1989.
[13] TOPAS, General Profile and Structure Analysis Software for PowderDiffraction Data, V2.1, Bruker AXS Gmbh, Karlsruhe, Germany.
[14] R.W. Cheary, A.A. Coelho, A fundamental parameter approach of X-rayline-profile fitting, J. Appl. Crystallogr. 25 (1992) 109–121.
[15] G. Cagliotti, A. Paoletti, F.P. Ricci, Choice of collimators for a crystalspectrometer for neutron diffraction, Nucl. Instrum. Methods 3 (1958)223–226.
[16] L.W. MacCusker, R.B. Von Dreele, D.E. Cox, D. Louër, P. Scardi, Rietveldrefinements guidelines, J. Appl. Crystallogr. 32 (1999) 36–50.
[17] R.J. Hill, I.C. Madsen, The effect of profile step width on the determinationof crystal structure parameters and estimated standard deviations by X-rayRietveld analysis, J. Appl. Crystallogr. 19 (1986) 10–18.
[18] F. Goetz-Neunhoeffer, Quantitative phase analysis of various Fe-richcalcium aluminate cement clinkers by selective dissolution and XRPD,Proceedings of the 11th Int. Cong. On the Chem. of Cement, Durban,South Africa, 2003, pp. 125–133.
[19] B. Touzo, A. Gloter, K. Scrivener, T. Füllmann, G. Walenta, Phasecomposition of 40% Al2O3 calcium aluminate cements, Proceedings ofthe 11th Int. Cong. On the Chem. of Cement, Durban, South Africa, 2003,pp. 1931–1940.
[20] R. Müller, J. Neubauer, F. Götz-Neunhofer, Effects of phosphate rich rawmaterials on the crystallographic and hydraulic properties of dicalciumsilicate, Proceedings of the 11th Int. Cong. On the Chem. of Cement,Durban, South Africa, 2003, pp. 1045–1053.
[21] B. Touzo, A. Gloter, K.L. Scrivener, Mineralogical composition of Fondurevisited, Proceedings of Int. Conf. On Calcium Aluminate Cements,Edimburg, 2001, pp. 129–138.
[22] F. Hanic, M. Handlovic, I. Kapralik, The structures of a quaternary phaseCa20Al32−2xMgxSixO68, Acta Crystallogr. 336 (1980) 2863–2869.
[23] A. Sourie, F.P. Glasser, E.E. Lachowski, Microstructural studies onpleochroite, Br. Ceram. Trans. 93–2 (1994) 41–48.
[24] D.L. Bish, S.A. Howard, Quantitative phase analysis using the Rietveldmethod, J. Appl. Crystallogr. 21 (1988) 86–91.
[25] A.G. De la Torre, M.A.G. Aranda, Accuracy in Rietveld quantitative phaseanalysis of Portland cements, J. Appl. Crystallogr. 36 (2003) 1169–1176.
[26] K.W. Harr, Relationship between mineral phases C4AF and CA in calciumaluminate cements with high iron content, Proceedings of Int. Conf. OnCalcium Aluminate Cements, Edimburg, 2001, pp. 121–127.