


Idiomas
Páginas
Jurídico


UNIVERSIDAD DE LAS FUERZAS ARMADAS ESPEL
NOMBRE: ISRAEL PRIETO
CARRERA: 7mo PETROQUIMICA
FECHA: 12-11-2015
TEMA: REALIZAR LOS SIGUIENTES EJERCICIOS EN MATLAB
EJERCICIO 3.4
Código
Q=8000R=1.987c=1200T=100:50:500k=c*exp(-Q./(R*T))
k3,92E-
152,64E-
092,17E-
060,0001216
20,0017811
6 0,012115540,0510296
5 0,15614537
0,3820272
4T 100 150 200 250 300 350 400 450 500

CREAR GRAFICAS DE LAS SIGUIENTES FUNCIONES
A.-)y=e^x
Código
x=[0:1:10]y=exp(x)disp([x,y])plot(x,y)xlabel('valores X')ylabel('valores y')legend('y=e^x')

b.-)y=sen(x)
Código
x=[0:0.2:10]y=sin(x) disp([x,y])plot(x,y)xlabel('valores X')ylabel('valores y')legend('y=sin(x)')axis tight

C.-) y=ax2+bx+c
Código
a=5;b=2;c=4;x=[0:1:10];y=a*(x.^2)+b*x+cplot(x,y,'g')title('Grafica ecuacion de segundo grado')xlabel('Eje X')ylabel('Eje Y')legend('a*(x.^2)+b*x+c')
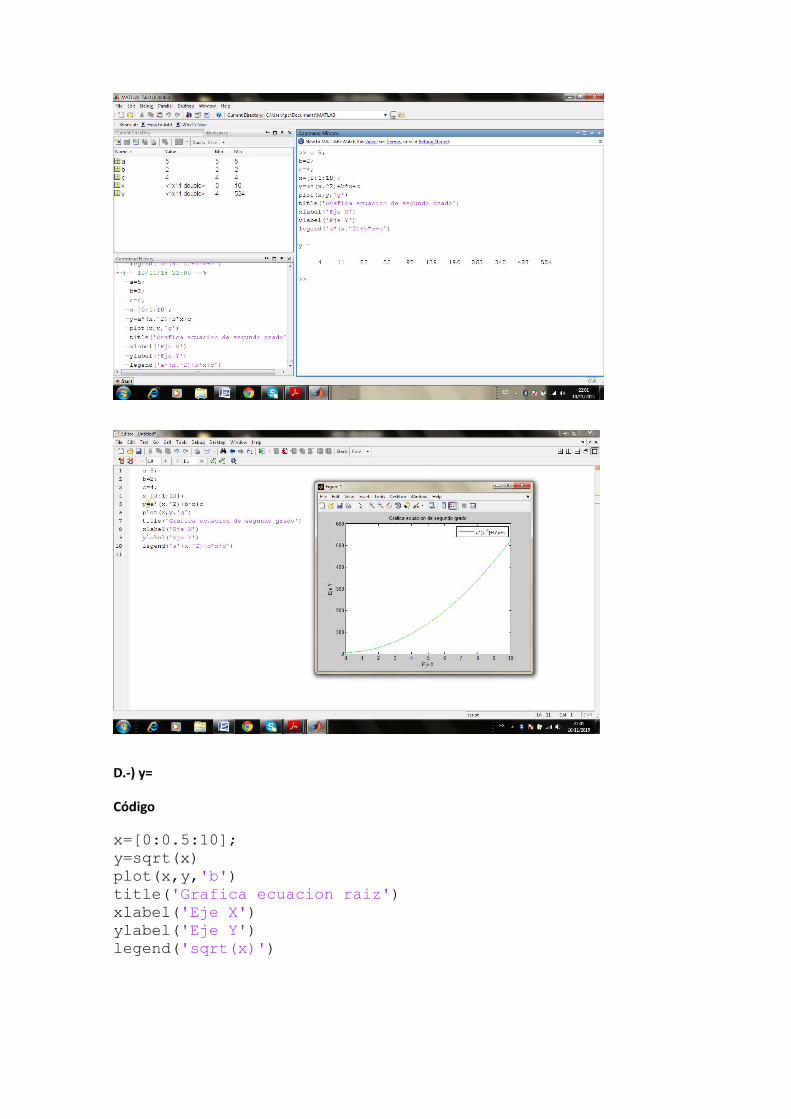
D.-) y=
Código
x=[0:0.5:10];y=sqrt(x)plot(x,y,'b')title('Grafica ecuacion raiz')xlabel('Eje X')ylabel('Eje Y')legend('sqrt(x)')
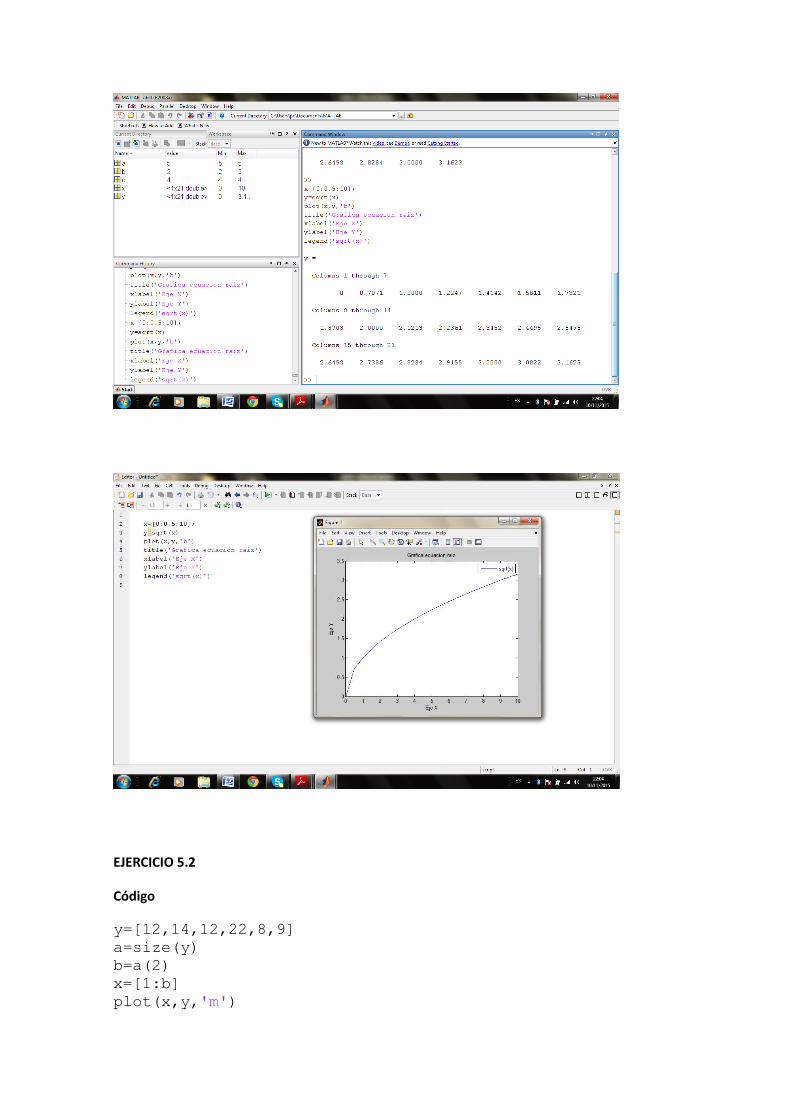
EJERCICIO 5.2
Código
y=[12,14,12,22,8,9]a=size(y)b=a(2)x=[1:b]plot(x,y,'m')

title('Grafica indice de matriz')xlabel('Eje X')ylabel('Eje Y')
EJERCICIO 5.3
x=[-pi:0.01:pi]y1=sin(x)y2=sin(2*x)y3=sin(3*x)plot(x,y1,x,y2,x,y3)

title('Grafica')xlabel('Eje X')ylabel('Eje Y')legend('sen(x)')axis tight
EJERCICIO 5.4
x=[-pi:0.05:pi]y1=sin(x)y2=sin(2*x)y3=sin(3*x)hold onplot(x,y1,'--r')plot(x,y2,'b')plot(x,y3,'.g')hold offxlabel('Eje X')ylabel('Eje Y')axis tight
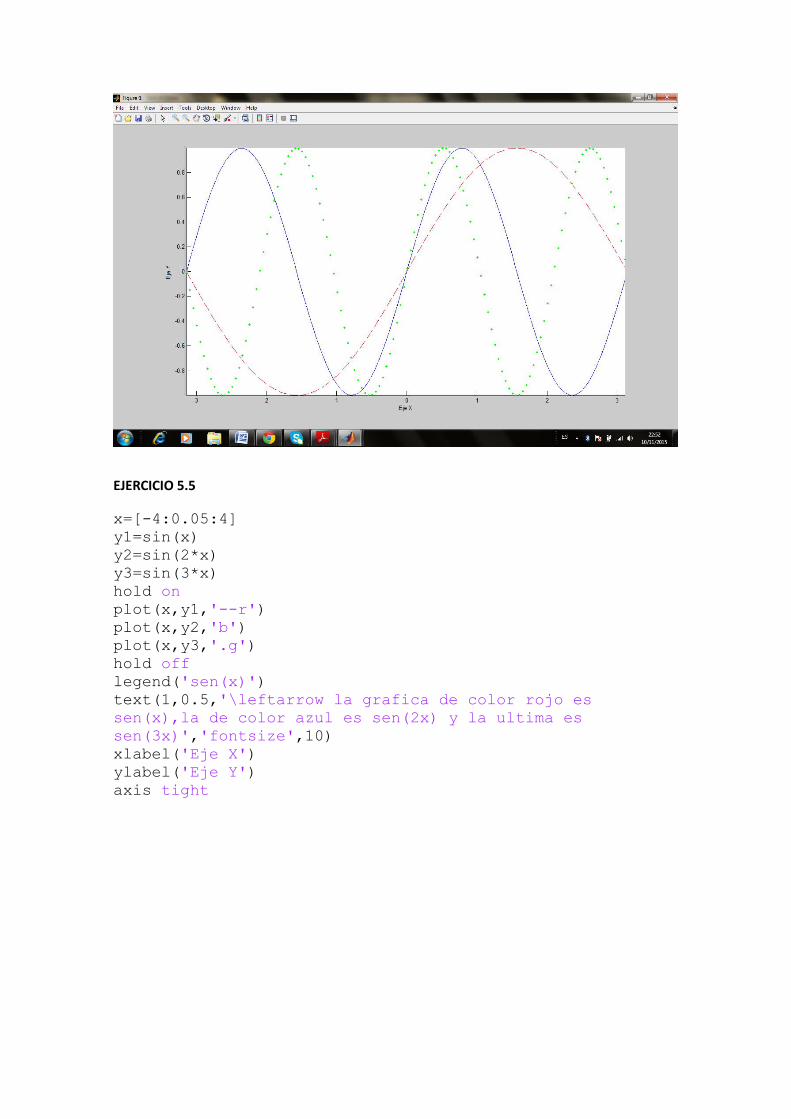
EJERCICIO 5.5
x=[-4:0.05:4]y1=sin(x)y2=sin(2*x)y3=sin(3*x)hold onplot(x,y1,'--r')plot(x,y2,'b')plot(x,y3,'.g')hold offlegend('sen(x)')text(1,0.5,'\leftarrow la grafica de color rojo es sen(x),la de color azul es sen(2x) y la ultima es sen(3x)','fontsize',10)xlabel('Eje X')ylabel('Eje Y')axis tight
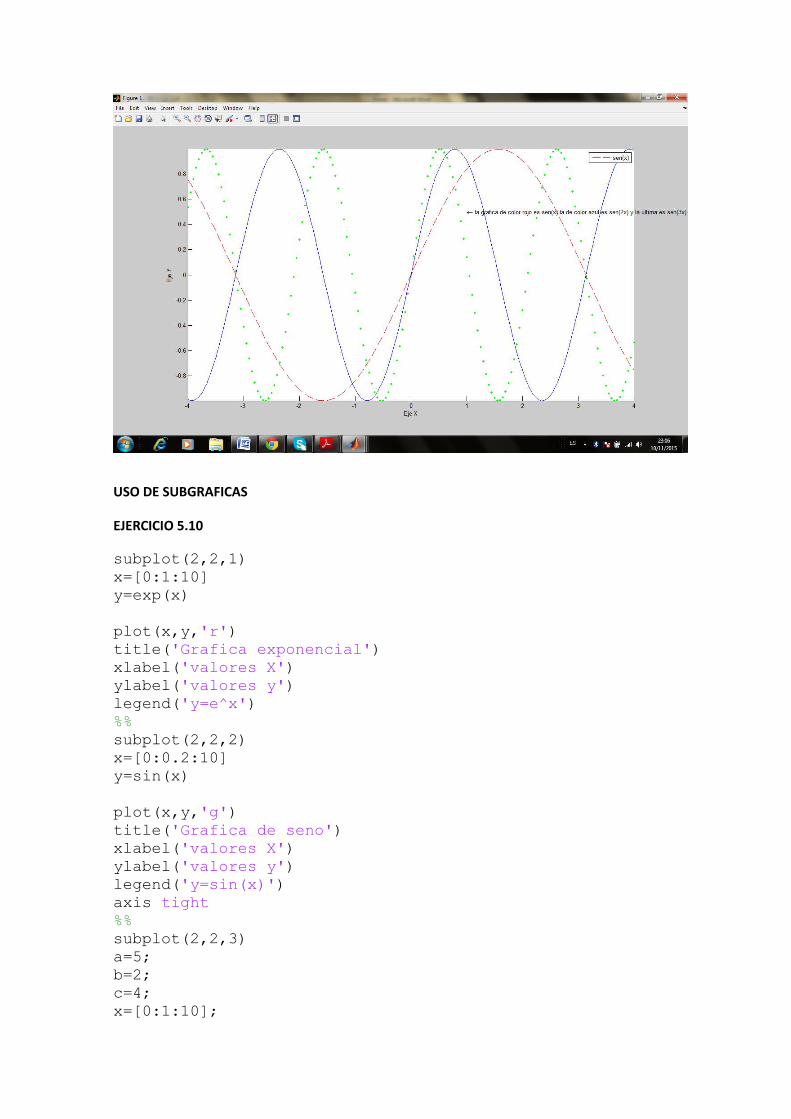
USO DE SUBGRAFICAS
EJERCICIO 5.10
subplot(2,2,1)x=[0:1:10]y=exp(x) plot(x,y,'r')title('Grafica exponencial')xlabel('valores X')ylabel('valores y')legend('y=e^x')%%subplot(2,2,2)x=[0:0.2:10]y=sin(x) plot(x,y,'g')title('Grafica de seno')xlabel('valores X')ylabel('valores y')legend('y=sin(x)')axis tight%%subplot(2,2,3)a=5;b=2;c=4;x=[0:1:10];
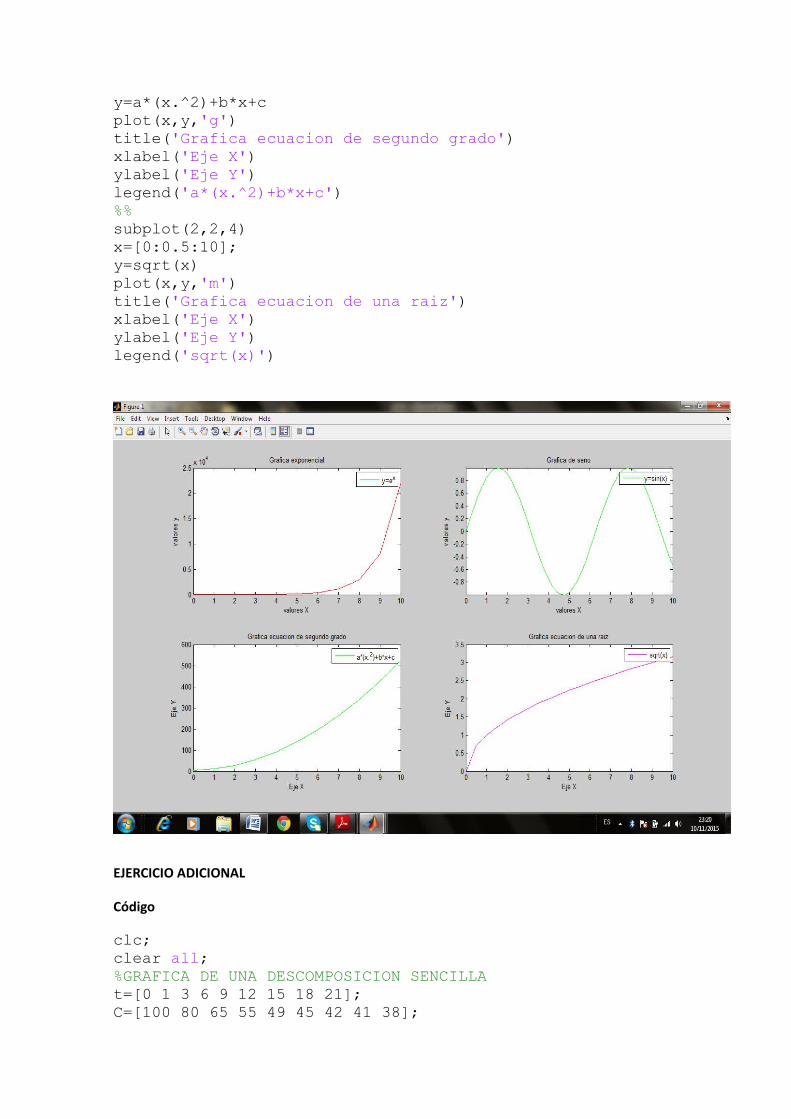
y=a*(x.^2)+b*x+cplot(x,y,'g')title('Grafica ecuacion de segundo grado')xlabel('Eje X')ylabel('Eje Y')legend('a*(x.^2)+b*x+c')%%subplot(2,2,4)x=[0:0.5:10];y=sqrt(x)plot(x,y,'m')title('Grafica ecuacion de una raiz')xlabel('Eje X')ylabel('Eje Y')legend('sqrt(x)')
EJERCICIO ADICIONAL
Código
clc;clear all;%GRAFICA DE UNA DESCOMPOSICION SENCILLAt=[0 1 3 6 9 12 15 18 21];C=[100 80 65 55 49 45 42 41 38];

plot(t,C)title('Grafica de una Descomposicion Sencilla')xlabel('Tiempo de reaccion (min)')ylabel('Concentracion componente A (mol/lt)')

Top Related