04 Cambios-sociales Maximiliano Bezada
39
Seminario Desafíos climáticos de hoy para el planeta del mañanaDiálogo Internacional30 y 31 de octubre de 2014CAF Cambio climático y cambios sociales El cambio climático y las transformaciones de los ecosistemas en Venezuela, desde el ultimo máximo glacial hasta el presente. Maximiliano Bezada [email protected] Universidad Pedagógica Experimental Libertador, Instituto Pedagógico de Caracas, Departamento de Ciencias de la Tierra, Laboratorio de Pedología y Geología del Cuaternario.
-
Upload
anavel-sierra -
Category
Documents
-
view
228 -
download
0
description
los cambios en la sociedad, va precedida por cambios de paradigmas, valores en la educacion de los seres humanos.
Transcript of 04 Cambios-sociales Maximiliano Bezada
Seminario Desafíos climáticos de hoy para el planeta del mañanaDiálogo Internacional30 y 31 de octubre de 2014CAF
Cambio climático y cambios sociales
El cambio climático y las transformaciones de los ecosistemas en Venezuela, desde el ultimo máximo glacial hasta el presente.
Maximiliano Bezada
Universidad Pedagógica Experimental Libertador, Instituto Pedagógico de Caracas,
Departamento de Ciencias de la Tierra, Laboratorio de Pedología y Geología del Cuaternario.
…“Si cambios climáticos antropogénicos ocurren en el
futuro, ellos estarán superimpuestos e interactuarán sobre la
variabilidad climática natural de base…
Por lo tanto para anticipar futuros cambios, nosotros
debemos primeramente comprender como y porque el clima
vario en el pasado…..
Esta información está disponible en una variedad de
archivos naturales. Confiar solo en los datos instrumentales
para comprender el espectro de la variabilidad climática es
completamente inadecuado…..
Por lo tanto, la data paleoclimática del Holoceno, es capaz
de resolver el espectro completo de la variabilidad climática
y ubicar los limitados records instrumentales en una
perspectiva de términos largos”……. (Bradley, 2008)

“El mejor termómetro de la naturaleza, quizás su
más sensible e inequívoco indicador, es el hielo:
Este no hace preguntas, no presenta
argumentos, no lee periódicos, ni
escucha debates. No está cargado de
ideología y no tiene partido político al
cambiar de sólido a líquido. sólo se
derrite” (Pollack, 2010).
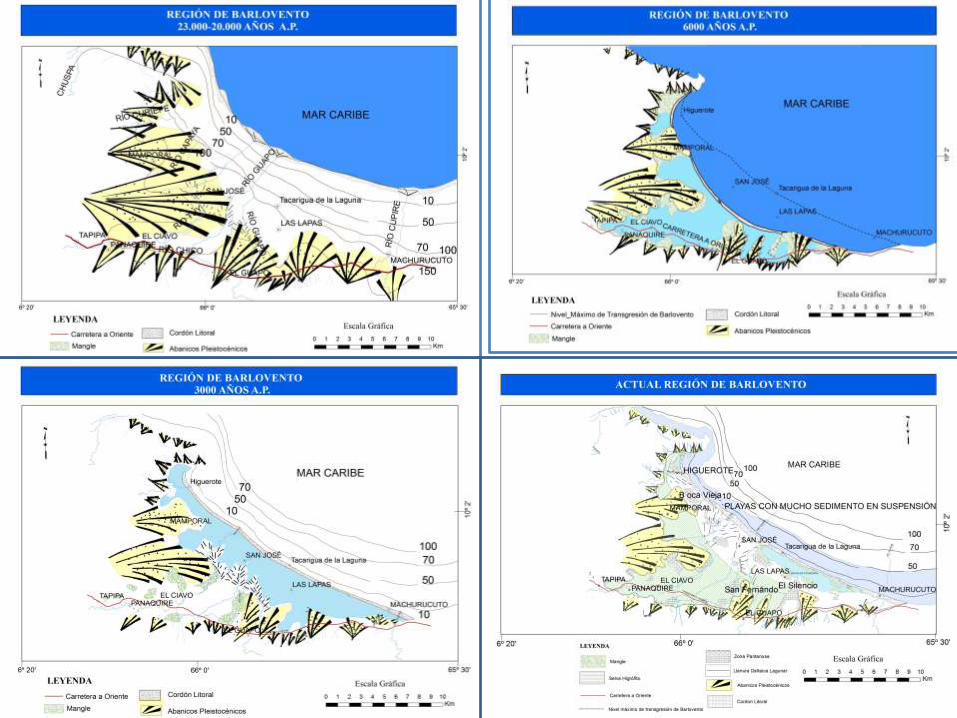
“Comprender cómo los cambios de nivel
marino del HOLOCENO influenciaron el
desarrollo de los humedales costeros del
Caribe, contribuirán a su mejor manejo en el
contexto de las alzas del nivel marino que
se predice como consecuencia del
calentamiento global.”
(1) Ramcharan, E. (2004). Mid to late Holocene sea level influence on coastal
wetland development in Trinidad. Quaternary International 120 (2004) 145-151
Acot Pascal. (2005).HISTORIA DEL CLIMA. Desde el Big Ban a las catastrofes climaticas. Edit. Ateneo, 268 pag.
Monbiot, Gerge. (2008).CALOR. Como parar el calentamiento global. Edit. RBA.
Al Gore. (2008). UNA VERDAD INCOMODA: La crsís planetaria del calentamientoglobal y como afrontarla. Edit. GEDISA. 328 pag.
Walker, Gabrielle. (2003).CATACLISMO CLIMATICO. Edit., Antoni Bosch.
Campos, Luis Carlos. (2005). CALOR GLACIAL. Entramos en una nueva glaciación. Edit., Arcopress. 268 pags.
Laurie, David., y Gordon, Cambria. (2008). QUE ES EL CALENTAMIENTO GLOBAL. Edit.,Oniro. 112 pags.
Alcalde, Jorge. (2007).LAS MENTIRAS DEL CAMBIO CLIMATICO. UNlibro ecologicamente incorrecto. Edit., libroslibres.
Fagan Brian. (2008). LA PEQUEÑA EDAD DE HIELO. Como el clima de afectó a la historia de Europa, 1300-1850. Edit., GEDISA. 344 pags.
Patrick Michaels y Robert Balling, Jr. (2009) CLIMATE OF EXTREMES. Global Warming Science They Don´t Want You to Know. CATO INSTITUTE

1981
2013

Bezada, M. y Schubert, C. (1987):Cronología Cuaternaria en Venezuela, algunos problemas metodológicos y pedológicos. Act. Cient. Venezolana (38)1-12. Clapperton, Ch., and Bezada, M. (1998). Full – glacialglaciers extents and chronology along PEP 1 (Americas) transect . Pole – Equator - Pole Paleoclimate of the Americas. PEP 1, Meeting, Mérida, 1998.
Braun, C., Bezada, M., (2013). The history and disappearance of glaciers in Venezuela. Journal of Latin American Geography 12, 85-124.
Bezada, M., Mahaney,W., and Kalm, V. (1995) Pleistocene Glaciations in the Venezuelan Andes. International Quaternary Association. Congress, Berlin. Abctracts Volume. P. 28.
Polissar, P., Abbott, M., Wolfe, A., Bezada, M., Rull, V., and Bradley, R. (2006).Solar modulation of Little Ice Age climate in the tropical Andes. Preccedings of the National Academy of Science. 103: 8937-8942. Stansell, N., Abbott, M., Rull,V., Rodbell, T., and Bezada, M. (2010). Abrupt Younger Dryas Coolings in the northern tropical recorded in lake sediments from the venezuelan Andes. Earth Science and Planetary letters, 293, 154-163. Stansell, N., Abbott, M., Polissar, P., Wolfe, A., Bezada, M., Rull,V., and Bradley, R. (2005). Late Quaternary Deglacial History of the Mérida Andes, Venezuela. Journal of Quaternary Science, 20 (7-8) pp. 801-812. Bezada, M., Diaz, D., DeAbrisqueta, A., Gonzalez,O., Carrera,J., Santiago,C. (2008).Glacial Quaternary Geology of Las Gonzalez Basin, Paramo Los Conejos, Venezuelan Andes. 33 International Geological Congress. Oslo. Polissar, P.,Abbott, M., Wolfe, A., Bezada, M.(2013) The Role of Insolation and the Ecuatorial Pacific In South American Climate during the Holocene: A new Andean Paleoclimate Record from Laguna Blanca, Venezuela. Quaternary Science Review . Stansell, N., Abbott, M., Rull,V., and Bezada, M. (2010). Late glacial cycle.Glacial abrupt climate change in the tropical Andes. Journal of Quaternary Science. Rull, V., Abbott, M., Vegas-Vilarrúbia, T., Bezada, M., Montoya, E., Nogue, S., González, C. (2010). Paleoenvironmental trends in Venezuela during the last glacial cycle. Indiana University Press. Bezada, M., González, O., Díaz, D., De’Abrisqueta, A. (2009) Glaciers retreats in the venezuela Andes since last glacial maximum to the present global warming and their effects on social and economic activities in high mountains. Glaciers and challenges caused by climatic change. Norway Polar Institute.Tromso, Norway.
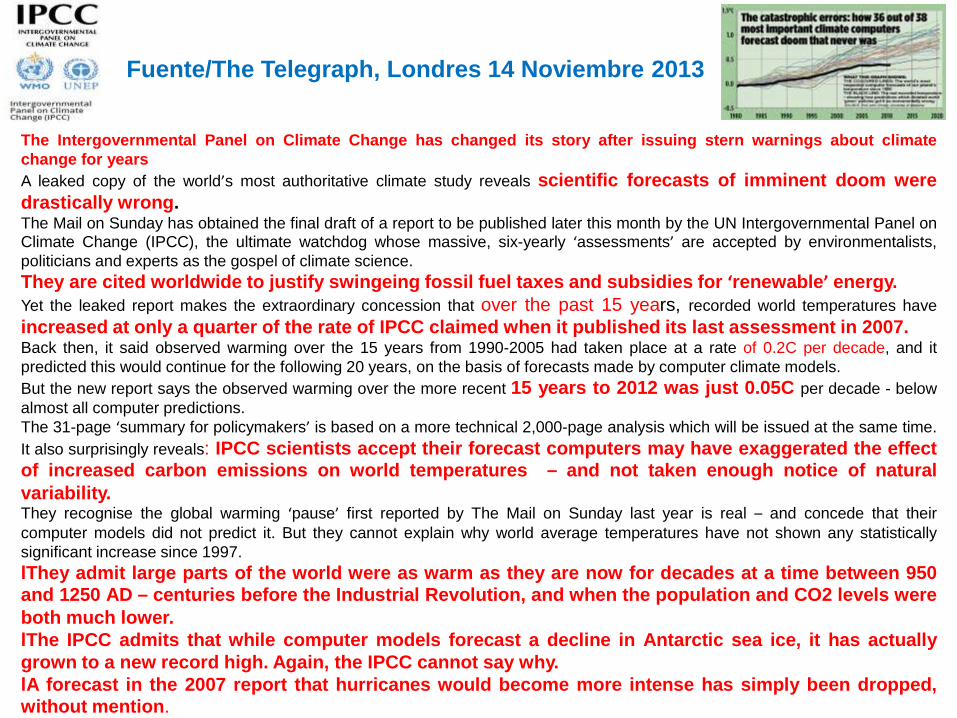
The Intergovernmental Panel on Climate Change has changed its story after issuing stern warnings about climate
change for years
A leaked copy of the world’s most authoritative climate study reveals scientific forecasts of imminent doom were
drastically wrong. The Mail on Sunday has obtained the final draft of a report to be published later this month by the UN Intergovernmental Panel on Climate Change (IPCC), the ultimate watchdog whose massive, six-yearly ‘assessments’ are accepted by environmentalists,
politicians and experts as the gospel of climate science.
They are cited worldwide to justify swingeing fossil fuel taxes and subsidies for ‘renewable’ energy.
Yet the leaked report makes the extraordinary concession that over the past 15 years, recorded world temperatures have
increased at only a quarter of the rate of IPCC claimed when it published its last assessment in 2007. Back then, it said observed warming over the 15 years from 1990-2005 had taken place at a rate of 0.2C per decade, and it
predicted this would continue for the following 20 years, on the basis of forecasts made by computer climate models.
But the new report says the observed warming over the more recent 15 years to 2012 was just 0.05C per decade - below
almost all computer predictions. The 31-page ‘summary for policymakers’ is based on a more technical 2,000-page analysis which will be issued at the same time.
It also surprisingly reveals: IPCC scientists accept their forecast computers may have exaggerated the effect of increased carbon emissions on world temperatures – and not taken enough notice of natural
variability. They recognise the global warming ‘pause’ first reported by The Mail on Sunday last year is real – and concede that their
computer models did not predict it. But they cannot explain why world average temperatures have not shown any statistically
significant increase since 1997.
lThey admit large parts of the world were as warm as they are now for decades at a time between 950 and 1250 AD – centuries before the Industrial Revolution, and when the population and CO2 levels were
both much lower.
lThe IPCC admits that while computer models forecast a decline in Antarctic sea ice, it has actually
grown to a new record high. Again, the IPCC cannot say why.
lA forecast in the 2007 report that hurricanes would become more intense has simply been dropped,
without mention.
Fuente/The Telegraph, Londres 14 Noviembre 2013
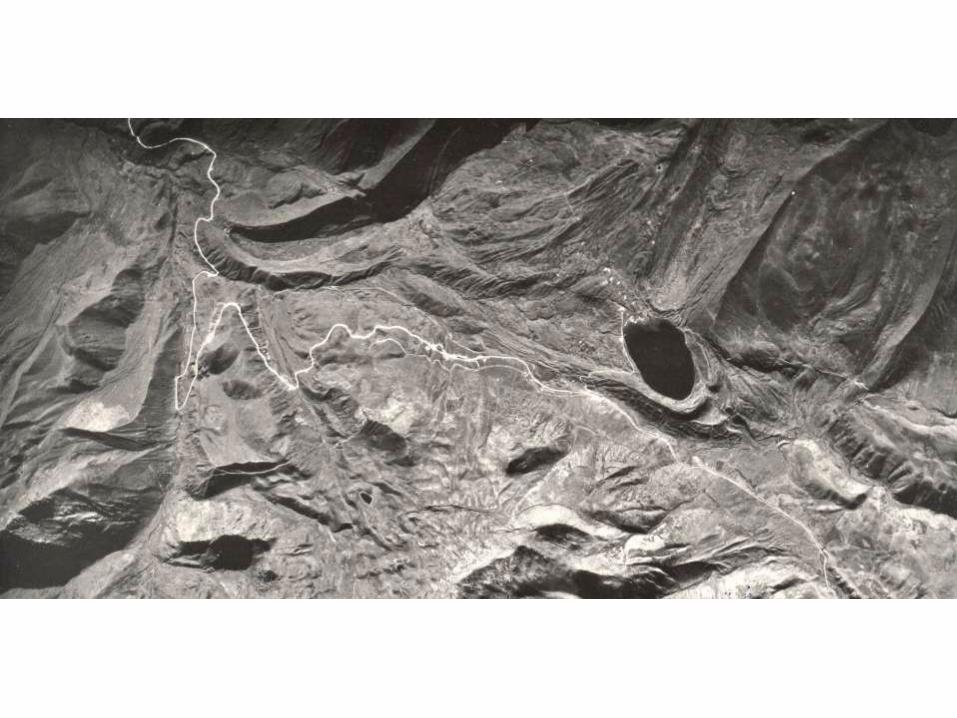
SÍNTESIS DE LA HISTORIA PALEOCLIMÁTICA DE VENEZUELA DESDE LA ÚLTIMA GLACIACIÓN
Para resumir esta historia necesitamos considerar cuatro escenarios: I.- LA ÚLTIMA GLACIACIÓN. II.- EL ÚLTIMO MÁXIMO GLACIAL. III.- EL HOLOCENO. IV.- EL ÚLTIMO MILENIO.
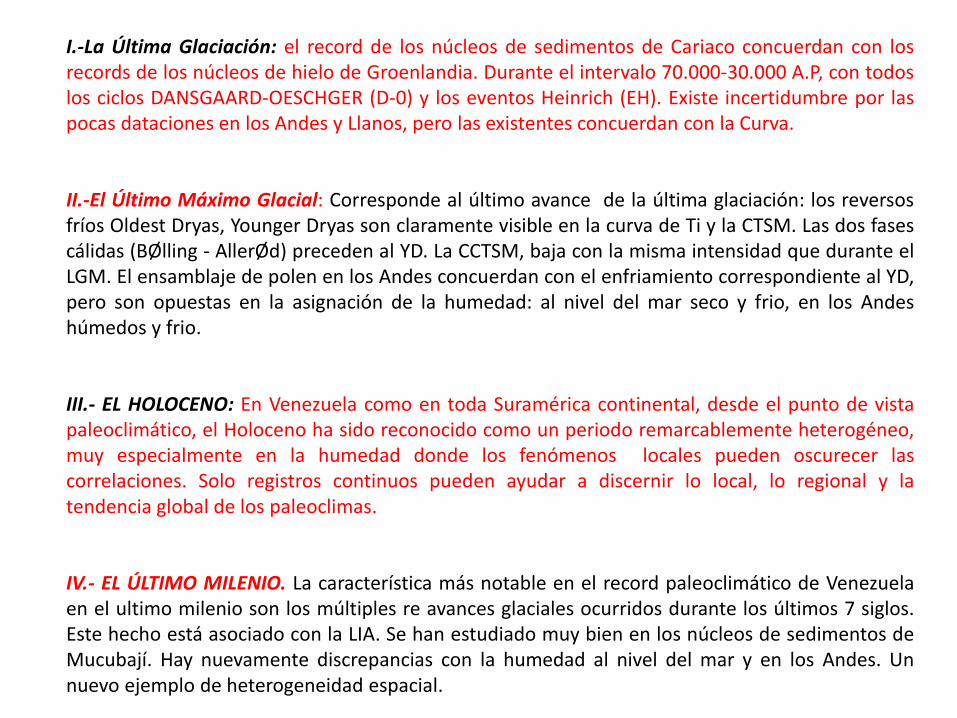
I.-La Última Glaciación: el record de los núcleos de sedimentos de Cariaco concuerdan con los records de los núcleos de hielo de Groenlandia. Durante el intervalo 70.000-30.000 A.P, con todos los ciclos DANSGAARD-OESCHGER (D-0) y los eventos Heinrich (EH). Existe incertidumbre por las pocas dataciones en los Andes y Llanos, pero las existentes concuerdan con la Curva. II.-El Último Máximo Glacial: Corresponde al último avance de la última glaciación: los reversos fríos Oldest Dryas, Younger Dryas son claramente visible en la curva de Ti y la CTSM. Las dos fases cálidas (BØlling - AllerØd) preceden al YD. La CCTSM, baja con la misma intensidad que durante el LGM. El ensamblaje de polen en los Andes concuerdan con el enfriamiento correspondiente al YD, pero son opuestas en la asignación de la humedad: al nivel del mar seco y frio, en los Andes húmedos y frio. III.- EL HOLOCENO: En Venezuela como en toda Suramérica continental, desde el punto de vista paleoclimático, el Holoceno ha sido reconocido como un periodo remarcablemente heterogéneo, muy especialmente en la humedad donde los fenómenos locales pueden oscurecer las correlaciones. Solo registros continuos pueden ayudar a discernir lo local, lo regional y la tendencia global de los paleoclimas. IV.- EL ÚLTIMO MILENIO. La característica más notable en el record paleoclimático de Venezuela en el ultimo milenio son los múltiples re avances glaciales ocurridos durante los últimos 7 siglos. Este hecho está asociado con la LIA. Se han estudiado muy bien en los núcleos de sedimentos de Mucubají. Hay nuevamente discrepancias con la humedad al nivel del mar y en los Andes. Un nuevo ejemplo de heterogeneidad espacial.

VARIABILIDAD CLIMATICA DEL HOLOCENO
1970–2014 CALIDO 1950 FRIO RELATIVO 1880 CALIDO 1840 CALIDO RELATIVO 1750 FRIO 1650 MAS FRIO 1350 FRIO HOLOCENO 1300 CALIDO 700 dC CALIDOS 6000 AP FRIOS - CALIDOS 8000 AP FRIO 10000 AP CALIDO HUMEDO ………………………………………………………PLEISTOCENO TARDIO - HOLOCENO 11000 YD MUY FRIO 12.000 YD MUY FRIO 13000 – 14000 bølling - allerød

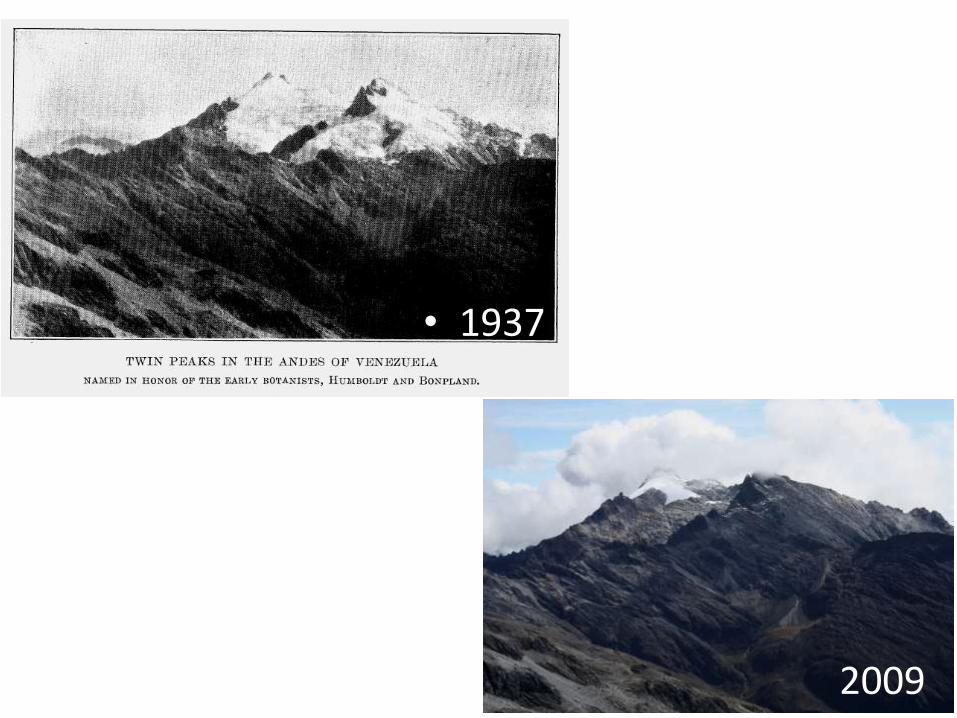
2009
• 1937
OBJETIVO GENERAL
Establecer la geomorfología, pedología y geología glacial del
Cuaternario de las áreas afectadas por los cambios climáticos del
Cuaternario, haciendo énfasis especifico desde el Último Máximo
Glacial (23.000 – 20.000 años AP) de las áreas afectadas por
glaciaciones en los en los Andes Venezolanos y su repercusión
ambiental en los paisajes llaneros y costaneros con el objeto de
complementar con una amplia cronología absoluta los cambios
paleoambientales previamente visualizados y de esta manera poder
predecir con mayor exactitud los cambios ambientales en términos
de impacto sobre la distribución de los ecosistemas andinos,
llaneros y de las planicies fluviomarinas actuales por el efecto de
los cambios climáticos que se predicen como productos del
calentamiento global inducido por las emisiones de gases de
efecto invernadero: derretimiento de glaciares, subida del nivel del
mar, variaciones en los ecosistemas vegetales, perdida de la
biodiversidad, desertificación, impacto socioeconómico en las
comunidades.
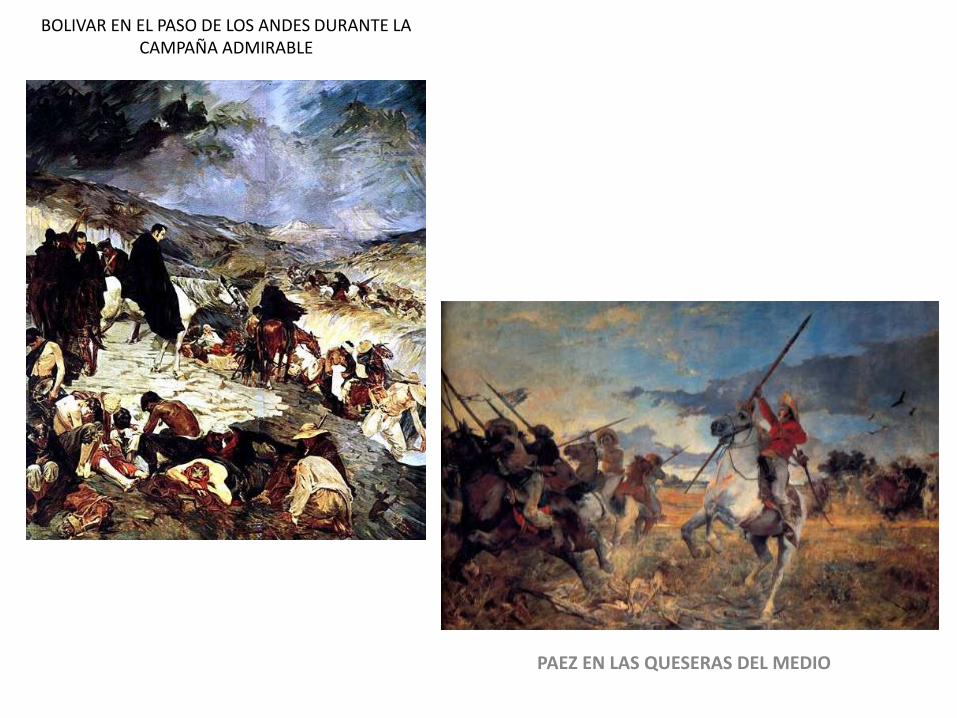
BOLIVAR EN EL PASO DE LOS ANDES DURANTE LA CAMPAÑA ADMIRABLE
PAEZ EN LAS QUESERAS DEL MEDIO
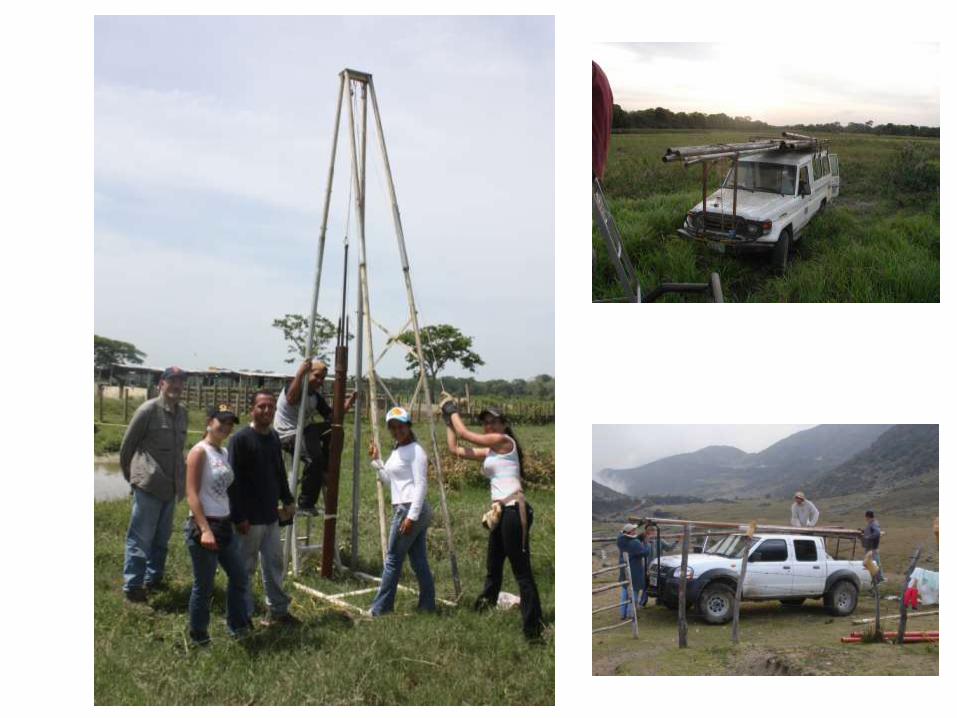


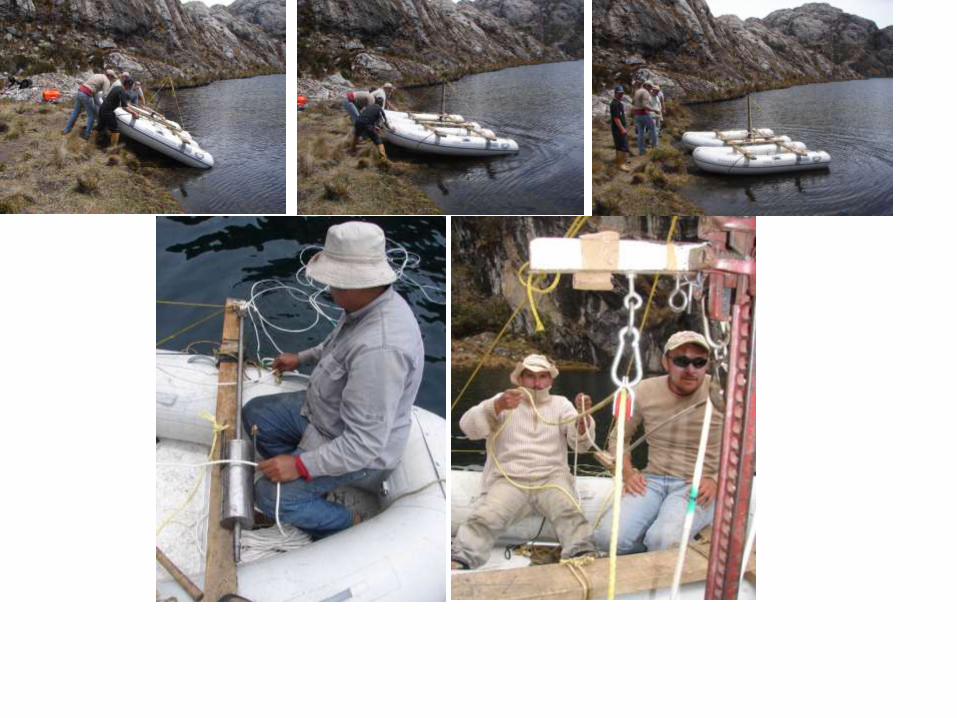
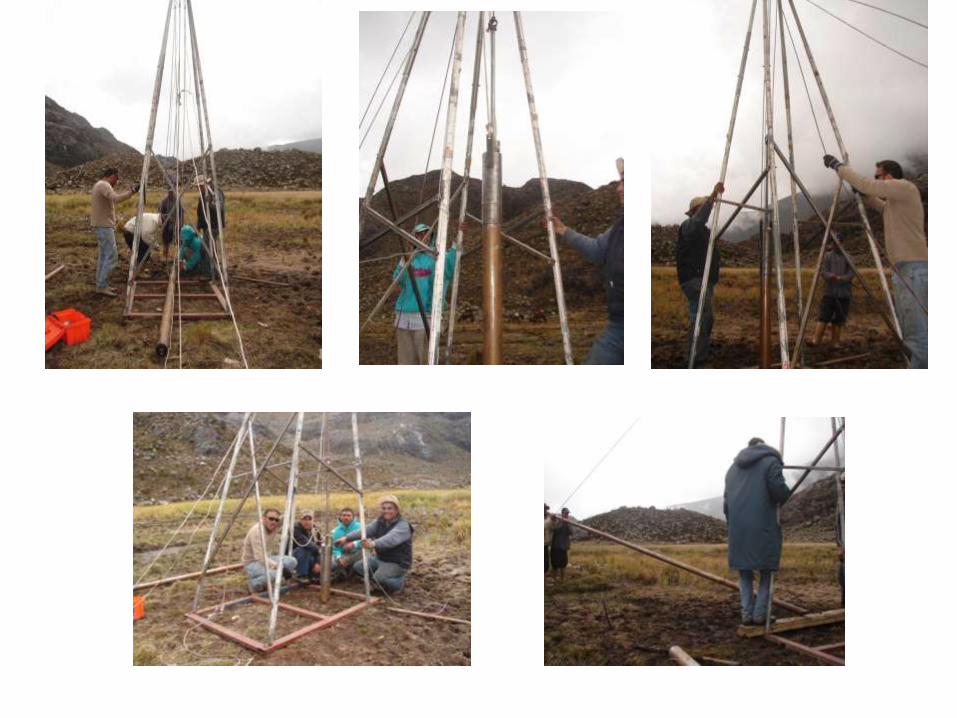


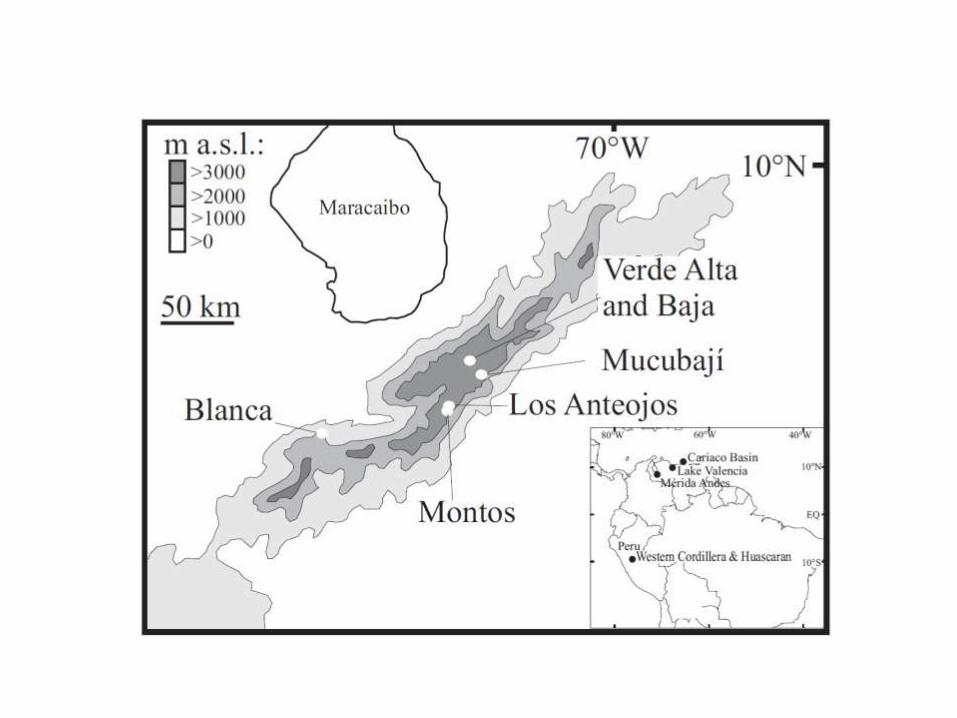
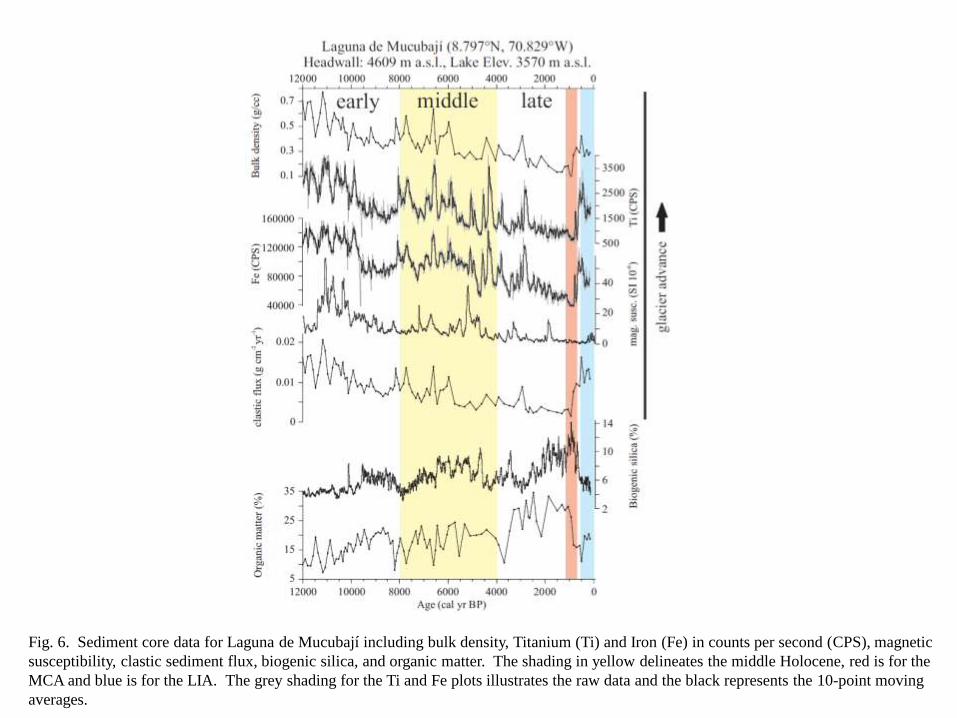
Fig. 6. Sediment core data for Laguna de Mucubají including bulk density, Titanium (Ti) and Iron (Fe) in counts per second (CPS), magnetic
susceptibility, clastic sediment flux, biogenic silica, and organic matter. The shading in yellow delineates the middle Holocene, red is for the
MCA and blue is for the LIA. The grey shading for the Ti and Fe plots illustrates the raw data and the black represents the 10-point moving
averages.

MUCHAS GRACIAS POR SU ATENCION