FY2016 results presentation
56
2016 Results: the best in IGD’s history Conference call 28 February 2017 puntadiferro -Forlì
-
Upload
igd-siiq-spa -
Category
Real Estate
-
view
24 -
download
0
Transcript of FY2016 results presentation

2016 Results: the best in IGD’s history Conference call 28 February 2017
puntadiferro -Forlì

DIS
CL
AIM
ER
This presentation does not constitute an offer or an invitation to subscribe for or purchase any securities.
The securities referred to herein have not been registered and will not be registered in the United States under the U.S. Securities Act of 1933, as
amended (the “Securities Act”), or in Australia, Canada or Japan or any other jurisdiction where such an offer or solicitation would require the approval of
local authorities or otherwise be unlawful. The securities may not be offered or sold in the United States or to U.S. persons unless such securities are
registered under the Securities Act, or an exemption from the registration requirements of the Securities Act is available. Copies of this presentation are
not being made and may not be distributed or sent into the United States, Canada, Australia or Japan.
This presentation contains forwards-looking information and statements about IGD SIIQ SPA and its Group.
Forward-looking statements are statements that are not historical facts.
These statements include financial projections and estimates and their underlying assumptions, statements regarding plans, objectives and expectations
with respect to future operations, products and services, and statements regarding plans, performance.
Although the management of IGD SIIQ SPA believes that the expectations reflected in such forward-looking statements are reasonable,
investors and holders of IGD SIIQ are cautioned that forward-looking information and statements are subject to various risk and uncertainties,
many of which are difficult to predict and generally beyond the control of IGD SIIQ; that could cause actual results and developments to differ materially
from those expressed in, or implied or projected by, the forward-looking statements.
These risks and uncertainties include, but are not limited to, those contained in this presentation.
Except as required by applicable law, IGD SIIQ does not undertake any obligation to update any forward-looking information or statements
3 FY2016 Results presentation
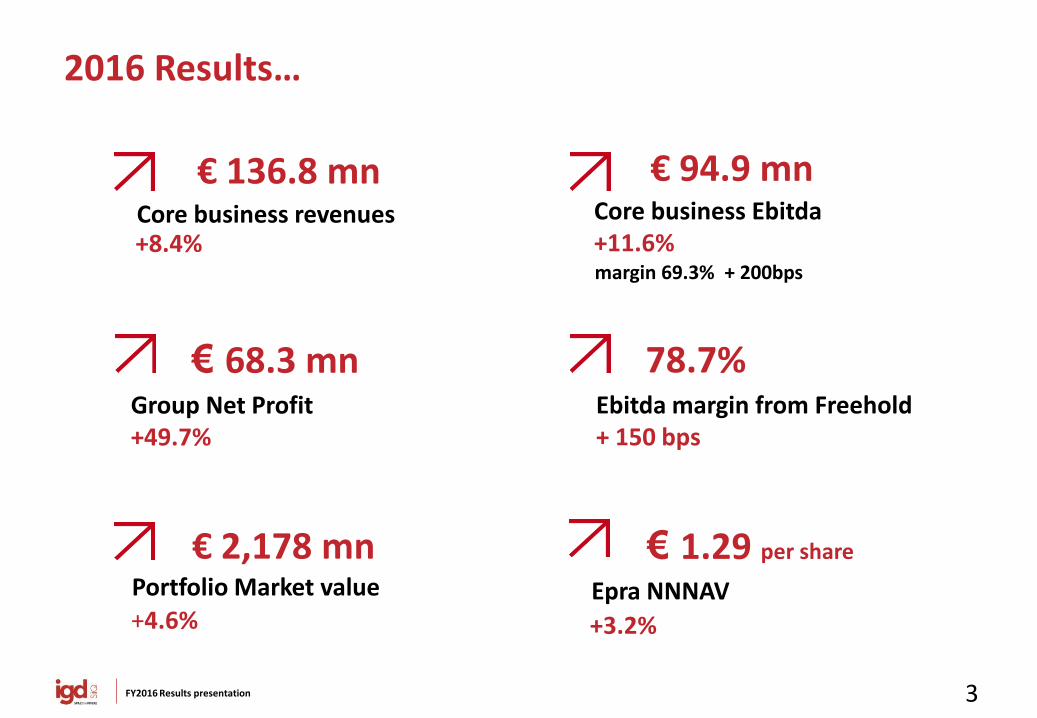
2016 Results…
78.7% Ebitda margin from Freehold + 150 bps
€ 68.3 mn Group Net Profit +49.7%
€ 136.8 mn Core business revenues +8.4%
€ 94.9 mn Core business Ebitda +11.6% margin 69.3% + 200bps
€ 1.29 per share
Epra NNNAV
+3.2%
€ 2,178 mn Portfolio Market value +4.6%

4 FY2016 Results presentation
…exceeding expectations!!!
€ 53.9 mn Funds From Operations (FFO) +18.9% (+15/16% guidance)
€ 0.066 FFO per share
€ 0.045 per share
Proposed dividend
+12.5%

Centro Sarca – Sesto San Giovanni (MI)
Operating Performance

6 FY2016 Results presentation
A positive scenario, also in 2017…
• 8° economy in the world and 3° in the Euro Area
• GDP 2016: €1,569 mld (+0.9%)
• Consumption 2016: +1.2%
• Among the economies that are growing faster in Europe
• GDP 2016: approx. €176 mld (+4.8%)
• Consumption 2016: + 8,9%
Sources: World Bank, Istat, Raiffeisen Research and European Commission and IGD internal processing on research institutes panel
GDP + 0.9% Consumption + 0.9%
GDP + 3.9% Consumption + 5.9%
OUTLOOK 2017 ITALY
ROMANIA

7 FY2016 Results presentation
..which results in good operating performaces
+2.6% Tenants sales shopping malls
Better results in shopping centers recently restyled/refurbished
Slight decline Footfalls But comparison with a strong 2015:
Δ IGD/CNCC 2015 +1.4% Δ IGD/CNCC 2016 -0.8%
+2.5% Footfalls
Increase in the commercial offer, reduction of works inside the assets
8 FY2016 Results presentation
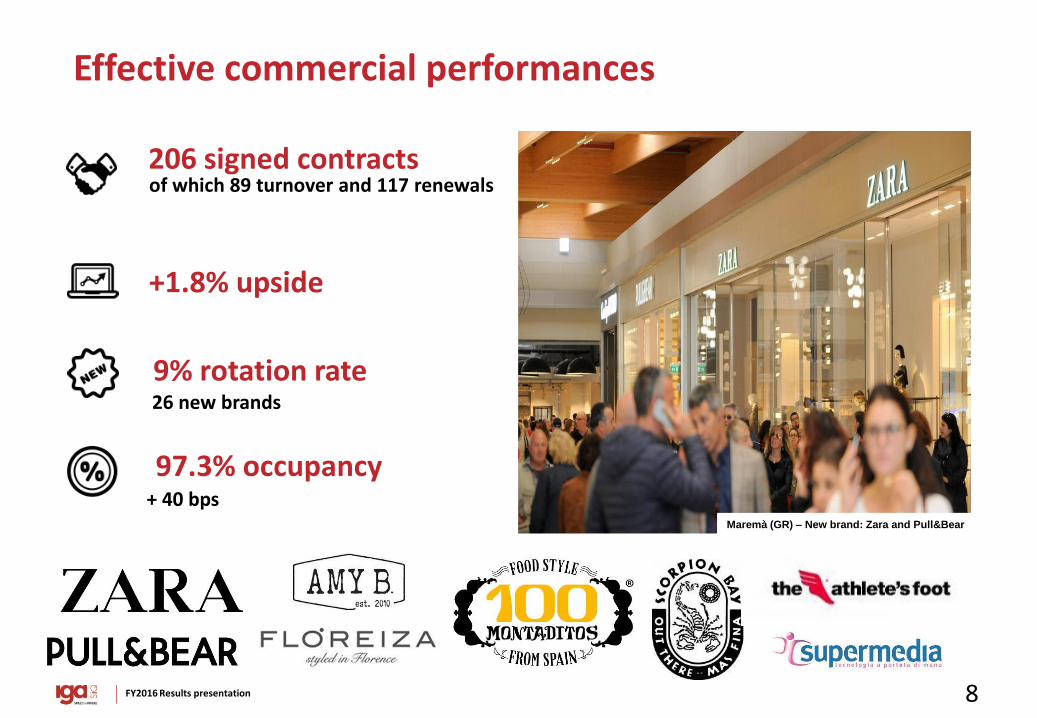
Effective commercial performances
206 signed contracts of which 89 turnover and 117 renewals
+1.8% upside
9% rotation rate 26 new brands
97.3% occupancy + 40 bps
Maremà (GR) – New brand: Zara and Pull&Bear

9 FY2016 Results presentation
Merchandising: physical vs virtual Implementation of the food court’s offer and services
MAREMA’ (Grosseto)
Food court: 1,550 m2 (9% tot. malls) CENTRO SARCA (Milan) Food court: 2,550 m2 (11% tot. malls)

10 FY2016 Results presentation
Merchandising: physical vs virtual Personal care services to enhance visits to the shopping centers and customers loyalty
3 CLINICS
OPENED IN 2016
11 TOTAL
3 NEXT OPENINGS
(2017)
11 FY2016 Results presentation
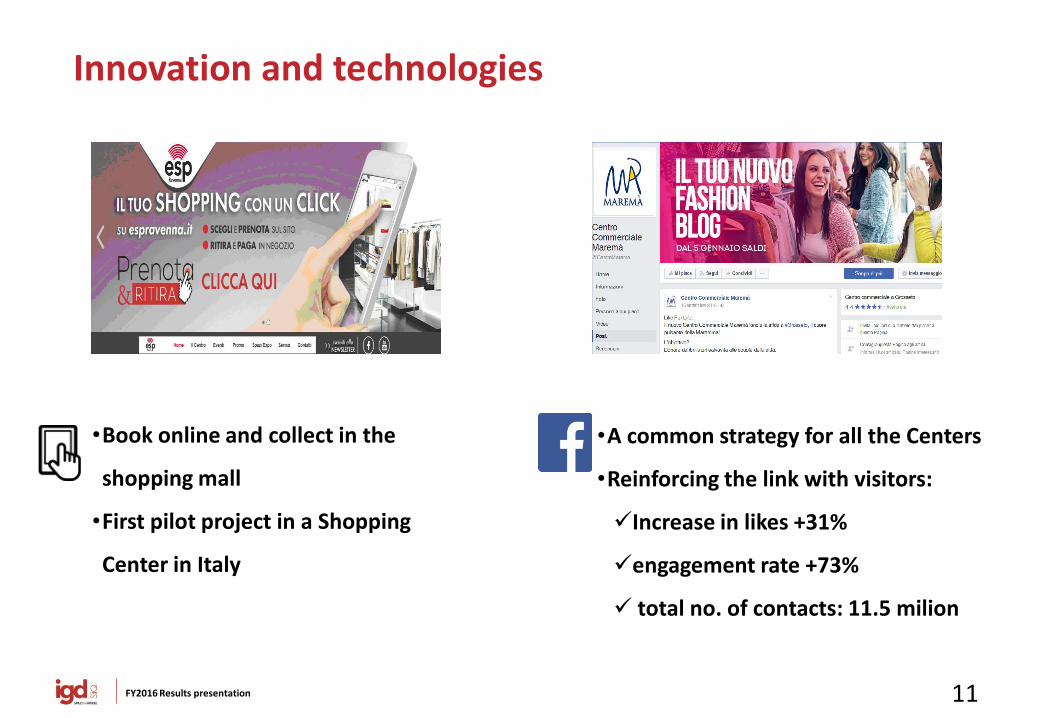
Innovation and technologies
•Book online and collect in the
shopping mall
•First pilot project in a Shopping
Center in Italy
•A common strategy for all the Centers
•Reinforcing the link with visitors:
Increase in likes +31%
engagement rate +73%
total no. of contacts: 11.5 milion
12 FY2016 Results presentation
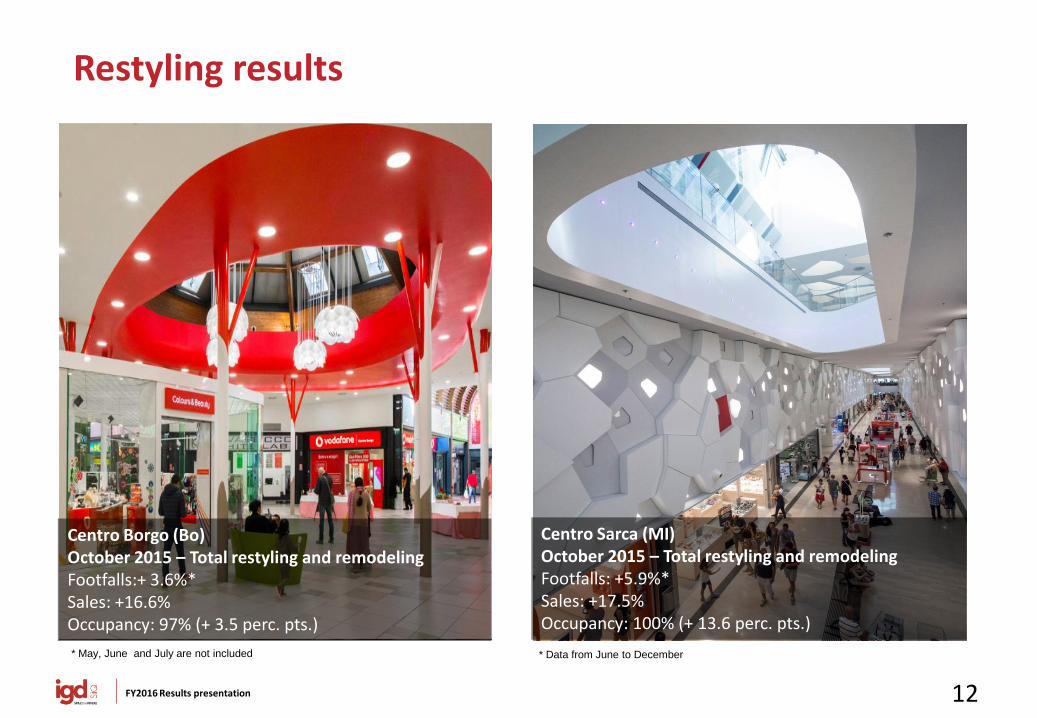
Restyling results
Centro Borgo (Bo) October 2015 – Total restyling and remodeling Footfalls:+ 3.6%* Sales: +16.6% Occupancy: 97% (+ 3.5 perc. pts.)
Centro Sarca (MI) October 2015 – Total restyling and remodeling Footfalls: +5.9%* Sales: +17.5% Occupancy: 100% (+ 13.6 perc. pts.)
* May, June and July are not included * Data from June to December

13 FY2016 Results presentation
Work in progress: Città delle Stelle (Ascoli-Piceno)
2016 – First step (already completed) Remodeling and insertion of an anchor tenant H&M Footfalls: +1.3% Sales: +11%
2017 – Second step Hypermarket reduction and creation of a new court in progress Hyper from 14,400 m2 to 9,350 m2
New mall GLA approx. 4,150 m2 (shops, stands) IGD investments: € 1.4 mn End of work: 2H2017
1
1
1
Area interested by the
intervention
14 FY2016 Results presentation
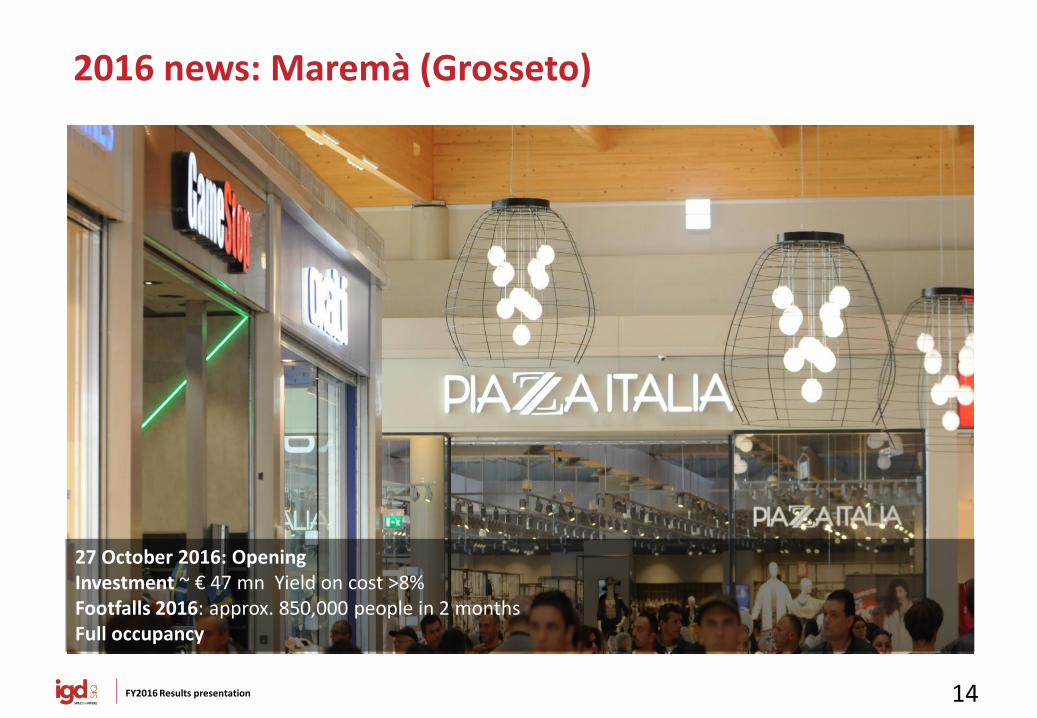
2016 news: Maremà (Grosseto)
27 October 2016: Opening Investment ~ € 47 mn Yield on cost >8% Footfalls 2016: approx. 850,000 people in 2 months Full occupancy
15 FY2016 Results presentation
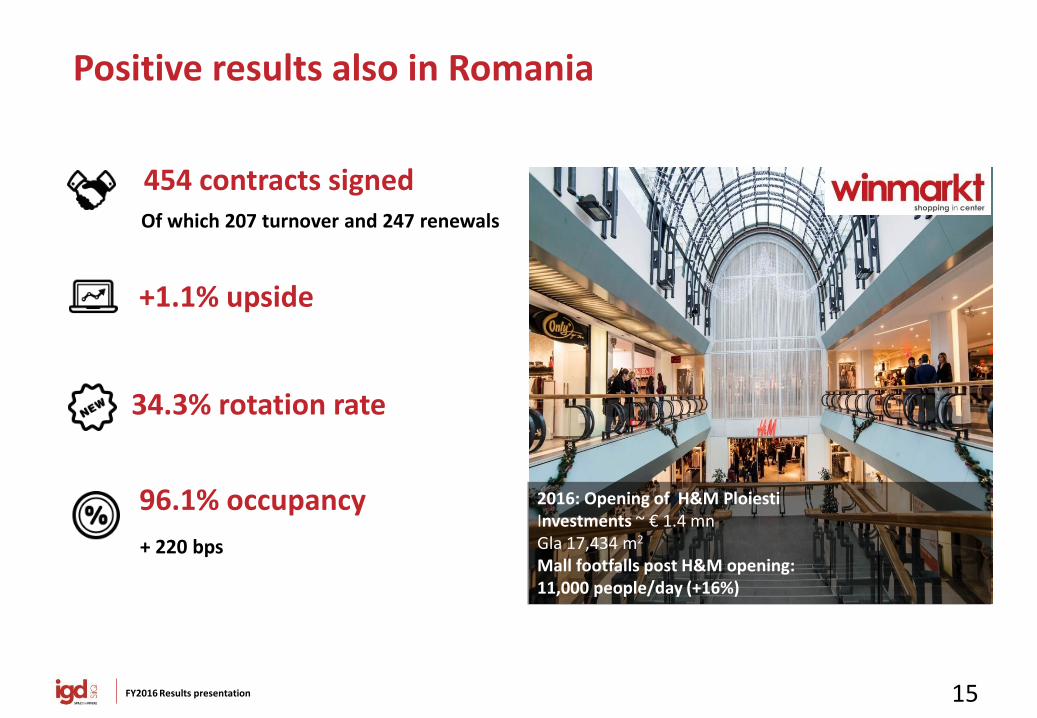
Positive results also in Romania
2016: Opening of H&M Ploiesti Investments ~ € 1.4 mn Gla 17,434 m2 Mall footfalls post H&M opening: 11,000 people/day (+16%)
454 contracts signed Of which 207 turnover and 247 renewals
+1.1% upside
34.3% rotation rate
96.1% occupancy
+ 220 bps

16 FY2016 Results presentation
The results: rental revenues +8.4%
ITALY ROMANIA
Like for like Italy +1.7%: malls (+2.7%) and hypermarkets are stable;
Like for like Romania +3.1%
+1.7% +3.1% +8.4%
121,142
1,905
8,638
-659 269
131,296
Revenues from rental act 2015 L-f-l Italy Acquis/extenstion/restyling Disposals + other L-f-l Romania Revenues from rental act 2016
17 FY2016 Results presentation
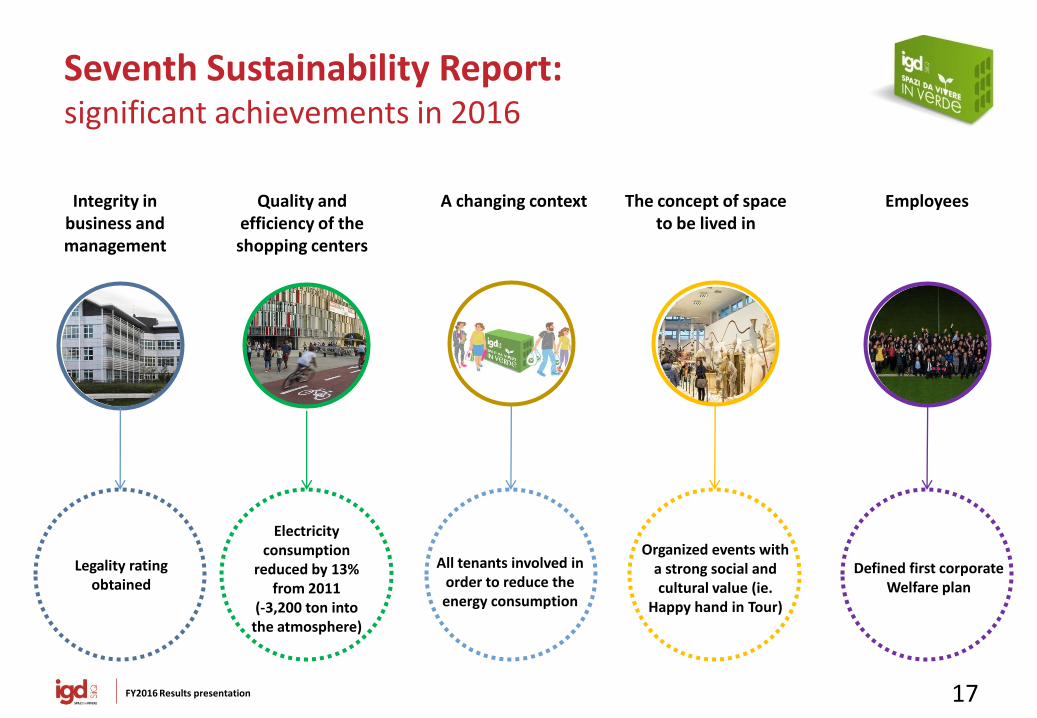
Seventh Sustainability Report: significant achievements in 2016
A changing context The concept of space to be lived in
Employees Integrity in business and management
Legality rating obtained
All tenants involved in order to reduce the energy consumption
Organized events with a strong social and cultural value (ie.
Happy hand in Tour)
Defined first corporate Welfare plan
Quality and efficiency of the shopping centers
Electricity consumption
reduced by 13% from 2011
(-3,200 ton into the atmosphere)

18 FY2016 Results presentation
Seventh Sustainability Report: environmental committment continues…
GH
G I
nte
ns
ity
% C
ert
ifie
d c
en
ters
Starting from 2017, the supply of electricity to all the shopping centers will come from renewable
energy sources
* Green House Gas
24%29%
43%
57%
90%
2013 2014 2015 2016 2017 2018
CERTIFICATION ISO 14001 2016: 57% Italian malls TARGET 2018: 90% Italian malls
GHG INTENSITY* 2016: -5.6% TARGET 2018: progressive reduction
83.03
76.98
73.10 73.27
69.19
2012 2013 2014 2015 2016 2017 2018
19 FY2016 Results presentation
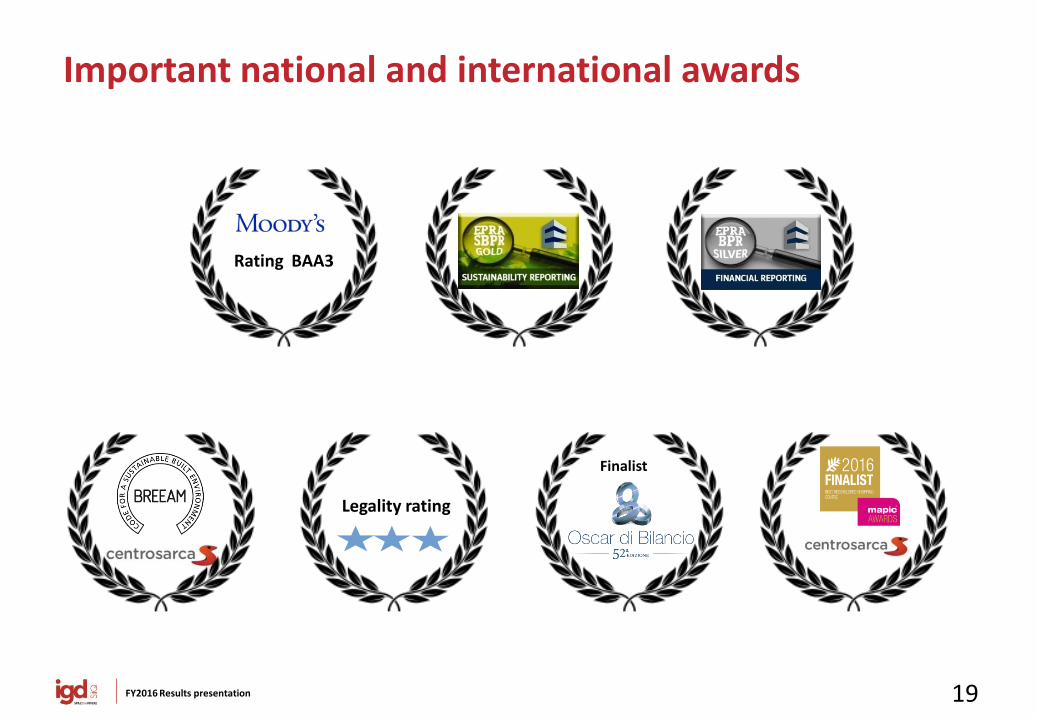
Legality rating
Important national and international awards
Rating BAA3
Finalist
FY 2009 RESULTS
Bologna November 11, 2011
Portfolio

21 FY2016 Results presentation
• Real estate investments in 2016: €9.1 mld (+13% vs 2015)
• Retail investments in 2016: approx. €2.6 mld, +80% vs 2015
• Slight yields compression on good secondary shopping centers.
Retail real estate in Italy: an interesting market…
Retail investment evolution in Italy
Source: CBRE, “Italia Retail Q4 2016”

22 FY2016 Results presentation
…also from the yields point of view
vs
ITALY 5%
*Source: Treasury Minister
SPAIN 4.50%
FRANCE 3.50%
GERMANY 4%
IRELAND 4%
Average net yields prime shopping centers
Significant gap
between Italy and other European countries
**
**Source: CBRE (the data for France is referred to the Ile de France region)
Spread Record >300 bps
Prime shopping centers Vs
BTP 10 years

23 FY2016 Results presentation
Progress continues in Romania
Real estate investment evolution in Romania
Source: CBRE, “Romania Investment, H2 2016”, “Romania Retail, H2 2016”
• Total Real Estate investments: €714 mn (in line with 2015)
• Trend 2017-2018: national and international retailers are moving to medium-size regional cities
• Investments in quality refurbishment or in development activities in medium-size regional cities
• Yields compression

24 FY2016 Results presentation
IGD Portfolio is growing…
€ mn FV 2015 FV 2016 ∆ % ∆ %
Like for Like
Gross Initial
Yield
Malls Italy 1,136.81 1,211.60 + 6.6% + 1.5% 6.23%
Hypermarkets Italy 633.63 646.09 + 2.0% + 2.0% 6.17%
Romania 170.60 164.91 -3.3% -3.3% 6.51%
Porta a Mare + developments + other 140.97 155.17
Total IGD portfolio 2,082.01 2,177.77 + 4.6%
2,082.0
67.3
34.5-5,7 -0,4
2,177.8
Asset value al 31/12/2015 Acquisizioni, Progetti e Capex Italia
Variazione market value Italia
Variazione netta market value Romania
Variazione netta market value Porta Medicea
Asset value al 31/12/2016

25 FY2016 Results presentation
€ p.s. 31-Dec-15 31-Dec-16 D%
EPRA NAV 1.32 1.37 + 3.4%
EPRA NNNAV 1.25 1.29 + 3.2%
…and so is the value created
N. azioni fine 2015 e 2016: 813.045.631
€ 1.25
€ -0,04
€ -0,02
€ 0.07
€ 0.02 € 1.29
EPRA NNNAV 31 Dec 2015
Dividend Delta Fair value debts and other
FFO Assets fair value EPRA NNNAV 31 Dec 2016

26 FY2016 Results presentation
Balanced portfolio from a geographical point of view
• Leader in their catchment area • Present in 11 Italian regions, from North to South, mainly in medium/large size cities
RAVENNA - ESP BOLOGNA – C. Borgo CATANIA - Katanè MILAN – C. Sarca ROME -Tiburtino NEAPLES –Porte di Napoli
NE43%
NW12%
CENTER28%
SOUTH+ISLANDS17%

27 FY2016 Results presentation
Balanced portfolio from a market value point of view
7 Relevant Malls (mkt value >€70mn): Punta di Ferro Centro Sarca Tiburtino Le Porte di Napoli Katanè Conè Esp
• Decrease in hypermarket and Romania • Increase in malls • Relevant and Medium malls equal to 85% of asset class
Medium malls: mkt value >€30mn <€70mn Small malls: mkt value < €30mn
RELEVANT55.1%MEDIUM
30.2%
SMALL14.7%
49.754.6 55.6
30.9 30.4 29.7
0
10
20
30
40
50
60
70
80
2014 2015 2016 > 2017
malls
hyper
ROMANIA7.6%
HYPER/SUPERMAKETS
29.7%
DEVELOPMENT
AND OTHER
7.1%
MALLS
55.6%

28 FY2016 Results presentation
96.2%
97.3%
86.4%
96.1%
Performing and effective portfolio
Occupancy rate always high thanks to the restyling/ extension/remodeling activities
Portfolio that can easily be remodeled/reconverted (ie. Le Porte di Napoli, Città delle Stelle)
Resilience in occupancy
Flexibility and adaptability
No. of full ownership shopping center*:
14
Average mall dimension:
approx 15,000 m2 Average no. of shops:
55
2014 2016
Romania
Average Italy
2015
m²
*Full ownership: hypermarket + shopping mall; represent approx. 55% of Italian mkt value

29 FY2016 Results presentation
Investment pipeline
Seismic improvement works: voluntary action plan to improve the safety of customers and employees
A new mall every year
Attention on sustanability and energy saving
Average yield on cost approx. 7%
2016 2017 2018
Total development projects
Total Capex and other
€ 67 mn ~ € 34 mn ~ € 43 mn
€ 13 mn ~ € 28 mn ~ € 10 mn
Tot. ~ € 145 mn
Tot. ~ € 50 mn
TOT. INVESTMENTS ~ € 195 MN

30 FY2016 Results presentation
Esp extension (Ravenna)
GLA +19,000 m² (+10 medium surfaces and 50 shops) + 1,100 parking places. Preletting: ca 85% End of work: 1H 2017 Total expected investment approx € 53 mn

31 FY2016 Results presentation
Restyling and extension - Gran Rondò (Crema)
New medium surface (+ 2,850 m² of GLA) already rented Total restyling of the outside of the shopping mall End of workl: 1H 2018 Total expected investment approx € 7 mn

32 FY2016 Results presentation
Officine Storiche (Livorno)
Redevelopment of the former Cantieri Navali Orlando, a modern retail concept with personalcare services (fitness, leisure, food court) Preletting: significant interests collected Expected opening: 2H 2018 Total expected investment approx € 52 mn

FY 2009 RESULTS
Bologna November 11, 2011
Conè – Conegliano
Financial Results

34 FY2016 Results presentation
First USPP Bond € 100 mn
2.25% 7 years
“Record” activity with unprecedented results…
• Obtained the rating Baa(3) Outlook Stable* from Moody’s
• The context of low interest rates favored by the ECB has been fully exploited to:
Reduce the average cost of debt
Extend the maturity profile of the medium/long-term debt
• Repayment of the € 135 mn CMBS, cost 5.2%
*outlook confirmed in December 2016
First Public Bond
€ 300 mn 2.5%
5 years
35 FY2016 Results presentation
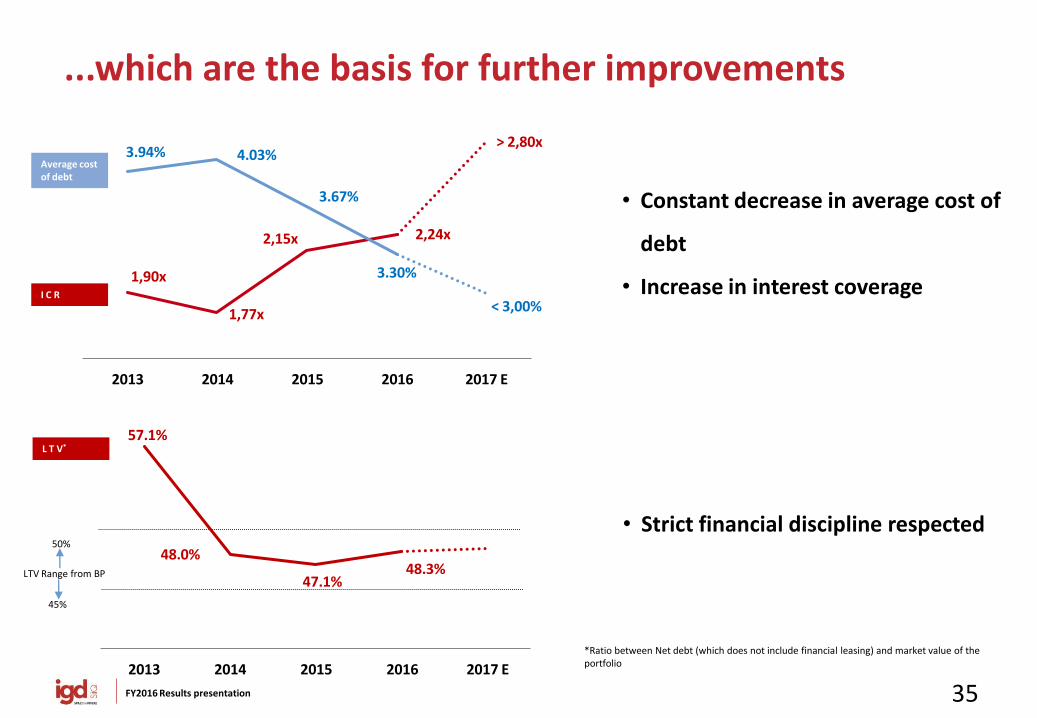
...which are the basis for further improvements
• Constant decrease in average cost of
debt
• Increase in interest coverage
• Strict financial discipline respected
Average cost of debt
I C R
L T V*
50%
45%
LTV Range from BP
1,90x
1,77x
2,15x 2,24x
> 2,80x3.94% 4.03%
3.67%
3.30%
< 3,00%
2013 2014 2015 2016 2017 E
57.1%
48.0%
47.1%48.3%
2013 2014 2015 2016 2017 E
*Ratio between Net debt (which does not include financial leasing) and market value of the portfolio

36 FY2016 Results presentation
S.T. 110,53
L.T. 948,0
Cash -3,1
BANKING SYSTEM34.3%
MARKET65.7%
A balanced debt structure
Net Debt 2016 €1,055.4mn
• Bank financing reduced… and “committed”
• Extended debt maturity profile
* USPP included
* 34 35 36 37 3721 24
5327
528
125
300
162 100
2017 2018 2019 2020 2021 2022 2023 2024 2025 >2025
Bonds Bank debt

37 FY2016 Results presentation
35
4554
New target achieved: FFO € 54 mn
Target announced (+15/16%):
EXCEEDED!!!
• + €10 mn Ebitda increase
• - €1mn financial management (net of liability management) and other
0.066 p. share
0.046 p. share
0.055 p. share
2014 2015 2016
+28.5% +18.9%
€mn

38 FY2016 Results presentation
Group Net Profit: €68.3 MN
NET PROFIT EVOLUTION(€ 000)
45.6
+9,6
+18,4
-3,0 -3,4
+1,0
68.3
Group Net Profit 2015
Change in EBITDA Change in Fair Value and other
Change in financial and extraordinary
management
Change in taxes Change in (profit)/loss related
to Third Parties
Group Net Profit 2016
Change mainly due to deferred taxes
+49.7%

39 FY2016 Results presentation
Proposed dividend*
€ 0.045 per share (+12.5%)
• Dividend Reinvestment Option will NOT be proposed this year
•Dividend yield 6.2% (on both year end and 27th February price equal to approx. €0.72)
• Amount of dividends equal to € 36.6 mn (68% of FFO)
*To the AGM on 12 April 2017
0.04
0.045
2015 2016
40 FY2016 Results presentation
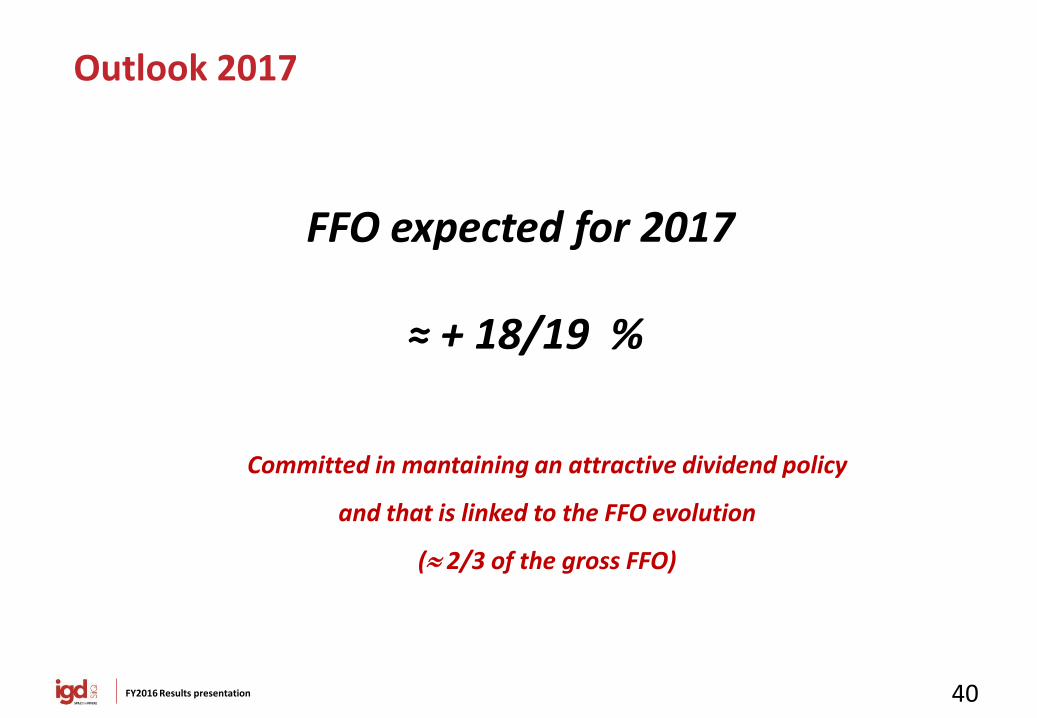
Outlook 2017
Committed in mantaining an attractive dividend policy
and that is linked to the FFO evolution
( 2/3 of the gross FFO)
FFO expected for 2017
≈ + 18/19 %

FY 2009 RESULTS
Bologna November 11, 2011
Centro Sarca – Sesto San Giovanni (MI)
Attachments

42 FY2016 Results presentation
€/000 31/12/2015 31/12/2016 D% 31/12/2015 31/12/2016 D% 31/12/2015 31/12/2016 D%
Revenues from freehold real estate and rental activities 108,865 118,882 9.2% 108,865 118,882 9.2% 0 (0) n.a.
Revenus from leasehold real estate and rental activities 12,277 12,414 1.1% 12,277 12,414 1.1% 0 0 n.a.
Total revenues from real estate and rental activities 121,142 131,296 8.4% 121,142 131,296 8.4% 0 (0) n.a.
Revenues from services 5,085 5,529 8.7% 5,085 5,529 8.7% 0 0 n.a.
Revenues from trading 2,289 1,999 (12.7)% 0 0 n.a. 2,289 1,999 (12.7)%
OPERATING REVENUES 128,516 138,824 8.0% 126,227 136,825 8.4% 2,289 1,999 (12.7)%
COST OF SALE AND OTHER COST (2,181) (2,189) 0.4% 0 0 n.a. (2,181) (2,189) 0.4%
Rent and payable leases (10,068) (10,145) 0.8% (10,068) (10,145) 0.8% 0 0 n.a.
Personnel expenses (3,771) (3,914) 3.8% (3,771) (3,914) 3.8% 0 0 n.a.
Direct costs (17,021) (17,307) 1.7% (16,730) (17,032) 1.8% (291) (275) (5.6)%
DIRECT COSTS (30,860) (31,366) 1.6% (30,569) (31,091) 1.7% (291) (275) (5.6)%
GROSS MARGIN 95,475 105,269 10.3% 95,658 105,734 10.5% (183) (465) n.a.
Headquarter personnel (6,208) (6,473) 4.3% (6,134) (6,402) 4.4% (74) (71) (3.7)%
G&A expenses (4,898) (4,813) (1.7)% (4,512) (4,477) (0.8)% (386) (336) (12.9)%
G&A EXPENSES (11,106) (11,286) 1.6% (10,646) (10,879) 2.2% (460) (407) (11.4)%
EBITDA 84,369 93,983 11.4% 85,012 94,855 11.6% (643) (872) 35.6%
Ebitda Margin 65.6% 67.7% 67.3% 69.3% -28.1% -43.6%
Other provisions (411) (154) (62.5)% (411) (154) (62.5)% 0 0 n.a.
Impairment and Fair Value adjustments 1,538 19,582 n.a. 3,196 26,198 n.a. (1,658) (6,616) n.a.
Depreciation (1,264) (1,119) (11.5)% (1,259) (1,114) n.a. (5) (5) (2.9)%
DEPRECIATION AND IMPAIRMENTS (137) 18,309 n.a. 1,526 24,931 n.a. (1,663) (6,621) n.a.
EBIT 84,232 112,292 33.3% 86,538 119,786 38.4% (2,306) (7,494) n.a.
FINANCIAL MANAGEMENT (39,392) (42,008) 6.6% (39,033) (41,912) 7.4% (359) (96) (73.2)%
EXTRAORDINARY MANAGEMENT 50 (336) n.a. 50 (336) n.a. 0 0 n.a.
PRE-TAX PROFIT 44,890 69,948 55.8% 47,555 77,538 63.1% (2,665) (7,590) n.a.
Taxes 310 (3,044) n.a. 66 (3,152) n.a. 244 108 (55.8)%
NET PROFIT FOR THE PERIOD 45,200 66,904 48.0% 47,620 74,386 56.2% (2,420) (7,482) n.a.
(Profit)/Loss for the period related to Third Parties 439 1,425 n.a. 0 0 n.a. 439 1,425 n.a.
GROUP NET PROFIT 45,639 68,329 49.7% 47,620 74,386 56.2% (1,981) (6,057) n.a.
CORE BUSINESS PORTA A MARE PROJECTCONSOLIDATED
Consolidated Income Statement
Total revenues from rental activities:
€ 131.3 mn
From Shopping Malls: € 89.9 mn of which:
Italian malls €81.0 mn
Winmarkt malls €8.9 mn
From Hypermarkets : €40.0 mn
From City Center Project – P.za Mazzini : €0.6 mn
From Other and Porta a Mare: €0.8 mn

43 FY2016 Results presentation
Margins from activities
Margin from freehold properties: 86.3% increased compared to the previous year
Margin from leasehold properties:
17.5% increased compared to the same period of the previous year (16.3%), mainly thanks to higher revenues and stability of the related costs.
€/000 31/12/2015 31/12/2016 % 31/12/2015 31/12/2016 % 31/12/2015 31/12/2016 %
Margin from freehold properties 93,186 102,999 10.5% 93,186 102,999 10.5% 0 0 n.a.
Margin from leasehold properties 1,999 2,171 8.6% 1,999 2,171 8.6% 0 0 n.a.
Margin from services 473 564 19.2% 473 564 19.3% 0 (0) n.a.
Margin from trading (183) (465) n.a. 0 0 n.a. (183) (465) n.a.
Gross margin 95,475 105,268 10.3% 95,658 105,733 10.5% (183) (465) n.a.
CONSOLIDATED CORE BUSINESS PORTA A MARE PROJECT

44 FY2016 Results presentation
39,39242,008
31/12/2015 31/12/2016
Operating costs and financial management CORE BUSINESS G&A EXPENSES AND DIRECT COSTS (€ 000)
Lower impact of operating cost on Revenues
Ebitda margin core business
is growing (69.3%): +200 bps
Ebitda margin from Freehold: 78.7%
FINANCIAL MANAGEMENT (€ 000)
The cost of debt decrease continues Slight increase in Financial Management due to: - €2.1mn non-recurrent charges of the CMBS early settlement - bond issue (short-term credit lines replaced with long-term debt) - net debt increased by approx. €70mn
Average cost of debt 3.30%
Average cost of debt 3.67%
30,569 31,091
10,646 10,879
31/12/2015 31/12/2016
G&A expenses
Direct costs

45 FY2016 Results presentation
Total consolidated Ebitda: € 94.0 mn Ebitda (core business): €94.9 mn (+11.6%)
TOTAL EBITDA (€ 000)
CORE BUSINESS EBITDA and EBITDA MARGIN (€ 000)
The EBITDA MARGIN from FREEHOLD MANAGEMENT is equal to 78.7%, showing an increase vs previous year.
85,012 94,855
31/12/2015 31/12/2016
67.3%
69.3%
84,369
10,154444 -522 -233 -229
93,983
Ebitda Cons 2015 Change in rental
revenuesChange in
revenues from services
Change in direct
costsChange in G&A
expensesEbitda "Porta a
Mare" projectEbitda Cons 2016

46 FY2016 Results presentation
Funds From Operations
Funds from Operations CONS_2015 CONS_2016 D vs cons 2015 D%
Core business EBITDA 85,011 94,855 9,844 11.6%
Adjusted financial management -38,946 -39,817 -870 2.2%
Adjusetd extraordinary management 218 -125 -343 n.a.
Adjusted current taxes of the period -956 -1,004 -49 5.1%
FFO 45,328 53,910 8,582 18.9%

47 FY2016 Results presentation
NNNAV
D%
€'000 € p.s. €'000 € p.s.
Total number of shares 813,045,631 813,045,631
1) Group shareholders' equity 1,022,053 1.26 1,060,701 1.30 3.8%
Excludes:
Fair Value of financial instruments 34,990 28,748 -17.8%
Deferred taxes 19,917 23,633 18.7%
Goodwill as a results of deferred taxes
2) EPRA NAV 1,076,960 1.32 1,113,083 1.37 3.4%
Includes:
Fair Value of financial instruments (34,990) (28,748) -17.8%
Fair Value of debt (9,560) (15,749) 64.7%
Deferred taxes (19,917) (23,633) 18.7%
3) EPRA NNNAV 1,012,492 1.25 1,044,952 1.29 3.2%
31-Dec-15 31-Dec-16 NNNAV Calculation

48 FY2016 Results presentation
45.6%
25.2%
15.4% 13.8%
23.0% 20.0% 17.0%
40.0%
0%
5%
10%
15%
20%
25%
30%
35%
40%
45%
50%
2017 2018 2019 >2019
no. of contracts rent value
Contracts in Italy and Romania
EXPIRY DATE OF HYPERMARKETS AND MALLS CONTRACTS ITALY (% no. of contracts )
ITALY (total mall contracts 1,192) In 2016, 206 contracts have been signed of which 89 were turnover and 117 renewals. Upside on renewals +1.8%
ROMANIA (total contracts 567) In 2016, 247 contracts were renewed (upside +1.1%) and 207 new contracts were signed. (Renewals and turnover of 2016 represent the 25.7% and 23% of Winmarkt total revenues)
EXPIRY DATE OF HYPERMARKETS AND MALLS CONTRACTS ITALY ( % value)
N 143 N 152
N 22
N 83
N 152
N 275
EXPIRY DATE OF MALL CONTRACTS ROMANIA (no. and % of contracts and % value)
N 239
N 2
N 93
N 658 Average residual maturity
Hyper 7.8 years Malls 4.5 years
Average residual maturity 6.4 years
N 1
12.0% 12.8% 20.1%
55.2%
8.0% 4.0%
88.0%
0%
10%
20%
30%
40%
50%
60%
70%
80%
90%
2017 2018 2019 >2019
Malls Hyper/Supermarkets
10.5% 12.5% 16.2%
60.8%
10.9%6.2%
82.9%
0%
10%
20%
30%
40%
50%
60%
70%
80%
90%
2017 2018 2019 >2019
Malls Hyper/Supermarkets

49 FY2016 Results presentation
MARCHI INTERNAZIONALI
16%
NATIONAL BRANDS69%
LOCAL BRANDS14%
TOP 10 TenantProduct
category
Turnover
impact
No. of
contracts
clothing 3.3% 12
clothing 2.8% 10
Gruppo Miroglio
clothing 2.7% 28
clothing 2.2% 7
eletronics 2.0% 5
shoes 1.9% 6
clothing 1.8% 24
clothing 1.6% 11
clothing 1.5% 4
households
goods1.4% 16
Total 21.1% 123
Tenants Italy
Gruppo Miroglio
CLOTHING53%
HOUSEHOLDS GOODS7%
CULTURE, LEISURE, GIFT ITEMS
7%
ENTERTAINMENT4%
PERSONAL AND HEALTHCARE
4%
ELETRONICS10%
FOOD7%
SERVICES6%
MALLS MERCHANDISING MIX
MALLS TENANT MIX

50 FY2016 Results presentation
INTERNATIONAL BRANDS38%
NATIONAL BRANDS28%
LOCAL BRANDS34%
Tenants Romania
TENANT MIX
MALLS MERCHANDISING MIX TOP 10 Tenant
Product
cateogry
Turnover
impact
No. of
contracts
food 13.7% 9
clothing 6.5% 6
jewelley 5.9% 7
food 5.5% 2
eletronics 4.6% 4
clothing 2.5% 9
grocery 2.3% 5
pharmacy 1.5% 4
Oficiul de Cadastru offices 1.4% 1
shoes 1.1% 9
Total 45.1% 56
SUPERMARKETS 11%
ELETRONICS 7%
CLOTHING 39%ENTERTAINMENT
10%
OTHER 33%

51 FY2016 Results presentation
Breakdown of the portfolio’s appraisals
IGD Group’s real estate portfolio has been appraised by the following companies: Cbre, Reag ,C&W and JLL
33%
34%
20%
13%
CBRE REAG CUSHMAN&WAKEFIELD JLL

52 FY2016 Results presentation
31/12/2015
Financial Highlights 1/2
LOAN TO VALUE adjusted
31/12/2016
GEARING RATIO (D/E)
47.07%
0.93
48.25%
0.97
3.67% 3.30% COST OF DEBT*
2.15X 2.24X INTEREST COVER RATIO
LONG-TERM DEBT AVERAGE RESIDUAL MATURITY (bonds included)
6.3 years 5.5 years
*Net of accessory charges on loan (both recurrent and not)
53 FY2016 Results presentation
31/12/2015
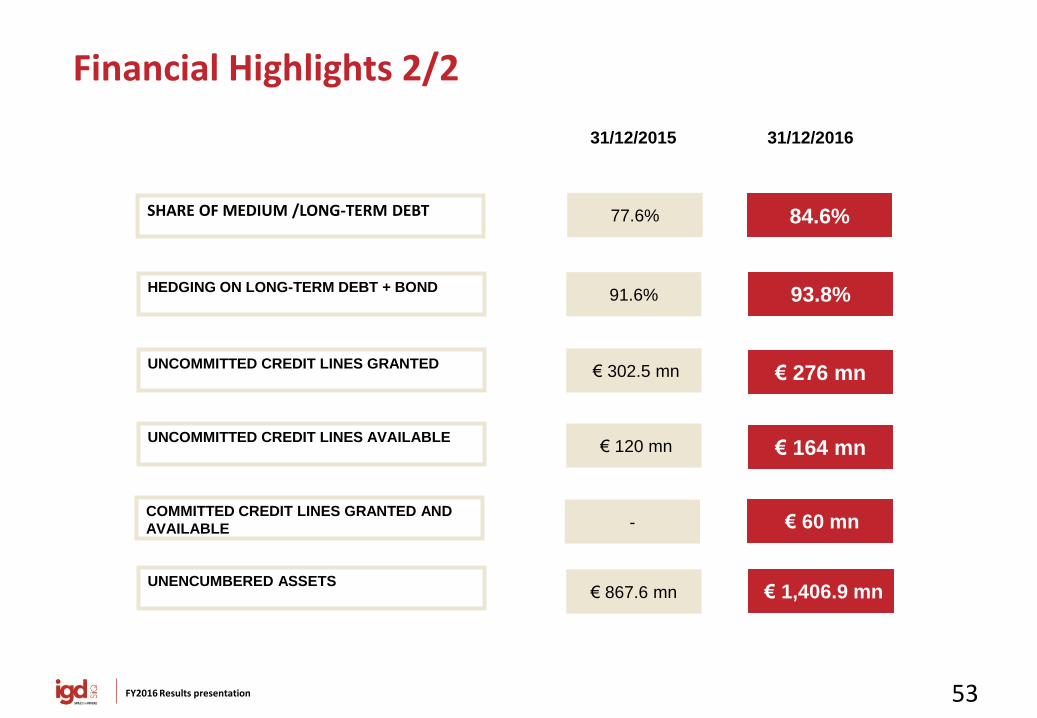
Financial Highlights 2/2
31/12/2016
HEDGING ON LONG-TERM DEBT + BOND 93.8%
€ 302.5 mn € 276 mn UNCOMMITTED CREDIT LINES GRANTED
€ 120 mn € 164 mn UNCOMMITTED CREDIT LINES AVAILABLE
€ 867.6 mn € 1,406.9 mn UNENCUMBERED ASSETS
91.6%
SHARE OF MEDIUM /LONG-TERM DEBT 77.6% 84.6%
- € 60 mn COMMITTED CREDIT LINES GRANTED AND
AVAILABLE

54 FY2016 Results presentation
Net Debt
NET DEBT EVOLUTION (€ 000)
984,815
-68.329
4,581 -1.050
104,305
31,106
1,055,428
Net Debt 31/12/2015 Profit for the period attributable to the Parent
Company
Change in NWC Change in other non-current assets/liabilities and
derivatives
Change in fixed/non-fixed assets
Change in shareholders' equity
Net Debt 31/12/2016

55 FY2016 Results presentation
984,815 1,055,428
1,057,3311,091,463
31/12/2015 31/12/2016
Adjusted shareholders equity
Net Debt
0,93
0,97
Re-classified Balance Sheet
Sources - Uses of funds 31/12/2015 31/12/2016 D D%
Fixed assets 1,970,028 2,050,728 80,700 4.1%
Assets under construction 50,533 75,004 24,471 48.4%
Other non-current assets 31,091 25,543 -5,548 -17.8%
Other non-current liabilities -33,194 -32,150 1,044 -3.1%
NWC 51,797 56,378 4,581 8.8%
Net deferred tax (assets)/liabilities -18,247 -21,901 -3,654 20.0%
TOTAL USE OF FUNDS 2,052,008 2,153,602 101,594 5.0%
Net debt 984,815 1,055,428 70,613 7.2%
Shareholders' equity 1,032,203 1,069,426 37,223 3.6%
Net (assets)/liabilities for derivative instruments 34,990 28,748 -6,242 -17.8%
TOTAL SOURCES 2,052,008 2,153,602 101,594 5.0%
GEARING RATIO (€ 000)
Claudia Contarini, IR
T. +39. 051 509213
Federica Pivetti, IR Team
T. +39. 051 509260
to @igdSIIQ
Elisa Zanicheli, IR Team
T. +39. 051 509242