


Idiomas
Páginas
Jurídico


arX
iv:n
ucl-
ex/0
1120
10v1
19
Dec
200
1
Mass and charge identification of fragments detected
with the Chimera Silicon-CsI(Tl) telescopes
N. Le Neindre(a), M. Alderighi(b), A. Anzalone(c), R. Barna(d),
M. Bartolucci(e), I. Berceanu(f), B. Borderie(g), R. Bougault(h), M. Bruno(a),
G. Cardella(i), S. Cavallaro(c), M. D’Agostino(a), R. Dayras(j),
E .De Filippo(i), D. De Pasquale(d), E. Geraci(c), F. Giustolisi(c),
A. Grzeszczuk(l), P. Guazzoni(e), D. Guinet(m), M. Iacono-Manno(c),
A. Italiano(d), S. Kowalski(l), A. Lanchais(a), G. Lanzano’(i),
G. Lanzalone(i,g), S. Li(n), S. Lo Nigro(i), C. Maiolino(c), G. Manfredi(e),
D. Moisa(f), A. Pagano(i), M. Papa(i), T. Paduszynski(l), M. Petrovici(f),
E. Piasecki(o), S. Pirrone(i), G. Politi(i), A. Pop(f), F. Porto(c),
M. F. Rivet(g), E. Rosato(k), S. Russo(e), S. Sambataro(i,+), G. Sechi(b),
V. Simion(f), M. L. Sperduto(c), J. C. Steckmeyer(h), C. Sutera(i),
A. Trifiro(d), L. Tassan-Got(g), M. Trimarchi(d), G. Vannini(a),
M. Vigilante(k), J. Wilczynski(p), H. Wu(n), Z. Xiao(n), L. Zetta(e),
W. Zipper(l)
(a) INFN and Dipartimento di Fisica Universita di Bologna, Italy,
(b) Istituto Fisica Cosmica, CNR and INFN Milano, Italy,
(c) Laboratorio Nazionale del Sud INFN and Dipartimento di Fisica Universita di
Catania,
(d) INFN and Dipartimento di Fisica Universita di Messina,
(e) INFN and Dipartimento di Fisica Universita degli Studi, Milano, Italy,
(f) Institute for Physics and Nuclear Engineering, Bucharest, Romania,
(g) IPN, IN2P3-CNRS and Universite Paris-Sud, Orsay, France
(h) LPC,ISMRA and Universite de Caen, France
(i) INFN and Dipartimento di Fisica Universita di Catania,
1

(j) DAPNIA/SPhN - CEA Saclay, Gif sur Yvette Cedex, France
(k) INFN and Dipartimento di Fisica Universita di Napoli, Napoli, Italy,
(l) Institute of Physics, University of Silesia, Katowice, Poland,
(m) IPN, IN2P3-CNRS and Universite Claude Bernard, Lyon, France,
(n) Institute of Modern Physics Lanzhou, China,
(o) Institute of Experimental Physics, University of Warsaw, Poland,
(p) Institute for Nuclear Studies, Otwock-Swierk, Poland
(+) Deceased
Abstract
Mass and charge identification of charged products detected with
Silicon-CsI(Tl) telescopes of the Chimera apparatus is presented. An
identification function, based on the Bethe-Bloch formula, is used to
fit empirical correlation between ∆E and E ADC readings, in order
to determine, event by event, the atomic and mass numbers of the
detected charged reaction products prior to energy calibration.
Key words: Radiation detectors, Scintillation detectors, Solid-state
detectors, Computer data analysis.
PACS: 29.40.-n, 29.40.Mc, 29.40.Wk, 29.85.+c
1 Introduction
In the last years several new detectors for charged particle identification,
with large solid angle coverage and high geometrical efficiency, have been
built in order to investigate heavy ions reactions at intermediate energies
(10A MeV-∼ 1A GeV) [1, 2].
These experimental devices give possibilities for simultaneous measure-
ment of quantities related to energy, emission angle, atomic number and mass
number of nearly all the charged reaction products. A very rich information
can be extracted from these experimental studies, in particular if the mass
resolution of the apparatus is high. Indeed, isotope yields have proven to
be useful observable for studying the heavy-ion reaction mechanisms at in-
termediate and high energies [3]. Production yields of isotopically resolved
2

nuclear particles and fragments can provide answers to the question of mu-
tual stopping and subsequent equilibration of the collision partners. On the
condition that equilibrium is reached, they allow to extract the correspond-
ing thermodynamical variables, such as the temperature of the hot pieces of
nuclear matter formed in the collision, their density and possibly the entropy.
The necessary step before the data analysis is the calibration of the mea-
sured signals. However, due to the fact that different detectors (ionization
chambers, microstrips, semiconductors, scintillators) can be used, due to the
rich variety of nuclear species produced in the reaction in a wide energy range
and to the large number of telescopes covering the laboratory solid angle, this
preliminary step is quite man-power and time consuming.
Another difficulty is that not necessarily all the detectors of a multi-
modular ∆E−E telescope have response linear in energy. The last-generation
4π devices [1, 2] are multi modular ∆E −E telescope systems, in which the
residual-energy detectors are usually made of the CsI(Tl) scintillator. This
choice is dictated by its relatively high stopping power, no limitation in geo-
metrical shapes, negligible radiation damage, low cost, and good resolution.
Since the light output of a scintillator depends both on the energy deposited
in the cristal and on the atomic and mass numbers of the incident ion, the
identification in mass and charge has to be done prior to energy calibra-
tion [4].
For the charge identification, semi-automatic [5] and automatic [6] tech-
niques have been set in recent years, but no recent literature [7] is available for
the mass identification, usually performed through graphical cuts [8] around
each A-line in the ∆E −E scatter plot. This method, however, has the dis-
advantage that the number of contour lines that can be drawn is limited by
the statistics and extrapolation to rare isotopes cannot be performed. Part
of the physical information for isotopes populated with low statistics is then
lost. In addition, measurements with neutron rich/poor beams and targets
could lead to not negligible shifts of the mass distributions with respect to
stable isotopes, making difficult the A-labeling of the graphical cuts.
A fast and reliable method to assign the mass and charge of the detected
ions is therefore highly desirable.
In this paper we present a very effective mass and charge identification
procedure which, as compared with other methods, considerably saves time
3
without loss of precision. The accuracy of the proposed method is checked by
comparing the mass distributions obtained with this procedure with original
mass distributions in model-generated samples.
We present here the application of our identification procedure to data
collected in the first experiments performed by the Reverse collaboration
with the forward part of the Chimera apparatus [9]. Mass and charge distri-
butions obtained through more usual methods, like graphical cuts or particle
identification functions, are compared with those obtained from our proce-
dure.
2 Mass and charge particle identification
function
We recall here the main principles leading to the used identification function.
A more detailed description of the successive modifications of the Bethe-
Bloch formula, to take care of the experimental distortions, can be found
in [10].
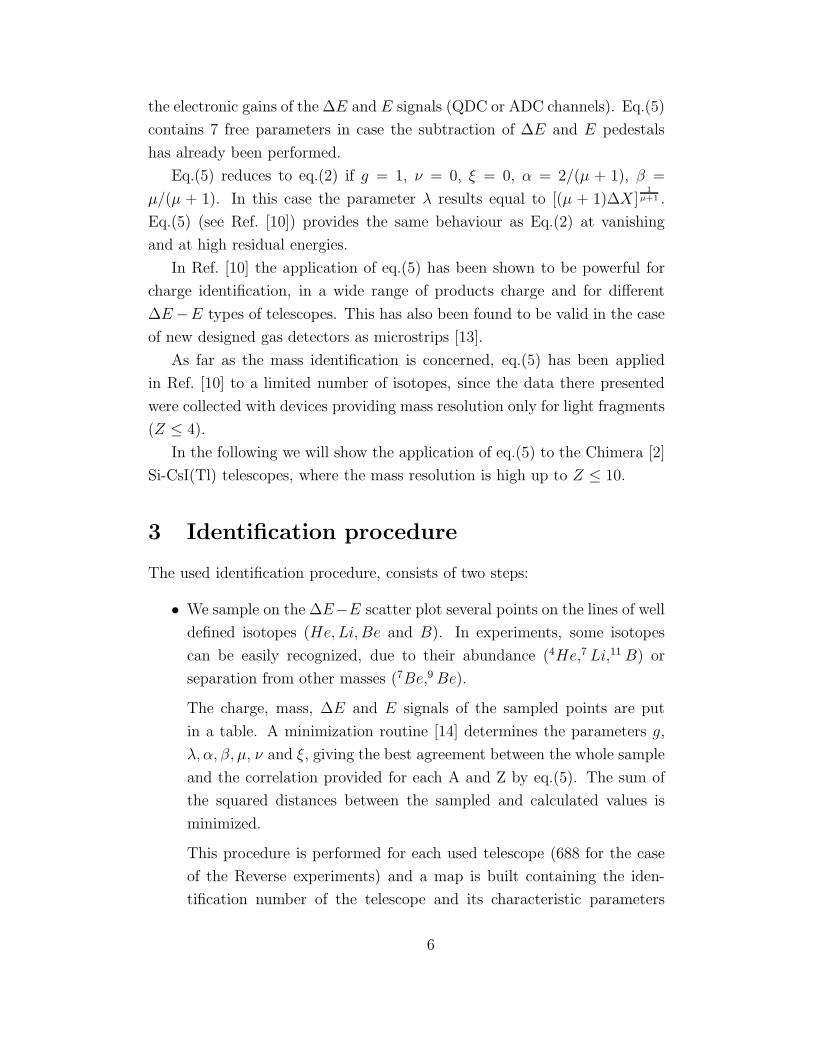
Specific energy loss (dEdx) of a charged particle in matter depends , as
described by the classical Bethe-Bloch formula [11], on the mass A, charge
Z and energy E of the incident ion and of the density and atomic number
of the absorbing medium. For light ions with incident energy high enough
to approximate the effective charge by the charge Z of the ion, the specific
energy loss is:dE
dX=
Z2
f(E/A)(1)
Analytical reductions [10] of this expression lead to:
∆E =[
Eµ+1 + (µ+ 1)Z2Aµ∆X]
1µ+1
−E (2)
in the case of particles detected in a ∆E −E telescope. ∆X is the thickness
of the first detector, where the ion deposits an energy ∆E. In the second
detector the ion is stopped and releases an energy E. To obtain eq.(2) from
eq.(1) the hypothesis that f(E/A) is a power-law
f(E/A) = (E/A)µ (3)
with exponent µ ≈ 1 has been made [12].
4

Eq.(2) is the basic formula to build particle identification functions (p.i.f.)
for charge identification. For instance, if we aim to identify the charge Z
of a detected particle/fragment from the measured ∆E,E signals, we can
calculate a not calibrated measure of Z (p.i.f.), which includes some unknown
constants (like for instance the thickness of the ∆E detector and the exact
relationship between the mass and the charge):
p.i.f. =[
(∆E + E)µ+1− Eµ+1
]1
(µ+2) (4)
with the assumption A = 2 Z.
However, it is experimentally well known that it is quite difficult, by
managing the only parameter µ, to find a unique p.i.f. able to linearize the
∆E − E correlation of each used telescope, in the whole range of residual
energies and for a wide range of charges, as usually observed in heavy ion
reactions.
Modifications to eq.(2) are therefore needed, since data deviate from the
expected behaviour for several reasons:
• when the residual energy becomes low, the atomic charge is no longer
equal to Z, especially for heavier elements;
• in experiments where the ion is stopped in a scintillator, the residual
energy signal is not linear with the released energy. For a scintillator
indeed, the light output response depends also on A and Z [4];
• when ∆E is measured with a Silicon detector, the pulse height defect
influences the Silicon detector response for high Z-values.
To evaluate mass and charge, before energy calibration, an extension of
eq.(2), taking into account all the aforementioned problems has been pro-
posed in Ref. [10]. This formula performs a decoupling of the ∆E − E
correlation at low, intermediate and high energies, by introducing some free
parameters and a phenomenological term, which takes care for the transition
from low to high energies.
∆E =[
(gE)µ+ν+1 +(
λZαAβ)µ+ν+1
+ ξZ2Aµ(gE)ν]
1µ+ν+1
− gE (5)
where λ, µ, α, β, ν and ξ are free parameters, related to the characteristics
and non-linear effects of the ∆E and E detectors. g accounts for the ratio of
5
the electronic gains of the ∆E and E signals (QDC or ADC channels). Eq.(5)
contains 7 free parameters in case the subtraction of ∆E and E pedestals
has already been performed.
Eq.(5) reduces to eq.(2) if g = 1, ν = 0, ξ = 0, α = 2/(µ + 1), β =
µ/(µ + 1). In this case the parameter λ results equal to [(µ + 1)∆X ]1
µ+1 .
Eq.(5) (see Ref. [10]) provides the same behaviour as Eq.(2) at vanishing
and at high residual energies.
In Ref. [10] the application of eq.(5) has been shown to be powerful for
charge identification, in a wide range of products charge and for different
∆E−E types of telescopes. This has also been found to be valid in the case
of new designed gas detectors as microstrips [13].
As far as the mass identification is concerned, eq.(5) has been applied
in Ref. [10] to a limited number of isotopes, since the data there presented
were collected with devices providing mass resolution only for light fragments
(Z ≤ 4).
In the following we will show the application of eq.(5) to the Chimera [2]
Si-CsI(Tl) telescopes, where the mass resolution is high up to Z ≤ 10.
3 Identification procedure
The used identification procedure, consists of two steps:
• We sample on the ∆E−E scatter plot several points on the lines of well
defined isotopes (He, Li, Be and B). In experiments, some isotopes
can be easily recognized, due to their abundance (4He,7 Li,11 B) or
separation from other masses (7Be,9Be).
The charge, mass, ∆E and E signals of the sampled points are put
in a table. A minimization routine [14] determines the parameters g,
λ, α, β, µ, ν and ξ, giving the best agreement between the whole sample
and the correlation provided for each A and Z by eq.(5). The sum of
the squared distances between the sampled and calculated values is
minimized.
This procedure is performed for each used telescope (688 for the case
of the Reverse experiments) and a map is built containing the iden-
tification number of the telescope and its characteristic parameters
6
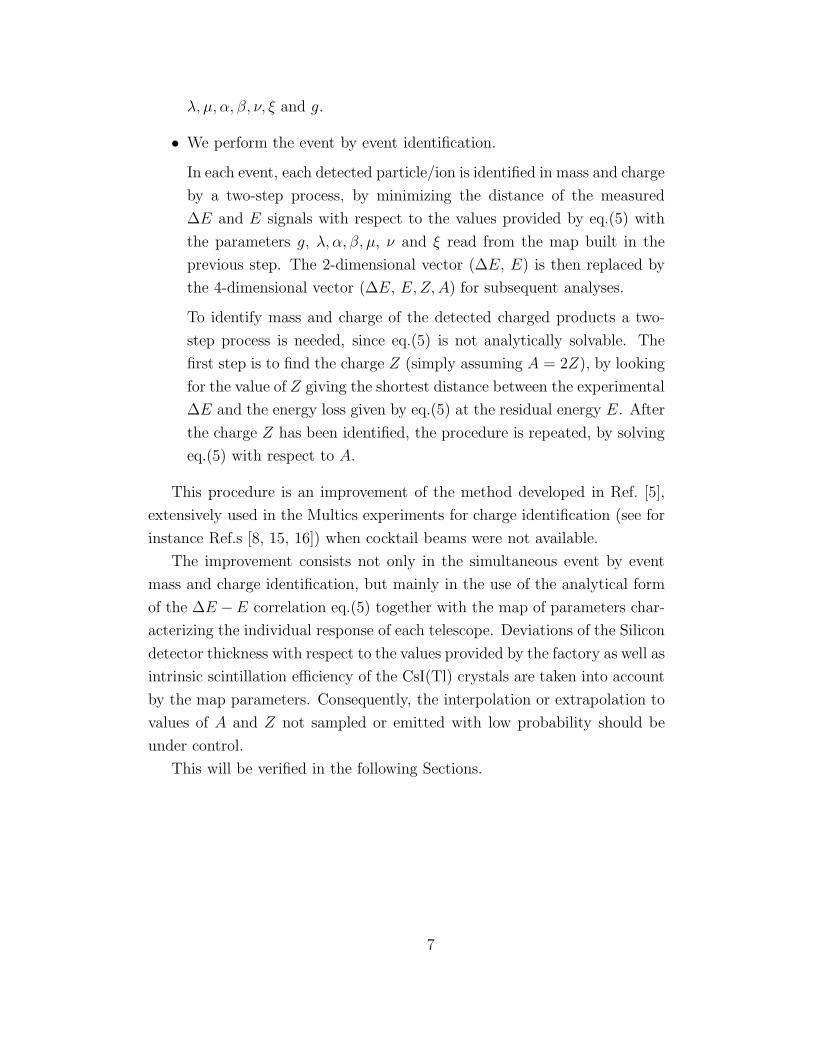
λ, µ, α, β, ν, ξ and g.
• We perform the event by event identification.
In each event, each detected particle/ion is identified in mass and charge
by a two-step process, by minimizing the distance of the measured
∆E and E signals with respect to the values provided by eq.(5) with
the parameters g, λ, α, β, µ, ν and ξ read from the map built in the
previous step. The 2-dimensional vector (∆E, E) is then replaced by
the 4-dimensional vector (∆E, E,Z,A) for subsequent analyses.
To identify mass and charge of the detected charged products a two-
step process is needed, since eq.(5) is not analytically solvable. The
first step is to find the charge Z (simply assuming A = 2Z), by looking
for the value of Z giving the shortest distance between the experimental
∆E and the energy loss given by eq.(5) at the residual energy E. After
the charge Z has been identified, the procedure is repeated, by solving
eq.(5) with respect to A.
This procedure is an improvement of the method developed in Ref. [5],
extensively used in the Multics experiments for charge identification (see for
instance Ref.s [8, 15, 16]) when cocktail beams were not available.
The improvement consists not only in the simultaneous event by event
mass and charge identification, but mainly in the use of the analytical form
of the ∆E −E correlation eq.(5) together with the map of parameters char-
acterizing the individual response of each telescope. Deviations of the Silicon
detector thickness with respect to the values provided by the factory as well as
intrinsic scintillation efficiency of the CsI(Tl) crystals are taken into account
by the map parameters. Consequently, the interpolation or extrapolation to
values of A and Z not sampled or emitted with low probability should be
under control.
This will be verified in the following Sections.
7

4 Check of the procedure through model
events
As an example of the identification procedure, we first show the application
of our method to a set of ideal events, where not only the signals ∆E and
E are known, but also the mass number A and the charge number Z. The
comparison between the original values of (Z, A) and the reconstructed ones
allows to evaluate the capability and the limits of the procedure.
The ideal events used to check the identification function (5) are gen-
erated by the statistical multifragmentation model SMM [17]. This model
reproduces in great detail static and dynamic experimental observables, like
charge, mass and kinetic energy distributions [8, 15, 18]. We analyze here
events of the decay of a Au source, with excitation energy in the range
1− 8 AMeV and density one third of the normal density [16].
For each event, from the mass number, charge number and kinetic energy
of the charged decay products we compute their ∆E (energy loss in a 280
µm Silicon detector) and the residual energy E.
In Fig. 1 we show the ∆E−E plots for Z = 2, Z = 3 and Z ≥ 4 (panels a,
b, and c), respectively). The stars in Fig. 1 represent the sampled points, used
to calculate the parameters of eq.(5). From the 7 parameters fit of the sample
(165 points, step 16 MeV in the residual energy), we obtain a description of
the ∆E − E correlation under study, characterized by an average distance
between the sampled points and the values calculated through eq.(5) of ≈
0.1 MeV .
Since we are dealing with energies, the ratio of the gains g results ≈ 1.
The parameter ν results nearly zero and α and β satisfy the relationships
α = 2/(µ+ 1), and β = µ/(µ+ 1), as expected for an ideal detector.
We compare now the original mass distribution of the model, for iso-
topes not used for the fit, with the one calibrated through our identification
procedure. We want indeed to estimate how far we can extrapolate above
the highest charge contained in the sample (Z = 6), still having a reliable
reproduction of the A-distributions.
In Fig. 2 we compare the A-distributions for charges not included in the
fit: Z = 1 and Z = 8 − 12. Histograms are the original yields of the model,
symbols are values obtained from eq.(5). For Z = 1, Z = 8 and Z = 9
8
the calculated yields are in perfect agreement with the model. For Z ≥ 10
discrepancies appear between original and reconstructed mass yields. For
instance for Z = 10, A = 20 and for Z = 12, A = 26 the deviation is about
15%.
As far as the charge identification is concerned, over the whole set of
considered charged products (1 ≤ Z ≤ 12), eq.(5) has been found to fail
in the charge determination (by one charge unit) with a probability smaller
than 3 10−5. We have also found that, when interpolating between sampled
∆E − E lines, the calculated mass yields are in perfect agreement with the
model ones.
The results shown in Figures 1 and 2 have been obtained for an ideal
telescope, with perfect resolution. Now we consider the modifications induced
by finite energy resolution. We perform this check in the case of an energy
resolution 2% for the ∆E detector and 4% for the stopping detector (much
worse than those observed for the Chimera detectors). The chosen values of
the resolutions still allow to resolve the isotope lines.
By repeating the analysis shown in Figure 2, we have found the same
results as before for charge determination and mass interpolation. As far
as mass identification for charges above the highest charge contained in the
sample, the agreement between true and calculated mass yields slightly wors-
ens with respect to the case of a ”perfect” detector. Indeed for Z = 9
(A = 20) calculated values differ by 4% with respect to the original ones, for
Z = 10, A = 20 and for Z = 12, A = 26 the deviation is about 25%.
These results establish the confidence level for mass identification of
charges not included in the sampled set. We conclude that the proposed
procedure is suitable to reliably extrapolate masses up to 3 charges above
the highest charge contained in the sample, even when considering ∆E − E
correlations spread by the detector resolution.
5 Experimental results
In this Section we show the results of the identification procedure applied
to experimental data. The data have been collected, for the reactions124Sn+64Ni, 112Sn+58Ni and 124Sn+27Al at 35 A MeV incident energy, in
experiments performed at the Superconducting Cyclotron of LNS (Catania)
9

by the Reverse collaboration [19]. The forward part (θlab ≤ 30o) of Chimera
array was used for the experiments. In this configuration, 688 telescopes
made of ∆E Silicon detectors 200-300 µm thick (depending on θlab) and CsI
(Tl) stopping detectors were used.
The energy signal of the silicon detector was obtained by a standard
spectroscopic line, made by a fast low noise charge sensitive preamplifier
(PAC), followed by a main spectroscopic amplifier (∼ 0.75 µs shaping time).
The light output of the crystal was collected by a 20 × 20mm2 photo-
diode coupled with a low noise 45 mV/MeV PAC. The PAC output signal
was shaped by a spectroscopic amplifier (2µs shaping time) and the shaped
signal was stretched in order to avoid any time jitter in the digital conversion
performed by a 64 channels VME single gate QDC.
The energy resolutions of the silicon detectors and the CsI(Tl) crystals
were quoted by measuring the elastic scattering of different ion beams, deliv-
ered by the Tandem and the Cyclotron accelerators of the LNS in Catania,
impinging on a thin (∼ 100µg/cm2) Au target. The typical energy resolu-
tion of a Chimera telescope resulted < 1% for the Silicon detector and about
2% for the CsI(Tl). As an example, with beams of 58Ni at 15.5 A MeV the
energy resolution (FWHM) was 0.5% for the Silicon detector and 1.5% for
the crystal, using the lowest value of the gain (g=1 Volt/Volt) of the main
amplifier. The energy resolution of silicon detectors was also measured by
collecting α-particles of a standard three peaks radioactive source. Typical
energy resolutions were ∼ 70 keV with g= 8 Volt/Volt and ∼ 200 keV with
g= 2 Volt/Volt. In order to reduce possible distortions of the electric field,
the polarization bias of the Silicon detectors was increased by 30% with re-
spect to the nominal one. As a global result, in 95% of the ∆E−E matrices
a good identification of the atomic number (up to a charge Z = 50 for the
most forward angle), was obtained in the full dynamical range of the exper-
iment (see Fig.6). Finally, in the high gain conversion range of the QDC [2],
corresponding to a dynamical range of about 120 MeV with a PAC sensitivity
of 4.5 mV/MeV and g=2 Volt/Volt, a good identification of isotopes from
charge Z=3 up charge Z=8 was clearly achieved (see Fig. 3).
10

5.1 Mass identification
We start the analysis, by sampling a set of (∆E,E) points (see Fig. 3). The
isotopes chosen to build the sample set are 4He,7 Li,7 Be,11B,13 C.
As a second step we fit the data (122 points) with eq.(5), with 9 free
parameters (both ∆E and E are QDC channels, the pedestals have not been
subtracted).
The resulting total χ2 = 1d.o.f.
∑ (∆E−∆Ecalc)2
errors2is 2.3 (d.o.f. stands here for
the degrees of freedom, number of the sampled points minus the number of
free parameters). The errors on the experimental sampled points (channels)
have been estimated to be about 10 channels, by sampling several times the
same ∆E−E experimental matrix. All the sampled isotopes give comparable
partial contributions to the total χ2.
Finally, the event by event identification was performed. The resulting
isotopic distribution for individual charges from Z = 3 to Z = 8 is shown
in Fig. 4. In the same figure is also reported the mass spectrum, obtained
for charges from 3 to 10 (from 6Li to 23Ne respectively). The quality of
the mass identification obtained from our procedure is remarkable. Indeed,
the peak over noise ratio of the mass distribution, even when integrated over
eight charges, remains similar to the one obtained by looking at separated
charges.
We have checked the accuracy of our procedure, by comparing the yields
obtained from eq.(5) with those obtained with graphical cuts performed on
the A-lines, in the regions where these lines are clearly distinguishable. From
Table I it is evident that all the mass yields are in agreement within the
statistical uncertainties. In addition the yields obtained from eq.(5) resulted
in very good agreement with gaussian integrals of the isotope distribution of
Fig. 4.
We want here to remark another advantage of our identification procedure
with respect to graphical cuts.
The a priori A-labeling of the observed ∆E −E correlations (see Fig. 3)
in the region of heavy (Z > 4) isotopes could be disputable, in absence of
reference beams sent on the detectors and/or before energy calibration and
comparisons to energy-loss calculation. Indeed, noticeable shifts of the mass
distributions with respect to stable isotopes are expected [20] in experiments
running with neutron rich/poor beams and targets (as in the case of Reverse
11

experiments).
In the case of the adopted procedure quantitative reliability tests can be
performed by checking the partial contribution of the sampled isotopes to
the total χ2. For instance, if the fit of the sampled points (shown in Fig. 3)
is performed, by assuming the mass of the sampled Z = 6 isotope as A = 12
(instead of 13), the corresponding partial contribution rises to a value about
25 (instead of ∼ 2).
As an example of the rich variety of isotopes produced in reactions with
neutron rich/poor projectile and targets, we compare in Fig. 5 the mass dis-
tributions measured for the reactions 124Sn+64Ni and 112Sn+58Ni at 35 A
MeV (respectively N/Z=1.41, 1.18). The isospin of the entrance channel re-
flects on large shifts of the mass distributions. Neutron rich systems enhance
the production of neutron rich isotopes, as expected from theoretical calcu-
lations [20], mainly in the even charge isotopes. Study of heavy ion reaction
mechanisms are therefore feasible, to provide information on thermodynami-
cal variables of equilibrated hot sources formed in the collision, such as their
temperature and density.
5.2 Charge identification
As another example of the identification method we show in the following
the application of our procedure to identify the charge of fragments collected
by a forward detector (θlab = 1o) of the Chimera array.
Also in this case we sample a set of (∆E,E) points. We build a set of
sampled points for 2 ≤ Z ≤ 9, Z = 15, 20, 30, 40 and 50, and we fit this sam-
ple with eq.(5). We obtain a set of parameters, associated to the examined
detector, reproducing the sampled points with a χ2 = 1d.o.f.
∑ (∆E−∆Ecalc)2
errors2
equal to 0.45. All the observed ∆E − E Z-lines are well reproduced up to
the whole Z=50 line (see Fig. 6).
In Fig. 7 we compare the corresponding charge distribution with the one
obtained by a particle identification function (eq.(4)) (upper insert panel of
Fig. 6). The overall agreement is very good. Some disagreement between the
two distributions is present for low values of atomic numbers, which suffer
of poor statistics and at very high values of the charge number, for which
the determination of the charge through the p.i.f results less precise than at
intermediate Z-values. Indeed the peak over noise ratio ranges from a value
12

larger than 5 (up to charges ≃ 30) to ∼ 4 at Z=50. As a consequence, the
contamination among adjacent charges goes from 2% to about 4%.
6 Conclusions
We have presented a semi-automatic Z and A identification procedure, tested
through the analysis of model events with known distributions. A very good
agreement was obtained.
The experimental results have been verified by comparing the obtained A
and Z distributions with those resulting from standard methods (graphical
cuts or particle identification functions). The results of these comparison
resulted quite satisfactory, and the uncertainties on the charge and mass
identification are clearly improved.
The advantages of the procedure may therefore be summarized as follows:
• Beams of known mass, charge and energy are not needed for the charge
and mass identification of charged products, detected with ∆E − E
telescopes with good energy resolution.
• If mass is not resolved, Z-identification is still possible by substituting
in eq.(5) A with 2Z or with other parameterizations commonly used in
experiments [21, 22].
• The accuracy of the mass identification is very high, at least comparable
in precision with the graphical cuts in ∆E − E matrices, but clearly
more powerful because our procedure saves a lot of time, especially in
experiments involving many telescopes.
• The use of a map of identification parameters, taking into account
the response of each telescope, makes possible the extrapolation to A-
regions where graphical cuts are not easy to make, due to low statistics.
• Possible drifts of the electronic circuits can be diagnosed by controlling
the constancy of the parameters of the map during the sequence of runs
throughout the whole experiment.
• The method ensures relatively fast, standardized and reliable mass and
charge identification for multi-telescope systems.
13

7 Acknowledgements
The authors wish to thank R. Bassini, C. Boiano, C. Cali’, V. Campagna,
R. Cavaletti, O. Conti, M. D’Andrea, F. Fichera, N. Giudice, A. Grimaldi,
N. Guardone, S. Hong, P. Litrico, G. Marchetta, S. Marino, D. Nicotra,
G. Peirong, C. Rapicavoli, G. Rizza, G. Sacca’, S. Salomone, S. Urso, for
the technical support during the experiment. The authors are also grateful
to L. Calabretta and D. Rifuggiato for the assistance in delivering beams of
very good timing quality.
This work was supported in part by the Italian Ministry of University and
Scientific Research under grants Cofin99 and by NATO grants PST/CLG
976861.
References
[1] see for instance:
U. Lynen et al. Gesellschaft fur Schwerionenforschung Report n. GSI-
02-89;
R. T. de Souza et al. Nucl. Instr. and Meth. A295 (1990) 109;
I. Iori et al. Nucl. Instr. and Meth. A325 (1993) 458;
J. Pouthas et al. Nucl. Instr. and Meth. A357 (1995) 418.
[2] S. Aiello et al. Nucl. Phys. A583 (1995) 461; Nucl. Instr. and Meth.
A369 (1996) 50; Nucl. Instr. and Meth. A400 (1997) 469; IEEE Trans.
On Nucl. Sci. 47, no. 2, (2000) 114.
[3] J. Pochodzalla and W. Trautmann, nucl-ex/0009016, and Isospin
Physics in Heavy-Ion Collisions at Intermediate Energies Eds. Bao-An
Li and W. U. Schroder, Nova Science Publisher, N.Y. (2001) 451.
[4] P. F. Mastinu, P. M. Milazzo, M. Bruno, M. D’Agostino, L. Manduci,
Nucl. Instr. and Meth. A338 (1994) 419 and Erratum: Nucl. Instr. and
Meth. A343 (1994) 663.
[5] P. F. Mastinu, P. M. Milazzo, M. Bruno, M. D’Agostino Nucl. Instr.
and Meth. A371 (1996) 510.
14
[6] M. Alderighi et al. Comp. Phys. Communications 140 (2001) 13,
M. Alderighi et al. IEEE Trans. Nucl. Sci. 48 (2001) 385.
[7] T.Shimoda et al. Nucl. Instr. and Meth. A165 (1979) 261.
[8] P. M. Milazzo et al. Phys. Rev.C 58 (1998) 953.
[9] A. Pagano et al. Physics with the Chimera detector al LNS in Catania:
The REVERSE experiment - 3-rd Int. Relativistic Ion Studies CRIS
2000, May 2000, Nucl.Phys.A 681 (2001) 331c.
[10] L. Tassan-Got, arXiv:nucl-ex/0103004, submitted to Elsevier Science.
[11] H. A. Bethe Ann. Physik 5 (1930) 325.
[12] F. S. Goulding and B. G. Harvey Ann. Rev. Nucl. Sci. 25 (1975) 167.
[13] F. Gramegna et al. Nucl.Instr. and Meth. A 389 (1997) 474.
[14] MINUIT D506 routine from the CERN Program Library.
[15] M. D’Agostino et al., Phys. Lett. B371 (1996) 175.
[16] M. D’Agostino et al., Nucl. Phys. A650 (1999) 329.
[17] J. Bondorf, A. S. Botvina, A. S. Iljinov, I. N. Mishustin and K. Sneppen,
Phys. Rep. 257 (1995) 133.
[18] R. Bougault, et al., XXXV International Winter Meeting on Nuclear
Physics, Bormio, February 1997, ed. by I. Iori, Ric. Sc. and E. P. 110
(1997).
[19] E. Geraci et al. - REVERSE Experiments at Laboratori Nazionali del
Sud, Proceedings of Bologna 2000 - Structure of the Nucleus at the Dawn
of the Century - Bologna May 29 -June 3, 2000 in Nucleus - Nucleus
Collisions ed. G. Bonsignori, M. Bruno, A. Ventura, D. Vretenar - W.
Sci. (2000) p. 409,
G. Politi et al. - REVERSE: the First Experiment with the Chimera
Detector - Proceedings of Bologna 2000 - Structure of the Nucleus at
the Dawn of the Century - Bologna May 29 - June 3, 2000 in Nucleus -
Nucleus Collisions ed. G. Bonsignori, M. Bruno, A. Ventura, D. Vretenar
- W. Sci. (2000) p. 413.
15

[20] M. Di Toro et al., Nucl.Phys.A 681 (2001) 426c.
[21] R. J. Charity et al. Phys. Rev. Lett. 56 (1986) 1354
[22] K. Summerer, W. Bruuchle, D. J. Morrissey, M. Schadel, B. Szweryn
and Yang Weifan, Phys. Rev. C 42 (1990) 2546.
16

Table 1: Comparison of the isotope yields obtained from graphical cuts and
from eq.(5)
Isotope Graphical Cuts Eq.(5)6Li 864 8657Li 1950 19488Li 547 5207Be 264 2449Be 1114 108010Be 1173 110910B 350 35411B 1673 160012B 494 51912C 745 70713C 860 85814C 616 579
17

Figure 1: Model events: ∆E − E plots (colors from yellow to black follow a
logarithmic scale) for ions passing through a 280µm Silicon detectors. Stars
at Z = 2, A = 4 (panel a)), Z = 3, A = 7 (panel b)), Z = 4, A = 7,
Z = 5, A = 11 and Z = 6, A = 12 (panel c)) are the sampled points used for
the fitting procedure.
Figure 2: Model events: Isotopic distributions obtained from the extrapo-
lation of eq.(5) to isotopes not used in the fit. Lines represent the model
A-distributions, full symbols the values calculated from eq.(5).
Figure 3: Experimental ∆E−E scatter plot for a Chimera telescope at θlab =
21o. Red symbols are the sampled points used in the fitting procedure: 4He
(open squares), 7Li (open circles), 7Be (full squares), 11B (stars), 13C (full
points).
18
Figure 4: Experimental isotopic distributions obtained for charges 3−8. The
bottom histogram represents the mass distribution for charges 3− 10.
Figure 5: Experimental isotopic distributions obtained for charges 3−8. The
grey histogram refers to the reaction 124Sn+64Ni and the hatched one to the
reaction 112Sn+58Ni. The histograms have been normalized to the total area
for each charge.
Figure 6: Experimental ∆E−E scatter plot for a Chimera telescope at θlab =
1o. Lines show the values calculated from eq.(5). The insert panel shows the
charge identification obtained with the p.i.f. method (see text).
Figure 7: Experimental charge distribution for the ∆E − E matrix of Fig.5.
Symbols show the values calculated from eq.(5). Lines show the yields calcu-
lated through a particle identification function (see text).
19

This figure "fig1_id.jpg" is available in "jpg" format from:
http://arxiv.org/ps/nucl-ex/0112010v1
This figure "fig2_id.jpg" is available in "jpg" format from:
http://arxiv.org/ps/nucl-ex/0112010v1

This figure "fig3_id.jpg" is available in "jpg" format from:
http://arxiv.org/ps/nucl-ex/0112010v1
This figure "fig4_id.jpg" is available in "jpg" format from:
http://arxiv.org/ps/nucl-ex/0112010v1

This figure "fig5_id.jpg" is available in "jpg" format from:
http://arxiv.org/ps/nucl-ex/0112010v1

This figure "fig6_id.jpg" is available in "jpg" format from:
http://arxiv.org/ps/nucl-ex/0112010v1

This figure "fig7_id.jpg" is available in "jpg" format from:
http://arxiv.org/ps/nucl-ex/0112010v1
Top Related